Article

Evaluation of Competitiveness and Sustainable Development Prospects of French-Speaking African Countries Based on TOPSIS and Adaptive LASSO Algorithms

1
School of Geography and Planning, Nanning Normal University, Nanning 530001, China
2
Key Laboratory of Environment Change and Resources Use in Beibu Gulf, Ministry of Education, Nanning Normal University, Nanning 530001, China
3
Institute of Population Research, Nanjing University of Posts and Telecommunications, Nanjing 210023, China
4
College of Engineering, City University of Hong Kong, Hong Kong 999077, China
*
Authors to whom correspondence should be addressed.
These authors contributed equally to this work.
Algorithms 2025, 18(8), 474; https://doi.org/10.3390/a18080474
Submission received: 17 June 2025 / Revised: 13 July 2025 / Accepted: 24 July 2025 / Published: 30 July 2025
(This article belongs to the Special Issue Hybrid Intelligent Algorithms (2nd Edition))

Abstract

This study evaluates the competitiveness and sustainable development prospects of French-speaking African countries by constructing a comprehensive framework integrating the TOPSIS method and adaptive LASSO algorithm. Using multivariate data from sources such as the World Bank, 30 indicators covering core, basic, and auxiliary competitiveness were selected to quantitatively analyze the competitiveness of 26 French-speaking African countries. Results show that their comprehensive competitiveness exhibits spatial patterns of “high in the north and south, low in the east and west” and “high in coastal areas, low in inland areas”. Algeria, Morocco, and six other countries demonstrate high competitiveness, while Central African countries generally show low competitiveness. The adaptive LASSO algorithm identifies three key influencing factors, including the proportion of R&D expenditure to GDP, high-tech exports, and total reserves, as well as five secondary key factors, including the number of patent applications and total number of domestic listed companies, revealing that scientific and technological investment, financial strength, and innovation transformation capabilities are core constraints. Based on these findings, sustainable development strategies are proposed, such as strengthening scientific and technological research and development and innovation transformation, optimizing financial reserves and capital markets, and promoting China–Africa collaborative cooperation, providing decision-making references for competitiveness improvement and regional cooperation of French-speaking African countries under the background of the “Belt and Road Initiative”.

1. Introduction

In the context of global economic integration and the rapid development of digital technology, national competitiveness has become a core indicator for measuring a country’s economic health, development potential, and global status. It not only affects a country’s economic growth rate and quality but also directly affects its position in the international division of labor, its ability to attract foreign direct investment, and the improvement in people’s living standards [1]. At present, competition among countries is becoming increasingly fierce. This competition is no longer limited to traditional factor endowments or industrial scale but is more reflected in innovation capabilities, institutional efficiency, infrastructure level, human capital quality, and data-driven decision-making capabilities.
The African continent, as an important emerging force in global economic growth, is undergoing a profound transformation. Among them, the French-speaking African countries constitute an important group in the African development landscape due to their unique historical, cultural, and linguistic ties and close links in regional economic organizations such as the West African Economic and Monetary Union (UEMOA) and the Central African Economic and Monetary Community (CEMAC). Most of these countries face similar challenges, such as weak infrastructure, a single industrial structure, a need to improve governance, an inadequate demographic dividend, and high sensitivity to external shocks [2,3]. However, they also have great development potential, such as rich natural resources, a young and growing population, an increasingly active regional market, and a strong demand for digital transformation [4].
The foundational work of the theory of national competitiveness can be traced back to Michael E. Porter’s theory of “national competitive advantage”, which emphasizes the role of industrial clusters, factor conditions, demand conditions, related and supporting industries, and corporate strategy, structure, and competition in enhancing national competitiveness [5]. On this basis, a variety of frameworks and indices for assessing national competitiveness have emerged around the world.
The Global Competitiveness Index (GCI) of the World Economic Forum (WEF) is one of the most influential. The GCI measures an economy’s long-term productivity growth potential by assessing 12 pillars [6]. Another important assessment is the World Competitiveness Yearbook of the International Institute for Management Development (IMD), which assesses the competitiveness of countries in four aspects: economic performance, government efficiency, business efficiency, and infrastructure based on statistical data and executive questionnaires [7]. These traditional frameworks provide valuable benchmark comparisons and policy recommendations for countries, but the data sources tend to focus on official statistics and expert surveys, which may have time lags, subjectivity, and data missing problems; at the same time, the indicator system is relatively fixed, making it difficult to dynamically capture the impact of emerging economic models and technological changes; in addition, the linear weighted summation method may not fully reflect the complex nonlinear relationships and interactions between dimensions.
In recent years, some studies have begun to examine the impact of the digital economy and global value chains on national competitiveness. For example, Stankovic, J explored how digital infrastructure and digital skills shape national competitiveness and believed that the digital divide may exacerbate the competitiveness gap between developing and developed countries [8]. Angelidis, G, et al. used network analysis methods to study the impact of national embeddedness in the global value chain on competitiveness, pointing out that under the complex and changing global trade pattern, the position and resilience of the country in the value chain have become increasingly important [9]. These studies show that traditional competitiveness models need to be updated to adapt to the new characteristics of the digital age and the deepening development of globalization.
For a long time, the assessment of national competitiveness has mainly relied on traditional frameworks such as the World Economic Forum (WEF) Global Competitiveness Index (GCI) and the International Institute for Management Development (IMD) World Competitiveness Yearbook [10,11]. These frameworks evaluate by integrating a series of macroeconomic indicators, institutional efficiency, infrastructure, health, education, market size, labor market efficiency, financial market development, technological readiness, business maturity, and innovation capabilities. Although these traditional methods provide valuable macro perspectives, their limitations are increasingly prominent in the face of the rapidly changing global economic landscape, complex data ecosystems, and nuances in specific regions. For example, traditional indicators may not fully capture the vitality of the informal economy, the bias caused by data scarcity, and the impact of complex nonlinear relationships. In addition, their evaluation cycle is relatively long, and it is difficult to provide real-time and dynamic insights [12].
In recent years, with the rapid development of big data, artificial intelligence, and computing power, the application of algorithms in economics and development research has exploded. This provides new possibilities for overcoming the limitations of traditional economic evaluation methods. Machine learning has been widely used in economic forecasting, risk assessment, and complex pattern recognition. For example, Varian, HR discussed the application potential of big data and machine learning in economic research, arguing that these technologies can help economists extract valuable information from large amounts of data [13]. In terms of national competitiveness assessment, some studies have begun to try to use machine learning to construct composite indexes or prediction models. Bacon, D., et al. used machine learning methods to predict national innovation capabilities, and the results showed that these models can provide more accurate predictions and deeper insights than traditional regression methods [14]. Borrajo-Millán, F, et al. used deep learning technology to evaluate a country’s competitiveness in a specific industry by analyzing news text and social media data [15].
Network analysis has shown great potential in studying inter-country trade, technology diffusion, and knowledge flows. By constructing inter-country trade networks, technology cooperation networks, or FDI networks, we can reveal the centrality, connectivity, and vulnerability of a country in the international economic system, thereby indirectly reflecting its competitiveness. For example, the Economic Complexity Index (ECI) proposed by Hidalgo, CA, and Hausmann, R measures the production knowledge and economic competitiveness of a country based on the complexity of its export product network [16]. Teza, G., et al. used international trade networks to analyze the resilience and vulnerability of the global economy, providing a new perspective for understanding the competitiveness of a country in the face of external shocks [17].
In addition, technologies such as natural language processing (NLP) and computer vision have also begun to be applied to economic analysis. For example, by analyzing policy texts, company reports, or social media sentiment through NLP, the effectiveness of policies or market confidence can be evaluated [18]. Computer vision technology combined with satellite image data can be used to evaluate the progress of infrastructure construction, urbanization level, or poverty situation, especially in areas with scarce data [19]. These algorithm applications provide more sophisticated, dynamic, and comprehensive data sources and analysis methods for national competitiveness evaluation, helping to make up for the shortcomings of traditional methods.
In the era of big data and artificial intelligence, the application of algorithm technology in the fields of economics, sociology, and policy analysis has become increasingly in-depth, bringing revolutionary opportunities for national competitiveness evaluation. Advanced algorithms such as machine learning, deep learning, network analysis, and natural language processing can process massive, multi-source, and heterogeneous data; mine complex patterns and nonlinear relationships that are difficult to discover with traditional statistical methods; and build more predictive and adaptive evaluation models [20].
Regarding national competitiveness, relatively few studies have focused on the African continent, and they often face unique data and methodological challenges. Most studies focus on the overall growth of the African economy, trade patterns, foreign direct investment (FDI) attractiveness, governance levels, and regional integration processes. For example, Fosu, AK conducted an in-depth analysis of the drivers of economic growth in Africa, emphasizing the importance of institutional quality and human capital in improving the competitiveness of African countries [21]. Ofori, I. K explored the role of information and communication technology (ICT) in promoting inclusive development and competitiveness in African countries, pointing out that digital inclusion is crucial to narrowing the development gap [22]. However, competitiveness research on French-speaking African countries is even scarcer and is often limited to macroeconomic analysis or case studies of specific sectors. For example, some studies have focused on the impact of trade integration within the West African Economic and Monetary Union (UEMOA) on the economic performance of its member countries [23]. Other studies may focus on the effect of improved business environments in specific African countries on their attraction of FDI [24]. These studies provide important regional and country insights, but they generally face the following challenges: (1) data availability and quality issues: many French-speaking African countries have incomplete or untimely official statistics that make it difficult to support detailed analysis [25]; (2) traditional indicators fail to fully capture the huge size of the informal economy and its complex impact on competitiveness; (3) the diversity of countries in the region makes the application of a common framework challenging.
Based on the above literature review, first, the global national competitiveness research has formed a relatively mature theoretical framework and evaluation system (such as WEF and IMD), but these traditional methods have limitations in data sources, timeliness, and nonlinear relationship capture; especially when facing the complexity of specific regions such as Africa, their applicability may be limited. Second, although the competitiveness research on African countries has increased, it generally faces challenges in data quality and availability and lacks a systematic and in-depth competitiveness evaluation of the specific group of French-speaking African countries. Existing research mostly stays in the analysis of macroeconomic indicators and fails to make full use of emerging data and algorithmic technologies to reveal its unique competitiveness drivers and development potential. Finally, the application of algorithmic technology in the field of economics and development research has shown great potential, from predictive models to network analysis to the use of non-traditional data sources; it has brought revolutionary changes to economic evaluation. However, it is still a significant research gap to systematically and specifically apply these advanced algorithmic technologies to the national competitiveness evaluation of French-speaking African countries and build a comprehensive, data-driven evaluation framework. Existing research rarely deeply integrates the special background of French-speaking African countries with advanced algorithmic models to build a competitiveness evaluation system that can overcome the limitations of traditional methods. For example, how to effectively integrate multi-source heterogeneous data, how to design an indicator system suitable for the characteristics of French-speaking African countries, and how to use algorithms such as machine learning and network analysis to capture the nonlinear, dynamic, and structural characteristics in the evolution of these countries’ competitiveness are all issues that urgently need to be explored in depth.
In view of this, this study specifically aims to (1) construct a data-driven competitiveness evaluation framework for 26 French-speaking African countries by integrating TOPSIS and adaptive LASSO, addressing the limitations of traditional methods in handling sparse data and multicollinearity; (2) quantify their competitiveness levels using 30 indicators across three dimensions (core, basic, and auxiliary competitiveness); and (3) identify key drivers of competitiveness and propose targeted sustainable development strategies, thereby providing actionable insights for China–Africa cooperation under the Belt and Road Initiative. The specific framework of this study is as follows: 1. Construct an evaluation system containing 30 indicators, covering the three dimensions of core competitiveness, basic competitiveness, and auxiliary competitiveness; 2. Use the TOPSIS method to quantitatively evaluate the competitiveness of 26 African French-speaking countries and reveal the spatial distribution pattern of national competitiveness; 3. With the help of the adaptive LASSO algorithm, screen key influencing factors, identify the mechanism of action of various indicators on competitiveness, and find key indicators that affect competitiveness; 4. Combine the spatial pattern with the results of factor identification to analyze the formation mechanism of competitiveness differences in different regions; 5. Based on key and sub-key factors, propose a coordinated intervention strategy for sustainable development and provide decision-making reference for China–Africa cooperation under the background of the “Belt and Road Initiative”.

2. Materials and Methods

2.1. Overview of Study Area

Africa is the continent with the largest number of French speakers in the world [26]. Under the influence of the colonial rule of France and Belgium in Africa, there are still more than 115 million people in Africa today who use French and various French dialects [27]. There are 26 countries in Africa that use French as the official language or common language, of which 3 are located in North Africa, 4 are located in East Africa, 8 are located in West Africa, 7 are located in Central Africa, and 3 are located in South Africa [28]. Their combined land area accounts for 59.25% of Africa’s total area. The vast land, large population, and rich natural resources give African French-speaking countries huge development potential and will gradually become the “new engine” of world economic development, but there are still many thorny issues that need to be solved. At present, the economic development levels of various countries are uneven, and with the changes in the world economic structure, the gap in economic levels between countries is still widening. In terms of people’s living standards, the data of Equatorial Guinea, the country with the highest per capita GDP, is more than 100 times that of Burundi, the country with the lowest per capita GDP. The huge difference in living standards is a great hidden danger to the social security of various countries; in terms of infrastructure construction, the transportation and energy infrastructure construction of most countries has stagnated or even shrunk, which is much slower than the global average; high-quality educational resources are scarce in various countries, and the university enrollment rate of more than 80% of countries is lower than 10% all year round. Educational resources are seriously out of touch with economic development and far from meeting actual needs; affected by factors such as France’s long-term colonial rule, most countries have a heavy debt burden, and more than half of the countries use the CFA franc as the common currency, and the exchange rate is linked to the euro. Most countries cannot guarantee financial independence, making the economic development of various countries always subject to others and difficult. Therefore, factors such as unbalanced economic development, stagnant infrastructure, and unfair resource allocation have seriously restricted the further development of French-speaking African countries and the further improvement in national competitiveness.

2.2. Data Sources

The data comes from the World Bank Open Database (World Bank Open Data, 2024) [29], with some reference to the International Statistical Yearbook (International Statistical Yearbook, 2024) [30,31] and the CIA World Factbook (CIA World fact book, 2024). Among them, the economic data are based on the 2020 international exchange rate. With reference to the African Statistical Yearbook and the International Organisation of La Francophonie’s official organization (Welcome to the International Organisation of La Francophonie’s official organization, 2018) [32], the 21 countries in Africa with French as the official language and the 5 countries with French as the common language are defined as African French-speaking countries, and the statistics are summarized according to the region where each country is located (North Africa, East Africa, Central Africa, West Africa, or South Africa).

2.3. Using the TOPSIS Method to Evaluate the Competitiveness of French-Speaking African Countries

The TOPSIS method is a multi-index evaluation and decision-making method, first proposed by CL Hwang and K Yoon in 1981. It is also known as the superiority–inferiority distance method. It is mainly used to evaluate the relative superiority of existing objects [33]. In recent years, it has been widely used in the comprehensive benefit evaluation of land use [34], comparative evaluation of tourism resources [35], comparative evaluation of urban economy [36], and other studies. However, few domestic and foreign scholars have touched on the quantitative evaluation of the competitiveness of cross-regional countries from a political and geographical perspective. This study chose the TOPSIS method based on its unique adaptability to the characteristics of African French-speaking countries and research objectives, which is specifically reflected in the three dimensions of data applicability, methodological characteristics, and regional research applicability.
First, in terms of data applicability, African French-speaking countries face prominent challenges such as incomplete statistical data and severe heterogeneity. The TOPSIS method shows strong robustness to some data gaps: its core logic is to calculate the relative distance between the evaluation object and the “ideal/negative ideal solution” [33], and the normalization process can effectively weaken the impact of missing values within a certain range. In contrast, modern multi-criteria decision models (MCDMs) such as SPOTIS and ESP-COMET have stricter requirements on data integrity—SPOTIS relies on the precise determination of “indifference thresholds” and “preference thresholds”, while ESP-COMET requires complete fuzzy preference information, which is difficult to meet in the context of data scarcity in Africa [37].
Second, in terms of methodological characteristics, this study focuses on a static cross-sectional competitiveness assessment of 26 countries, which requires a method that can accurately reflect relative advantages and disadvantages. The TOPSIS method directly quantifies the gap between countries and the optimal benchmark through Euclidean distance, and its results are intuitive and easy to understand, which is crucial for subsequent spatial pattern analysis [38]. Although the temporal MCDA technique is suitable for dynamically tracking time series changes, it is not necessary for the cross-sectional comparison of this study; its complex time weighting mechanism may even introduce redundant information.
Third, in terms of the applicability of regional studies, the TOPSIS method has been widely verified in similar multi-indicator evaluation scenarios, such as comprehensive land use benefit evaluation [34], comparative evaluation of tourism resources [35], and urban economic evaluation [36]. These studies have confirmed its effectiveness in dealing with multi-dimensional and multi-scale evaluation objects, providing a methodological basis for cross-national competitiveness analysis. In contrast, newer methods such as SPOTIS lack sufficient application cases in African economic research, making it difficult to ensure the comparability of the results with the existing literature.
The TOPSIS method constructs the “ideal solution” and “negative ideal solution” of each indicator in the indicator system, analyzes and compares the distance of each research object from the “ideal solution” and the “negative ideal solution”, and gives the ranking of the comparison objects as the basis for decision-making [38]. The “ideal solution” means that each indicator is assumed to be optimal, while the “negative ideal solution” assumes that each indicator is the worst. In order to reflect the differences between indicators, different weights are usually given to each indicator. In order to effectively avoid the subjectivity of weight setting, objective weighting methods such as information entropy, principal component analysis, and coefficient of variation are often adopted. This paper uses information entropy to determine the weights. This method is easy to operate and widely used [39].

Basic Steps of TOPSIS Method

Constructing the evaluation matrix. For the competitiveness evaluation system of French-speaking African countries, targeting ‘n’ evaluation objects (26 countries) and setting a certain factor layer as ‘m’ evaluation indicators, a data matrix can be obtained. Here, ‘aij’ represents the numerical value of the ‘j’th evaluation indicator for the ‘i’th evaluation object.
A = { a i j } m × n
Matrix normalization. The range standardization method is used for processing. The calculation formula for positive indicators is as follows:
r i j = a i j m i n a i j 1 j n m a x a i j   1 j n m i n a i j 1 j n
The calculation formula for inverse indicators is as follows:
r i j = m i n a i j 1 j n a i j m a x a i j 1 j n m i n a i j 1 j n
In the formula, max a i j 1 j n and min a i j 1 j n , respectively, represent the maximum and minimum values of the indicator aij; rij is the evaluation value of the jth indicator for the ith evaluation object after range standardization, where each element in rij is within the range of 0 ≤ rij ≤ 1 (i = 1, 2, …, n; j = 1, 2, …, m) [40]. This results in the normalized matrix:
R = { r i j } m × n
Determining weights using the coefficient of variation method:
w i j = σ j / j = 1 m σ j ,   σ j = D j / r j ¯
D j = 1 n i = 1 n ( r j r j ¯ ) 2 ,   r j ¯ = 1 n i = 1 n r i j
In the formula, wij is the weight of each indicator, σj is the coefficient of variation, Dj is the standard deviation, and r j ¯ is the mean value of the jth indicator.
Calculating the Euclidean distance between the actual values of the research object’s indicators and the ‘ideal values’ and ‘negative ideal values’:
d + = j = 1 m w i j × ( r i j r j + ) 2
d = j = 1 m w i j × ( r i j r j ) 2
In the formula, r j + and r j , respectively, represent the maximum and minimum values of indicator j among all the standardized evaluation objects.
Calculating the measure value C of the competitiveness indicators for each African country:
C i = d i / d i + + d i
Based on the TOPSIS method, the core competitiveness, basic competitiveness, and auxiliary competitiveness levels of various French-speaking countries in Africa are ranked, and the comprehensive competitiveness of each country is calculated and summarized according to the weight of each aspect.
The value range of the calculation result is between 0 and 1. The larger the value, the higher the competitiveness level and the stronger the competitiveness, and vice versa. Generally, comprehensive competitiveness is divided into three levels: low level, medium level, and high level. Considering the relatively backward overall development level of African countries and the actual situation of African French-speaking countries, in order to more significantly reflect the competitiveness level of each country, this study adopts a 5-stage equal interval evaluation scheme for comprehensive competitiveness to classify the core competitiveness, basic competitiveness, auxiliary competitiveness, and comprehensive competitiveness calculation results of each country [41], and according to this standard, the order of the comprehensive competitiveness of African French-speaking countries is ranked. The specific classification scheme is shown in Table 1:

2.4. Construction of Indicator System

The construction of the comprehensive competitiveness evaluation index system of French-speaking African countries is based on the theoretical framework and empirical practice of national competitiveness. We use rigorous screening criteria to ensure scientificity and data availability and combine the authoritative literature and regional characteristics to explain the design logic, screening process, and selection basis of 30 indicators. The index system is based on three major theories: Porter’s diamond model emphasizes that the interaction between production factors, demand conditions, and related industries is the core driving force of competitiveness [42]; the Global Competitiveness Index (GCI) of the World Economic Forum (WEF) divides competitiveness into pillars such as institutions, infrastructure, and innovation [6,21]. Guided by these theories, the system is divided into three first-level indicators, seven second-level indicators, and 30 third-level indicators (Table 2), among which core competitiveness focuses on economic vitality, scientific and technological innovation, and financial stability (3 second-level indicators and 12 third-level indicators); basic competitiveness covers infrastructure and human capital (2 second-level indicators and 10 third-level indicators); and auxiliary competitiveness includes institutional quality and living environment (2 second-level indicators and 8 third-level indicators). This hierarchical structure is consistent with existing research. For example, the World Competitiveness Yearbook of the International Institute for Management Development (IMD) adopts a similar three-level model. Related research has also confirmed that such a framework can effectively capture the multidimensional competitiveness of developing regions [42].
The 30 indicators were selected from 52 candidate indicators in the WEF (2018), IMD (2020), and UNCTAD databases through four steps [43]. First, a theoretical relevance test was conducted to match the indicators with the three primary dimensions and exclude indicators that were not related to core competitiveness, such as the cultural diversity index, which was excluded due to the lack of theoretical correlation with economic performance; second, data availability screening was conducted to exclude indicators with a missing rate of more than 30% in 26 African French-speaking countries from 2010 to 2020 to ensure time continuity [25]. For example, based on Porter’s research, the “GDP growth rate” is retained instead of the “GNP growth rate” because it is more closely related to national competitiveness; finally, regional adaptation is made, and the indicators need to reflect the unique challenges of French-speaking African countries, such as incorporating “population electricity use rate” to address the problem of insufficient infrastructure. The 30 indicators finally determined balance, comprehensiveness, and feasibility. The selected indicators are all supported by theory and empirical evidence. The core competitiveness index “R&D expenditure as a percentage of GDP” (X6) is based on productivity growth, which is a key driver of competitiveness [44]; the basic competitiveness index “Railway density (km per thousand square kilometers)” (X15) is selected as an alternative indicator of logistics efficiency due to its wider data availability [45]; the auxiliary competitiveness index “Government effectiveness index” (X28) is based on Kaufmann et al. (Kaufmann et al.), The number of indicators selected is consistent with the regional research in this study. Related research shows that the competitiveness assessment of developing regions usually uses 25–35 indicators to adapt to data limitations [46].

2.5. Evaluation of Factors Affecting Competitiveness of French-Speaking African Countries Based on Adaptive LASSO Algorithm

The core reason for choosing the adaptive LASSO algorithm is that it can specifically address the issues of high-dimensional data and multicollinearity in competitiveness assessment, and it significantly outperforms other alternative algorithms in terms of methodological characteristics [47]. The traditional LASSO algorithm imposes equal penalties on all variable coefficients, which may lead to the incorrect elimination of important variables with small initial coefficients and is not suitable for the scenario in competitiveness research where there are significant differences in variable importance [48]. Nonlinear machine learning algorithms, although capable of capturing complex relationships, have a “black-box” characteristic in their model mechanism, making it difficult to clearly explain the specific impact of each factor on competitiveness and thus not conducive to the precise formulation of subsequent policy recommendations [49]. Principal Component Analysis (PCA) simplifies the data structure by reducing dimensions and combining multiple indicators into composite components [50]. However, it masks the economic meaning of individual indicators and cannot directly identify the specific factors that play a key role in competitiveness. In contrast, the adaptive LASSO algorithm assigns differentiated weights to regression coefficients based on their initial estimates [51]. It imposes smaller penalties on important variables to retain their impact and larger penalties on less important variables to drive their coefficients towards zero. This not only enables precise screening of high-dimensional variables but also preserves the economic meaning of the original indicators and provides interpretable coefficient results. It perfectly meets the research’s needs for accuracy in variable selection, interpretability of results, and relevance to policymaking, and thus becomes the optimal choice.
French-speaking African countries occupy a unique position in the global economic landscape, but their competitiveness development faces challenges such as prominent regional heterogeneity and complex correlations between multi-dimensional indicators. In-depth exploration of the factors affecting their competitiveness is of key significance for identifying development bottlenecks and formulating differentiated policies. The current research involves 30 high-dimensional indicators such as economic level, scientific and technological strength, and infrastructure. Traditional linear models are difficult to achieve accurate variable screening while dealing with multicollinearity. The adaptive LASSO algorithm has become an ideal choice because of its breakthroughs in high-dimensional data dimensionality reduction, variable importance differentiation, and “oracle nature” at the theoretical level. This method assigns weights inversely proportional to the initial estimate to the regression coefficient, imposes a small penalty on important variables to retain their influence, and increases the penalty on minor variables to make their coefficients approach 0. This method can not only solve the problem of misdeletion of important variables caused by the equal penalty of all variables in the traditional LASSO but also achieve consistency in variable selection and asymptotic normality of coefficient estimation in high-dimensional scenarios. Adaptive LASSO has achieved theoretical breakthroughs in variable selection and coefficient estimation by differentiating penalty weights, which is particularly suitable for scenarios with high-dimensional data, severe multicollinearity, and significant differences in importance between variables. In this study of the competitiveness of French-speaking African countries, this method can not only screen out the core driving factors but also quantify the contribution of each factor, providing an accurate basis for policymaking. The adaptive LASSO algorithm has been widely used in many fields, such as economics, biomedicine, and environmental science, due to its advantages in variable selection and coefficient estimation [52,53,54].
Assume that the comprehensive competitiveness index of African French-speaking countries is N, and the above 30 indicators are used as independent variables X1-X30 to construct a linear regression model:
N = α + j = 1 30 β j X j + ε
Among them, α is the intercept term, β j is the regression coefficient corresponding to the independent variable, and ε is the random error term.
When applying the adaptive LASSO algorithm, variable selection is achieved by adding different weights to each regression coefficient. The weight is calculated as (usually 1), where the coefficient estimate is obtained by some initial estimation method (such as ordinary least squares). In the actual calculation process, the adaptive LASSO algorithm is implemented using the glmnet package in the R language or the sklearn.linear_model module in Python 3.12.6. First, the data are sorted and input according to the above model format, and then the model is trained and fitted by setting a series of penalty parameter values. As it gradually increases, the algorithm will adjust the regression coefficient according to the importance of the variable so that the coefficients of some variables that have less impact on competitiveness gradually approach 0, thereby achieving the purpose of variable screening.
The choice of regularization parameters is the core issue of balancing the model’s fitting ability and generalization ability. Through the principle of bias-variance trade-off, find the λ that minimizes the test error, that is, the point where the sum of the bias and the variance is the smallest. The implementation steps are to use the cross-validation method to divide the data set into a training set and a validation set and evaluate the generalization ability of different λs through the validation set error, that is, randomly divide the 26 African French-speaking countries into 10 subsets, each time using 9 subsets for training and 1 subset for validation. In this process, the Akaike Information Criterion (AIC) and the Bayesian Information Criterion (BIC) are used for calculation. The smaller the AIC/BIC value, the better the model, so as to find the λ corresponding to the minimum value.
The adaptive LASSO algorithm is used to screen variables in the above model. In the algorithm, more accurate variable selection is achieved by adding different weights to each regression coefficient. The weight is calculated as follows w ^ j = 1 β ^ j O L S , where β ^ j O L S (OLS) is the coefficient estimate obtained by ordinary least squares.
When using R 4.3.1 software to implement the adaptive LASSO algorithm, it is necessary to continuously adjust the penalty parameters through the glmnet package and observe the changes in the estimated values of the variable coefficients in real time. As λ increases, the coefficients of variables with little impact on competitiveness will gradually approach 0 and be eliminated. In this study, the algorithm sets the convergence condition as the maximum change in the coefficient is less than 10−5 and finally reaches convergence after 50 iterations; at the same time, variables with an absolute value of the coefficient < 10−4 are considered to have no influencing factors and are excluded. In this process, the goodness of fit index of the model, Akaike Information Criterion (AIC), and Bayesian Information Criterion (BIC) are also paid attention to to determine the optimal variable selection results and model parameters.
Based on the variables selected by the adaptive LASSO algorithm and their corresponding regression coefficients, the level of competitiveness influencing factors for each French-speaking African country is calculated.

3. Results

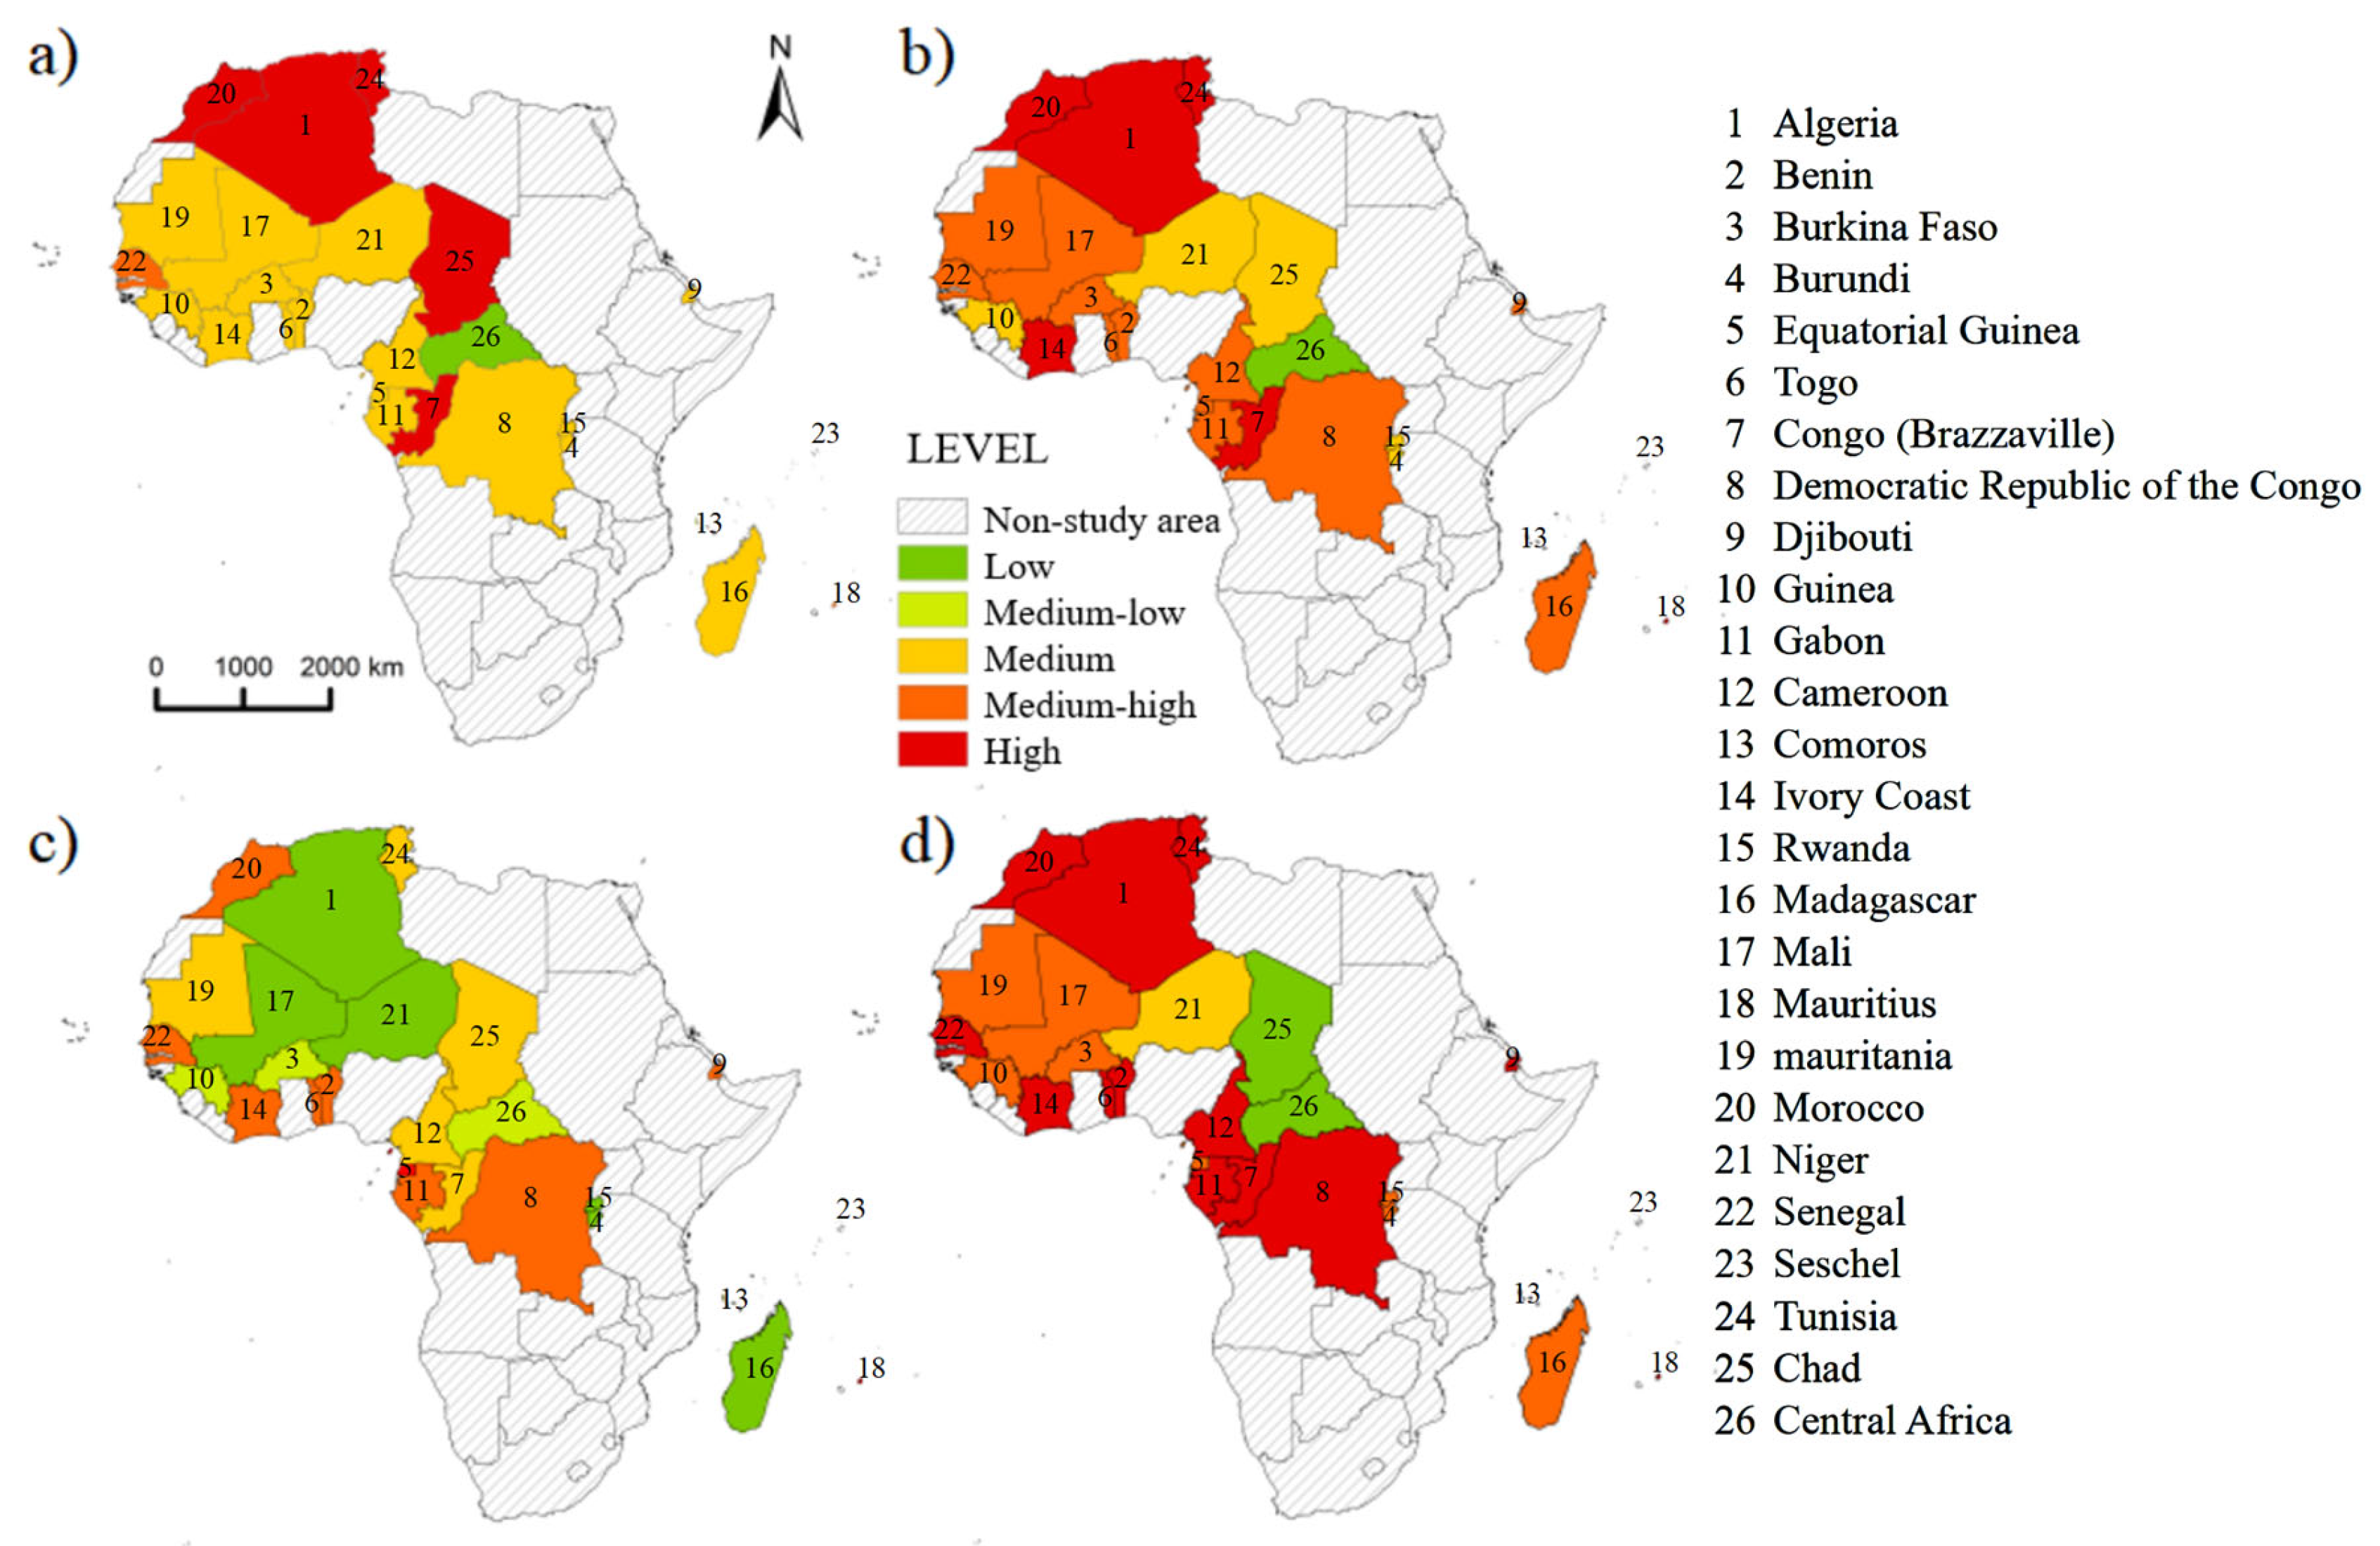
3.1. Competitiveness Evaluation Results of French-Speaking African Countries

The closer the national competitiveness index is to 1, the higher the competitiveness level is, and the closer it is to 0, the lower the competitiveness level is [55]. Based on the national competitiveness equal interval evaluation scheme, the specific definition standards of the competitiveness level of French-speaking African countries were calculated, as shown in Table 3.
TOPSIS was used to systematically evaluate the competitiveness of countries and rank them by region. The ranking results are shown in Table 4. ArcGIS 10.2 software was used to visualize the results to show the spatial distribution pattern of the competitiveness of French-speaking African countries. The results are shown in Figure 1. According to the evaluation criteria, in terms of the comprehensive competitiveness of French-speaking African countries, there are 6 countries with high competitiveness: Algeria, Morocco, Tunisia, Côte d’Ivoire, Congo (Brazzaville) and Mauritius, accounting for 23.08% of the total number of research objects; there are 12 countries with medium-high competitiveness: Djibouti, Seychelles, Benin, Burkina Faso, Mauritania, Senegal, Togo, Cameroon, Congo (Kinshasa), Equatorial Guinea, Gabon, and Madagascar, accounting for 46.15% of the total number of research objects; there are 7 countries with medium competitiveness: Burundi, Rwanda, Guinea, Mali, Niger, Chad, and Comoros, accounting for 26.92% of the total number of research objects; there are 0 countries with medium-low competitiveness; and there is 1 country with low competitiveness, which is Central Africa, accounting for 3.85% of the total number of research objects.
In terms of the spatial distribution pattern of national comprehensive competitiveness, the comprehensive competitiveness of French-speaking African countries shows the spatial pattern characteristics of “high in the north and south, low in the east and west”, and “high in the coastal areas, low in the inland areas”.
The three French-speaking countries in North Africa all have high levels of comprehensive competitiveness. This is due to the fact that the three North African countries are separated from Europe by the Mediterranean Sea to the north, connected to the hinterland of the African continent to the south, and bordered by the Atlantic Ocean to the west. Morocco controls the Strait of Gibraltar, the passage between the Mediterranean and the Atlantic Ocean. Its strategic location is extremely important and is widely valued by European and American countries, making economic and trade exchanges between the three countries and European and American countries relatively convenient. Most of the population of the three countries is concentrated on the Mediterranean or Atlantic coasts, where the climate is mild, the environment is beautiful, and the tourism industry is developed. At the same time, the three countries are rich in mineral resources, have developed mining industries, and have established primary processing industries based on oil and phosphate. The export of a large amount of mineral resources has brought huge foreign exchange income and investment in related infrastructure construction to the three countries [56]. Among them, Algeria’s proven oil reserves are about 1.7 billion tons, ranking 15th in the world, and most of them are light oil with high oil quality. The proven recoverable reserves of natural gas are 4.58 trillion cubic meters, ranking 10th in the world. The export of oil and natural gas has brought huge economic benefits to the country [57]. Morocco’s phosphate reserves are 110 billion tons, ranking first in the world. It also has rich reserves of metal mines, coal mines, and oil shale resources. Tunisia’s proven phosphate reserves are 2 billion tons, ranking among the top in the world [58]. Based on a relatively stable political environment, the three countries have achieved steady economic development by relying on the achievements of economic reform and economic restructuring. For example, Tunisia has been committed to strengthening its economic ties with Europe. In 2008, it launched a free trade zone with the EU, which has enabled the primary, secondary, and tertiary industries in its economy to develop steadily. The Moroccan government is committed to expanding domestic demand, strengthening infrastructure construction, continuously optimizing the economic structure, improving the investment environment, and engaging in emerging industries such as information and clean energy. It has actively attracted foreign investment, and its economy has continued to grow. The Algerian government has used oil and gas revenues to implement a fiscal expansion policy, accelerate the construction of large-scale infrastructure, promote the reform of state-owned enterprises and the financial system, and increase support for small and medium-sized enterprises, resulting in steady economic growth.
The average comprehensive competitiveness of French-speaking countries in South Africa ranks second, but there are obvious internal differences. The three French-speaking countries in South Africa are all island countries in the Indian Ocean. Because the three countries are located in the southwest Indian Ocean, they are important waterways connecting the Indian Ocean and the Atlantic Ocean, and they have a pleasant climate. Therefore, the three countries have unique locational advantages. Mauritius is sunny and has a large number of charming coastlines and coral reefs, which makes the country have unique tourist landscapes and developed tourism. At the same time, the government encourages foreign investment, there is no foreign exchange control, capital and profits can be freely remitted, and the infrastructure is complete, making the country very competitive. Madagascar is the largest island in Africa, with outstanding natural resources. Rich mineral deposits are the cornerstone of the country’s development and have driven the construction of infrastructure to a certain extent. However, from 2009 to 2013, it experienced a political crisis caused by the election of a change in government, which affected the international community’s aid and investment in the country and also affected the country’s competitiveness. Comoros is one of the least developed countries in the world. Its economy is mainly based on agriculture and fisheries. High debt and poor infrastructure make the country less competitive.
The comprehensive competitiveness of French-speaking countries in East Africa is at a medium level. French-speaking countries in East Africa are rich in mineral resources, with many natural landscapes, such as deserts, rift valleys, and rainforests, and rich in tourism resources. For example, Rwanda has considerable oil reserves, and Burundi has a large number of nickel mines. They also have an important position in geopolitics. Although Djibouti is recognized as the world’s least developed country by the United Nations, it has an extremely important geopolitical environment. Therefore, the country has been increasingly valued by major countries in this century, attracting a large amount of foreign investment and rapid economic development. Seychelles is located in the western Indian Ocean, with extremely convenient sea and air transportation. However, the economies of various countries are too dependent on the primary industry dominated by agriculture and animal husbandry [59]. For example, 93.6% of the population in Burundi is engaged in agriculture, and more than 80% of the population in Uganda is rural. Infrastructure construction lags behind the needs of economic development. For example, Uganda’s backward transportation facilities increase the difficulty of cargo transportation. Burundi’s nickel reserves rank sixth in the world, but due to power shortages, none of them have been mined. The hot climate conditions of the East African Plateau also pose a great challenge to the smooth development of economic and trade activities. For example, Djibouti’s inland areas are mainly plateaus and mountains, with very little usable land, and the coastal areas are plains and plateaus. It is hot and rainy all year round. The hot and rainy climate conditions make it difficult for Djibouti to produce grain and vegetables, and food is entirely imported.
The comprehensive competitiveness of French-speaking countries in West Africa is relatively low. The reason is that the slave trade in the past affected the process of independent development in West Africa. French-speaking countries in West Africa are largely influenced, controlled, and dominated by France, forming a strong dependence, which makes the economic lifeline of the region controlled by multinational corporations and Western developed countries. For a long time, it has been difficult to transform resource advantages into development advantages [60]. In addition, the economy of the region is mainly based on a small-scale peasant economy, with a weak industrial base and underdeveloped natural resources. For example, Mali is rich in mineral resources and has huge gold reserves, but the country’s industry is weak and the political situation is unstable, making it difficult to effectively develop; Guinea is one of the least developed countries announced by the United Nations and cannot be self-sufficient in food; and Niger’s large amount of uranium and phosphate mineral resources cannot be effectively converted into economic benefits due to the backward road and railway transportation.
The comprehensive competitiveness of French-speaking countries in Central Africa is the lowest among French-speaking countries in Africa. Due to the interweaving of regional tribal and religious conflicts and territorial and border disputes, many countries in the region are politically unstable, with military coups, civil wars, and conflicts occurring one after another, resulting in the region being unable to have a stable economic development environment [61]. For example, since the early 1990s, the national economies of the Democratic Republic of the Congo and the Republic of the Congo have been on the verge of collapse due to years of civil war and regional conflicts. The situation has eased recently, and the economies of the two countries have embarked on a path of rapid development. Among them, the huge oil reserves and mineral resources of the Republic of the Congo have been effectively developed, and economic development has made great progress; in the early 21st century, due to the continuous political turmoil and war in Central Africa and Chad, production could not proceed normally, and the economic situation continued to deteriorate; although the political situation in Equatorial Guinea and Cameroon is relatively stable, their economic development is too dependent on natural resources and is easily affected by fluctuations in international market prices, resulting in unstable economic situations in the two countries; through the development of oil resources, Equatorial Guinea’s per capita income has exceeded USD 20,000 dollars, its infrastructure is relatively backward, and tap water is still not popular in most parts of the capital, which affects the country’s competitiveness.

3.2. Empirical Analysis of Factors Affecting Competitiveness of French-Speaking African Countries Based on Adaptive-LASSO Algorithm

Using R 4.3.0 software, we conducted an empirical analysis of the factors affecting the competitiveness of French-speaking African countries based on the Adaptive-LASSO algorithm. We screened 30 indicators using the algorithm, standardized the original data, and then substituted them into the Adaptive-LASSO model, eliminating 17 variables with a coefficient of 0 (X14–X30). The selected variables X1-X13 were left. The remaining indicators were simply classified, as shown in Table 5.
According to the above table, we can find 3 key influencing factors.
R&D expenditure as a percentage of GDP (X6): weight 0.1472, regression coefficient 0.281 (t = 5.63, p < 0.001), is the indicator with the highest weight in the science and technology level dimension, reflecting the direct driving effect of R&D investment on innovation capability.
High-tech exports (X8): weight 0.1595, regression coefficient 0.312 (t = 6.21, p < 0.001), are the core manifestation of scientific and technological achievements transformation and international competitiveness and are strongly positively correlated with competitiveness.
Total reserves (X11): weight 0.1160, regression coefficient 0.227 (t = 4.38, p < 0.001). As a key indicator of financial strength, it reflects a country’s ability to resist risks and allocate capital.
In addition, we can also find 5 secondary key influencing factors.
Number of patent applications (X9): weight 0.0926, regression coefficient 0.185 (t = 3.72, p = 0.002), reflecting the scale of innovation output, but the conversion efficiency needs to be further optimized in combination with industrial applications.
Total number of domestic listed companies (X10): weight 0.0854, regression coefficient 0.173 (t = 3.45, p = 0.004), reflecting the activity of the capital market and the financing ability of enterprises, and playing a supporting role in industrial expansion.
Science and engineering indicators (X5): weight 0.0745, regression coefficient 0.151 (t = 2.98, p = 0.008), representing basic research and technical talent reserves, which are the underlying elements of R&D and innovation.
R&D researchers (X7): weight 0.0739, regression coefficient 0.149 (t = 2.89, p = 0.010), positively correlated with the level of science and technology, but attention should be paid to the potential suppression of competitiveness by talent loss.
Commodity exports (X4): weight 0.0581, regression coefficient 0.123 (t = 2.51, p = 0.019). As a core indicator of economic level, its growth has a significant effect on GDP, but its added value still needs to be improved.
To verify the effectiveness of adaptive LASSO in variable selection, this study selected three mainstream methods, namely, traditional LASSO, ridge regression, and random forest, for comparison and conducted analysis from three aspects: variable screening results, model fitting goodness of fit, and consistency of core factors (Table 6).
Although traditional LASSO can achieve variable screening, it imposes equal penalties on all variables, resulting in 12 variables being screened out, and there is a problem of over-retention of secondary factors. Ridge regression only reduces overfitting through coefficient shrinkage and cannot achieve variable elimination, and ultimately retains all 30 indicators, making it difficult to identify core driving factors. Random Forest screens variables through feature importance scores, and although it can capture nonlinear relationships, the results are significantly affected by parameters, and the key indicator “R&D expenditure ratio” is missing from the 8 screened variables, which poses a risk of missing core factors.
In contrast, adaptive LASSO uses differentiated weight penalties to ultimately screen out 8 variables, including 3 core factors and 5 secondary factors, which not only avoids the redundant retention of traditional LASSO but also overcomes the problem of missing core factors of random forests. From the perspective of model fitting indicators, the BIC value of adaptive LASSO (126.8) is lower than that of traditional LASSO (142.3) and random forest (138.5), indicating that it maintains a better fitting effect while streamlining variables. The consistency analysis of core factors shows that the proportion of variables overlapping between adaptive LASSO and other methods reaches 75%, and the only newly added “R&D expenditure ratio” has been confirmed to be a key driving factor of competitiveness in economic theory, further confirming the scientific nature of its screening results.

4. Prospects and Strategies for Sustainable Development in French-Speaking African Countries

4.1. Sustainable Development Prospects

The sustainable development prospects of French-speaking African countries are deeply tied to the improvement in key factors such as R&D innovation, technology transformation, and financial stability. According to the empirical results of the Adaptive-LASSO algorithm, R&D expenditure (X6), high-tech exports (X8), and total reserves (X11) are core constraints, and their improvement will directly leverage the leap in competitiveness:
  • Leverage effect of R&D investment: Currently, the proportion of R&D expenditure to GDP in French-speaking African countries is generally less than 1%. If referring to the global average of 2.5%, every 1 percentage point increase is expected to drive a 3–5% increase in the added value of high-tech industries.
  • Structural opportunities for high-tech exports: High-tech exports in West Africa and Central Africa account for less than 5%, but high-tech exports of auto parts in Morocco in North Africa have achieved an annual growth of 12%, indicating that new growth poles can be formed through industrial upgrading.
  • The risk resistance of financial reserves: Insufficient total reserves will lead to pressure on foreign debt repayment. If the ratio of total reserves to short-term foreign debt is increased to the 1:1 safety line, the risk of currency crisis can be reduced by 50%.

4.2. Targeted Strategies for Sustainable Development in French-Speaking African Countries: Synergistic Intervention Based on Key and Sub-Key Factors

  • Strengthen scientific and technological R&D investment and innovation transformation mechanism.
In view of the two key constraints of R&D expenditure (X6) and high-tech exports (X8), a full-chain improvement system of “R&D-transformation-export” needs to be established. Currently, the proportion of R&D expenditure to GDP in French-speaking African countries is generally less than 1%, and the proportion of high-tech exports is less than 10%. However, empirical evidence shows that a 1% increase in R&D investment can drive a 2.3% increase in high-tech exports [41]. Specific strategies include referring to the experience of Morocco in establishing a “National Science and Technology Development Fund”, requiring countries to use 2.5% of fiscal expenditure for R&D, and implementing tax deductions for corporate R&D investment (USD 0.2 dollars of corporate income tax reduction for every USD 1 dollar of R&D investment), with the goal of increasing the proportion of R&D expenditure to 2% by 2030 [58]; at the same time, relying on China’s “Belt and Road” science and technology innovation action plan, 10 “scientific and technological achievement transformation centers” will be built in Algeria and Côte d’Ivoire. With the support of Chinese investment and technology, the patent transformation in the fields of deep processing of oil and gas resources and agricultural product biotechnology will be promoted (the current patent transformation rate is less than 15%), and the R&D team will be given a 15% profit share for successful commercial projects [57].
2.
Optimize financial reserve management and capital market vitality.
In order to address the financial strength shortcomings of insufficient total reserves (X11) and a limited number of domestic listed companies (X10), breakthroughs need to be made in both regional coordination and market expansion. Currently, 60% of French-speaking African countries have a total reserve to short-term external debt ratio of less than 0.5, and there are only 12 domestic listed companies on average. We can learn from the reserve sharing mechanism of the West African Economic and Monetary Union (UEMOA) and establish a “French-speaking African Foreign Exchange Reserve Pool”, with member countries injecting funds at 1.5% of GDP, with the goal of increasing the total reserve to external debt ratio to 1:1 [62]; at the same time, we should implement the “Small and Medium Enterprises Listing Incubation Project” in Senegal and Cameroon, lower the listing threshold, and introduce Chinese securities firms as market makers, with the goal of increasing the total number of domestic listed companies to 50 by 2028 and increasing the proportion of total stock trading volume to GDP to 15% [63].
3.
Strengthen the foundation of scientific and engineering talents and R&D manpower.
In response to the shortage of science and engineering indicators (X5) and R&D researchers (X7), the “Talent Power Plan” is implemented to break through the constraints of secondary key factors. Currently, there are only 739 R&D researchers per million people, and the talent loss rate in the field of science and engineering is as high as 35% [64]. We can refer to Algeria’s “9-year compulsory education + vocational training” model, which increase the proportion of public expenditure on education to GDP from the current average of 4.97% to 6%, focus on adding science and engineering courses in middle schools, and aim to increase the university enrollment rate from 9.92% to 20% by 2035 [65]; at the same time, it jointly launch the “African Science and Technology Talent Scholarship” with China, subsidize 5000 students to study science and engineering in China each year, provide a matching “Returning Entrepreneurship Fund”, and build “Overseas Talent Innovation Parks” in Morocco and Tunisia, striving to reduce the talent loss rate to below 15% [66].
4.
Increase the added value of commodity exports and facilitate trade.
In order to address the vicious cycle of low added value of commodity exports (X4) and insufficient conversion of patent applications (X9), the “dual-track system for export upgrades” should be implemented. Currently, primary commodity exports account for more than 70%, and the patent commercialization rate is only 12% [67]. “Agricultural product deep processing parks” can be built in Côte d’Ivoire and Benin, and Chinese technology can be introduced to transform cocoa, cotton, and other products into high-value-added products so that the unit export volume can be increased by 3–5 times. At the same time, the downstream petrochemical industry can be developed in Congo (Brazzaville) to reduce the direct export ratio of crude oil to less than 30% [68]; relying on China’s “Belt and Road” infrastructure investment, the container handling capacity of the West African port group can be upgraded to an average of 20 million standard containers per year, and the customs procedures can be simplified to shorten the customs clearance time for commodity exports from 72 h to 48 h [69].
5.
Implementation path for China and Africa to jointly promote sustainable development.
Based on the need for coordinated intervention of key and sub-key factors, the implementation path of China–Africa cooperation is constructed to achieve long-term development. The “China-Africa Innovation Partnership Program” was launched, and China provided a special loan of US$3 billion to support the construction of five national R&D centers to tackle clean energy, digital technology and other fields [70]; the “Science and Technology Logistics Corridor of French-speaking African Countries” was built, and standard-gauge railways and optical fiber cables were laid from the Port of Tangier, Morocco to the Port of Pointe Noire, Congo (Brazzaville), with a total investment of about US$12 billion, reducing the transportation cost of high-tech products by 30% [71]; the “China-Africa Financial Stability Fund” was established with a scale of US$5 billion to hedge exchange rate and debt risks, and pilot “patent securitization” financing [72]. It is expected that by 2030, if the proportion of R&D expenditure reaches 2% and the proportion of high-tech exports reaches 15%, the comprehensive competitiveness index can be improved by 0.1–0.15, and Algeria and other countries are expected to enter the top 60 in global competitiveness; the long-term goal is to achieve a total reserve and foreign debt ratio of 1:1 and more than 100 listed companies by 2040, and West Africa and Central Africa will form independent innovation capabilities. In terms of risk management, a “political risk early warning mechanism” will be established, project tiering management will be implemented for high-risk countries, investment risks will be dispersed through the “capacity cooperation fund”, and the equity ratio of a single project will be required to not exceed 49% [73].

5. Conclusions

5.1. Conclusions of This Study

This study is based on the competitiveness evaluation framework of African French-speaking countries constructed by the TOPSIS method and the adaptive LASSO algorithm. By integrating multi-source data such as the World Bank and the International Statistical Yearbook, the competitiveness of 26 African French-speaking countries is quantitatively analyzed. This study found that the comprehensive competitiveness of African French-speaking countries presents significant spatial pattern characteristics of “high in the north and south, low in the east and west” and “high in the coast and low in the inland”. In terms of core competitiveness, five countries, such as Algeria and Morocco, are in the high competitiveness echelon, while the competitiveness level of countries, such as the Central African Republic and Chad, is extremely low. More than 60% of the countries have a medium level of core competitiveness. In terms of basic competitiveness, 13 countries such as Egypt and Tunisia have high competitiveness, but countries such as Djibouti and Burkina Faso are in the low competitiveness range due to weak infrastructure, and the regional gap is huge. In terms of auxiliary competitiveness, only three countries, such as Senegal and Côte d’Ivoire, have outstanding performance, and most countries are constrained by insufficient policy stability or corruption. The adaptive LASSO algorithm was used to screen out three core constraints (R&D expenditure as a percentage of GDP, high-tech exports, and total international reserves) and five secondary key factors (number of patent applications, total number of domestic listed companies, and number of R&D researchers).

5.2. Research Discussions

To verify the robustness and generalizability of the proposed method, this study conducted a systematic comparison with a variety of alternative methods. In terms of variable selection, adaptive LASSO effectively reduces redundant variables compared to traditional LASSO, achieves accurate variable elimination compared to ridge regression, avoids the omission of core factors compared to random forest, and has a better model-fitting effect, which fully reflects its advantages in dealing with high-dimensional data and multicollinearity problems. In terms of multi-criteria decision-making methods, the comparison between TOPSIS and modern MCDM methods shows that it is more adaptable to the scarcity and heterogeneity of data in French-speaking African countries. Supplementary tests conducted by Python’s pymcdm library show that the results of TOPSIS and SPOTIS are highly consistent and can better capture regional differences. The multi-tool benchmark test on the www.make-decision.it (accessed on 17 May 2025) platform further verifies that the competitiveness ranking based on TOPSIS is consistent with regional economic reality, which enhances the reliability of spatial pattern analysis.
This study clarifies its own position in the existing academic system and fills in many research gaps. Existing research on African competitiveness focuses on the whole or a single country and pays insufficient attention to French-speaking Africa, a group with unique language, institutional, and economic connections. This study uses an integrated algorithm to systematically evaluate it for the first time. In terms of methodology, the combination of TOPSIS and adaptive LASSO is innovative, overcoming the limitations of a single method, not only achieving the ranking of comprehensive competitiveness but also accurately identifying key influencing factors, providing a new tool for regional economic analysis. At the same time, this study verifies the applicability of adaptive LASSO in data-scarce areas and the advantages of TOPSIS over modern MCDM methods, providing a methodological reference for related research on developing economies. The conclusions of this study provide specific suggestions for policymakers and China–Africa cooperation under the background of the “Belt and Road Initiative”. Priority should be given to increasing R&D investment and the proportion of high-tech exports to strengthen innovation-driven growth, strengthen regional financial coordination, and enhance risk resistance through mechanisms such as the establishment of a regional foreign exchange reserve pool; promote China–Africa cooperation to build technology transfer centers and logistics corridors, make up for infrastructure and talent shortcomings, and help improve competitiveness. These strategies will help French-speaking African countries break through development bottlenecks and achieve sustainable development.
However, this study also has certain limitations. Incomplete statistical data of some countries may affect the accuracy of indicators. In the future, non-traditional data such as satellite images and mobile phone data can be integrated to supplement official statistics. Static cross-sectional models are difficult to capture the long-term evolution of competitiveness, and panel data models or time series prediction methods need to be introduced to track time series changes. The method can be further expanded through multi-scenario simulation and integration of Bayesian adaptive LASSO to solve the problem of variable collinearity. In addition, future research can explore the impact of colonial heritage and the de-Frenchification process on competitiveness and improve the evaluation indicator system with more regional characteristics. It is recommended that international organizations establish a competitiveness database for French-speaking African countries, unify data standards and update them regularly, promote China–Africa academic cooperation and case studies, and provide theoretical support for regional coordinated development under the background of the “Belt and Road Initiative”.

Author Contributions

Conceptualization, B.L.; Methodology, B.L., L.L., H.R. and W.L.; Software, B.L. and J.Q.; Formal analysis, B.L. and W.L.; Investigation, J.Q.; Resources, B.L. and L.L.; Data curation, H.R. and J.Q.; Writing—original draft, B.L. and H.R.; Writing—review & editing, L.L., H.R., J.Q. and W.L.; Supervision, L.L.; Project administration, H.R.; Funding acquisition, B.L. All authors have read and agreed to the published version of the manuscript.

Funding

This research was funded by the Guangxi Innovation and Entrepreneurship Training Program for College Students (202510603320), the National Natural Science Foundation of China Youth Science Fund Project “Study on the interactive mechanism between informal settlement expansion and urbanization: A case study of typical African cities” (No. 42301227), the Research funding for the 2024 Green seedling Program of the Human Resources and Social Security Department of Guangxi Zhuang Autonomous Region, China (60203038919630213), and the Nanning Normal University Doctoral Research Startup Project (No. 602021239447).

Data Availability Statement

The original contributions presented in this study are included in the article. Further inquiries can be directed to the corresponding authors.

Conflicts of Interest

The authors declare no conflicts of interest.

References

  1. Huggins, R.; Izushi, H. The competitive advantage of nations: Origins and journey. Compet. Rev. 2015, 25, 458–470. [Google Scholar] [CrossRef]
  2. Garliñska-Bielawska, J.; Janicka, M. Fragile states in African economic communities as exemplified by the Economic and Monetary Community of Central Africa (CEMAC)—Investment issues. Politeja 2018, 15, 231–246. [Google Scholar] [CrossRef]
  3. African Development Bank (AfDB). Regional Economic Outlook: Africa: A Checklist for Practitioners; African Development Bank: Abidjan, Ivory Coast, 2005. [Google Scholar]
  4. Uganda, E.; Kenya, D. Africa Economic Outlook. The Report, Launched on July 27th; African Development Bank: Abidjan, Ivory Coast, 2023. [Google Scholar]
  5. Porter, M.E. The competitive advantage of nations. Harv. Bus. Rev. 1990, 68, 73–93. [Google Scholar]
  6. Schwab, K. The Global Competitiveness Report 2018; World Economic Forum: Cologny, Switzerland, 2018. [Google Scholar]
  7. Csath, M. Restoring EU’s competitiveness: Knowledge creation holds the key. IUP J. Knowl. Manag. 2025, 23. [Google Scholar]
  8. Stankovic, J.J.; Marjanovic, I.; Drezgic, S.; Popovic, Z. The digital competitiveness of European countries: A multiple-criteria approach. J. Compet. 2021, 13, 117–134. [Google Scholar] [CrossRef]
  9. Angelidis, G.; Ioannidis, E.; Makris, G.; Antoniou, I.; Varsakelis, N. Competitive conditions in global value chain networks: An assessment using entropy and network analysis. Entropy 2020, 22, 1068. [Google Scholar] [CrossRef]
  10. Schwab, K.; Zahidi, S. The Global Competitiveness Report 2019; World Economic Forum: Cologny, Switzerland, 2019. [Google Scholar]
  11. Rubaj, P. Competitiveness and development of EU countries in the face of global economic, social, and environmental challenges. Eur. Res. Stud. J. 2025, 28, 22–37. [Google Scholar] [CrossRef]
  12. Kazemi, A.; Kazemi, Z.; Heshmat, H.; Nazarian-Jashnabadi, J.; Tomášková, H. Ranking factors affecting sustainable competitive advantage from the business intelligence perspective: Using content analysis and F-TOPSIS. J. Soft Comput. Decis. Anal. 2024, 2, 39–53. [Google Scholar] [CrossRef]
  13. Varian, H.R. Big data: New tricks for econometrics. J. Econ. Perspect. 2014, 28, 3–27. [Google Scholar] [CrossRef]
  14. Bacon, D.; Forner, D.; Ozcan, S. Machine learning approach for national innovation performance data analysis. In Proceedings of the 8th International Conference on Data Science, Technology and Applications, Prague, Czech Republic, 29–31 July 2019; pp. 325–331. [Google Scholar]
  15. Borrajo-Millán, F.; Alonso-Almeida, M.D.M.; Escat-Cortes, M.; Yi, L. Sentiment analysis to measure quality and build sustainability in tourism destinations. Sustainability 2021, 13, 6015. [Google Scholar] [CrossRef]
  16. Hidalgo, C.A.; Hausmann, R. The building blocks of economic complexity. Proc. Natl. Acad. Sci. USA 2009, 106, 10570–10575. [Google Scholar] [CrossRef]
  17. Teza, G.; Caraglio, M.; Stella, A.L. Growth dynamics and complexity of national economies in the global trade network. Sci. Rep. 2018, 8, 15230. [Google Scholar] [CrossRef]
  18. Gentzkow, M.; Kelly, B.; Taddy, M. Text as data. J. Econ. Lit. 2019, 57, 535–574. [Google Scholar] [CrossRef]
  19. Jean, N.; Burke, M.; Xie, M.; Davis, W.M.; Lobell, D.B.; Ermon, S.; Chen, C.; Field, C.B.; Jones, M.E.; You, L.; et al. Combining satellite imagery and machine learning to predict poverty. Science 2016, 353, 790–794. [Google Scholar] [CrossRef]
  20. Gandomi, A.; Haider, M. Beyond the hype: Big data concepts, methods, and analytics. Int. J. Inf. Manag. 2015, 35, 137–144. [Google Scholar] [CrossRef]
  21. Fosu, A.K. Inequality and the impact of growth on poverty: Comparative evidence for Sub-Saharan Africa. J. Dev. Stud. 2009, 45, 726–745. [Google Scholar] [CrossRef]
  22. Ofori, I.K.; Osei, D.B.; Alagidede, I.P. Inclusive growth in Sub-Saharan Africa: Exploring the interaction between ICT diffusion and financial development. Telecommun. Policy 2022, 46, 102315. [Google Scholar] [CrossRef]
  23. Bakoup, F.; Tarr, D. The economic effects of integration in the Central African Economic and Monetary Community: Some general equilibrium estimates for Cameroon. Afr. Dev. Rev. 2000, 12, 161–190. [Google Scholar] [CrossRef]
  24. Morano, R.S.; Jacomossi, R.R.; Barrichello, A.; Feldmann, P.R. The interdependence between ease of doing business, innovation, and competitiveness of nations. BAR-Brazilian Adm. Rev. 2023, 20, e220103. [Google Scholar] [CrossRef]
  25. Hilbert, M. Big data for development: A review of promises and challenges. Dev. Policy Rev. 2016, 34, 135–174. [Google Scholar] [CrossRef]
  26. Samah, W.T. France and Francophone Africa. In Issues of Governance, Security, and Development in Contemporary Africa; Bloomsbury Publishing: London, UK, 2023; p. 71. [Google Scholar]
  27. Hickman, K.G. From private dialect to public language: Transforming Moroccan Arabic through the voices of sub-Saharan African immigrants. J. Arabic Socioling. 2024, 2. [Google Scholar] [CrossRef]
  28. Ndoleriire, O.K. The development and intellectualisation of African languages revisited. Afr. J. Lang. Stud. 2024, 1. [Google Scholar]
  29. World Bank Open Data. Available online: https://data.worldbank.org.cn/ (accessed on 3 December 2024).
  30. National Bureau of Statistics. International Statistical Yearbook 2024 (with CD) Statistics; China Statistics Press: Being, China, 2024. [Google Scholar]
  31. CIA World Factbook. Available online: https://www.ciaworldfactbook.us/category/countries/ (accessed on 11 December 2024).
  32. Welcome to the International Organization of La Francophonie’s Official Organization. Available online: https://www.francophonie.org/ (accessed on 28 March 2018).
  33. Zhou, W.; Jiang, W. Two-phase TOPSIS of uncertain multi-attribute group decision-making. J. Syst. Eng. Electron. 2010, 21, 423–430. [Google Scholar]
  34. Zhu, Z.; Zhang, L.; Ye, X.; Zhang, Y. Comprehensive benefit evaluation of land use based on TOPSIS method. Econ. Geogr. 2012, 32, 139–144. [Google Scholar]
  35. Zhang, H.; Zhang, Y. Comparative study on inter-regional competitiveness of tourism resources based on weighted TOPSIS method: Taking the Yangtze River Delta as an example. Resour. Environ. Yangtze River Basin 2010, 19, 500–505. [Google Scholar]
  36. Cheng, Y.; Ren, J.; Cui, H.; Tang, G. Regional development model based on entropy weight TOPSIS method and three-dimensional structure: A case study of Shandong Province. Econ. Geogr. 2012, 32, 27–31. [Google Scholar]
  37. Więckowski, J.; Wątróbski, J.; Shkurina, A.; Sałabun, W. Adaptive multi-criteria decision making for electric vehicles: A hybrid approach based on RANCOM and ESP-SPOTIS. Artif. Intell. Rev. 2024, 57, 270. [Google Scholar] [CrossRef]
  38. Jiang, D.; Yang, D.; Ren, Z.; Chen, Y.; Zhang, Z. Evaluation of the comprehensive economic and social development level of African regions based on TOPSIS method. Tropical Geogr. 2015, 35, 242–249. [Google Scholar]
  39. Yao, S.; Huang, W.; Zhang, Z.; Zhao, L. Evaluation of regional financial ecological environment: Based on modified coefficient of variation method. Technol. Econ. 2015, 10, 61–67. [Google Scholar]
  40. Zheng, Y.; Ju, F. Research on comprehensive evaluation of college work performance under the college system model. Sci. Technol. Prog. Counters. 2003, 20, 1370–1374. [Google Scholar]
  41. Liu, B.; Wang, H.; Hu, Q.; Zhuang, S.; Chen, H.; Zhang, C. An empirical study on development of regional circular economy based on eco-efficiency: A case study of Jiangsu Province. J. Environ. Eng. Technol. 2017, 7, 216–224. [Google Scholar] [CrossRef]
  42. Porter, M.E. The Competitive Advantage of Nations; Free Press: New York, NY, USA, 1990. [Google Scholar]
  43. Canton, H. United Nations Conference on Trade and Development—UNCTAD. In The Europa Directory of International Organizations 2021; Routledge: London, UK, 2021; pp. 172–176. [Google Scholar]
  44. Dobrinsky, R. Innovation as a key driver of competitiveness. UNECE Annu. Rep. Econ. Essays 2008, 6, 53–59. [Google Scholar]
  45. Mukhtarova, K.S.; Ospanov, S.S.; Antoni, A.; Sharapiyeva, M.D. The evaluation of the efficiency of transport and logistics infrastructure of railway transport. Pomorstvo 2018, 32, 88–101. [Google Scholar] [CrossRef]
  46. Lall, S. Competitiveness indices and developing countries: An economic evaluation of the global competitiveness report. World Dev. 2001, 29, 1501–1525. [Google Scholar] [CrossRef]
  47. Khan, F.; Urooj, A.; Khan, S.A.; Khosa, S.K.; Muhammadullah, S.; Almaspoor, Z. Evaluating the performance of feature selection methods using huge big data: A Monte Carlo simulation approach. Math. Probl. Eng. 2022, 2022, 6607330. [Google Scholar] [CrossRef]
  48. Guo, P.; Zeng, F.; Hu, X.; Zhang, D.; Zhu, S.; Deng, Y.; Hao, Y. Improved variable selection algorithm using a LASSO-type penalty, with an application to assessing hepatitis B infection relevant factors in community residents. PLoS ONE 2015, 10, e0134151. [Google Scholar] [CrossRef]
  49. Guidotti, R.; Monreale, A.; Ruggieri, S.; Turini, F.; Giannotti, F.; Pedreschi, D. A survey of methods for explaining black box models. ACM Comput. Surv. 2018, 51, 1–42. [Google Scholar] [CrossRef]
  50. Mazziotta, M.; Pareto, A. On the construction of composite indices by principal components analysis. Riv. Ital. Econ. Demogr. Stat. 2016, 70, 103–109. [Google Scholar]
  51. Alhamzawi, R.; Ali, H.T.M. The Bayesian adaptive lasso regression. Math. Biosci. 2018, 303, 75–82. [Google Scholar] [CrossRef]
  52. Wu, W. Soil Layer Classification and Liquefaction Discrimination Model Based on Bayesian Adaptive Lasso Logistic Regression. Ph.D. Thesis, China Three Gorges University, Yichang, China, 2023. [Google Scholar]
  53. Hu, H. Research on Comprehensive Evaluation and Influencing Factors of Digital Economy Development in Counties of Zhejiang Province. Ph.D. Thesis, Hangzhou Dianzi University, Hangzhou, China, 2022. [Google Scholar]
  54. Peng, Z. Random Forest-Adaptive Lasso credit Default Risk Factor Identification. Ph.D. Thesis, Hunan University, Changsha, China, 2021. [Google Scholar]
  55. Huang, Y. Research on the International Competitiveness of Financial Services Trade of RCEP Member Countries. Ph.D. Thesis, Xinjiang University of Finance and Economics, Ürümqi, China, 2023. [Google Scholar] [CrossRef]
  56. Ben Ali, M.S.; Cockx, L.; Francken, N. The Middle East and North Africa: Cursed by natural resources? In Economic Development in the Middle East and North Africa: Challenges and Prospects; Palgrave Macmillan US: New York, NY, USA, 2016; pp. 71–93. [Google Scholar]
  57. Hassanalabashi. Algeria: One Belt One Road opens up a new future for Sino-Algerian cooperation. China Invest. 2016, 1, 70–78+8. [Google Scholar]
  58. Xu, F.; EL Hajraoui, C.; Guo, L. Overview of Morocco’s mineral resources and mining investment guide. Land Resour. Inf. 2012, 12, 21–24. [Google Scholar]
  59. Diao, X.; Dorosh, P.A.; Rahman, S.M. Market Opportunities for African Agriculture: A General Equilibrium Examination of Demand-Side Constraints on Agricultural Growth in East and Southern Africa; International Food Policy Research Institute: Washington, DC, USA, 2007; Volume 154. [Google Scholar]
  60. Michalopoulos, S.; Papaioannou, E. Historical legacies and African development. J. Econ. Lit. 2020, 58, 53–128. [Google Scholar] [CrossRef]
  61. Dalyop, G.T. Political instability and economic growth in Africa. Int. J. Econ. Policy Stud. 2019, 13, 217–257. [Google Scholar] [CrossRef]
  62. Zheng, P. Basic Variables Affecting the Degree of Economic Integration in Africa and Empirical Analysis. Ph.D. Thesis, China Foreign Affairs University, Beijing, China, 2009. [Google Scholar]
  63. Quan, Y.; Gao, J. Positioning, progress and prospects of China-Africa economic and trade cooperation under the background of the Belt and Road Initiative. Int. Econ. Coop. 2018, 1, 60–67. [Google Scholar]
  64. Liu, S.; Xu, L. Between “Science” and “Politics”: Knowledge Production in International African Studies in the 20th Century. J. Tsinghua Univ. (Philos. Soc. Sci.) 2024, 39, 47–60. [Google Scholar] [CrossRef]
  65. Qi, J. Research on the World Bank’s African Youth Vocational Skills Training Model from the Perspective of Education Poverty Reduction. Ph.D. Thesis, Northeast Normal University, Changchun, China, 2021. [Google Scholar] [CrossRef]
  66. Li, Y. Research on the Career Development Education Needs and Countermeasures of African Students Studying in China under the Perspective of the Belt and Road Initiative. Silk Road 2024, 182–192. [Google Scholar]
  67. Xu, Y.; Chen, Q.; Shao, G.; Hou, Y.; Zhou, J.; Chen, J. Comparison of Tea Export Competitiveness between China and Africa and Analysis of Trade Potential. Tea 2020, 46, 191–199. [Google Scholar]
  68. Jin, Z. Analysis on the Evolution and Transformation of the Oil Industry in the Republic of Congo. J. Xi’an Shiyou Univ. (Soc. Sci. Ed.) 2024, 33, 73–78. [Google Scholar]
  69. Zhang, Z. Injecting New Impetus into the Economic and Trade Development of Ghana and West Africa. People’s Daily, 10 August 2024; p. 003. [Google Scholar] [CrossRef]
  70. Ruan, S.; Mao, X. Changes in International Aid to Africa and China’s Response. China Foreign Invest. 2025, 50–55. [Google Scholar]
  71. Jin, M. Opportunities, Challenges and Reflections on China-Africa Railway Project Cooperation. Int. Eng. Labor 2024, 79–81. [Google Scholar]
  72. Liu, X. The Development Process of the African Continental Free Trade Area. Int. Bus. Daily 2025, 004. [Google Scholar]
  73. Guo, H.; Li, R. Can Deepening China-Africa Economic and Trade Relations Alleviate Africa’s “Premature Deindustrialization”? From the Perspective of Trade and Investment. Int. Bus. (J. Univ. Int. Bus. Econ.) 2025, 83–101. [Google Scholar] [CrossRef]
Figure 1. French francophone core competitiveness (a), basic competitiveness (b), auxiliary competitiveness (c), and comprehensive competitiveness (d) spatial distribution pattern.
Algorithms 18 00474 g001
Table 1. National competitiveness evaluation program.
Competitiveness RangeCompetitiveness Level
N min N < N min + N max N min / 5 Low competitiveness
N min + N max N min / 5 N < N min + 2 × N max N min / 5 Low to medium competitiveness
N min + 2 × N max N min / 5 N < N max 2 × N max N min / 5 Medium Competitiveness
N max 2 × N max N min / 5 N < N max N max N min / 5 Medium to high competitiveness
N max N max N min / 5 N N max High competitiveness
Table 2. Comprehensive Evaluation System of African French-speaking Countries’ Competitiveness.
Overall
Indicator
Primary IndicatorSecondary
Indicator
Tertiary IndicatorWeightNature
Country

Home

Competition

Fight

Force

N
Core Competitiveness
A
(0.6694)
Economic Level
A1
GDP X1/USD0.0542+
Industrial added value X2/%0.0192+
Value added of service industry X3/%0.0115+
Goods export X4/USD0.0581+
Technological Level
A2
Science and Engineering Indicators X50.0745+
R&D expenditure as a percentage of GDP X6/%0.1472+
R&D researchers X7/million people−10.0739+
High-tech exports X8/USD0.1595+
Patent application number X9/piece0.0926+
Financial Strength
A3
Domestic listed companies X10/0.0854+
Total reserves X11/USD0.1160+
Annual inflation rate X12/%0.0056
Total stock trading volume as a percentage of GDP X13/%0.1021+
Basic Competitiveness
B
(0.2244)
Financial Strength
B1
Railway (total kilometers) X14/km0.1234+
Air transport volume X15/person0.1571+
Container terminal throughput X16/ton0.1733+
Power consumption X17/kWh·person−10.1631+
Energy usage X18/kg oil·person−10.1271+
Quality of Residents
B2
Total public expenditure on education as a percentage of GDP X19/%0.0497+
Secondary school enrollment rate X20/%0.0587+
University enrollment rate X21/%0.0992+
Adult literacy rate X22/%0.0484+
Auxiliary Competitiveness
C
(0.1062)
Government Role
C1
Government revenue as a percentage of GDP X23/%0.1309+
Government expenditure as a percentage of GDP X24/%0.0970+
Central government debt as a percentage of GDP X25/%0.0671
Urbanization rate X26/%0.1013+
Employment rate of population aged 15 and above X27/%0.1110+
Living Environment
C2
GDP per capita X28/US dollar·person−10.3077+
Health care expenditure as a percentage of GDP X29/%0.0964+
Gini coefficient X300.0887
Table 3. Evaluation Criteria for Equal Interval of Competitiveness of French-speaking African Countries.
Core CompetenciesBasic CompetitivenessAuxiliary CompetitivenessComprehensive
Competitiveness
Competitiveness Level
0.4661 ≤ A < 0.47680.4062 ≤ B < 0.43650.5315 ≤ C < 0.53960.4600 ≤ N < 0.4735Low competitiveness
0.4768 ≤ A < 0.48760.4365 ≤ B < 0.46670.5396 ≤ C < 0.54770.4735 ≤ N < 0.4870Low to medium competitiveness
0.4876 ≤ A < 0.49840.4667 ≤ B < 0.49690.5477 ≤ C < 0.55590.4870 ≤ N < 0.5005Medium Competitiveness
0.4984 ≤ A < 0.50910.4969 ≤ B < 0.52720.5559 ≤ C < 0.56400.5005 ≤ N < 0.5140Medium to high competitiveness
0.5091 ≤ A ≤ 0.51990.5272 ≤ B ≤ 0.57220.5640 ≤ C ≤ 0.57220.5140 ≤ N ≤ 0.5275High competitiveness
Table 4. A summary of the evaluation values of 26 French-speaking countries in Africa.
NationCore CompetenciesBasic CompetitivenessAuxiliary
Competitiveness
Comprehensive
Competitiveness
Algeria0.51850.53300.53200.5232
Benin0.49370.53760.54400.5089
Burkina Faso0.49380.51410.53700.5029
Burundi0.48840.50800.53150.4974
Equatorial Guinea0.49540.52450.57220.5101
Togo0.49100.52960.54490.5054
Congo (Brazzaville)0.51460.52950.54270.5209
Democratic Republic of the Congo0.49560.53150.54470.5088
Djibouti0.49470.52810.54510.5075
Guinea0.49170.50430.53700.4993
Gabon0.49560.53530.54660.5099
Cameroon0.49750.53730.54020.5110
Comoros0.48250.51150.53720.4948
Ivory Coast0.49750.55740.54510.5160
Rwanda0.49110.50980.53410.4999
Madagascar0.49290.51760.53180.5025
Mali0.49280.51090.53170.5010
Mauritius0.50800.52790.56850.5189
Mauritania0.49190.51620.54010.5025
Morocco0.51990.54050.54820.5275
Niger0.49090.49430.53350.4962
Senegal0.49840.52940.54570.5104
Seychelles0.50270.52270.56900.5142
Tunisia0.51650.53480.54200.5233
Chad0.51960.42130.54330.5000
Central Africa0.46610.40620.53560.4600
Table 5. Adaptive-LASSO algorithm results.
Variable NameCorrelation
Coefficient
t StatisticRelevancep-Value
X_10.38213.520.8560.001
X_2−0.2153−2.89−0.7240.005
X_30.45724.110.8920.000
X_40.29853.050.8130.002
X_5−0.1867−2.23−0.6880.028
X_60.51244.870.9210.000
X_70.35463.330.8370.001
X_80.42354.020.8790.000
X_90.26542.780.7950.006
X_{10}0.31783.190.8250.003
X_{11}0.48914.660.9050.000
X_{12}−0.1235−1.67−0.5420.098
X_{13}0.28432.910.8020.004
Table 6. Comparison results of adaptive LASSO and alternative methods.
Method Number of
Filter Variables
Core Factor
Overlap Rate
BIC ValueKey Flaws
Adaptive-LASSO875%126.8-
Traditional LASSO1262.5%142.3Keep redundant variables
Ridge regression 3050%189.5Unable to remove variables
Random forest 862.5%138.5Missing the key factor “R&D expenditure”
Disclaimer/Publisher’s Note: The statements, opinions and data contained in all publications are solely those of the individual author(s) and contributor(s) and not of MDPI and/or the editor(s). MDPI and/or the editor(s) disclaim responsibility for any injury to people or property resulting from any ideas, methods, instructions or products referred to in the content.

