Abstract
Faced with complex, ever-changing battlefield environments and diverse attacks, enabling warship combat systems to recover rapidly and effectively after damage is key to enhancing resilience and sustained combat capability. We construct a representative naval battle scenario and propose an integrated Attack-Defense-Recovery Strategy (ADRS) grounded in warship system models for different attack types. To address high parameter sensitivity, weak initial pheromone feedback, suboptimal solution quality, and premature convergence in traditional ant colony optimization (ACO), we introduce three improvements: (i) grid-search calibration of key ACO parameters to enhance global exploration, (ii) a non-uniform initial pheromone mechanism based on the wartime importance of equipment to guide early solutions, and (iii) an ADRS-consistent state-transition rule with group-based starting points to prioritize high-value equipment during the search. Simulation results show that the improved ACO (IACO) outperforms classical ACO in convergence speed and solution optimality. Across torpedo, aircraft/missile, and UAV scenarios, ADRS-ACO improves over GRS-ACO by 7.2%, 0.3%, and 5.5%, while ADRS-IACO achieves gains of 34.9%, 17.1%, and 16.7% over GRS-ACO and 25.9%, 16.7%, and 10.6% over ADRS-ACO. Overall, ADRS-IACO consistently delivers the best solutions. In high-intensity, high-damage torpedo conditions, ADRS-IACO demonstrates superior path planning and repair scheduling, more effectively identifying critical equipment and allocating resources. Moreover, under multi-wave combat, coupling with ADRS effectively reduces cumulative damage and substantially improves overall warship-system resilience.
1. Introduction
With the rapid development of a new round of world technological revolution and military transformation, intelligent warfare is rapidly becoming an important direction for the future [1]. The sea battlefield is one of the important confrontation situations in military, with complex and varied forms involving scenes in the air, on the water, and underwater.
In the face of complex battlefields and sustained attacks, warship systems must have the ability to complete damage assessment, rapid repair, and restore combat functions in a very short period of time. Therefore, system resilience is an important indicator to measure this ability [2]. System resilience refers to the ability to anticipate, counteract, absorb, react, adapt, and recover from external disturbances or changes [3,4,5]. Building a highly resilient system is not only a key principle in modern equipment design and use, but also a prerequisite for maintaining sustained combat capability in multi waves and uncertain confrontations.
In recent years, although deep learning and reinforcement learning have been applied to intelligent maintenance and recovery, there are still limitations in warship combat scenarios: (1) those algorithms rely on a large number of high-quality data, while the actual combat and exercise data are scarce, which is difficult to meet the training needs; (2) the battlefield situation is changeable, so it is necessary to quickly generate recovery strategies. However, the model based on offline training cannot cover all situations and cannot respond in real time; (3) in contrast, ACO has the advantages of simple structure, high efficiency and strong adaptability, which is more suitable for the warship system recovery in situations including high real-time, complexity and data shortage.
Recent studies have shown that ACO [6,7,8] is widely used in path optimization, scheduling, and system recovery. Zhou et al. [9] conducted simulation experiments on the flight path of unmanned aerial vehicles using an improved ACO to find safe and effective routes, achieving accurate identification of insulators and improving the efficiency of unmanned aerial vehicle inspections. Guo et al. [10] proposed a schedulable aware routing algorithm (SAR) based on an improved ACO for non-waiting scheduling of tasks in time sensitive networks. The experiment showed that the algorithm had a significantly better scheduling success rate than traditional methods under different network loads, indicating that the improved ACO has strong solving ability under complex constraint conditions. Ikhar et al. [11] proposed an intrusion detection method that combines VAE and improved ACO, which optimizes decision boundaries through ACO and improves the accuracy of anomaly detection. The experiment showed that this method is superior to traditional methods, reflecting its potential for application in network security and system resilience improvement.
In recent years, research on intelligent maintenance of warship systems has made positive progress. Reference [12] proposed the Smart Maintenance Decision Support Systems (SMDSSs) based on big data for optimizing maintenance strategies and lifecycle management. Reference [13] constructed a transformation framework for intelligent maintenance factories, expanding the application of intelligent manufacturing in the warship service phase. Reference [14] proposed the HIRAL method that integrates AHP, DEA, and target feasibility analysis, achieving reliability optimization in component level. Reference [15] constructed an attack tree model of warship system, identified and validated 20 network attack paths, and improved the systematic modeling of maritime network security. Although there have been significant research results on intelligent maintenance [12,13] of warship systems [14,15], there are still many shortcomings: ① when warships are under different types of attacks, intelligent maintenance for the comprehensive importance of warship equipment has not been considered; ② in the intelligent maintenance algorithm, all damaged equipment have the same importance, different wartime importance are not assigned based on the different type of attack, and attack and defense attributes of different equipment are not distinguished, thus failing to achieve better wartime intelligent maintenance and recovery effects; ③ Most studies focus on the system resilience process under single interference and attack, with less consideration on the complete system resilience and recovery process under multi attack waves.
Therefore, this paper considers the recovery problem of ships subjected to multiple waves of enemy attacks during combat and summarizes it as a parallel maintenance problem with multiple constraints. The Attack-Defense-Recovery Strategy (ADRS) idea is proposed, and the wartime importance of equipment under different attack types is analyzed. The initial pheromone concentration of the ACO is improved by non-uniform distribution to enhance the initial pheromone concentration feedback of the algorithm. Finally, a search rule for starting point classification is proposed based on the ADRS idea, which strengthens the state transition probability of combat-capable equipment pairs and studies the resilience of ship systems.
The structure of this paper is arranged as follows: Section 1 introduces the research background, motivation, and existing limitations in warship system resilience and intelligent maintenance. Section 2 presents the basic methods used in this study, including the definition of resilience metrics and the modeling of the ADRS. Section 3 develops a comprehensive modeling framework for multi-wave attack–defense scenarios, covering the modeling of attack types, defense systems, damage effects, and recovery processes. Section 4 describes the design of the IACO and elaborates on its implementation for repair path optimization under multi-wave combat conditions. Section 5 conducts simulation experiments under various attack scenarios—including torpedo strikes, aircraft/missile attacks, and UAV swarm attacks to compare algorithm performance and evaluate system resilience outcomes. Finally, Section 6 concludes the paper and summarizes the research results.
2. Fundamental Approaches
2.1. Quantification of Resilience
In the field of systems engineering, resilience is usually evaluated by quantitative methods. The following section introduces a representative generic metric, the quotient resilience model.
The quotient resilience model takes the ratio between recovery performance and performance degradation as the measurement standard of the system resilience. The model provides a static resilience evaluation method at a specific time, and its analysis process is based on discrete performance. This model is also called “non-time varying resilience model” [16], and the specific form is shown in Formula (1).
In this equation, represents the system’s resilience at time , denotes the system’s recovered performance at that time, and refers to the performance degradation experienced at the disturbance time.
This paper adopts the quotient resilience model to quantitatively analyze system resilience under multi-wave attacks in different combat conditions.
2.2. Attack-Defense-Recovery Strategy
In the engineering domain, the recovery strategy has a direct impact on efficiency. Wang et al. [17] addressed power supply interruptions in distribution networks caused by extreme events, internal faults, and scheduled maintenance. They proposed a fault recovery strategy that accounts for multiple failure scenarios. Simulation results demonstrated that the proposed strategy significantly improved both recovery efficiency and power supply reliability. Wan et al. [18] focused on the decline in flight punctuality due to abnormal operations and developed an evaluation method for abnormal flight recovery strategies tailored to airline operations control centers. Validation results showed that this method effectively enhances the executability of decision-making and provides flight dispatchers with a scientific and practical tool for strategy assessment.
Recovery strategies for warship systems also vary based on mission objectives [19]. Maintenance tasks [20,21,22] in wartime scenarios are generally with strict and real-time conditions. This paper studies and discusses the optimal maintenance strategy [23] of warships facing multiple waves of attacks, then proposed the Attack-Defense-Recovery Strategy (ADRS).
The core idea of this recovery strategy is as follows:
Facing the characteristics of heavy maintenance tasks and complex environment in multi-wave attack and defense operations [24,25,26], it is necessary to dynamically adjust the importance of equipment according to different attack scenarios. In the case of short attack intervals in each round, the system evaluates the importance of each equipment in real time under the current wartime attack and accurately determines the priority equipment for maintenance in the current situation.
At the same time, the system classifies the equipment according to their functions, prioritizes the key equipment with combat functions to enter the maintenance sequence, and strengthens the active combat and defense capability. It also defines the wartime importance of different equipment types in response to different attack modes. Based on the calculation results of the recovery algorithm, maintenance priority is more inclined to the equipment that can effectively respond to the next wave of attacks, so as to reduce system damage in multiple rounds of attacks and improve the overall survivability and system flexibility.
In order to verify the effect of this strategy, this paper introduces the general recovery strategy (GRS) as a compare. GRS adopts static and fixed equipment importance, which is not adjusted with the change in enemy attack modes. The specific performance is that the importance of all equipment in the system remains unchanged during the recovery process, without distinguishing between equipment types and combat tasks, which belongs to a single recovery mechanism without adaptability.
3. Multi-Wave Attack–Defense Modeling
3.1. Multi-Wave Attack Modeling
To simulate multiple modes of typical attack, this paper comprehensively considers the explosive strength and interception difficulty of weapons, selects three representative attack modes, and constructs a multi-wave simulation model according to the attack threat. There are differences in explosion yield, attack direction, and spatial distribution of landing points in different attacks. Based on this, a multi-wave attack matrix is constructed.
To capture diverse combat dynamics, the simulation incorporates three representative attack modes, each reflecting distinct operational characteristics. Underwater torpedo attacks embody heavy, high-threat strikes launched from beneath the ship and are the most challenging to intercept. High-altitude aircraft or missile attacks constitute medium-intensity threats approaching from above, with comparatively lower interception difficulty. Low-altitude UAV swarm attacks simulate continuous, high-frequency harassment, leveraging large numbers of small targets to overwhelm defensive responses.
In the simulation scenario, an unidentified type of attack is initiated every 30 min, resulting in a total of mmm waves, with its attack sequence represented by . The formulation of is provided in Formula (2).
In Formula (2), the multi-wave attack matrix is defined, consolidating all attack events over msuccessive waves. Each event is represented by a five-dimensional tuple , where denotes the index of the -th attack unit in the -th wave, tnti indicates its explosive power, and specifies the three-dimensional impact coordinates. Hence, provides a structured dataset that captures both the spatial distribution and threat characteristics for all attack units in the multi-wave scenario.
3.2. Defense System Representation
Warship defense system is the key system to ensure the effective interception and attack of ships against enemy attack in wartime. In this paper, the defense system model is constructed from the aspects of equipment composition, equipment importance, and combat function.
- (1)
- Equipment information
In order to more accurately simulate the shipborne system environment, the length, width, and height of the ship body are set as basic parameters, and a three-dimensional model containing 50 equipment is constructed accordingly. All equipment is divided into basic equipment, combat equipment, and auxiliary equipment according to their functions. The classification is presented in Appendix A Table A1.
- (2)
- Combat equipment capability
Combat equipment mainly includes detection and interception, whose performance directly determines the system’s ability to recognize and intercept enemy targets, and then affects the overall combat effect. The equipment capability is quantified by the floating-point value in the [0, 1] interval. The higher the value, the stronger the performance. The specific capacity values of each piece of equipment are listed in Appendix A Table A2.
- (3)
- Equipment maintenance information
Each equipment contains key maintenance information such as space location, type of required spare parts, and maintenance time. The relevant data are listed in Table A3 of Appendix A.
- (4)
- Equipment importance
- (a)
- Definition and distribution of importance
The recovery ability of the system after being attacked depends on the effective repair of key equipment in the maintenance process. No matter which specific recovery strategy is adopted, the repair of the equipment should be carried out according to priority under multiple constraints, and the importance of the equipment is the core guidance.
The Attack-Defense-Recovery Strategy (ADRS) proposed in this paper aims to reduce the damage of the system under multi-wave attacks and emphasizes the priority to repair the key equipment of the operation, so as to maintain the detection and attack ability of the warship. In order to adapt to different combat scenarios, this paper sets the wartime importance level for each equipment to guide the adaptive maintenance sequencing and resource allocation.
The equipment importance is quantified as an integer value of 1 to 6, covering the basic importance and scenario specific weight under different combat backgrounds. In highly task-related scenarios, equipment is rated as highly important (Level 5–6), medium level (3–4) in moderately relevant scenarios, and low importance (Level 1–2). Detailed importance values for each piece of equipment under various attack scenarios are provided in Appendix A Table A4.
- (b)
- Equipment wartime importance calculation
Equipment wartime importance is the key basis to measure maintenance priority in the ADRS strategy, and it is also the core parameter of algorithm optimization. This indicator will be dynamically adjusted according to the current combat environment, reflecting the adaptability of each equipment to the combat task. Equipment with high importance indicates that it has strong support for the current situation and helps the system resist enemy attacks. On the contrary, low importance indicates that the equipment has limited role in the current mission or lacks combat capability. The specific calculation rules of equipment wartime importance, are shown in Formula (3):
where is the importance matrix of equipment, represents the attack type of attack , is the number of attacks in the current wave.
3.3. Damage Modeling Framework
Following an enemy attack, system equipment suffers damage. To describe the degree of damage sustained by the equipment under each wave of attack, we introduce the system equipment damage level matrix, .
In the above Formula (4), represents the degree of damage caused by the enemy attack on the equipment , represents the collection of enemy attacks that have successfully penetrated in the current wave, represents the first equipment coordinate of the equipment, and m represents the last equipment coordinate of the equipment.
The destructive effects of the shock waves were evaluated with the explosion impact model, the explosion-shock model, described in Ref. [16]. The overpressure criterion states that when the overpressure of the shock wave reaches a certain value, it will cause certain damage and destruction to the target. Referring to the empirical formula of M.A. Saldovsky, the air shock wave overpressure ΔP is given as Formula (5):
where is the overpressure value of the air shock wave (105 Pa), is the equivalent distance (m), is the distance from the equipment to the explosion center (m), and is the equivalent of the attack weapon (kg). According to the relationship between shock wave overpressure and damage radius, it can be concluded that, under the same explosive yield, the farther away from the explosion center, the less affected the equipment are by the shock wave. Convert the shock wave overpressure experienced by the system equipment into damage level and refine the damage situation of the equipment. Please refer to Table 1 for specific descriptions.

Table 1.
Damage assessment.
3.4. Recovery Objective Formulation
The optimization objective of the recovery problem is to maximize the total importance of the recovered equipment under multiple constraints. On this basis, in order to meet the priority repair strategy of combat equipment according to the ADRS, different weight calculation measures are taken for the importance of different types of equipment, which can be expressed as Formulas (7) and (8). The optimal solution of the recovery problem is the maintenance path that makes f obtain the maximum value.
where represents the importance of the equipment repaired by the k-th maintainer, represents the maintainer ID, represents the serial number of the equipment, represents the maintenance start equipment of maintainer , represents the maintenance end equipment of maintainer , S represents the number of maintainers, and represents the combat equipment in the current environment.
In ant colony optimization (ACO), pheromone-related parameters determine the state-transition probability and pheromone update, thus influencing the algorithm throughout its execution. Consequently, how to set these parameters is a key direction for improving ACO. Traditional empirical tuning suffers from randomness and weak evidential support, making it difficult to compare parameter combinations effectively. To address this, we adopted a three-step procedure to determine the parameters:
(1) Initial settings. Based on the empirical relation (where is the number of cities, and is the number of ants), we determine and obtain an approximate value of the pheromone constant via coarse tuning. This yields the initial configuration = 50 and = 20.
(2) Grid search for core parameters. Because , , and have the greatest impact on performance, we use a grid search to determine their optimal combination. To reduce confounding factors, we construct a single-wave maintenance scenario (multi-wave scenarios feature large variability in battlefield conditions and damaged nodes, making control difficult). The objective function is based on ADRS and is defined for a multi-depot MTSP without returning to the depots (see Formula (7)). The parameter search space is:
(3) Result screening and finalization. First, in accordance with the ADRS concept, we retain only solutions whose coverage of maintenance task nodes is at least 80%. We then rank the remaining solutions by the objective value and select the parameter set associated with the best solution. The final parameters are:
In summary, our parameter-setting workflow starts from interpretable empirical initialization and, through systematic grid search under a controlled scenario together with an ADRS-based objective, obtains parameter settings that are more persuasive and reproducible than purely empirical choices.
4. Improved Ant Colony Optimization
Despite the advantages of ant colony optimization (ACO), including its ease of integration, powerful search capability, and notable robustness, the algorithm still suffers from inherent drawbacks that warrant further attention:
- (1)
- ACO relies too much on parameter settings.
- (2)
- The equipment transition guidance in the early stage of the algorithm is weak.
- (3)
- ACO tends to mature prematurely and fall into local optimality.
According to the shortcomings mentioned above, this paper improves the ACO from these three directions:
- (1)
- Because the parameters related to pheromone control the state transition probability, pheromone increment, etc., and are always present throughout the algorithm. In view of the uncertainty of the hyperparameters of the ACO, this paper adopts the grid search method to determine more reasonable values of , , and . According to the rules of thumb, it is determined that the value range of is [0, 5], the value range of is [0.1, 3], the search range of is [0.1, 1], and the step size is 0.1.
Analyze the operation results and determine the parameters. First, in order to comply with the recovery idea of ADRS, all models with no less than 80% combat equipment in maintenance were screened out. Then, the objective functions of the models were sorted, and the initial parameters corresponding to the optimal solution were selected, that is, , , .
- (2)
- To solve the problem of weak guidance in the initial stage of the ACO, we analyze from the setting of the initial pheromones and reasonably distribute the initial pheromones to speed up the algorithm. Therefore, in this paper, the “non-uniform initial pheromone” is set at the beginning of the ACO, so that the initial optimization of the ants will have directionality and speed up the convergence. According to the recovery idea of ADRS in Section 2.2, if we want to minimize damage to the system, we should give priority to repairing equipment with combat capability. So that the system can take the initiative in multi-wave operations as soon as possible. Therefore, it is necessary to prioritize the repair of combat equipment in the current combat scenario. The uneven pheromone distribution mode is adopted according to the wartime importance of equipment, which makes the initial pheromone concentration of equipment with higher importance, and increases the transfer probability to equipment with high importance. The calculation formula of equipment non-uniform pheromone concentration matrix is as Formula (9):
In Formula (9), represents the initial pheromone concentration from equipment to equipment , and represents the wartime importance of equipment . The purpose of subtracting from the formula is to reduce the transition from high-importance equipment to low-importance equipment.
- (3)
- In view of the problem that the ACO is prone to falling into local optimality, this paper proposes an improved strategy of “classification of starting points within the group”. The core idea of the improvement is still based on ADRS, giving priority to maintenance of combat equipment to ensure the combat capability of the system, reducing the degree of damage in subsequent waves, and thus alleviating maintenance pressure.
The improved “classification of starting points within the group” strategy is specifically described as follows: First, determine the combat-type equipment () that are suitable for the current environment based on the combat scenario. When the ants in the group begin their initial departure, one equipment is randomly selected from the as the starting point. When an ant reaches the stopping condition, but there is still equipment that needs repair, a second ant is dispatched to continue the repair task. The second ant will inherit the taboo list of the first ant’s repaired equipment. Meanwhile, the second ant’s starting equipment is still prioritized to be randomly chosen from the . If no are available for selection, meaning all in the current wave have been repaired, then the initial equipment will be randomly selected from the remaining unprocessed equipment. This procedure is followed for subsequent ants in the group, continuing until all damaged equipment is repaired or the maximum number of ants in the group is reached, thereby ending the repair process for the current wave.
- (4)
- The multi-wave combat process of IACO is described as:
| Start |
| Initialize algorithm parameters and data (e.g., equipment positions, task importance, iteration settings, etc.) |
| For wave = 1 to totalWaveNum |
| For each antGroup (1 to totalGroupNum) |
| Generate ant group population; |
| For each ant in antGroup: |
| Inherit taboo list; |
| Generate initial repair equipment using classification rules; |
| Compute movement time from last wave; |
| While repair task is not completed: |
| Select next repair equipment based on state transition table; |
| If repair constraints are satisfied: |
| Perform repair; |
| Update spare parts status and taboo list; |
| Else: |
| Generate sub-feasible solution; |
| End If |
| End While |
| End For |
| Combine sub-feasible solutions into complete feasible solution; |
| Evaluate solution quality (using Formula (9)); |
| If current solution better than global best: |
| Update global best; |
| End If |
| End For |
| Update pheromone matrix using all current ant solutions; |
| If max iteration not reached: |
| Continue to next iteration; |
| End If |
| End For |
| Output global best repair path; |
| End |
5. Algorithmic Performance Comparison
Experiments were conducted in Python 3.10 (conda) on a Windows 11 workstation equipped with a Ryzen 9 7945HX CPU, 32 GB RAM, and an RTX 4060 GPU.
In order to intuitively display the advantages of ADRS and the improvement of the IACO, this section quantitatively analyzes its advantages by comparing various algorithms under different combat scenarios. The combat scenarios are divided into three categories: torpedo attack, aircraft/missile attack, and UAV group attack. The specific information of the enemy attack has been given in Section 3.1. There are five waves of attacks in different combat scenarios, and each wave contains several enemy attacks of the same type but with different damage and impact positions.
When the first attack wave is over, each equipment in the system will be damaged to different degrees according to the explosive yield and impact position of the attack. After the algorithm calculates the maintenance path, it will resist the next wave of attack. By observing the final objective function values of different algorithms, we can judge whether the IACO can give better maintenance. By observing the damage of the system after the next attack, we can judge whether the maintenance of the previous attack can effectively reduce the damage of the system, or observe whether the overall damage of the system has been reduced in five wave attacks, to determine whether the IACO has optimized the system resilience and whether ADRS is effective in multi wave attacks.
In order to intuitively show the advantages of ADRS and the improvement of the IACO, three groups of comparative experiments are proposed, respectively:
- (1)
- Multi-wave combat simulation based on generic recovery strategy (GRS) and traditional ant colony algorithm (GRS-ACO )
- (2)
- Multi-wave combat simulation based on ADRS and traditional ant colony algorithm (ADRS-ACO)
- (3)
- Multi-wave combat simulation based on ADRS and IACO (ADRS-IACO)
At the beginning of the IACO, each group of ant colony will initialize the pheromone concentration matrix between equipment. Figure 1 shows the heat map of the initial pheromone concentration with uniform distribution, and Figure 2 shows the heat map of the initial pheromone concentration with non-uniform distribution in various combat scenarios.
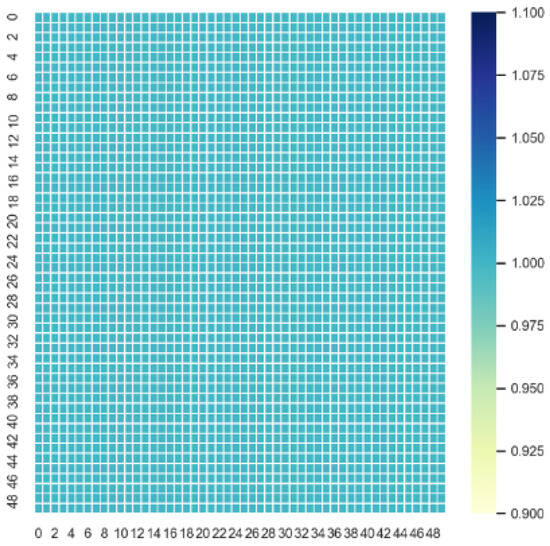
Figure 1.
Uniformly distributed initial pheromone concentration.

Figure 2.
Non-uniformly distributed initial pheromone concentration. (a) Torpedo, (b) Aircraft/Missile, (c) UAV swarm.
As shown in Figure 1, the uniformly distributed pheromone concentration matrix results in equal initial equipment transition probabilities. While this approach increases randomness in solution searching, it also delays convergence toward the optimal solution. The non-uniform pheromone concentration matrix with heat map as Figure 2, calculated according to Equation (9), increases the transition probability from equipment with lower importance to equipment with higher importance, guiding ants toward more optimal paths. Simultaneously, it reduces the probability of transitioning from high-importance equipment to lower-importance equipment, thus preventing ants from deviating from optimal choices.
In subsequent combat simulations, the ACO utilizes the uniformly distributed initial pheromone concentration matrix shown in Figure 1, whereas the IACO employs the initial pheromone concentration matrix with non-uniformly distribution depicted in Figure 2.
5.1. Simulation Under Torpedo Attack Scenarios
This subsection simulates the resilience and analysis recovery performance of three comparative groups based on ant colony algorithms under a five-wave torpedo attack scenario.
- (1)
- Simulation results and analysis under the first wave of torpedo attack
Prior to the enemy’s attack, all equipment within the naval system is fully operational. After the first wave of torpedo attack, the system suffered extensive damage, causing nearly all equipment to fail and leading to a severe maintenance challenge. The final repair sequences for the three comparative groups in this wave are presented in Figure 3.
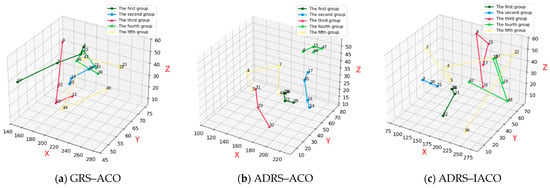
Figure 3.
Repair paths under the first wave of torpedo attacks.
Figure 3a presents the repair and recovery paths obtained under constraints using the GRS-ACO. The dark green, light blue, red, light green, and yellow lines represent the maintenance routes of the five ants in the group. Among these, the combat equipment associated with the current torpedo combat scenario includes equipment 15 and 17.
Figure 3b presents the repair and recovery paths obtained using the ADRS-ACO. The combat equipment associated with the current torpedo combat scenario includes equipment 33, 18, 34, 17, 16, 32, 31, and 15.
Figure 3c presents the repair and recovery paths obtained using the ADRS-IACO, in which all combat equipment associated with the current torpedo combat scenario are successfully repaired.
Figure 4 presents the convergence process of the objective function during the algorithm iterations of the three comparative groups under the first torpedo attack.
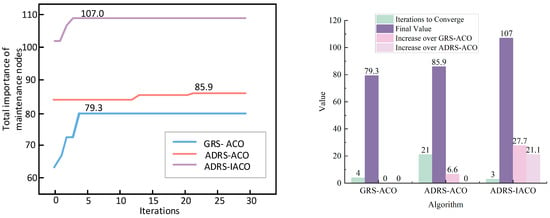
Figure 4.
Algorithm iteration under the first wave of torpedo attack.
As shown in Figure 4 and Table 2, the light-blue line represents the iterative process of the objective function of the GRS-ACO, converging to a final solution of 79.3 at the 4th iteration. The light-red line represents the iterative process of the ADRS-ACO, converging to a Final Solution of 85.9 at the 21st iteration. The light-purple line illustrates the iterative process of the ADRS-IACO, converging to a Final Solution of 107 at the 3rd iteration.

Table 2.
Comparison of algorithm convergence, optimization effectiveness, and improvement under the first wave of torpedo attack.
- (2)
- Simulation results and analysis under the second wave of torpedo attack
Figure 5a presents the repair and recovery paths obtained under constraints using the GRS-ACO. The combat equipment associated with the current torpedo combat scenario includes equipment 15, 16, 17, and 18.
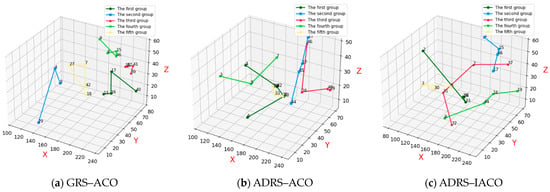
Figure 5.
Repair results under the second wave of torpedo attacks.
Figure 5b presents the repair and recovery paths obtained using the ADRS-ACO. The combat equipment associated with the current torpedo combat scenario includes equipment 17, 15, 19, 16, 34, 18, and 33.
Figure 5c presents the repair and recovery paths obtained using the ADRS-IACO, in which all combat equipment associated with the current torpedo combat scenario are successfully repaired.
Figure 6 presents the convergence processes of the objective function for the three comparative experiments during the current wave.
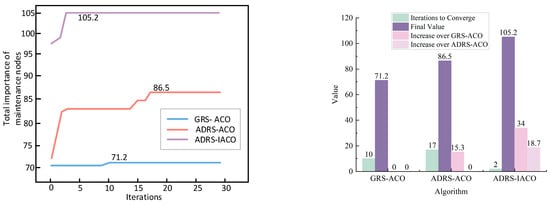
Figure 6.
Algorithm iteration under the second-wave torpedo attack.
As shown in Figure 6 and Table 3, the light-blue curve represents the iteration process of the GRS-ACO, whose objective function converges to 71.2 at generation 10. The light-red curve corresponds to the ADRS-ACO, reaching convergence at generation 17 with a value of 86.5. The light-purple curve shows the ADRS-IACO, which converges at generation 2 with an objective-function value of 105.2. These results confirm that ADRS provides effective guidance for optimizing the objective function, and that the IACO, benefiting from a higher initial objective value, achieves superior performance compared with ACO.

Table 3.
Comparison of algorithm convergence, optimization effectiveness, and improvement under the second wave of torpedo attack.
- (3)
- Simulation results and analysis under the third wave of torpedo attack
Figure 7a presents the repair and recovery paths obtained under constraints using the GRS-ACO. The combat equipment associated with the current torpedo combat scenario includes equipment 17 and 19.
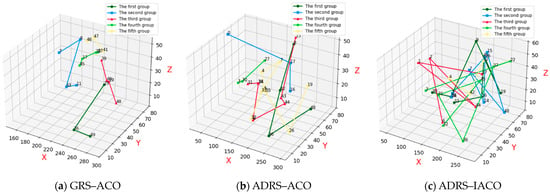
Figure 7.
Repair result under the third-wave torpedo attack.
Figure 7b presents the repair and recovery paths obtained using the ADRS-ACO, in which all combat equipment associated with the current scenario is successfully repaired.
Figure 7c presents the repair and recovery paths obtained using the ADRS-IACO, also achieving successful repair of all relevant combat equipment.
Figure 8 presents the convergence processes of the objective function for the three comparative groups during the current attack wave.
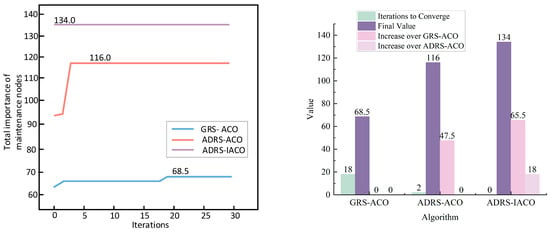
Figure 8.
Algorithm iteration under the third-wave torpedo attack.
As shown in Figure 8 and Table 4, the light-blue curve represents the iteration process of the GRS-ACO, with the objective function converging to 68.5 at generation 18. The light-red curve corresponds to the ADRS-ACO, which converges to 116 at generation 2. The light-purple curve represents the ADRS-IACO, where the objective function reaches 134 from the very beginning. These results clearly demonstrate the superior optimization performance of the ADRS-IACO, including solution and convergence.

Table 4.
Comparison of algorithm convergence, optimization effectiveness, and improvement under the third wave of torpedo attack.
In the subsequent fourth and fifth waves of attack, the system based on ADRS remained undamaged due to effective recovery, resulting in relatively light maintenance workloads and allowing the system to gradually recover. In contrast, the GRS-based system, due to previously suboptimal repair strategies, failed to intercept the follow-up enemy attacks. A detailed analysis of system resilience is provided in Section 5.4.
5.2. Simulation Under Aircraft/Missile Attack Scenarios
This subsection simulates the resilience and analysis recovery performance of three comparative groups based on ACO under a five-wave aircraft/missile attack scenario.
- (1)
- Simulation results and analysis under the first wave of aircraft/missile attacks
Prior to the onset of enemy attacks, all equipment within the naval system was fully operational. Upon the arrival of the first wave of aircraft/missile attacks, the system sustained damage. The damaged equipment assigned for repair in each group are listed below.
Figure 9a presents the repair and recovery paths obtained using the GRS-ACO. The combat equipment associated with the current aircraft/missile combat scenario includes equipment 23, 22, 21, 13, 11, and 14.
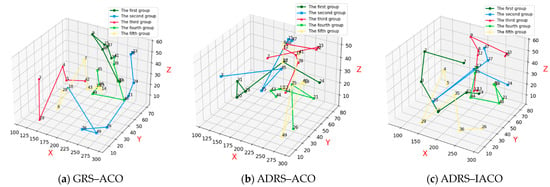
Figure 9.
Repair result under the first wave of aircraft/missile attack.
Figure 9b presents the repair and recovery paths obtained using the ADRS-ACO, in which all relevant combat equipment is successfully repaired.
Figure 9c presents the repair and recovery paths obtained using the ADRS-IACO, also achieving successful repair of all relevant combat equipment.
Figure 10 presents the convergence processes of the objective function for the three comparative groups under the current attack wave.
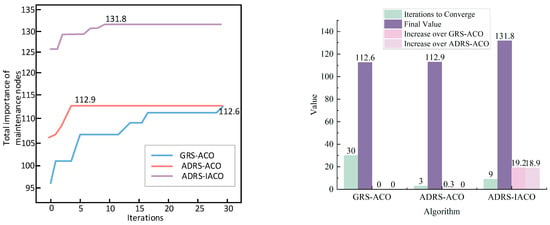
Figure 10.
Algorithm iteration under the first wave of aircraft/missile attack.
As shown in Figure 10 and Table 5, the light-blue curve represents the iteration process of the GRS-ACO, with the objective function reaching 112.6 at generation 30. The light-red curve corresponds to the ADRS-ACO, which converges to 112.9 at generation 3. The light-purple curve represents the ADRS-IACO, with the objective function converging to 131.8 at generation 9. These results clearly indicate that the IACO demonstrates significantly stronger optimization capability than the traditional ACO, enabling the prioritized repair of combat equipment and more effective enhancement of the objective function.

Table 5.
Comparison of algorithm convergence, optimization effectiveness, and improvement under the first wave of aircraft/missile attack.
- (2)
- Simulation results and analysis under the second wave of aircraft/missile attacks
Figure 11a presents the repair and recovery paths obtained using the GRS-ACO, in which all combat equipment is successfully repaired.
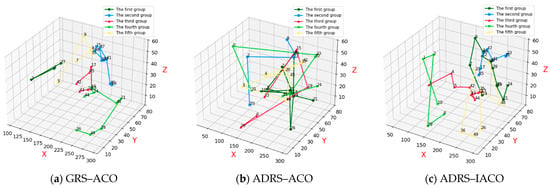
Figure 11.
Repair result under the second-wave aircraft/missile attack.
Figure 11b presents the repair and recovery paths obtained using the ADRS-ACO, also achieving complete restoration of all combat equipment.
Figure 11c presents the repair and recovery paths obtained using the ADRS-IACO, where all combat equipment associated with the current combat scenario is successfully repaired.
Figure 12 presents the convergence processes of the objective function for the three comparative groups during this attack wave.
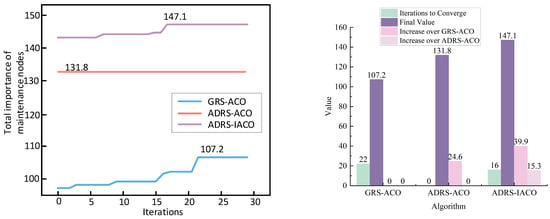
Figure 12.
Algorithm iteration under the second-wave aircraft/missile attack.
As shown in Figure 12 and Table 6, the light-blue curve represents the iteration process of the GRS-ACO, with the objective function reaching 107.2 at generation 22. The light-red curve corresponds to the ADRS-ACO, which reaches 131.8 at the early stage of the iteration. Although it becomes trapped in a local optimum in subsequent iterations, it still maintains a higher objective value compared to the GRS-based model, indicating that ADRS offers improved optimization capability over GRS. The light-purple curve represents the ADRS-IACO, which converges to 147.1 at generation 16, further demonstrating the enhanced optimization capability of the ADRS-based improved recovery system.

Table 6.
Comparison of algorithm convergence, optimization effectiveness, and improvement under the second wave of aircraft/missile attack.
In the subsequent third, fourth, and fifth waves of attack, no further damage occurred in any of the three experimental groups, as aircraft/missile attacks were comparatively easier to recover and intercept than torpedoes, and the equipment gradually recovered. A detailed analysis of system resilience is provided in Section 5.4.
5.3. Simulation Under UAV Swarm Attack Scenarios
This subsection simulates the resilience and analysis recovery performance of three comparative groups based on ACO under a five-wave UAV attack scenario.
- (1)
- Simulation results and analysis under the first wave of UAV swarm attacks
Prior to the onset of enemy attacks, all equipment in the naval system was fully operational. Following the arrival of the first wave of unmanned aerial vehicle (UAV) attacks, the system suffered extensive damage, resulting in the failure of all equipment and presenting a highly challenging repair task.
Figure 13a presents the repair and recovery paths obtained using the GRS-ACO. The combat equipment associated with the current UAV swarm combat scenario includes equipment 14, 12, 11, 13, 27, and 28, totaling six.
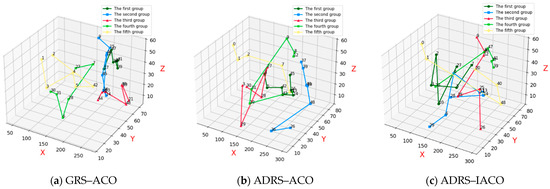
Figure 13.
Repair paths under the first wave of UAV swarm attacks.
Figure 13b presents the repair and recovery paths obtained using the ADRS-ACO. The relevant combat equipment includes equipment 14, 26, 29, 27, 10, and 11, also totaling six.
Figure 13c presents the repair and recovery paths obtained using the ADRS-IACO, in which equipment 27, 10, 29, 11, 14, and 26 are all successfully repaired.
Figure 14 presents the convergence processes of the objective function for the three comparative groups during the current wave of attack.
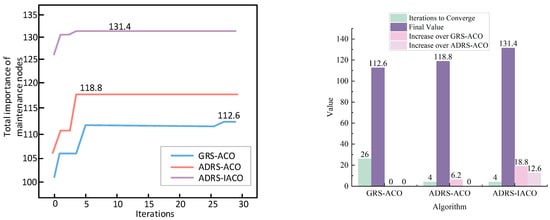
Figure 14.
Algorithm iteration under the first wave of UAV swarm attacks.
As shown in Figure 14 and Table 7, the light-blue curve represents the iteration process of the GRS-ACO, with the objective function reaching 112.6 at generation 26. The light-red curve corresponds to the ADRS-ACO, which converges to 118.8 at generation 4. The light-purple curve represents the ADRS-IACO, which also converges at generation 4, achieving a higher objective function value of 131.4.

Table 7.
Comparison of algorithm convergence, optimization effectiveness, and improvement under the first wave of UAV swarm attack.
These results clearly demonstrate that the IACO exhibits significantly stronger optimization capability than the ACO, effectively maximizing the objective function while prioritizing the repair of combat equipment.
- (2)
- Simulation results and analysis under the second wave of UAV swarm attacks
Figure 15a presents the repair and recovery paths calculated using the GRS-based traditional ant colony algorithm, in which the combat equipment relevant to the current UAV swarm combat scenario include equipment 14, 27, 11, 12, and 13, totaling five.
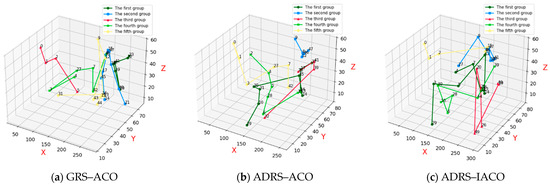
Figure 15.
Repair paths under the second wave of UAV swarm attacks.
Figure 15b presents the repair and recovery paths derived from the ADRS-based traditional ant colony algorithm, with combat equipment including 29, 10, 14, 11, and 27, also totaling five.
Figure 15c presents the repair and recovery paths computed using the ADRS-based IACO, where the combat equipment includes 29, 14, 11, 27, 26, and 10, totaling six.
These paths reflect the respective algorithms’ ability to prioritize and repair key combat-relevant equipment under the second wave of UAV swarm attacks.
As shown in Figure 16 and Table 8, the light-blue curve represents the iteration process of the GRS-ACO, with the objective function reaching 118 at generation 12. The light-red curve corresponds to the ADRS-ACO, which converges to 121.2 at generation 24. Although the objective value remained relatively low during the early stages, it eventually surpassed that of the GRS-ACO, driven by the influence of ADRS in prioritizing equipment with high wartime importance. The light-purple curve represents the ADRS-IACO, which converges at generation 5, with a final objective function value of 139.5.
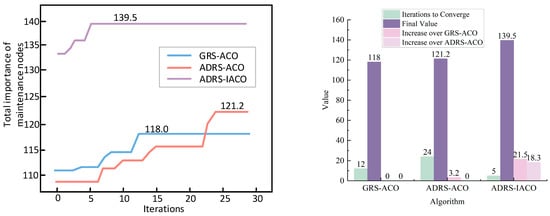
Figure 16.
Algorithm iteration under the second wave of UAV swarm attacks.

Table 8.
Comparison of algorithm convergence, optimization effectiveness, and improvement under the second wave of UAV swarm attack.
These results clearly demonstrate that the IACO exhibits significantly enhanced optimization capability compared to the ACO.
In the subsequent third, fourth, and fifth waves of attack, UAV swarm attacks caused only minor damage and were relatively easy to intercept. As the combat equipment gradually recovered, none of the three experimental groups sustained further damage. A detailed analysis of system resilience is provided in Section 5.4.
5.4. System Resilience Evaluation
This section analyzes system resilience from two indicators of system equipment: the overall system effectiveness level and the overall system importance. The resilience indicators undergo corresponding changes due to the process of enemy attacks and friendly repairs during multiple wave operations. The change in system efficiency levels divides each equipment into five efficiency levels, and the impact of damage and maintenance on the indicators is the same for each equipment. The initial total efficiency level of a system with 50 equipment is 250. The total importance of equipment is to treat each equipment differently, and the impact of the loss and recovery of different equipment on the resilience index is determined based on the equipment importance of the current task. Equipment with high importance has a greater impact, while those with low importance have a smaller impact. Regardless of the task, the total importance of all equipment in the system is 171. By analyzing the degree of change in two resilience indicators, the impact of different recovery strategies and algorithms on system resilience is analyzed. The calculation formula for system resilience is shown in Formula (10):
In Formula (10), denotes the total recovery value of the system at time , while represents the total loss value of the system at the same time.
5.4.1. Torpedo Attack Scenario
Figure 17 depicts the fully elastic process of the system based on the ACO experimental group under five waves of torpedo attacks. A* represents before the *th wave attack, and A*′ represents after the *th wave attack; R* represents before the elastic recovery of the first wave, and R*′ represents after the elastic recovery of the *th wave. From the changes in the indicators of attack A3-A3′ in the third wave of the two graphs, it can be seen that the decrease in the purple and pink lines is smaller than that of the blue line, indicating that ADRS, compared to GRS, can effectively reduce the damage to the system by actively restoring combat nodes. Moreover, the recovery of combat nodes has intercepted subsequent attacks in waves A4 and A5, preventing the system from being damaged. In the fourth wave of maintenance, the system was restored to a complete state, improving its resilience.

Figure 17.
Whole resilience process of system in torpedo attack scenario.
Moreover, in the experimental group based on ADRS in the left figure, the purple and pink lines basically overlap. However, in the right figure, the purple line in the maintenance R*-R*′ of each wave is also improved compared to the pink line, indicating that although the IACO and the ACO can repair about the same number of nodes in multi-constraint maintenance tasks, the IACO has stronger optimization ability for the objective function.
To quantify resilience variations during the multi-wave engagement, equipment importance values are substituted into Equation (10). The resulting changes in system resilience for each attack wave are summarized in Table 9.

Table 9.
Comparison of system resilience under torpedo attack scenario.
Figure 18 and Table 9 show the comparative results of the system damage, recovery capability, and resilience indicators of three sets of experiments under multi wave torpedo strikes.
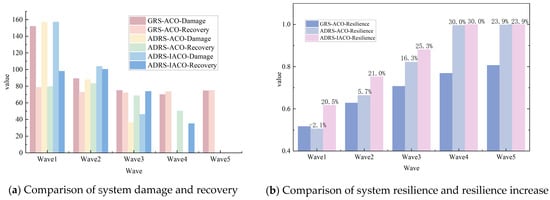
Figure 18.
Comparison of three experiments in multi-wave torpedo attack scenarios.
① System damage and recovery capability: Compared to GRS-ACO, the two algorithms based on ADRS demonstrated lower system damage values and stronger recovery capabilities in most waves, with particularly notable advantages after the third wave. Specifically, both ADRS-ACO and ADRS-IACO achieved zero system damage after the fourth wave, effectively fending off the fifth wave attack. Among them, ADRS-IACO achieved the highest recovery value of 98.0 in the first wave and zero system damage in the fourth wave, showcasing significantly superior recovery efficiency compared to other algorithm groups. In contrast, GRS-ACO still exhibited significant residual damage in the fourth and fifth waves, with limited recovery effects.
② System resilience and improvement: The system resilience values of the two sets of ADRS algorithms significantly increased with the increase in attack waves, and both achieved complete recovery (Resilience = 1.0) in the fourth wave. Among them, the resilience improvement of ADRS-IACO per wave exceeded 20%, with a maximum of 30.0%, significantly outperforming ACO, indicating its stronger anti-attack capability and recovery stability.
③ Comprehensive comparative analysis: In terms of the total damage value across five wave attacks, the cumulative system importance loss of GRS-ACO reached 460.8, while ADRS-ACO and ADRS-IACO reduced the loss by over 150, respectively, demonstrating significant key node protection effects. In terms of system resilience improvement, ADRS-IACO exhibited a smoother and more continuous optimization trend in each wave, indicating its superior system resilience recovery performance in multi-wave torpedo attack scenarios.
5.4.2. Aircraft/Missile Attack Scenario
Figure 19 depicts the system resilience process of the algorithm experimental group subjected to five waves of aircraft/missile attacks. From the variations in system indicators denoted by A2 to A2′ in the left panel, it is evident that the declines in the purple and pink lines are less pronounced than that of the blue line, suggesting that the ADRS-based system is adept at repairing combat-type nodes. In comparison to GRS, it significantly minimizes system damage and enhances resilience.

Figure 19.
Full resilience process of system under aircraft/missile attack scenario.
In the left figure, the route optimized by the IACO exhibits a less pronounced advantage over the ACO, as indicated by the pink line. This is attributable to the fact that the current attack inflicts less damage compared to torpedo attacks, and intercepting aircraft/missiles poses a lesser challenge than intercepting torpedoes. Consequently, most damaged nodes require restoration to just 2–3 levels of effectiveness, drastically reducing time and spare parts constraints, thereby facilitating easier maintenance tasks. Under equivalent constraints, more nodes can be restored.
However, from the standpoint of system criticality, the advantages of the IACO become apparent in the recovery processes of the second and third waves. This underscores that when restoring a comparable number of nodes, the IACO selects more critical nodes for restoration, thereby maximizing the subsequent safety of the system. This demonstrates that the IACO offers a superior feasible solution compared to the ACO.
A quantitative analysis is performed to assess the variations in resilience indicators of the ship system across multiple combat waves, with node importance incorporated into Equation (10). The resilience fluctuations of the ship system during each combat wave are determined using this equation, as illustrated in Table 10.

Table 10.
Comparison of system resilience under aircraft/missile attack scenarios.
Figure 20 and Table 10 show the comparative results of system damage, recovery capability, and resilience indicators for three sets of experiments under multi-wave aircraft/missile strikes.
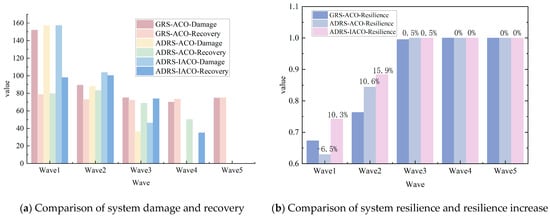
Figure 20.
Comparison of three experiments in multi-wave aircraft/missile attack scenarios.
① System damage and recovery capability:
Compared to the GRS-ACO, the two strategies based on ADRS demonstrated superior recovery capabilities and accelerated system repair processes in the first two waves. In the first wave, the system damage values for all three algorithms were 107.8. However, ADRS-IACO exhibited the highest recovery value (80.0), significantly outperforming ADRS-ACO (67.8) and GRS-ACO (72.6). In the second wave, the system damage values for the two ADRS groups (54.0 and 54.8, respectively) were notably lower than that of the GRS-ACO group (76.2). After the third wave, all three algorithms achieved zero system damage, effectively fulfilling the defense mission.
② System elasticity and improvement:
The resilience values of the two ADRS algorithms continued to increase with each attack wave, ultimately reaching full recovery (Resilience = 1.0) in the third wave. Specifically, ADRS-IACO achieved a resilience value of 0.742 in the first wave, significantly surpassing the other two groups. It further increased to 0.884 in the second wave, corresponding to resilience increases of 10.3% and 15.9%, respectively. In contrast, ADRS-ACO performed poorly in the first wave, with a resilience decrease in −6.5%, but improved in the second wave, with a resilience increase of 10.6%.
③ Comprehensive comparative analysis:
From the perspectives of recovery speed and resilience enhancement, ADRS-IACO demonstrated the best performance in the first two waves. It achieved a higher level of recovery and stronger system resilience under the same damage conditions, significantly accelerating the system recovery process. Although all three algorithms can ultimately achieve complete recovery, the improved algorithm exhibited greater invulnerability and repair efficiency in the initial stages of high-altitude strikes, such as those involving aircraft or missiles. This further validates its resilience advantage and adaptability in such high-altitude strike environments.
5.4.3. UAV Swarm Attack Scenario
Figure 21 depicts the system resilience process of an experimental group employing the ACO under the assault of a five-wave UAV swarm. Observing the attack on A3 in the left panel, it is evident that systems grounded on ADRS remained undamaged, whereas those relying on GRS incurred substantial damage. This underscores that, after repairing combat nodes, ADRS-based systems can effectively thwart enemy strikes and mitigate system destruction.

Figure 21.
Full resilience process of the system under UAV swarm strikes scenario.
In the left panel, the path of the refined ACO exhibits a less pronounced advantage compared to the pink line representing the conventional ACO. This is attributable to the fact that current UAV swarm attacks inflict less damage compared to torpedo attacks, and intercepting UAV swarms poses fewer challenges than intercepting torpedoes. Consequently, most damaged nodes require restoration to just 2–3 performance levels, thereby reducing time and spare part constraints accordingly and rendering maintenance tasks relatively simpler. Under identical constraints, more nodes can be restored. However, from the vantage point of system importance, the benefits of the refined algorithm become apparent in the restoration of nodes during the first and second waves. This demonstrates that when restoring a comparable number of nodes, the refined algorithm selects superior nodes for restoration, thereby maximizing the subsequent safety of the system. This underscores that the refined ACO offers a superior feasible solution compared to its conventional counterpart.
A quantitative analysis of the metric variations within the ship system across multiple combat waves is conducted, incorporating node importance into Equation (10). Utilizing this equation, the elasticity changes in the ship system during each combat wave are determined, as presented in Table 11.

Table 11.
Comparison of system resilience under UAV swarm strikes scenario.
Figure 22 and Table 11 show the comparative results of system damage, recovery capability, and resilience indicators for three sets of experiments under multi-wave UAV swarm attacks.
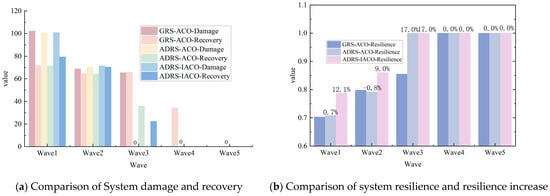
Figure 22.
Comparison of three experiments in multi-wave UAV swarm attack scenarios.
① System damage and recovery capability:
In the first three waves, the system damage values of the three algorithms were relatively similar. The system damage value in the first wave was approximately 100, with slight fluctuations observed in the second wave. After the third wave, the ADRS group achieved zero system damage. Additionally, in the first wave, the ADRS-IACO group attained the highest recovery value of 79.4, outperforming GRS-ACO (71.8) and ADRS-ACO (71.4). In the second wave, ADRS-IACO maintained its recovery advantage at 70.4, while the recovery values of algorithms such as GRS-ACO and ADRS-ACO were relatively lower, indicating that the ADRS-IACO exhibits stronger recovery capabilities and efficiency under continuous attacks. All three algorithm groups achieved zero system damage after the third wave, effectively fulfilling their defensive mandates.
② System elasticity and improvement:
As the attack waves progressed, the resilience values of the three systems continued to climb, ultimately achieving full recovery (Resilience = 1.0) in the fourth wave. Notably, ADRS-IACO demonstrated significant resilience improvements in the first three waves, with resilience values of 0.788, 0.870, and 1.0, corresponding to resilience growth rates of 12.1%, 9.0%, and 17.0%, respectively. In contrast, the ADRS-ACO showed a slight decline (−0.8%) in the second wave but experienced a resilience surge (17.0%) in the third wave. Although GRS-ACO exhibited a positive overall trend, its resilience improvement process was relatively gradual.
③ Comprehensive comparative analysis:
From the perspective of resilience and elasticity evolution trends, ADRS-IACO exhibits superior invulnerability and system recovery performance in the context of high-frequency UAV swarm attacks. In the first three waves, it consistently maintained a high recovery value, accompanied by stable and notable elasticity improvements, indicating that the ADRS-IACO can swiftly repair damaged equipment while possessing the resilience to continuously withstand intensive attacks. In comparison, the ACO lagged in terms of elasticity improvements, with significant fluctuations in recovery levels, further underscoring the robustness and adaptability advantages of ADRS-IACO in such attack environments.
5.4.4. Comparison Across the Three Scenarios
As shown in Figure 23 and Table 12, the three algorithms exhibit pronounced performance differences across the attack scenarios. ADRS-IACO consistently attains the best solutions, indicating stronger repair-path optimization and faster system recovery. In the torpedo scenario, ADRS-IACO improves solution quality by 34.9% over GRS-ACO and 25.9% over ADRS-ACO; ADRS-ACO itself improves on GRS-ACO by 7.2%. In the aircraft/missile and UAV scenarios, ADRS-IACO yields improvements of 17.1% and 16.7% over GRS-ACO (16.7% and 10.6% over ADRS-ACO), whereas ADRS-ACO provides only marginal gains, especially in the aircraft/missile case (+0.3%). These results suggest that ADRS-IACO preserves the recovery strengths of ADRS while offering superior path optimization and maintenance scheduling, particularly under severe damage conditions.
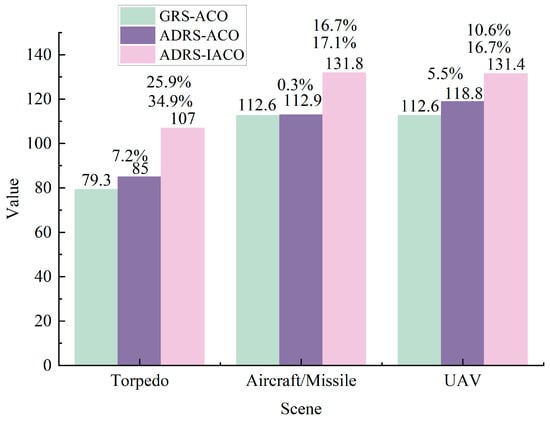
Figure 23.
Comparison of the first wave of algorithms in three scenarios.

Table 12.
Comparison of the algorithm across the three scenarios.
Overall, ADRS-IACO outperforms both GRS-ACO and ADRS-ACO across scenarios, supporting its promise as a scalable approach to enhancing naval combat system resilience under multi-wave attacks.

Table 13.
Comparison of three algorithms under 10 sets of data in different scenarios.

Table 14.
Comparison of three algorithms under 20 sets of data in different scenarios.
- (1)
- Average solution value. Representative results from Torpedo/10-set show a rise from 66.71 (GRS-ACO) to 72.55 (ADRS-ACO) and 73.40 (ADRS-IACO). The same ordering persists with 20 sets (Torpedo: 66.29 → 72.43 → 73.36) and in the Aircraft/Missile and UAV scenarios, confirming that ADRS contributes mission-aligned gains and that IACO further amplifies them.
- (2)
- Stability (variance). Variance declines markedly once ADRS is introduced and decreases further with IACO. For Torpedo/10-set, variance drops from 0.618 → 0.274 → 0.158 (GRS-ACO → ADRS-ACO → ADRS-IACO). With 20 sets, it is 0.510 → 0.172 → 0.145. Similar trends appear elsewhere (UAV/20-set: 2.459 → 1.894 → 1.462), indicating that the initialization and transfer probability based on non-uniform pheromone concentration matrix stabilize the search solution.
- (3)
- Efficiency (iterations and time-to-optimum). ADRS-ACO yields the largest efficiency gains versus GRS-ACO (Torpedo/10-set: iterations 89.94 → 10.44, time 2.125 → 0.268). ADRS-IACO requires more time and iteration to reach the best solution than ADRS-ACO (Torpedo/10-set: 46.62 iterations, 1.217 time units) to support broader exploration, yet remains far faster than GRS-ACO—consistent with a deliberate exploration–exploitation re-balance. ADRS-IACO has achieved better solutions than ADRS-ACO at a very small acceptable time cost and is far superior to GRS-ACO in terms of time consumption and solution quality.
- (4)
- Recovery capability-oriented ratios. We report first-wave outcomes because they most clearly differentiate algorithms on the recovery ratio of damaged combat nodes and the recovered importance of critical nodes. As subsequent waves proceed, repairs approach completion and inter-method differences diminish, reducing statistical discriminability. Consequently, our analysis focuses on first-wave results.
- (i)
- Recovery ratio of damaged combat nodes (First Wave). Across all scenarios and dataset sizes, ADRS-IACO attains the highest first-wave repair coverage. For example, in Torpedo/10-set, the recovery ratio reaches 98.0% with ADRS-IACO versus 79.6% (ADRS-ACO) and 78.6% (GRS-ACO); with 20 sets, it further rises to 99.6% (vs. 79.2%/78.9%). Consistent—though smaller—advantages appear in Aircraft/Missile and UAV. These gains reflect group-based multi-starts that broaden early feasible coverage while still steering repairs toward militarily valuable nodes.
- (ii)
- Recovered importance of critical nodes (First Wave). ADRS-IACO also yields the greatest recovery of aggregated importance among critical nodes. In UAV/10-set, the metric improves from 142.3 (GRS-ACO) and 143.6 (ADRS-ACO) to 150.7 with ADRS-IACO; in UAV/20-set, it achieves 142.8 (vs. 143.9/149.8). The pattern indicates that non-uniform initial pheromones and importance-weighted transitions increase the hit rate on the most consequential assets during the earliest recovery window.
- (5)
- Robustness to dataset size. All qualitative conclusions persist when the dataset doubles from 10 to 20. ADRS-ACO consistently outperforms GRS-ACO, and ADRS-IACO further improves averages and reduces variance while keeping time-to-solution within acceptable bounds.
Across all scenarios and dataset sizes, ADRS-ACO > GRS-ACO and ADRS-IACO > ADRS-ACO for average outcomes, with a monotonic decrease in variance from GRS-ACO to ADRS-ACO to ADRS-IACO. Table 13 and Table 14 thus substantiate the mechanism underlying Table 12: ADRS injects mission priorities and precedence constraints, yielding stable and efficient improvements; IACO then reshapes ACO’s search dynamics—via non-uniform initial pheromones, importance-weighted state transitions, and group-based multi-starts—to (i) further lower variance, (ii) raise average solution quality, and (iii) achieve these benefits within practical time budgets. Hence, ADRS-IACO’s superiority stems from strategy alignment (ADRS) plus enhanced search dynamics (IACO), rather than preferential parameter tuning.
6. Conclusions and Future Work
This article conducts systematic simulation modeling and analysis research centered around the ACO-based multi-wave combat model. Through parameter optimization, construction of a complete simulation process, and comparative experiments conducted in three representative combat environments, the following key conclusions are drawn:
- (1)
- ACO parameter optimization: The initial parameters α, β, and ρ have a significant impact on the performance of ACO. By combining empirical analysis with grid search, near-optimal parameter values were determined, laying the foundation for improving search efficiency.
- (2)
- Effectiveness of recovery strategy: Compared to the GRS, the integrated ADRS significantly enhances the system’s offensive and defensive capabilities under various attack scenarios, effectively reducing the cumulative damage to the system under continuous attack waves.
- (3)
- Algorithm performance comparison: Compared to the ACO, IACO demonstrates stronger global search capabilities, achieving higher-quality solutions and accelerating convergence speed. Although all algorithms tend to converge to local optima, ADRS can effectively guide the optimization direction of the objective function. Furthermore, the IACO starts searching from a higher initial value, outperforming other algorithms overall.
- (4)
- Synergistic advantages of ADRS and IACO: Compared to GRS-ACO and ADRS-ACO, ADRS-IACO not only minimizes system damage to the greatest extent, but also significantly accelerates the process of system resilience recovery.
- (5)
- ADRS-IACO demonstrates superior path planning and maintenance scheduling capabilities in high-intensity, high-damage torpedo attack scenarios. It can more effectively identify key maintenance nodes and guide resource allocation reasonably. In terms of search efficiency and recovery decision-making, it significantly outperforms GRS-ACO and ADRS-ACO, fully reflecting its adaptability and system recovery capabilities in extreme battlefield environments.
In summary, under the background of multi-wave combat, the ship combat system adopting ADRS-IACO demonstrates higher system resilience and stronger recovery capability, which is significantly superior to other comparative strategies.
Future work will be promoted on the following aspects:
- (1)
- Multi-domain joint operations. Extend ADRS-IACO to multi-domain scenarios—undersea, surface, low-altitude, and high-altitude—where heterogeneous weapons operate simultaneously.
- (2)
- Bilateral attack–defense with game-theoretic strategy. Build a blue–red game in which both sides can attack, defend, and repair; compute equilibrium policies under joint path–maintenance optimization, compare damage–recovery trajectories and strategy stability across countermeasures, and incorporate adaptive opponent models to capture dynamic adversaries.
- (3)
- Algorithmic extensions. Investigate additional algorithms within the ADRS framework and benchmark their performance against IACO.
- (4)
- Data-driven calibration and validation. When public real-world datasets become available, calibrate model parameters and refine experiments accordingly, with sensitivity and robustness analyses.
Author Contributions
Conceptualization, Z.L. and L.M.; methodology, Z.L. and L.W.; software, L.W.; validation, L.W. and G.Y.; formal analysis, L.W. and G.Y.; investigation, L.W.; resources, Z.L. and L.M.; data curation, L.W. and G.Y.; writing—original draft preparation, L.W.; writing—review and editing, L.W. and G.Y.; visualization, L.W.; supervision, Z.L. and L.M.; project administration, Z.L. and L.M.; funding acquisition, Z.L. and L.M. All authors have read and agreed to the published version of the manuscript.
Funding
This research was funded by High tech Research and Development Center of the Ministry of Science and Technology’s Science and Technology Innovation 2030— “New Generation Artificial Intelligence” Major Project (Grant No. 2021ZD0110600), Theme Case Library Project of the Degree and Graduate Education Development Center of the Ministry of Education (Grant No. ZT-231028914).
Data Availability Statement
The data related to this paper is in the following Appendix A.
Conflicts of Interest
The authors declare no conflicts of interest.
Appendix A

Table A1.
Classification of equipment types.
Table A1.
Classification of equipment types.
| Equipment Index | Equipment Type | Main Tasks and Characteristics of the Equipment |
|---|---|---|
| 0–9 | Base equipment | Responsible for fundamental system functions such as warship power systems, with consistently high importance across all three combat scenarios. |
| 10–14 | Radar (Combat equipment) | Responsible for detecting high-altitude aircraft, missiles, and low-altitude. UAVs. Highly important in detecting both high- and low-altitude aerial threats. |
| 15–19 | Sonar detection (Combat equipment) | Responsible for detecting underwater torpedoes and mines. Critically important in underwater threat detection. |
| 20–24 | Anti-aircraft missile (Combat equipment) | Responsible for intercepting high-altitude aircraft and missiles. Highly important in defending against aerial attacks. |
| 25–29 | Near defense artillery (Combat equipment) | Responsible for intercepting low-altitude UAV swarms. Highly important in defending against UAV attacks. |
| 30–34 | Antisubmarine missile (Combat equipment) | Responsible for intercepting underwater torpedoes. Critically important in countering underwater threats. |
| 35–49 | Secondary equipment | Responsible for less critical tasks and lower repair priority during combat. Relatively low importance across all three combat scenarios. |

Table A2.
Capabilities of combat equipment.
Table A2.
Capabilities of combat equipment.
| Equipment Types and Tasks | Equipment Index | Equipment Ability |
|---|---|---|
| Radar detection—used for detecting high-altitude aircraft, missiles, and low-altitude UAVs | 10 | 0.85 |
| 11 | 0.82 | |
| 12 | 0.88 | |
| 13 | 0.80 | |
| 14 | 0.86 | |
| Sonar detection—used for detecting underwater torpedoes | 15 | 0.50 |
| 16 | 0.55 | |
| 17 | 0.60 | |
| 18 | 0.70 | |
| 19 | 0.65 | |
| Long-range air defense missile—used for intercepting high-altitude aircraft and missiles | 20 | 0.77 |
| 21 | 0.78 | |
| 22 | 0.82 | |
| 23 | 0.88 | |
| 24 | 0.85 | |
| Close-in weapon system—used for intercepting low-altitude UAV swarms | 25 | 0.88 |
| 26 | 0.76 | |
| 27 | 0.86 | |
| 28 | 0.89 | |
| 29 | 0.85 | |
| Anti-submarine missile—used for intercepting underwater torpedoes | 30 | 0.56 |
| 31 | 0.58 | |
| 32 | 0.48 | |
| 33 | 0.54 | |
| 34 | 0.42 |

Table A3.
Maintenance information of equipment.
Table A3.
Maintenance information of equipment.
| Equipment Index | X (m) | Y (m) | Z (m) | Spare Part A (Units) | Spare Part B (Units) | Spare Part C (Units) | Repair Time (s) |
|---|---|---|---|---|---|---|---|
| 0 | 30.4 | 46.9 | 50.2 | 1 | 2 | 5 | 40.0 |
| 1 | 46.8 | 46.8 | 38.4 | 1 | 1 | 6 | 62.0 |
| 2 | 80.6 | 46.9 | 44.6 | 2 | 3 | 4 | 86.0 |
| 3 | 106.4 | 28.1 | 29.0 | 2 | 2 | 5 | 44.0 |
| 4 | 106.4 | 61.9 | 22.7 | 3 | 2 | 4 | 48.0 |
| 5 | 115.6 | 61.9 | 10.5 | 2 | 3 | 3 | 54.0 |
| 6 | 149.0 | 30.0 | 4.9 | 1 | 1 | 3 | 62.0 |
| 7 | 151.0 | 69.4 | 29.9 | 2 | 2 | 2 | 60.0 |
| 8 | 182.4 | 75.0 | 41.6 | 3 | 1 | 4 | 38.0 |
| 9 | 182.4 | 61.9 | 59.8 | 3 | 1 | 4 | 38.0 |
| 10 | 182.4 | 5.6 | 30.6 | 2 | 2 | 3 | 76.0 |
| 11 | 185.4 | 66.6 | 8.9 | 2 | 1 | 3 | 66.0 |
| 12 | 187.0 | 71.3 | 39.9 | 1 | 1 | 2 | 46.0 |
| 13 | 194.6 | 66.6 | 10.1 | 1 | 2 | 2 | 56.0 |
| 14 | 205.2 | 62.9 | 9.9 | 1 | 1 | 2 | 46.0 |
| 15 | 205.2 | 66.6 | 50.5 | 3 | 2 | 3 | 48.0 |
| 16 | 205.2 | 59.1 | 16.6 | 2 | 2 | 3 | 76.0 |
| 17 | 205.0 | 59.0 | 36.1 | 2 | 3 | 3 | 54.0 |
| 18 | 220.4 | 5.6 | 45.1 | 3 | 1 | 2 | 54.0 |
| 19 | 240.2 | 69.4 | 17.9 | 3 | 2 | 2 | 64.0 |
| 20 | 253.3 | 26.3 | 54.4 | 2 | 3 | 3 | 54.0 |
| 21 | 273.6 | 61.9 | 12.2 | 2 | 3 | 3 | 54.0 |
| 22 | 276.6 | 61.9 | 51.1 | 2 | 2 | 2 | 60.0 |
| 23 | 281.2 | 61.9 | 53.2 | 2 | 3 | 4 | 54.0 |
| 24 | 285.8 | 61.9 | 26.1 | 2 | 2 | 5 | 44.0 |
| 25 | 290.4 | 15.0 | 46.6 | 2 | 3 | 5 | 54.0 |
| 26 | 295.0 | 15.0 | 13.4 | 2 | 3 | 2 | 70.0 |
| 27 | 149.0 | 46.9 | 39.1 | 1 | 3 | 5 | 50.0 |
| 28 | 148.0 | 38.0 | 16.5 | 1 | 2 | 3 | 72.0 |
| 29 | 133.8 | 13.1 | 2.5 | 2 | 1 | 3 | 66.0 |
| 30 | 155.1 | 13.1 | 39.1 | 1 | 2 | 3 | 72.0 |
| 31 | 171.8 | 13.1 | 38.4 | 2 | 3 | 3 | 86.0 |
| 32 | 199.1 | 5.6 | 20.0 | 2 | 2 | 3 | 76.0 |
| 33 | 214.4 | 13.1 | 36.1 | 3 | 3 | 3 | 90.0 |
| 34 | 222.0 | 5.6 | 45.1 | 2 | 3 | 3 | 54.0 |
| 35 | 226.6 | 13.1 | 36.7 | 1 | 2 | 3 | 40.0 |
| 36 | 252.4 | 5.6 | 12.2 | 2 | 1 | 2 | 50.0 |
| 37 | 223.4 | 66.6 | 40.0 | 1 | 2 | 2 | 56.0 |
| 38 | 223.4 | 63.1 | 41.4 | 3 | 2 | 3 | 48.0 |
| 39 | 229.5 | 66.6 | 34.7 | 3 | 1 | 3 | 38.0 |
| 40 | 235.6 | 70.1 | 17.8 | 2 | 2 | 2 | 60.0 |
| 41 | 235.6 | 63.1 | 43.9 | 3 | 1 | 4 | 38.0 |
| 42 | 152.0 | 69.4 | 9.5 | 2 | 1 | 2 | 50.0 |
| 43 | 174.8 | 60.0 | 9.4 | 2 | 3 | 4 | 54.0 |
| 44 | 187.0 | 60.0 | 5.9 | 1 | 1 | 3 | 62.0 |
| 45 | 199.1 | 60.0 | 29.5 | 2 | 3 | 3 | 86.0 |
| 46 | 211.3 | 60.0 | 50.0 | 3 | 3 | 3 | 90.0 |
| 47 | 223.4 | 60.0 | 53.9 | 1 | 2 | 4 | 40.0 |
| 48 | 255.4 | 67.5 | 3.4 | 1 | 1 | 4 | 30.0 |
| 49 | 264.5 | 18.8 | 2.1 | 3 | 1 | 3 | 70.0 |

Table A4.
Equipment importance matrix.
Table A4.
Equipment importance matrix.
| Equipment Index | Basic Importance | Aircraft/Missile | Unmanned Aerial Vehicle | Torpedo |
|---|---|---|---|---|
| 0 | 5 | 5 | 5 | 6 |
| 1 | 4 | 6 | 5 | 5 |
| 2 | 4 | 6 | 6 | 6 |
| 3 | 4 | 6 | 6 | 6 |
| 4 | 5 | 5 | 5 | 5 |
| 5 | 6 | 6 | 5 | 6 |
| 6 | 4 | 5 | 5 | 5 |
| 7 | 6 | 6 | 6 | 5 |
| 8 | 3 | 5 | 6 | 5 |
| 9 | 5 | 5 | 6 | 6 |
| 10 | 3 | 5 | 6 | 1 |
| 11 | 5 | 6 | 6 | 1 |
| 12 | 2 | 6 | 5 | 1 |
| 13 | 3 | 6 | 5 | 2 |
| 14 | 2 | 5 | 6 | 2 |
| 15 | 3 | 1 | 2 | 6 |
| 16 | 3 | 1 | 2 | 6 |
| 17 | 2 | 2 | 1 | 6 |
| 18 | 1 | 1 | 1 | 6 |
| 19 | 2 | 1 | 2 | 5 |
| 20 | 1 | 6 | 3 | 1 |
| 21 | 3 | 5 | 2 | 1 |
| 22 | 3 | 5 | 1 | 2 |
| 23 | 3 | 6 | 2 | 1 |
| 24 | 3 | 6 | 3 | 1 |
| 25 | 3 | 2 | 5 | 1 |
| 26 | 3 | 2 | 6 | 1 |
| 27 | 4 | 2 | 6 | 1 |
| 28 | 2 | 2 | 5 | 1 |
| 29 | 1 | 3 | 6 | 1 |
| 30 | 2 | 1 | 2 | 6 |
| 31 | 2 | 2 | 1 | 6 |
| 32 | 1 | 1 | 1 | 5 |
| 33 | 2 | 1 | 1 | 6 |
| 34 | 1 | 1 | 1 | 6 |
| 35 | 3 | 2 | 2 | 2 |
| 36 | 3 | 3 | 2 | 3 |
| 37 | 5 | 4 | 3 | 4 |
| 38 | 5 | 1 | 2 | 3 |
| 39 | 5 | 2 | 2 | 1 |
| 40 | 4 | 3 | 3 | 2 |
| 41 | 5 | 2 | 4 | 2 |
| 42 | 4 | 2 | 2 | 3 |
| 43 | 4 | 3 | 1 | 2 |
| 44 | 4 | 3 | 2 | 4 |
| 45 | 5 | 2 | 1 | 2 |
| 46 | 6 | 2 | 2 | 4 |
| 47 | 4 | 3 | 4 | 3 |
| 48 | 4 | 3 | 2 | 4 |
| 49 | 4 | 2 | 3 | 1 |
References
- Wang, S.; Wang, Y.; Ou, H.; Liu, W.; Li, Z. A Brief Discussion of Winning Mechanism of Intelligentized Warfare. In Man-Machine-Environment System Engineering; Long, S., Dhillon, B.S., Eds.; MMESE 2023. Lecture Notes in Electrical Engineering; Springer: Singapore, 2023; Volume 1069. [Google Scholar] [CrossRef]
- Chambel Énio Gonçalves, P.; Fereira, L.A. RELIABILITY-BASED MAINTENANCE STRATEGY FOR A MILITARY WEAPON SYSTEM—A CASE STUDY. Int. J. Ind. Eng. Theory Appl. Pract. 2023, 30, 105–120. [Google Scholar] [CrossRef]
- AlKuwaiti, R.H.; El-Sayed, W.T.; Farag, H.E.Z.; Al-Durra, A.; El-Saadany, E.F. Power system resilience against climatic faults: An optimized self-healing approach using conservative voltage reduction. Int. J. Electr. Power Energy Syst. 2024, 155, 109519. [Google Scholar] [CrossRef]
- Dui, H.; Zhang, K.; Xia, W. Importance-based Resilience Assessment and Optimization of Unmanned Ship Swarm System. Int. J. Math. Eng. Manag. Sci. 2024, 9, 616–631. [Google Scholar] [CrossRef]
- Zhang, H.; Matsubara, Y. Consensus-Based Resilience Assurance for System of Systems. IEEE Access 2025, 13, 20203–20217. [Google Scholar] [CrossRef]
- Wang, M.; Ma, T.; Li, G.; Zhai, X.; Qiao, S. Ant colony optimization with an improved pheromone model for solving MTSP with capacity and time window constraint. IEEE Access 2020, 8, 106872–106879. [Google Scholar] [CrossRef]
- Chen, X.; Zhang, P.; Du, G.; Li, F. Ant colony optimization based memetic algorithm to solve bi-objective multiple traveling salesmen problem for multi-robot systems. IEEE Access 2018, 6, 21745–21757. [Google Scholar] [CrossRef]
- Lu, L.-C.; Yue, T.-W. Mission-oriented ant-team ACO for min–max MTSP. Appl. Soft Comput. 2019, 76, 436–444. [Google Scholar] [CrossRef]
- Zhou, Y.; Zhang, D.; Ma, X. Distribution network insulator detection based on IACO and deep learning for UAV. iScience 2024, 27, 110119. [Google Scholar] [CrossRef]
- Guo, Y.; Luo, F.; Wang, Z.; Tong, Y.; Ren, Y. A schedulability-aware routing algorithm for time sensitive network based on IACO. iScience 2024, 27, 110145. [Google Scholar] [CrossRef]
- Ikhar, S.; Mondal, D.; Khubalkar, D.; Yadav, R.; Deshpande, P.; Patil, S.V. Decision Systems Optimization for Cybersecurity Resilience. In Intelligent Computing and Automation. FICTA 2024. Smart Innovation, Systems and Technologies; Bhateja, V., Dey, M., Simic, M., Eds.; Springer: Singapore, 2025; Volume 421. [Google Scholar] [CrossRef]
- Bumblauskas, D.; Gemmill, D.; Igou, A.; Anzengruber, J. Smart maintenance decision support systems (SMDSS) based on corporate big data analytics. Expert. Syst. Appl. 2017, 90, 303–317. [Google Scholar] [CrossRef]
- Kim, G.S.; Lee, Y.H. Transformation towards a smart maintenance factory: The case of a vessel maintenance depot. Machines 2021, 9, 267. [Google Scholar] [CrossRef]
- Kadir, C. A knowledge based hierarchical reliability allocation (HIRAL) approach for shipboard systems. Proc. Inst. Mech. Eng. Part M J. Eng. Marit. Environ. 2021, 236, 1098–1111. [Google Scholar] [CrossRef]
- Keskin, O.F.; Lubja, K.; Bahsi, H.; Tatar, U. Systematic cyber threat modeling for maritime operations: Attack trees for shipboard systems. J. Mar. Sci. Eng. 2025, 13, 645. [Google Scholar] [CrossRef]
- Zhen, L.; Lu, T.; Xu, S.C.; Mei, W.Y.; Sheng, W.D.; Hong, M. A systematic research on system recovery based on improved genetic algorithm and quotient resilience model under attack and damage. Int. J. Comput. Intell. Syst. 2022, 15, 100. [Google Scholar] [CrossRef]
- Wang, H.; Lu, F.; Zhou, X. Considering the multi-scenario distribution network fault recovery strategy under extreme events. In Proceedings of the 2024 International Conference of Electrical, Electronic and Networked Energy Systems (EENES 2024), Xi’an, China, 18–20 October 2024; Sha, A., Liu, Z., Wang, X., Xiao, Q., Zang, Y., Tang, L., Eds.; Lecture Notes in Electrical Engineering; Springer: Singapore, 2025; Volume 1331. [Google Scholar] [CrossRef]
- Wan, Y.J.; Wang, G.Q.; Wang, M. Coupling evaluation model of abnormal flight recovery strategy. In Proceedings of the 2023 Asia-Pacific International Symposium on Aerospace Technology (APISAT 2023) Proceedings, Hainan, China, 16–18 October 2023; Fu, S., Ed.; Lecture Notes in Electrical Engineering; Springer: Singapore, 2024; Volume 1050. [Google Scholar] [CrossRef]
- Zheng, J.; Mao, C.; Li, Y.; Liu, Y.; Wang, Y. Dynamic vessel schedule recovery strategy of liner shipping with uncertainties: An event-triggered model predictive control solution. Comput. Ind. Eng. 2024, 193, 110340. [Google Scholar] [CrossRef]
- Silva, C.; Andrade, P.; Ribeiro, B.; Santos, B.F. Adaptive reinforcement learning for task scheduling in aircraft maintenance. Sci. Rep. 2023, 13, 16605. [Google Scholar] [CrossRef] [PubMed] [PubMed Central]
- Gao, X.; Peng, D.; Yang, Y.; Huang, F.; Yuan, Y.; Tan, C.; Li, F. Two-stage graph attention networks and Q-learning based maintenance tasks scheduling. Appl. Intell. 2025, 55, 33. [Google Scholar] [CrossRef]
- Zhang, Q.; Liu, Y.; Xiahou, T.; Huang, H.Z. A heuristic maintenance scheduling framework for a military aircraft fleet under limited maintenance capacities. Reliab. Syst. Saf. 2023, 235, 109239. [Google Scholar] [CrossRef]
- Su, H.; Li, Y.; Cao, Q. A stochastic model of preventive maintenance strategies for wind turbine gearboxes considering the incomplete maintenance. Sci. Rep. 2024, 14, 5700. [Google Scholar] [CrossRef] [PubMed] [PubMed Central]
- Li, C.; Zhao, N.; Wu, H. Multiple deception resources deployment strategy based on reinforcement learning for network threat mitigation. Sci. Rep. 2025, 15, 16830. [Google Scholar] [CrossRef] [PubMed] [PubMed Central]
- Mohan, P.V.; Dixit, S.; Gyaneshwar, A.; Chadha, U.; Srinivasan, K.; Seo, J.T. Leveraging Computational Intelligence Techniques for Defensive Deception: A Review, Recent Advances, Open Problems and Future Directions. Sensors 2022, 22, 2194. [Google Scholar] [CrossRef] [PubMed] [PubMed Central]
- Parras, J.; Hüttenrauch, M.; Zazo, S.; Neumann, G. Deep Reinforcement Learning for Attacking Wireless Sensor Networks. Sensors 2021, 21, 4060. [Google Scholar] [CrossRef] [PubMed] [PubMed Central]
Disclaimer/Publisher’s Note: The statements, opinions and data contained in all publications are solely those of the individual author(s) and contributor(s) and not of MDPI and/or the editor(s). MDPI and/or the editor(s) disclaim responsibility for any injury to people or property resulting from any ideas, methods, instructions or products referred to in the content. |
© 2025 by the authors. Licensee MDPI, Basel, Switzerland. This article is an open access article distributed under the terms and conditions of the Creative Commons Attribution (CC BY) license (https://creativecommons.org/licenses/by/4.0/).