Article

Improving Academic Advising in Engineering Education with Machine Learning Using a Real-World Dataset

1
Institute for Intelligent Systems, University of Johannesburg, Johannesburg 2092, South Africa
2
School of Electronic and Electrical Engineering, University of Leeds, Leeds LS2 9JT, UK
*
Author to whom correspondence should be addressed.
Algorithms 2024, 17(2), 85; https://doi.org/10.3390/a17020085
Submission received: 14 December 2023 / Revised: 9 February 2024 / Accepted: 16 February 2024 / Published: 18 February 2024
(This article belongs to the Special Issue Machine Learning Algorithms and Methods for Predictive Analytics)

Abstract

:
The role of academic advising has been conducted by faculty-student advisors, who often have many students to advise quickly, making the process ineffective. The selection of the incorrect qualification increases the risk of dropping out, changing qualifications, or not finishing the qualification enrolled in the minimum time. This study harnesses a real-world dataset comprising student records across four engineering disciplines from the 2016 and 2017 academic years at a public South African university. The study examines the relative importance of features in models for predicting student performance and determining whether students are better suited for extended or mainstream programmes. The study employs a three-step methodology, encompassing data pre-processing, feature importance selection, and model training with evaluation, to predict student performance by addressing issues such as dataset imbalance, biases, and ethical considerations. By relying exclusively on high school performance data, predictions are based solely on students’ abilities, fostering fairness and minimising biases in predictive tasks. The results show that removing demographic features like ethnicity or nationality reduces bias. The study’s findings also highlight the significance of the following features: mathematics, physical sciences, and admission point scores when predicting student performance. The models are evaluated, demonstrating their ability to provide accurate predictions. The study’s results highlight varying performance among models and their key contributions, underscoring the potential to transform academic advising and enhance student decision-making. These models can be incorporated into the academic advising recommender system, thereby improving the quality of academic guidance.

1. Introduction

Low graduation rates in engineering result in the need for more human capital for the industry, which translates to a shortage of skilled engineers [1]. South Africa is experiencing increased demand for engineering graduates as it looks to expand its infrastructure and technological capabilities. This demand is exacerbated by challenges in engineering education, such as high dropouts, low graduation rates, and the need to improve the quality of engineering education. With this demand, educational institutions in the country need help addressing challenges related to low graduation rates, as the situation hinders the industry’s growth. The low graduation rates in engineering are not unique to South Africa but are a global problem [2]. However, the issue is more pressing in South Africa, given the country’s need for engineers to spur economic development. Higher education institutions face an increased demand for academic guidance to aid students in making informed choices for their academic pathways [3]. Qualification choices heavily influence the student’s academic path and future professional career. Making an informed choice may be difficult for students due to the various options available.
Academic advising is a process where student-faculty advisors and students work together to help the students attain their most significant learning potential and to lay out the actions they need to take to reach their personal, academic, and career objectives [4]. Academic advising assists students in improving their performance by providing them with knowledge about the possibilities for and results of learning and enhancing their involvement, experience, skill acquisition, and knowledge [5]. Furthermore, academic advising helps clarify institutional requirements, raise awareness of support programmes and resources, evaluate student performance and goals, and promote self-direction [6]. However, in reality, student-faculty advisors have to advise many students quickly, leading to being overworked, which results in some students needing more time to be satisfied with the calibre of the assistance they get. Additionally, poor advice may hinder students’ academic development [7].
Student performance during the first year of university is directly related to overall student performance. The most significant predictor of first-year academic achievement was students’ higher education access mark, which measures their academic readiness [8]. Vulperhorst et al. [9] argued that the most reliable high school score for selection processes may change. By examining first-year performance, researchers can learn more about students’ unique settings and backgrounds, enabling a more nuanced understanding of the factors that predict success in higher education [9]. This information can help streamline admission standards and increase the precision of selection processes, resulting in a better match between students and their preferred programmes. A recent study found that high school performance metrics, such as the grade point average, scholastic achievement admission test score, and general aptitude test score, can predict students’ early university performance before admission. The study found that the academic achievement admission test score was the most reliable indicator of future student achievement, indicating that admissions processes should give it more weight [10].
This study synthesises and builds on our three recent studies on how data can be enhanced to improve student performance in engineering education. The first study gave a general overview of recommender systems and their use in choosing the most appropriate qualification programmes [11]. In the second study, the authors investigated the factors that affect students’ choices of and success in STEM programmes [12]. The third study used exploratory data analysis to investigate engineering student performance trends using a real-world dataset [13].
Accurately predicting academic student performance in universities is a crucial tool influencing decisions about student admission, retention, graduation, and tailored student support. Student performance prediction facilitates the planning of effective academic advising for students [14]. Machine learning algorithms trained on small datasets may not produce satisfactory results. Moreover, the accuracy of outcomes can be notably enhanced through efficient data pre-processing techniques. Despite many studies relying on restricted data for training machine learning methods, there is a widespread recognition that ample data is crucial for achieving accurate performance [15]. This study utilises a dataset of moderate size, incorporating numerous features.
Using real-world data to address student performance problems, especially in engineering, is growing due to the big data collected by higher education institutions [16]. Addressing student dropout and low graduation rates, particularly in engineering within developing countries, requires diverse tools and techniques. This study focuses on two interconnected areas: it uses a real-world dataset, addresses challenges commonly associated with such datasets to predict student performance and determine the suitability of students for qualifications. The study uses historical data from the 2016 and 2017 academic years for students enrolled for the National Diploma and Bachelor of Engineering Technology qualifications in civil, electrical, industrial, and mechanical engineering. The study adds to the body of knowledge by demonstrating steps required to harness real-world data and develop algorithms that address bias and imbalance in datasets. Unlike previous work in the field, this study emphasises removing features that could lead to bias while maintaining model accuracy and integrity, thereby pushing the boundaries of current knowledge in this area. Additionally, the study incorporates comparative evaluations of several different models to verify the research assumptions and draw conclusions within this new domain from an application perspective. To the best of the authors’ knowledge, this type of study, which exemplifies and addresses the aforementioned problems, has not yet been presented and will definitely enhance predictive models for academic advising. The research questions for the study are:
  • Which features from the dataset are the most significant when predicting student performance and qualification choice?
  • What is the performance of classification models when predicting student performance, qualification enrollment, and determining whether a student is better suited to enrol for mainstream or extended qualification?
The remainder of the article is as follows. The literature review is presented in Section 2, followed by the methodology used for the study and the description of the evaluation techniques in Section 3. The results are shown in Section 4, and their implications are discussed in Section 5. Section 6 concludes the study by summarising key aspects and providing limitations and directions for future research.

2. Literature Review
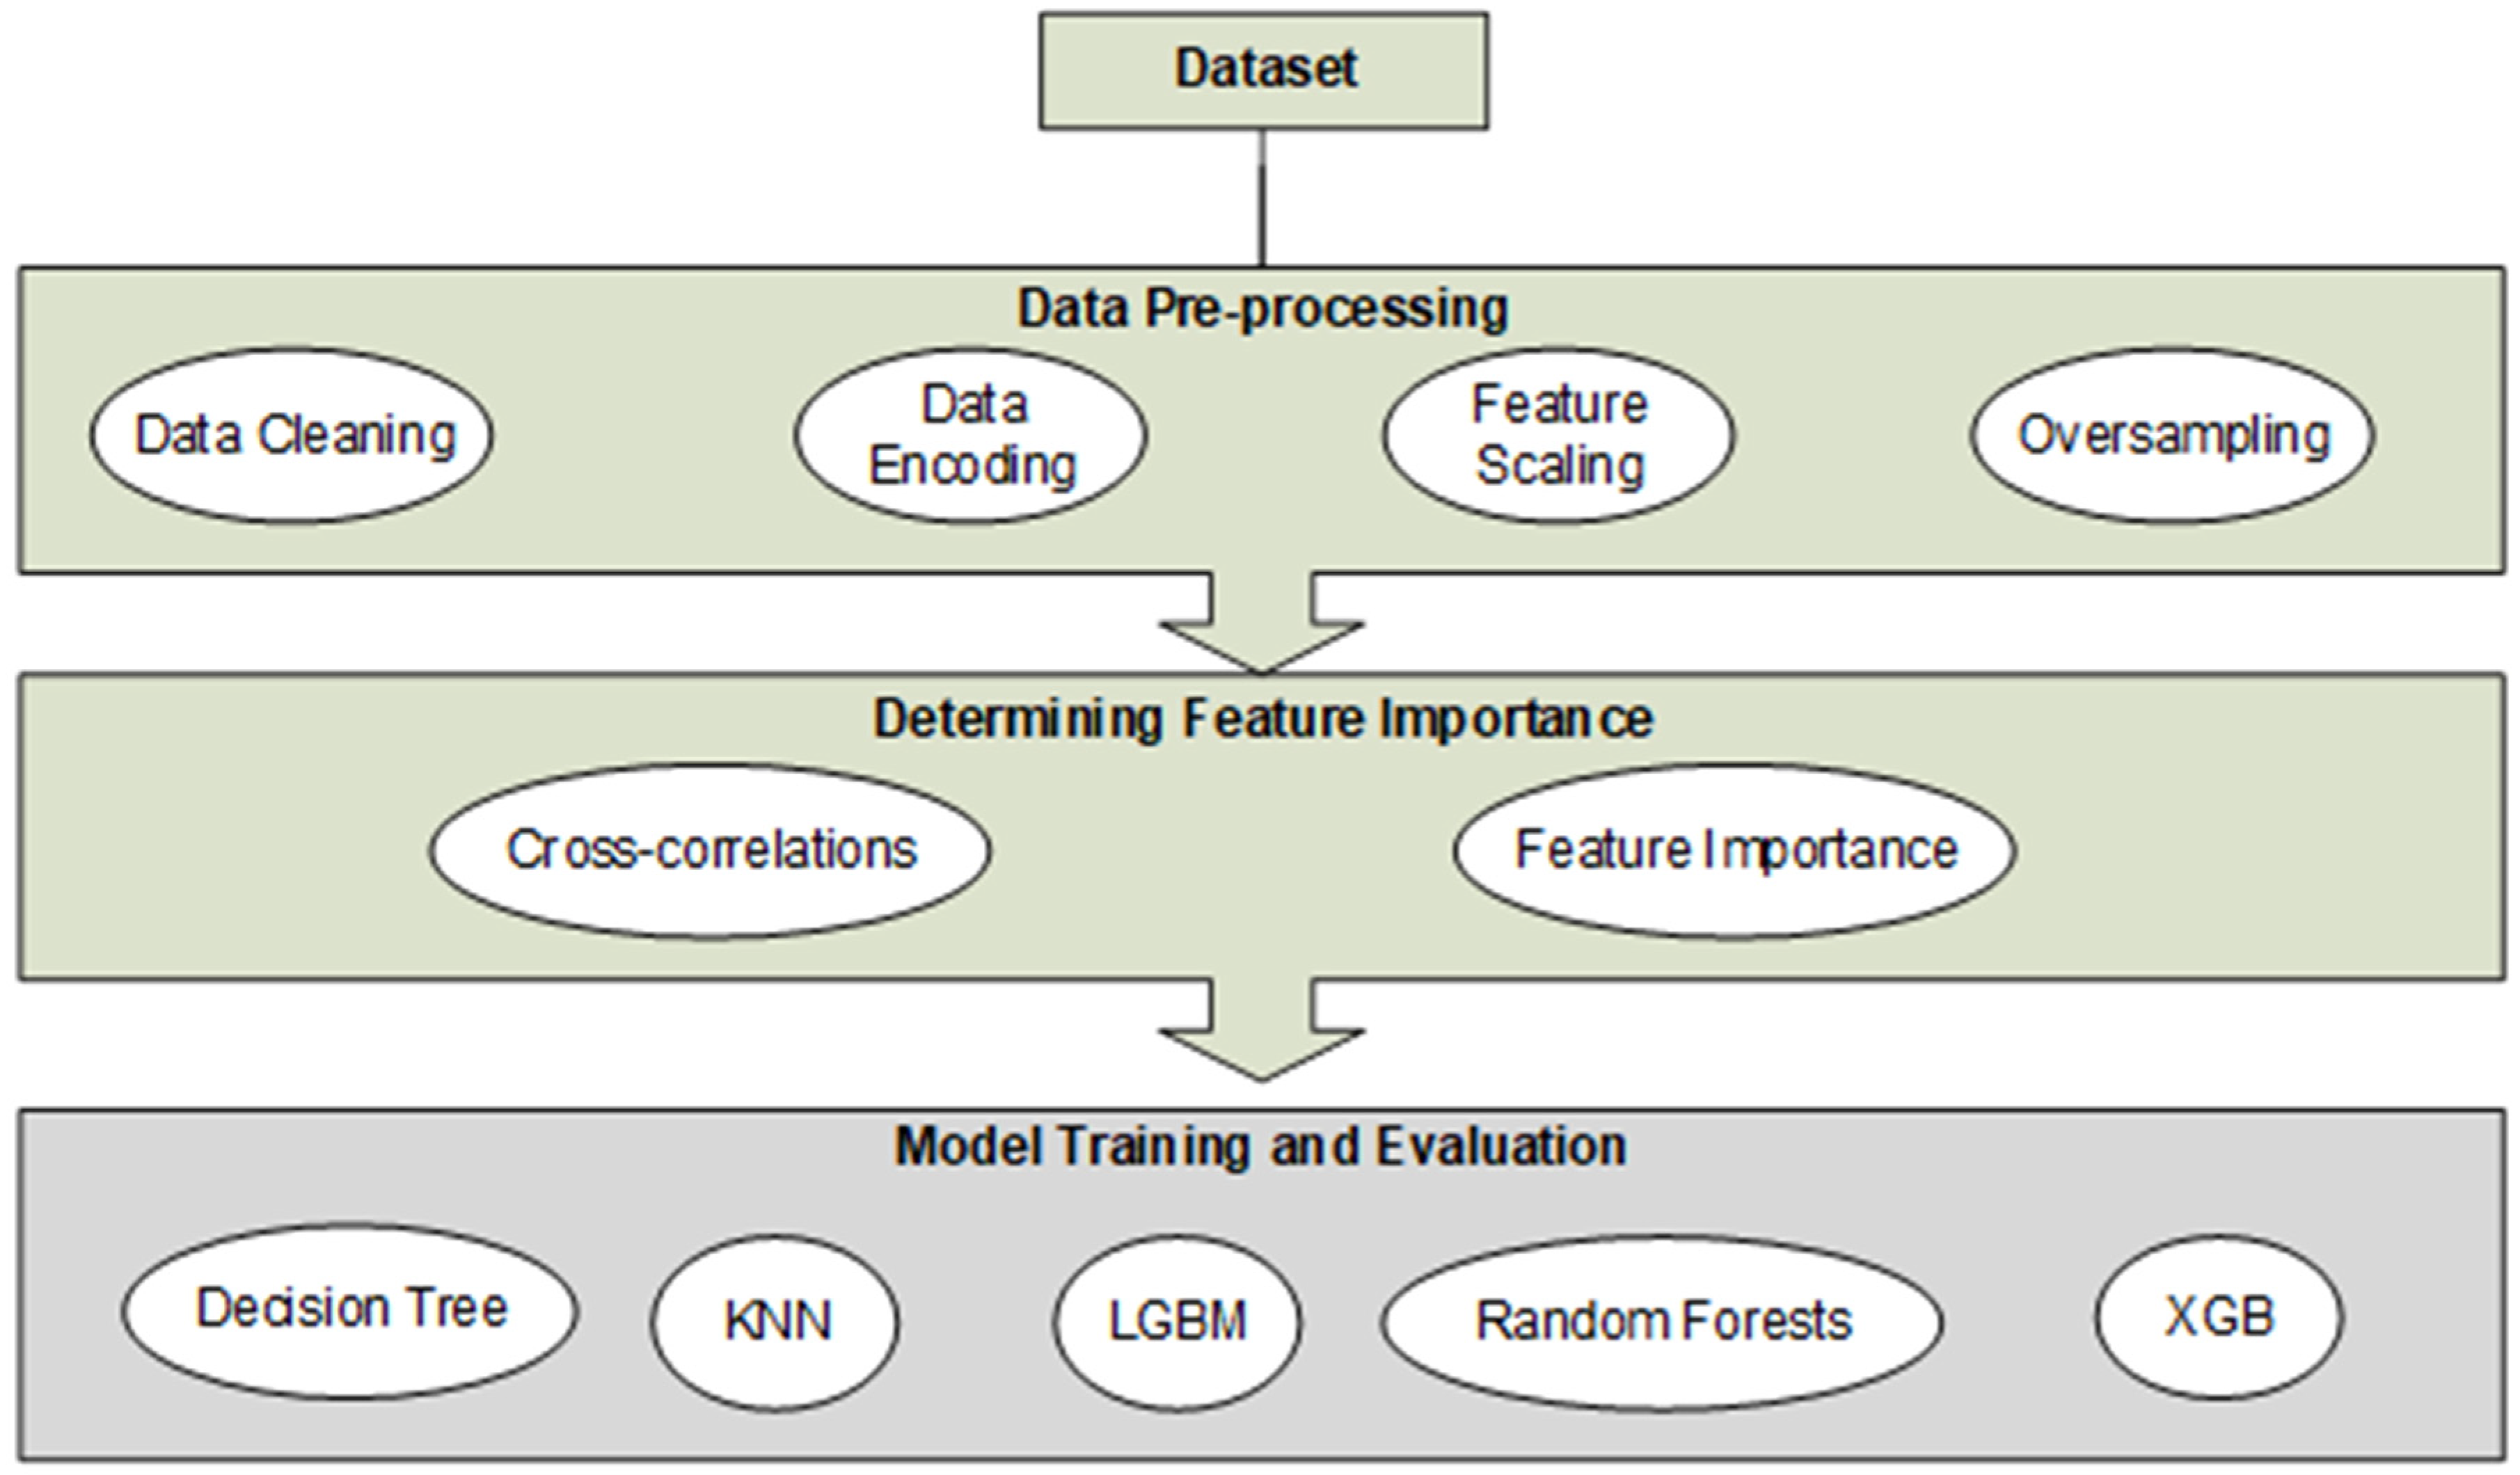
Academic advising is essential to improving student performance and retention [17]. Because academic advising can be complex and time-consuming, it requires careful attention and effort. Academic advising has changed from a straightforward, information-based strategy to a more thorough and holistic one, considering different facets of a student’s educational experience [3]. A study by Assiri et al. [18] explored the importance of academic advising in improving student performance. The authors conclude that there is a significant transition from traditional advising to artificial intelligence-based approaches.
Academic advising consists of three primary approaches: developmental advising, prescriptive advising, and intrusive advising, all of which entail interactions between advisors and students [19]. Developmental advising aids students in defining and exploring their academic and career aspirations through a structured process. While students often favour this approach, it is resource-intensive [20]. Prescriptive advising offers students vital information about academic programmes, policies, requirements, and course options, with the students taking the lead in discussing their academic progress. Intrusive advising typically targets at-risk or high-achieving students and involves advisors engaging with students at critical educational junctures. Although some students may perceive it as intrusive, this approach positively impacts student retention [21].
Predictive models for students’ academic performance are increasingly popular and have gained popularity as they can benefit both students and institutions. These models aid institutions in enhancing academic quality and optimising resources while providing students with recommendations to improve their performance. A systematic review of predictive models on students’ academic performance in higher education showed that past studies have employed diverse methods, such as classification, clustering, and regression, to predict academic performance [22]. Shahiri et al. [23] pointed out various techniques for predicting students’ academic performance, with educational data mining being a prominent method. Educational data mining involves extracting patterns and information from scholarly databases, which can be used in predicting students’ academic performance.
When predicting students’ academic performance based on degree level, studies incorporating university data, mainly grades from the first two years, demonstrated superior performance than studies solely considering demographics [24] or relying exclusively on pre-university data [25]. Conversely, when predicting academic performance based on the year of study, focusing solely on demographic information and pre-university data resulted in lower accuracy [26]. In contrast, studies that included university data showed improved results [27]. Predicting actual grades or marks is challenging due to the influence of various factors, including demographics, educational background, personal and psychological elements, academic progress, and other environmental variables [28]. Understanding the relationships between many variables is difficult, making performance classification a more popular approach among researchers.
Recommender systems are being investigated as a possible tool to increase the efficacy and efficiency of academic advising [29]. They have been used for several tasks, including context-sensitive annotation, identifying valuable objects and resources, and predicting and supporting student performance [30]. In education, a recommender system can facilitate student-faculty advisors’ ability to efficiently manage and provide personalised guidance to many students [3]. Sufficient quality data is needed to develop a recommender system. Higher education institutions now store large amounts of data, but there are restrictions on sharing personal data [31]. When there is a need for more data, creating highly accurate recommender systems is more challenging. Fortunately, advances in data mining have enabled a wide range of tools and approaches to fully utilise the data and produce insights [32].
The use of real-world datasets faces a challenge where the number of instances for a particular class could be higher than others. Class imbalance is when a dataset has an uneven distribution of classes with binary classification issues [33]. This disparity causes what is known as class imbalance or imbalanced datasets, which creates a challenge in machine learning [34].
There are limited studies that have been conducted using imbalanced datasets. A study by Fernández-García et al. [35] uses data mining techniques to predict students’ academic progress and dropout risk in computer science. The study developed a recommender system that assists students in selecting subjects. This system is built using a real-world dataset obtained from a Spanish institution. The method addresses issues of developing trustworthy recommender systems based on sparse, few, imbalanced, and anonymous data. The study shows that using decision support tools for students has the potential to improve graduation rates and reduce dropout rates. Another study analysed students’ previous academic performance and recommended the most appropriate educational programme using relevant features collected via correlation-based feature selection. Multiple machine learning algorithms were deployed to obtain the best results, and the most suitable model and relevant features were utilised in the recommendation process to ensure students reached their professional goals [36].
Past studies have suggested several approaches to constructing fair algorithms by reducing the impact of bias. Due to the link between some features, it has been shown that avoiding sensitive features is insufficient to eradicate bias because this association may lead to biased and unfair data [37]. To address data bias and generate unbiased recommendations, Kamiran and Calders [37] proposed a method for managing data bias and producing unbiased recommendations by altering the data before model training. This technique converts biased data into unbiased data by changing and ignoring the sensitive attribute in favour of predicting the class label using a ranking function learned from the biased data. Their findings showed that prejudice might be lessened by changing the labels for the positive and negative classes. Predicting students’ performance has been challenging for higher education institutions seeking to overcome persistent issues, such as dropping out, changing qualifications, failure, low academic grades, and prolonged graduation time. Some researchers have studied the influence of non-academic attributes, like student demographics and socio-economic status, on student performance [36,38]. While no one factor guarantees success in Science, Technology, Engineering, and Mathematics (STEM) fields, several factors, including academic preparation, encouraging family and social networks, and inclusive learning environments, are essential for attracting and keeping students in STEM fields [12].
Educational data mining can impact students’ privacy, security, and rights [39]. Ahmed et al. [1] found that students’ decisions to drop out were influenced by a mix of personal choices and structural factors, providing valuable insights into potential strategies for reducing attrition among academically eligible students. Shahiri, Husain and Rashid [23] contributed insights into course-specific determinants influencing student achievements, demonstrating the relevance of course-specific factors in academic advising.
In their study on tackling imbalanced class learning, Wu et al. [31] underscore the necessity of recognising and mitigating potential constraints, including data bias and handling sensitive data information in datasets. Elreedy and Atiya [32] emphasised the need to explore the critical point where data bias becomes problematic, highlighting the significance of addressing data imbalance. Given the reliance on data-driven approaches in academic advising, our study addresses the fair and effective handling of data imbalance, ensuring that algorithms do not introduce bias that could impact the prediction process. Petwal et al. [40] demonstrated the effectiveness of K-means clustering in identifying areas requiring improvement. Table 1 offers a concise overview of several studies within the field, delineating their respective contributions, strengths, and weaknesses. The review of the literature and the summary in the table reveal essential facets of academic advising.

3. Methodology

This section outlines the methodology followed for the study. The study’s methodology is divided into three main steps: data pre-processing, feature importance selection, and model training with evaluation. In the initial data pre-processing phase, the dataset undergoes cleaning, categorical feature encoding, standard scaling, and over-sampling. The second step focuses on feature engineering to identify the most impactful features for predicting student performance and qualifications. The final stage encompasses model training and evaluation. During data pre-processing, the dataset is meticulously cleaned and organised using Python 3.11.2, essential features are systematically chosen, and issues such as imbalance and biases are addressed. In the third step, predictive models for student performance are trained using machine learning techniques. Models are then assessed based on selected features, employing performance metrics to measure accuracy and effectiveness in predicting student outcomes. Figure 1 depicts the methodology we followed in the study.

3.1. Experimental Setup

The experiment used Python programming language within a Jupyter Notebook environment. The computer had the following specs: Intel Core i5-1035G1, 1.19 GHz microprocessor, 8 GB processor and 64-bit operating system.

3.2. Dataset Description

A real-world dataset of information on students enrolled for the 2016 and 2017 academic years at the University in Johannesburg (UJ), South Africa, was used. The dataset was for students pursuing a National Diploma and a Bachelor of Engineering Technology qualifications in civil, electrical, industrial, and mechanical engineering. UJ is located in Gauteng, the country’s most densely populated province. The Institutional Planning, Evaluation, and Monitoring department sourced the dataset from UJ’s institutional repositories. The Faculty of Engineering and the Built Environment granted ethical clearance to use the data, with the ethical clearance number UJ_FEBE_FEPC_00685.
Table 2 shows the variables and their distribution in the initial dataset. The columns encompass academic-related information (academic year, student number, qualification flag, qualification, result groupings, and period of study), demographic details (gender, birth date, marital status, language, nationality, ethnic group, and race), academic performance indicators (admission point scores (APS), module marks in mathematics and physical sciences), and information about previous activities. The dataset comprises 29,158 records and 22 columns. The target variable, ‘result groupings,’ consists of five classes with the following distribution: ‘may continue studies’—23,689, ‘no/slow progress’—2802, ‘obtained qualification’—1753, ‘no re-admission’—901, ‘no result’—13.

3.3. Data Pre-Processing

This step involves putting the raw data into a comprehensible format through several stages. Real-world data is frequently inconsistent, lacks particular behaviours, and is almost certainly full of mistakes. Data preparation is a tried-and-true technique for addressing these critical problems with the raw data. Data pre-processing prepares the raw data for further analysis [42].

3.3.1. Data Cleaning

Using real-world datasets in the educational setting may be biased because women are underrepresented in STEM. When the user’s demographic information, such as gender, ethnicity, and age, is used in classification problems, this bias is proliferated in the classifications made [43]. To establish a just and inclusive algorithm, it is crucial to ensure that concerns of bias and ethics are excluded from the dataset used for building the predicting qualifications. Therefore, it was necessary to remove demographic characteristics from the dataset. Gender, birthdate, marital status, language, nationality grouping, ethnic group, international race, urban-rural and study address were removed. Table 3 describes the data types of the features contained in the dataset after cleaning. The elimination of demographic characteristics aids in reducing any potential biases that may result from elements like ethnicity or nationality. This ensures that predictions are only based on student’s abilities and achievements, which reduces the possibility of perpetuating discriminatory practices.

3.3.2. Data Encoding

Data encoding involves transforming the categorical data into numerical data while preserving the dataset’s structure (i.e., the same column names and index). Encoding ensures that the categorical data is represented numerically and can be used as input for the algorithm. This can help improve the accuracy and performance of the algorithm. Encoding converts raw data into a format that machine learning algorithms may employ [44].
Popular encoding methods include one-hot encoding since it is an easy process. In one-hot encoding, each object or feature is represented by a separate binary vector representing a category [45]. In contrast to embedding, which means each object or feature is a dense vector in a continuous space, label encoding gives each category a number label [46]. The appropriate encoding method must be used for the recommender system to be accurate and practical since it affects how the data is stored. In this study, we employed one-hot encoding.

3.3.3. Feature Scaling

To ensure that all features, regardless of how they may appear, are equally important, feature scaling is necessary. Feature scaling is an often-used process in machine learning to normalise features [46]. By permitting fair and accurate feature comparisons, feature scaling, explicitly employing the standard scaler, is an essential pre-processing step that enhances model performance and accuracy. Additionally, the features in the dataset were scaled using the StandardScaler function from the Scikit-Learn library. This scaling process ensures that the features are comparable, avoiding any potential bias arising from differences in their magnitudes.

3.3.4. Oversampling

Advances in data science have led to the development of techniques to deal with class imbalance, such as data augmentation, over-sampling, under-sampling and ensemble methods. Two basic approaches can address the challenges of using imbalanced datasets: algorithm-level and data-level strategies [31]. Data-level methods, such as the SMOTE technique, entail modifying the class distribution of imbalanced data through under-sampling, over-sampling, or a mix of the two [32]. Oversampling is the suggested strategy for highly imbalanced datasets with few minority samples [16]. These techniques could, however, result in overfitting or the loss of valuable traits in majority classes. Algorithm-level approaches, such as bagging, boosting, or hybrid ensemble methods, entail modifying the classifier to imbalanced data. These approaches have improved the accuracy of decision tree models and other classifiers [47].
The dataset displays a high-class imbalance for the feature ‘results groupings’. Therefore, the performance of the classification model may improve if the imbalanced dataset is handled correctly [33]. The model can then correlate to the majority class and ignore the minority class. After splitting the dataset into training and testing sets using a 75:25 ratio, the distribution of classes within the target variable was as follows: ‘may continue studies’—17,771, ‘no/slow progress’—2112, ‘obtained qualification’—1320, ‘no re-admission’—655, ‘no result’—10. It’s important to note that employing the target variable with such imbalanced class proportions may introduce a bias toward the largest class, ‘May continue studies’. The evaluation metrics may also be biased and may fail to consider the minority class. This study used the SMOTE technique from the imbalanced-learn library (imblearn) to address the class imbalance challenges. After this, the classes were balanced, as shown in Table 4 below.

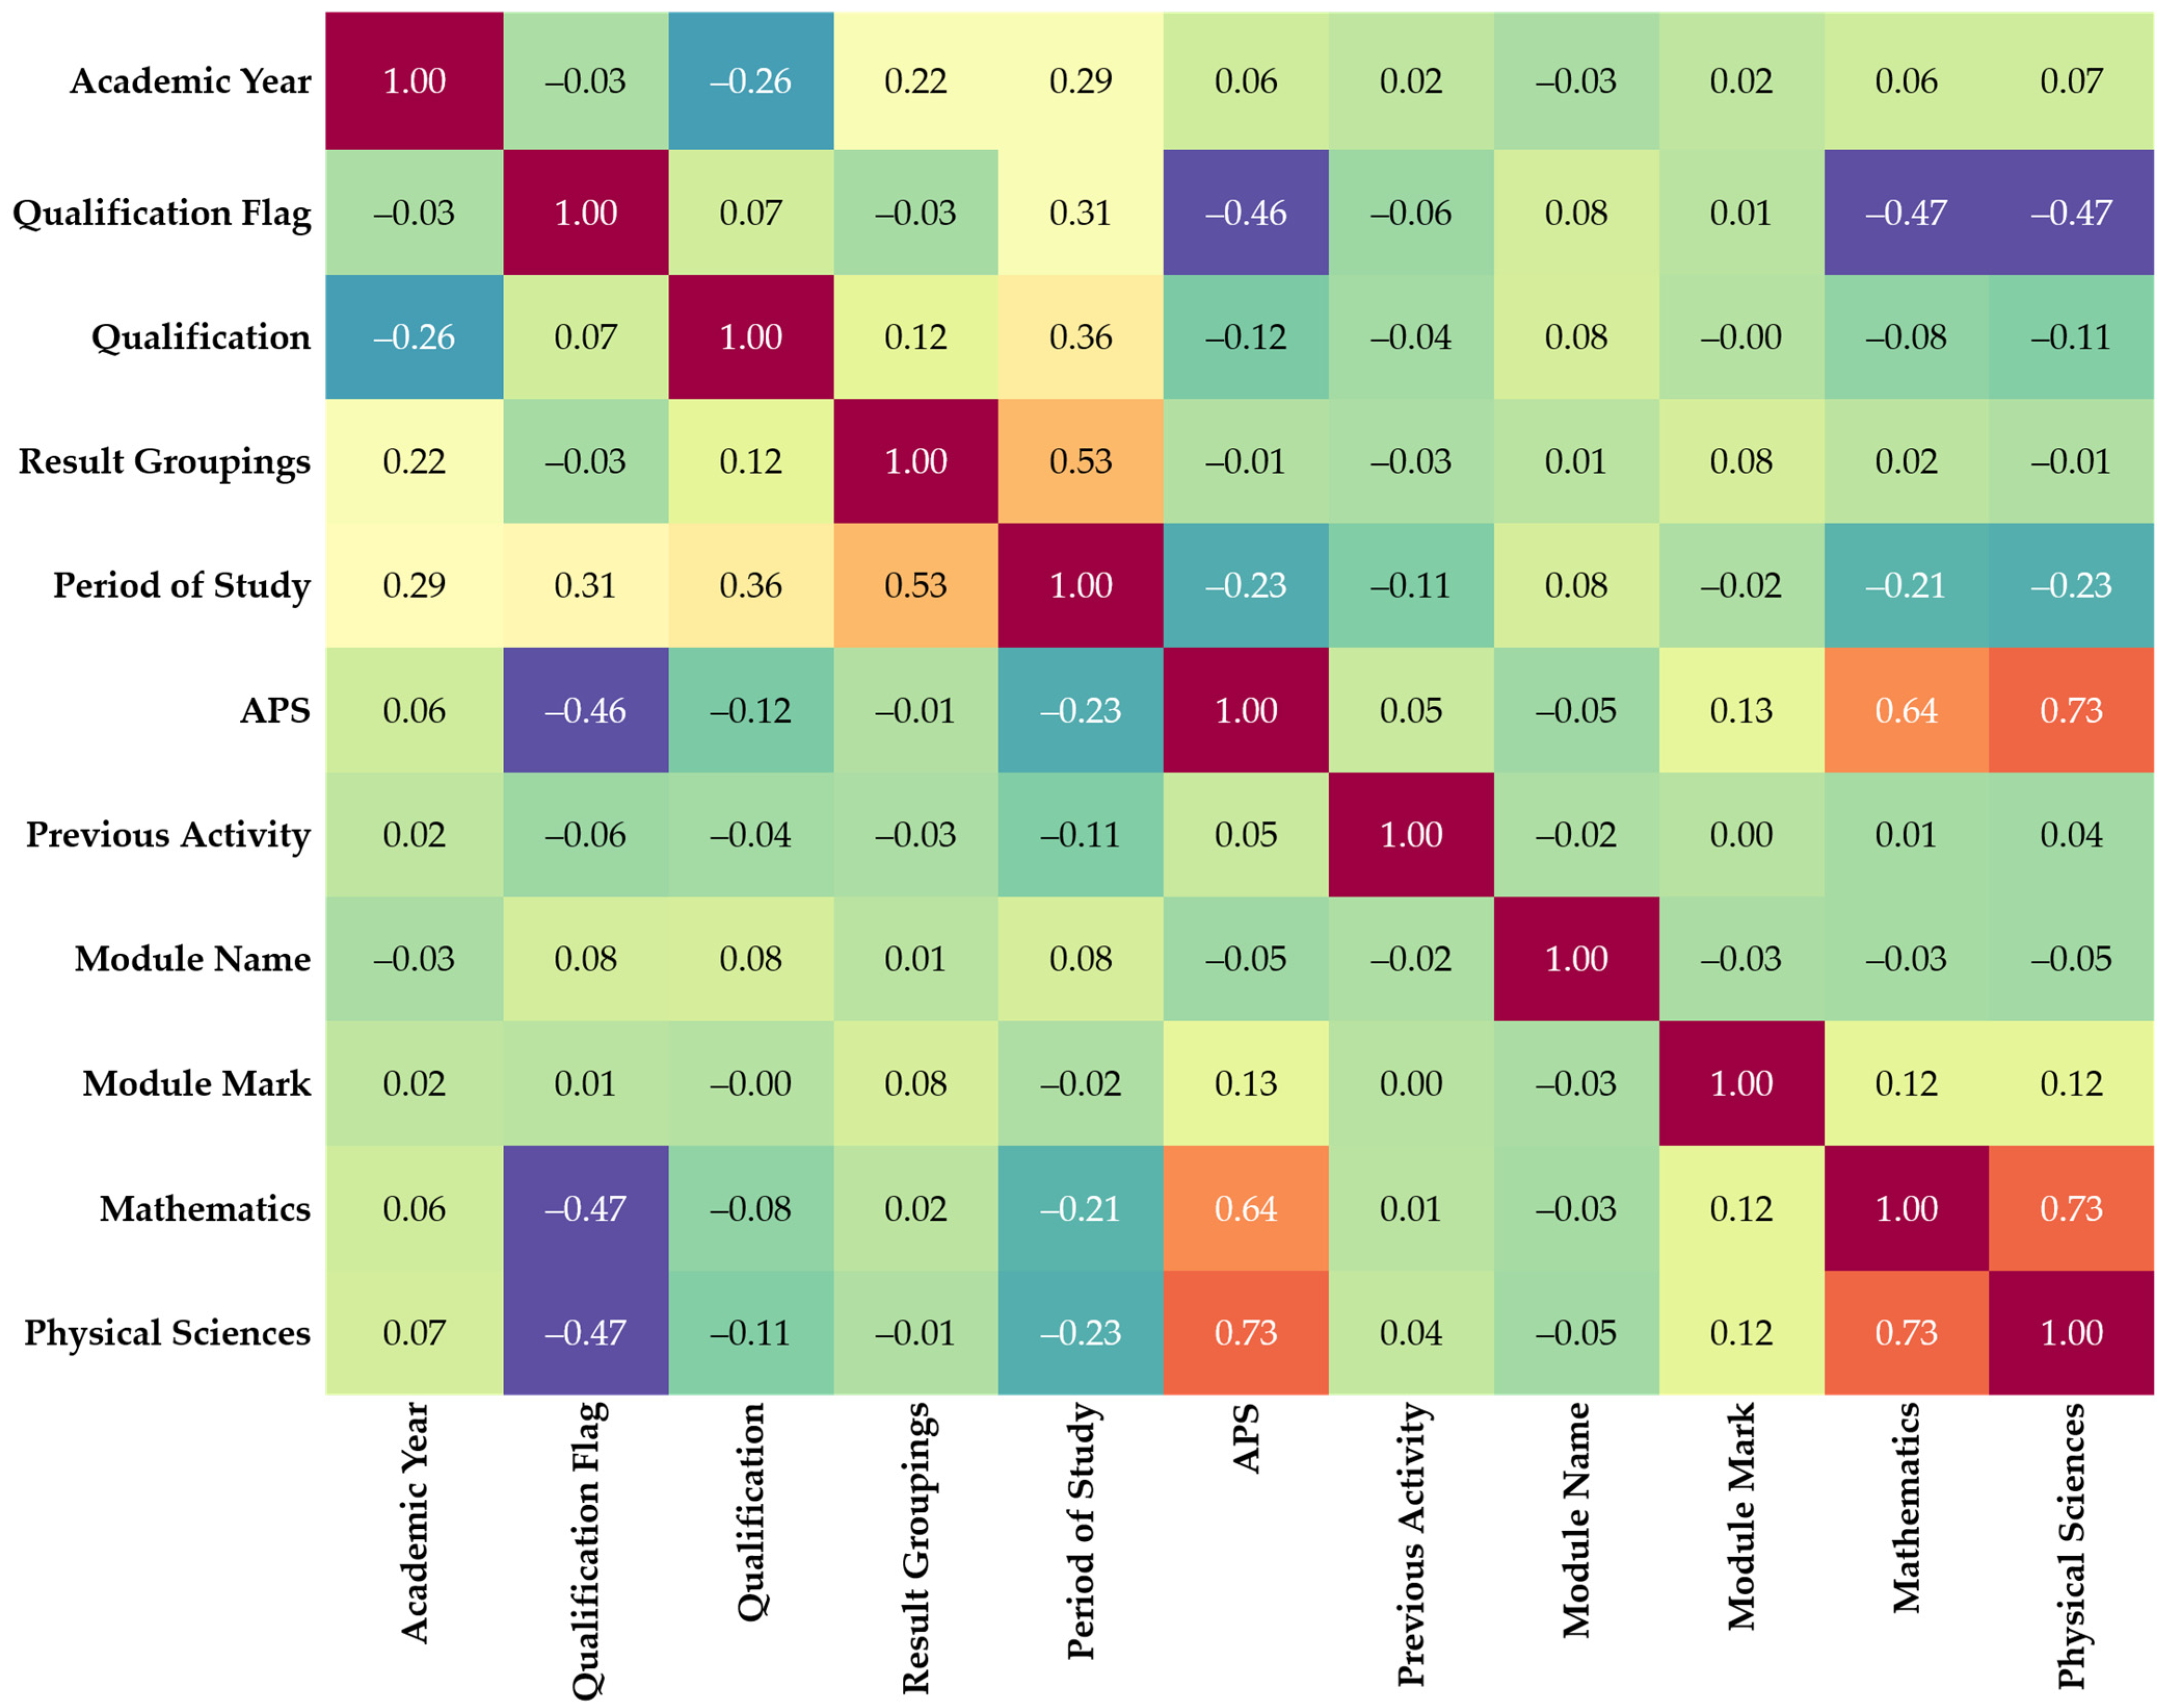
3.4. Determining Feature Importance

Cross-Correlations

Cross-correlations can discover closely related characteristics and acquire insights into the relationships between various dataset features. Figure 2 shows the correlation matrix of the dataset produced using a heatmap of the Seaborn library.
The correlation matrix is calculated using the correlation function. Linear solid relationships between feature pairs are shown by high correlations (close to 1 or −1) between them. When examining the generated heatmap, it appears that the features in the dataset do not have any significant linear correlations (correlation coefficients close to 1 or −1). APS and physical sciences have a moderately positive link, as indicated by the highest correlation coefficient, 0.73. This correlation coefficient is also shared by mathematics and physical sciences. APS and mathematics have a correlation coefficient of 0.64, indicating a moderately positive link. In this situation, deleting closely linked features was unnecessary because there were no highly associated features. A correlation coefficient of 0.53 between the period of study and According to the matrix, the correlation coefficient between APS and module mark is 0.13, indicating a weak positive relationship. Similarly, the correlation coefficients for mathematics, module marks, and physical sciences marks are 0.12, meaning weak positive associations. These findings suggest a slight tendency for higher scores in APS, mathematics, and physical sciences, which tend to be associated with slightly higher module marks at the university level.

3.5. Model Training and Evaluation

Several data mining classification techniques have been applied to predict student performance. For example, decision trees and random forests were used by Huynh-Cam et al. [48] to predict first-year students’ learning performance using pre-semester variables, focusing on family background factors. The sample comprised 2407 first-year students from a vocational university in Taiwan. Another study employed multiple algorithms for predicting students’ performance. The study used k-nearest neighbours (KNN), decision tree, random forest, gradient boosting, extreme gradient boosting (XGB) and light gradient boosting machine (LGBM) [49].
Scikit-learn is an open-source machine learning module in Python that includes a variety of classification, clustering, and regression techniques. The main goal of this module is to solve supervised and unsupervised problems [50]. In this study, the training and test sets were split in a 75:25 ratio, meaning that 75% of the records in the dataset were used to train the algorithms, and the remaining 25% were used to evaluate their performance. The following briefly describes the models employed in predicting qualifications.
Decision trees are a tree-based method where each path originating from the root is determined by a sequence that separates the data until a Boolean result is achieved at the leaf node [51].
KNN algorithms classify objects in the feature space based on recent training samples. The Euclidean distance is a distance metric that is used to determine proximity. As a result, in this study, the students are categorised by their closest k neighbours, with the object assigned to the class with the highest percentage of those neighbours [52].
LGBM is a highly efficient gradient-boosting decision tree which speeds up the training process while obtaining practically the same accuracy [53].
Random forests are multiple decision trees trained in an ensemble process to produce a single class label for each ensemble [54]. The decision trees are constructed using bootstrapped samples, limiting the features available at each stage of the algorithm and random split selection, where each tree is grown on a different subset of the training data [55].
XGB is a gradient-boosting technique with optimised speed and efficiency. It uses a regularised model to create a robust classifier by combining many weak classifiers. It also uses a cutting-edge method called gradient boosting, using second-order derivatives to increase accuracy [56].
The performance metrics can generally be divided into three groups. Firstly, metrics based on a confusion matrix: precision, recall, F-measure, Cohen’s kappa, accuracy, etc. Secondly, metrics that measure the deviation from the actual probability are based on a probabilistic understanding of mistakes, such as mean absolute error (MAE), accuracy ratio, and mean squared error. The third group is metrics based on discriminatory power, such as receiver operating characteristics and variants, the area under the curve (AUC), precision-recall curve, Kolmogorov-Smirnov, lift chart, etc. [57].
Accuracy, precision, recall, F1-score, specificity and AUC are the most often used metrics for binary classification based on the values of the confusion matrix. The most often used metrics for multi-class classification are accuracy, precision, recall, and F1-score [58]. The accuracy and coverage of a recommendation algorithm are two examples of the many metrics that may be used to evaluate its quality. The metrics that are used depend on the type of filtering method that is used. Accuracy measures the proportion of correct predictions among all potential predictions instead of coverage, which gauges the percentage of objects in the search space for which the system can generate recommendations [59]. Statistical accuracy measures assess the correctness of a filtering approach by directly comparing the projected ratings with the actual user rating. Statistical accuracy measurements commonly include MAE, root mean square error (RMSE), and correlation. MAE is the most widely used and well-known metric of suggestion divergence from a user’s particular value [60]. Precision, recall, and F-measure are commonly used for decision support accuracy [61].
The receiver operating characteristic (ROC) curves are powerful tools in machine learning to evaluate a classifier’s predictive capacity irrespective of class distribution or error costs. They represent a performance by positioning the model relative to the y = x diagonal line, where better performance is denoted by the curve rising above it. ROC is a two-dimensional graph with false positives on the horizontal axis and true positives on the vertical axis [62]. The AUC curve is frequently used in machine learning but only applies to classification problems with just two classes [63]. For this reason, the two metrics, ROC and AUC, were not used in this study. This study used statistical and decision support accuracy measurements to evaluate the performance of the models. These metrics are described in Table 5.

4. Results

By removing features like ethnicity or nationality and utilising high school performance features, we attempt to make predictions based solely on students’ abilities and achievements, not demographics, thereby promoting fairness in prediction tasks and preventing biases.

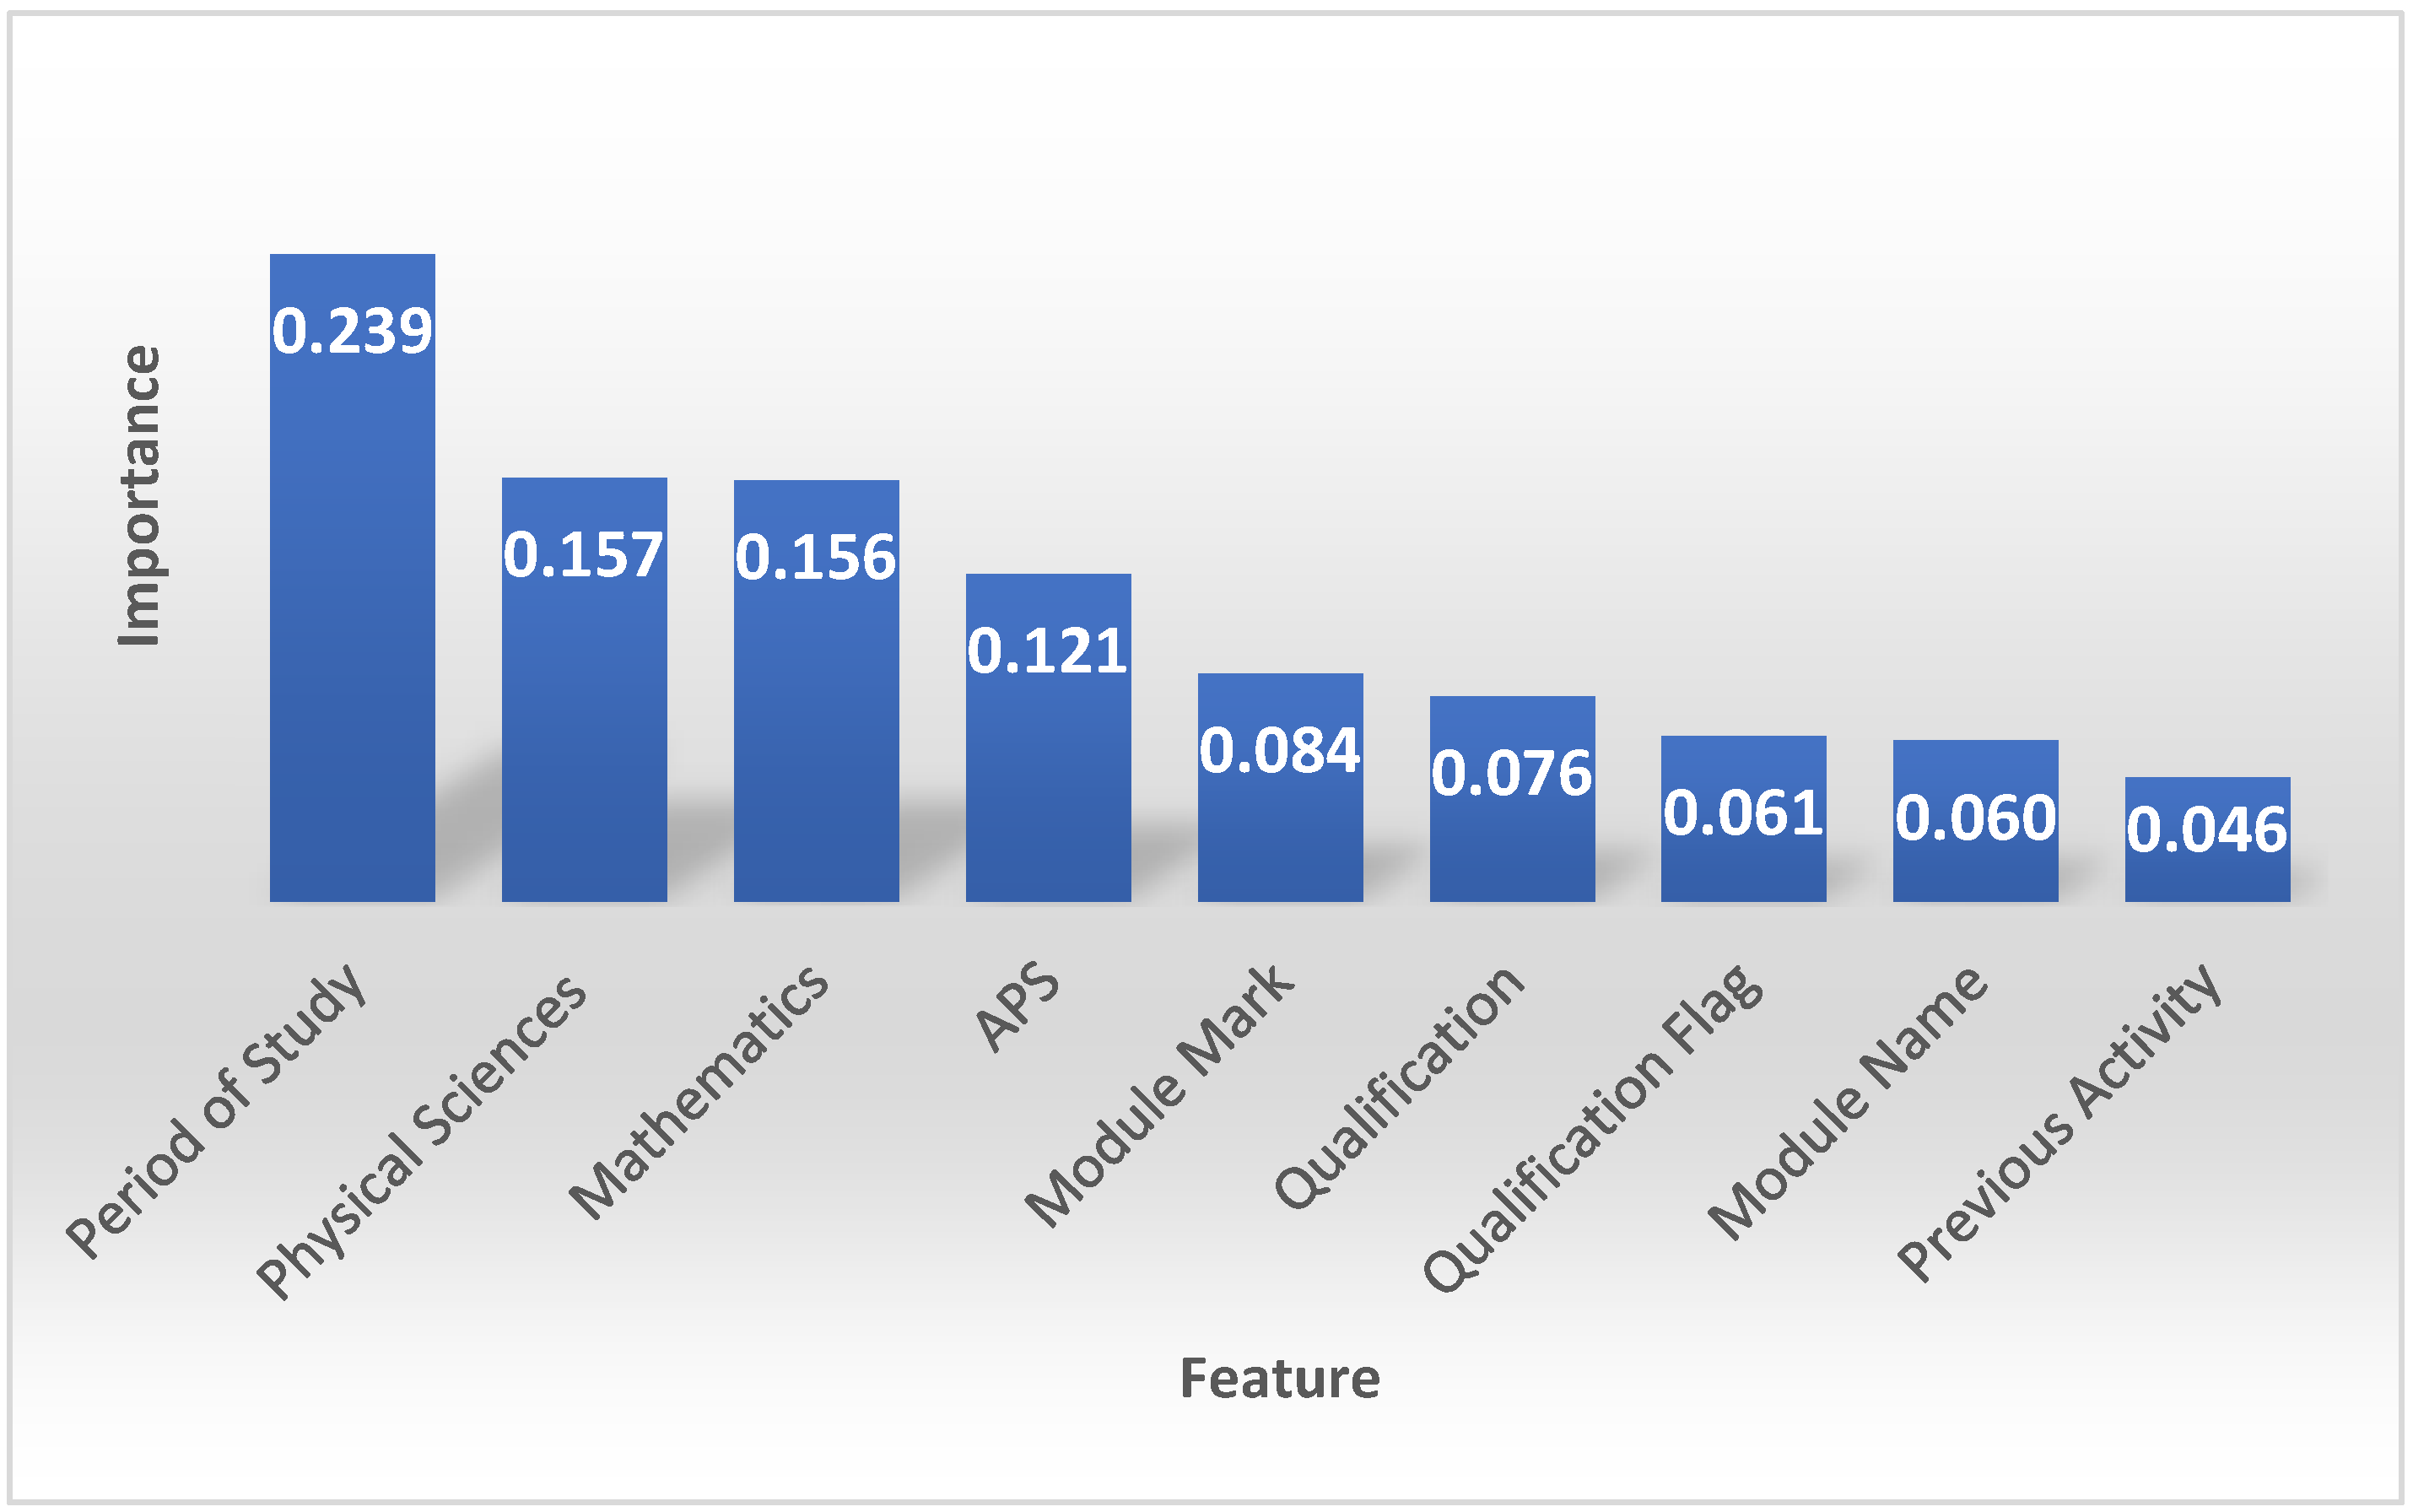
4.1. Important Features When Predicting Student Performance

This study used result grouping as the target to ascertain the important features when predicting students’ performance. The result grouping feature consists of five observations—obtained qualification, continuing with studies, no/slow progress, no result and no readmission. Figure 3 shows the importance of the feature obtained from running the random forest classifier. The feature with the highest coefficient score (0.24) is the period of study. This means that the period of study influences the model’s predictions most. Physical sciences (0.16), mathematics (0.16), and APS (0.12) have relatively high coefficient scores, indicating that they all contribute significantly to the model’s predictions. These features have a substantial influence on the overall performance of the model. On the other hand, features like module mark (0.08), qualification (0.08), qualification flag (0.06), module name (0.06) and previous activity (0.05) exhibit lower importance.

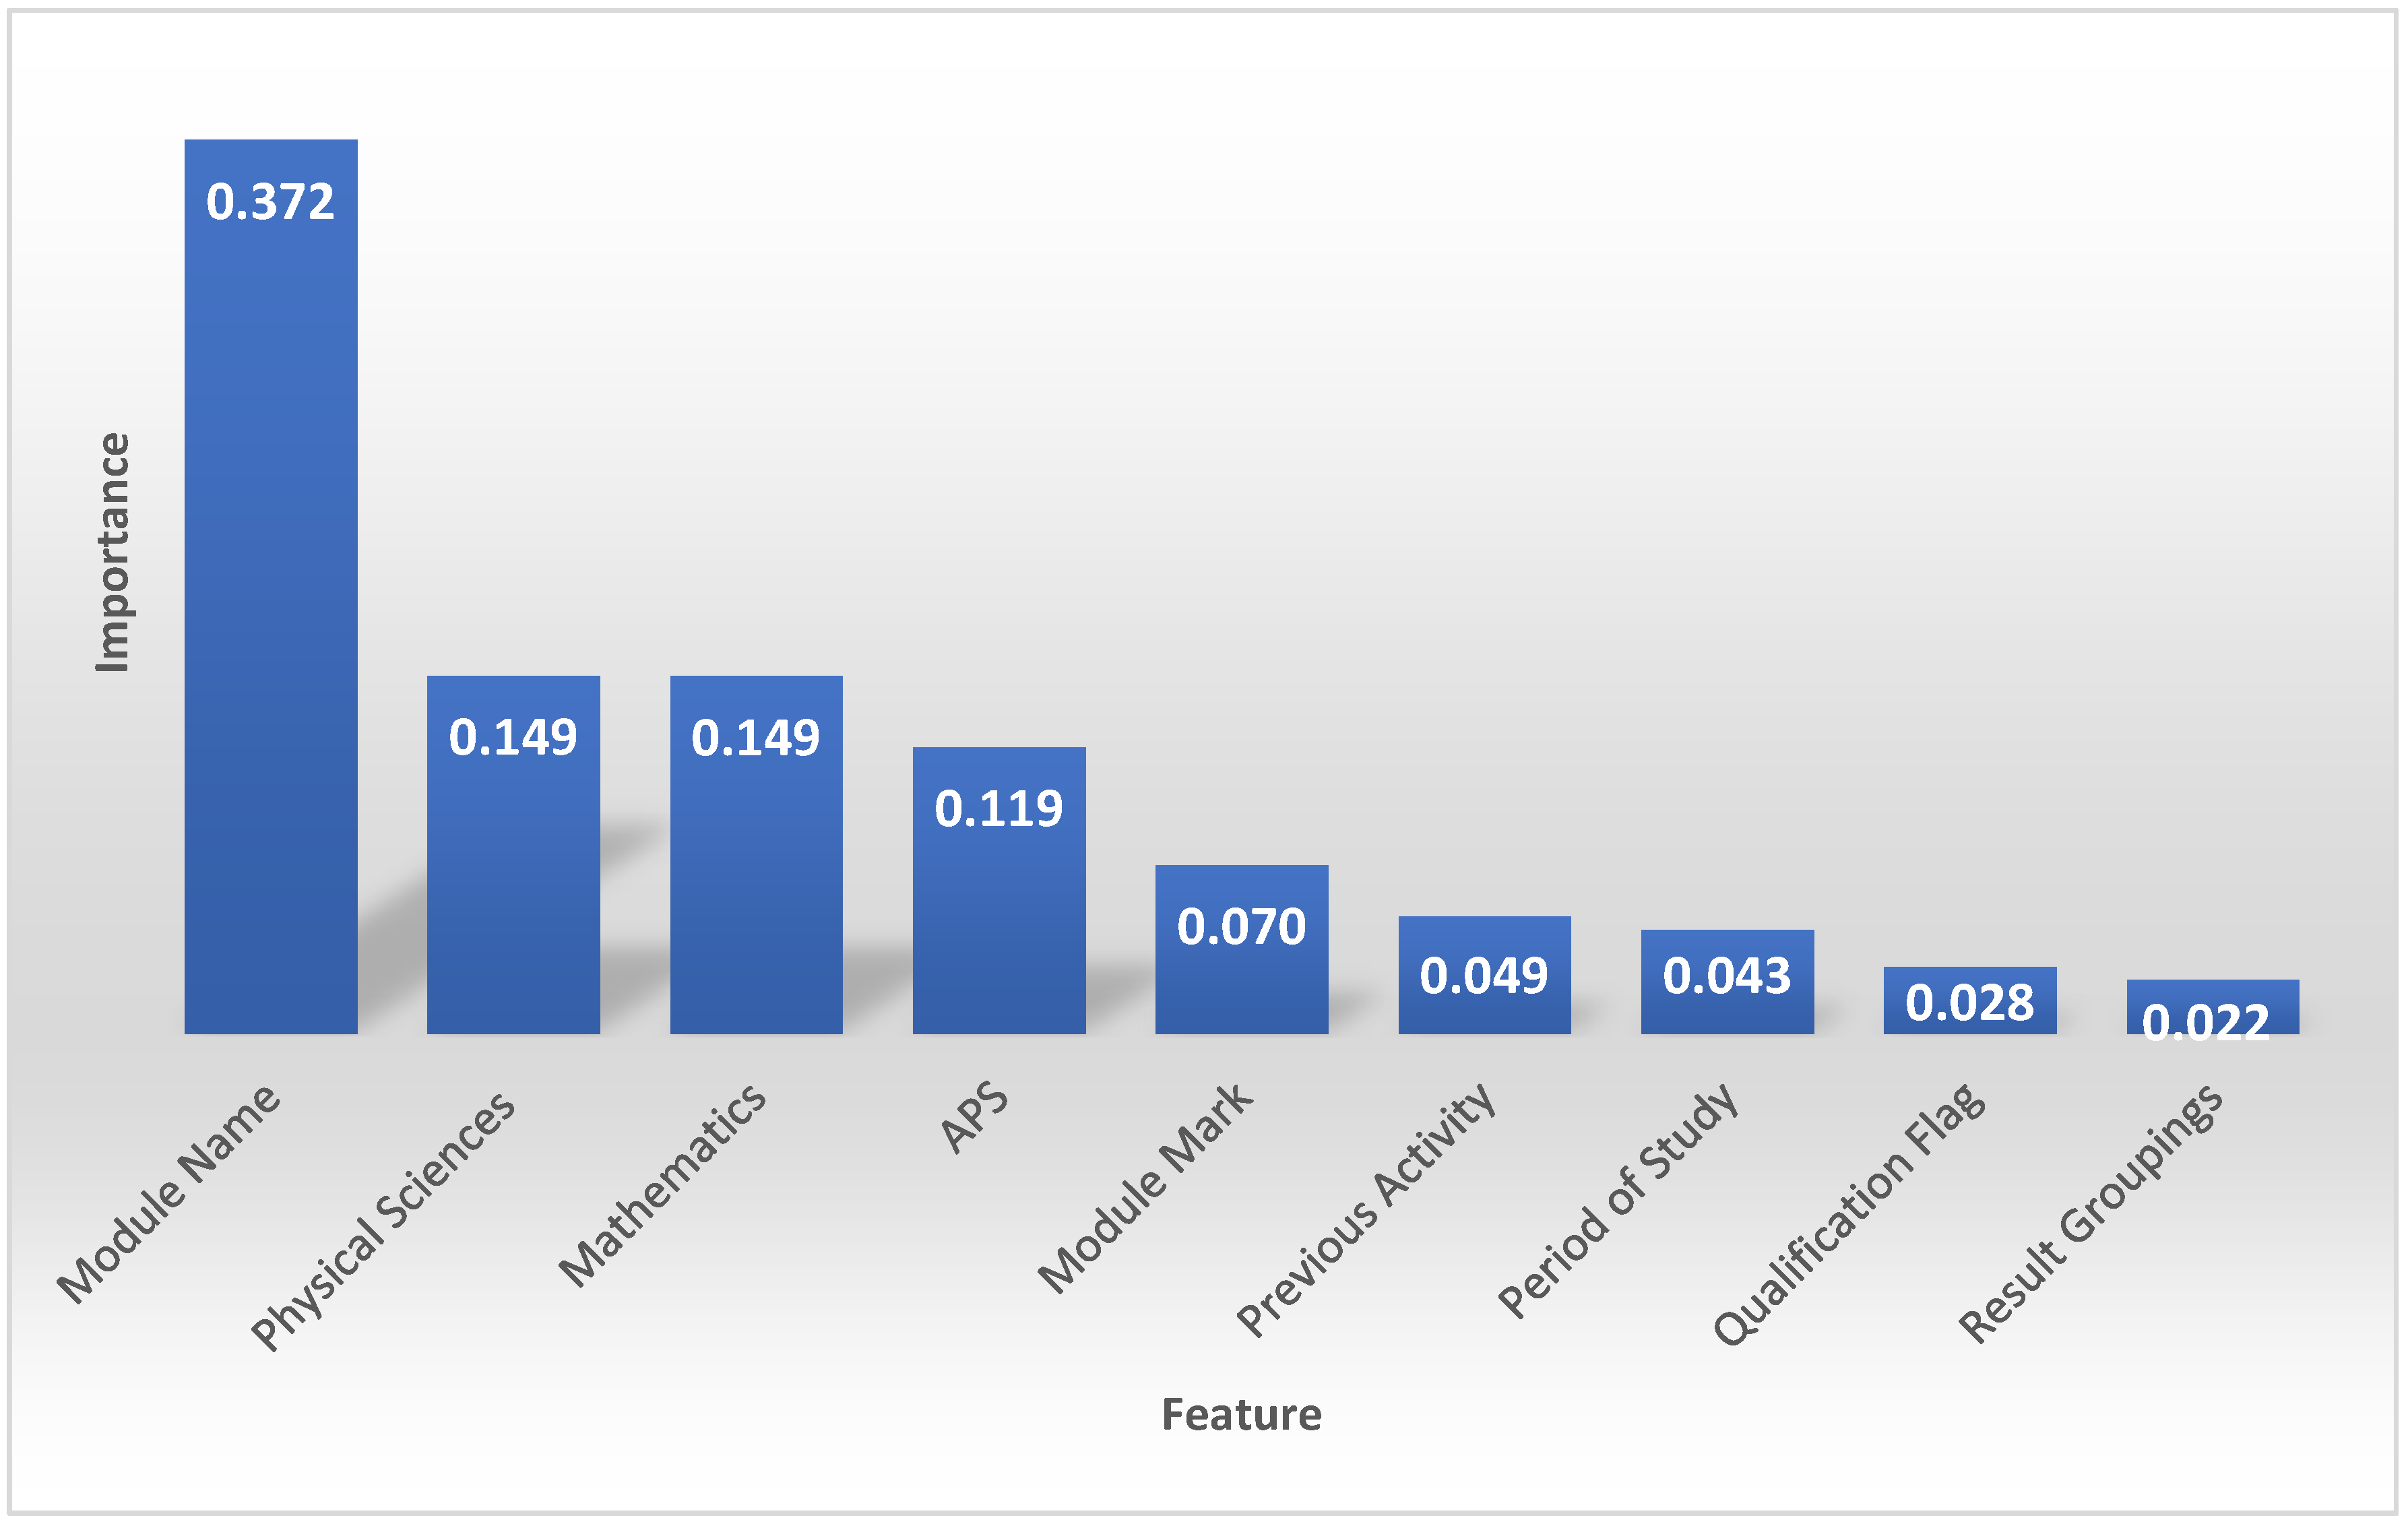
4.2. Important Features When Predicting Qualifications

We used ‘qualification’ as the target to ascertain the influential features when predicting qualifications. The qualification feature consists of eight observations—four National Diplomas in civil, electrical, industrial, and mechanical engineering and four Bachelor of Engineering Technology qualifications in civil, electrical, industrial, and mechanical engineering. Figure 4 shows the important features obtained using the random forest’s feature importance attribute. As shown, some features do not influence the performance of the models. The figures show which features are more significant for the classification job but do not affect the model’s predictions. The predictions are based on the model’s parameters, which encapsulate the learned relationship between the characteristics and the target features.
The module name is the feature with the highest coefficient score (0.37). This implies that the feature significantly impacts the results or predictions of the model. Additionally, significant importance ratings for features like physical sciences (0.15), mathematics (0.15), and APS (0.12) are displayed, suggesting their usefulness in the model’s decision-making process. Some features have comparatively lower significance scores than others, indicating that they impact the model’s predictions less. These features include previous activity, period of study, qualification flag and result groupings. Although these features influence the model, their impact is relatively less than that of the more significant features.

4.3. Training and Evaluating the Performance of the Models

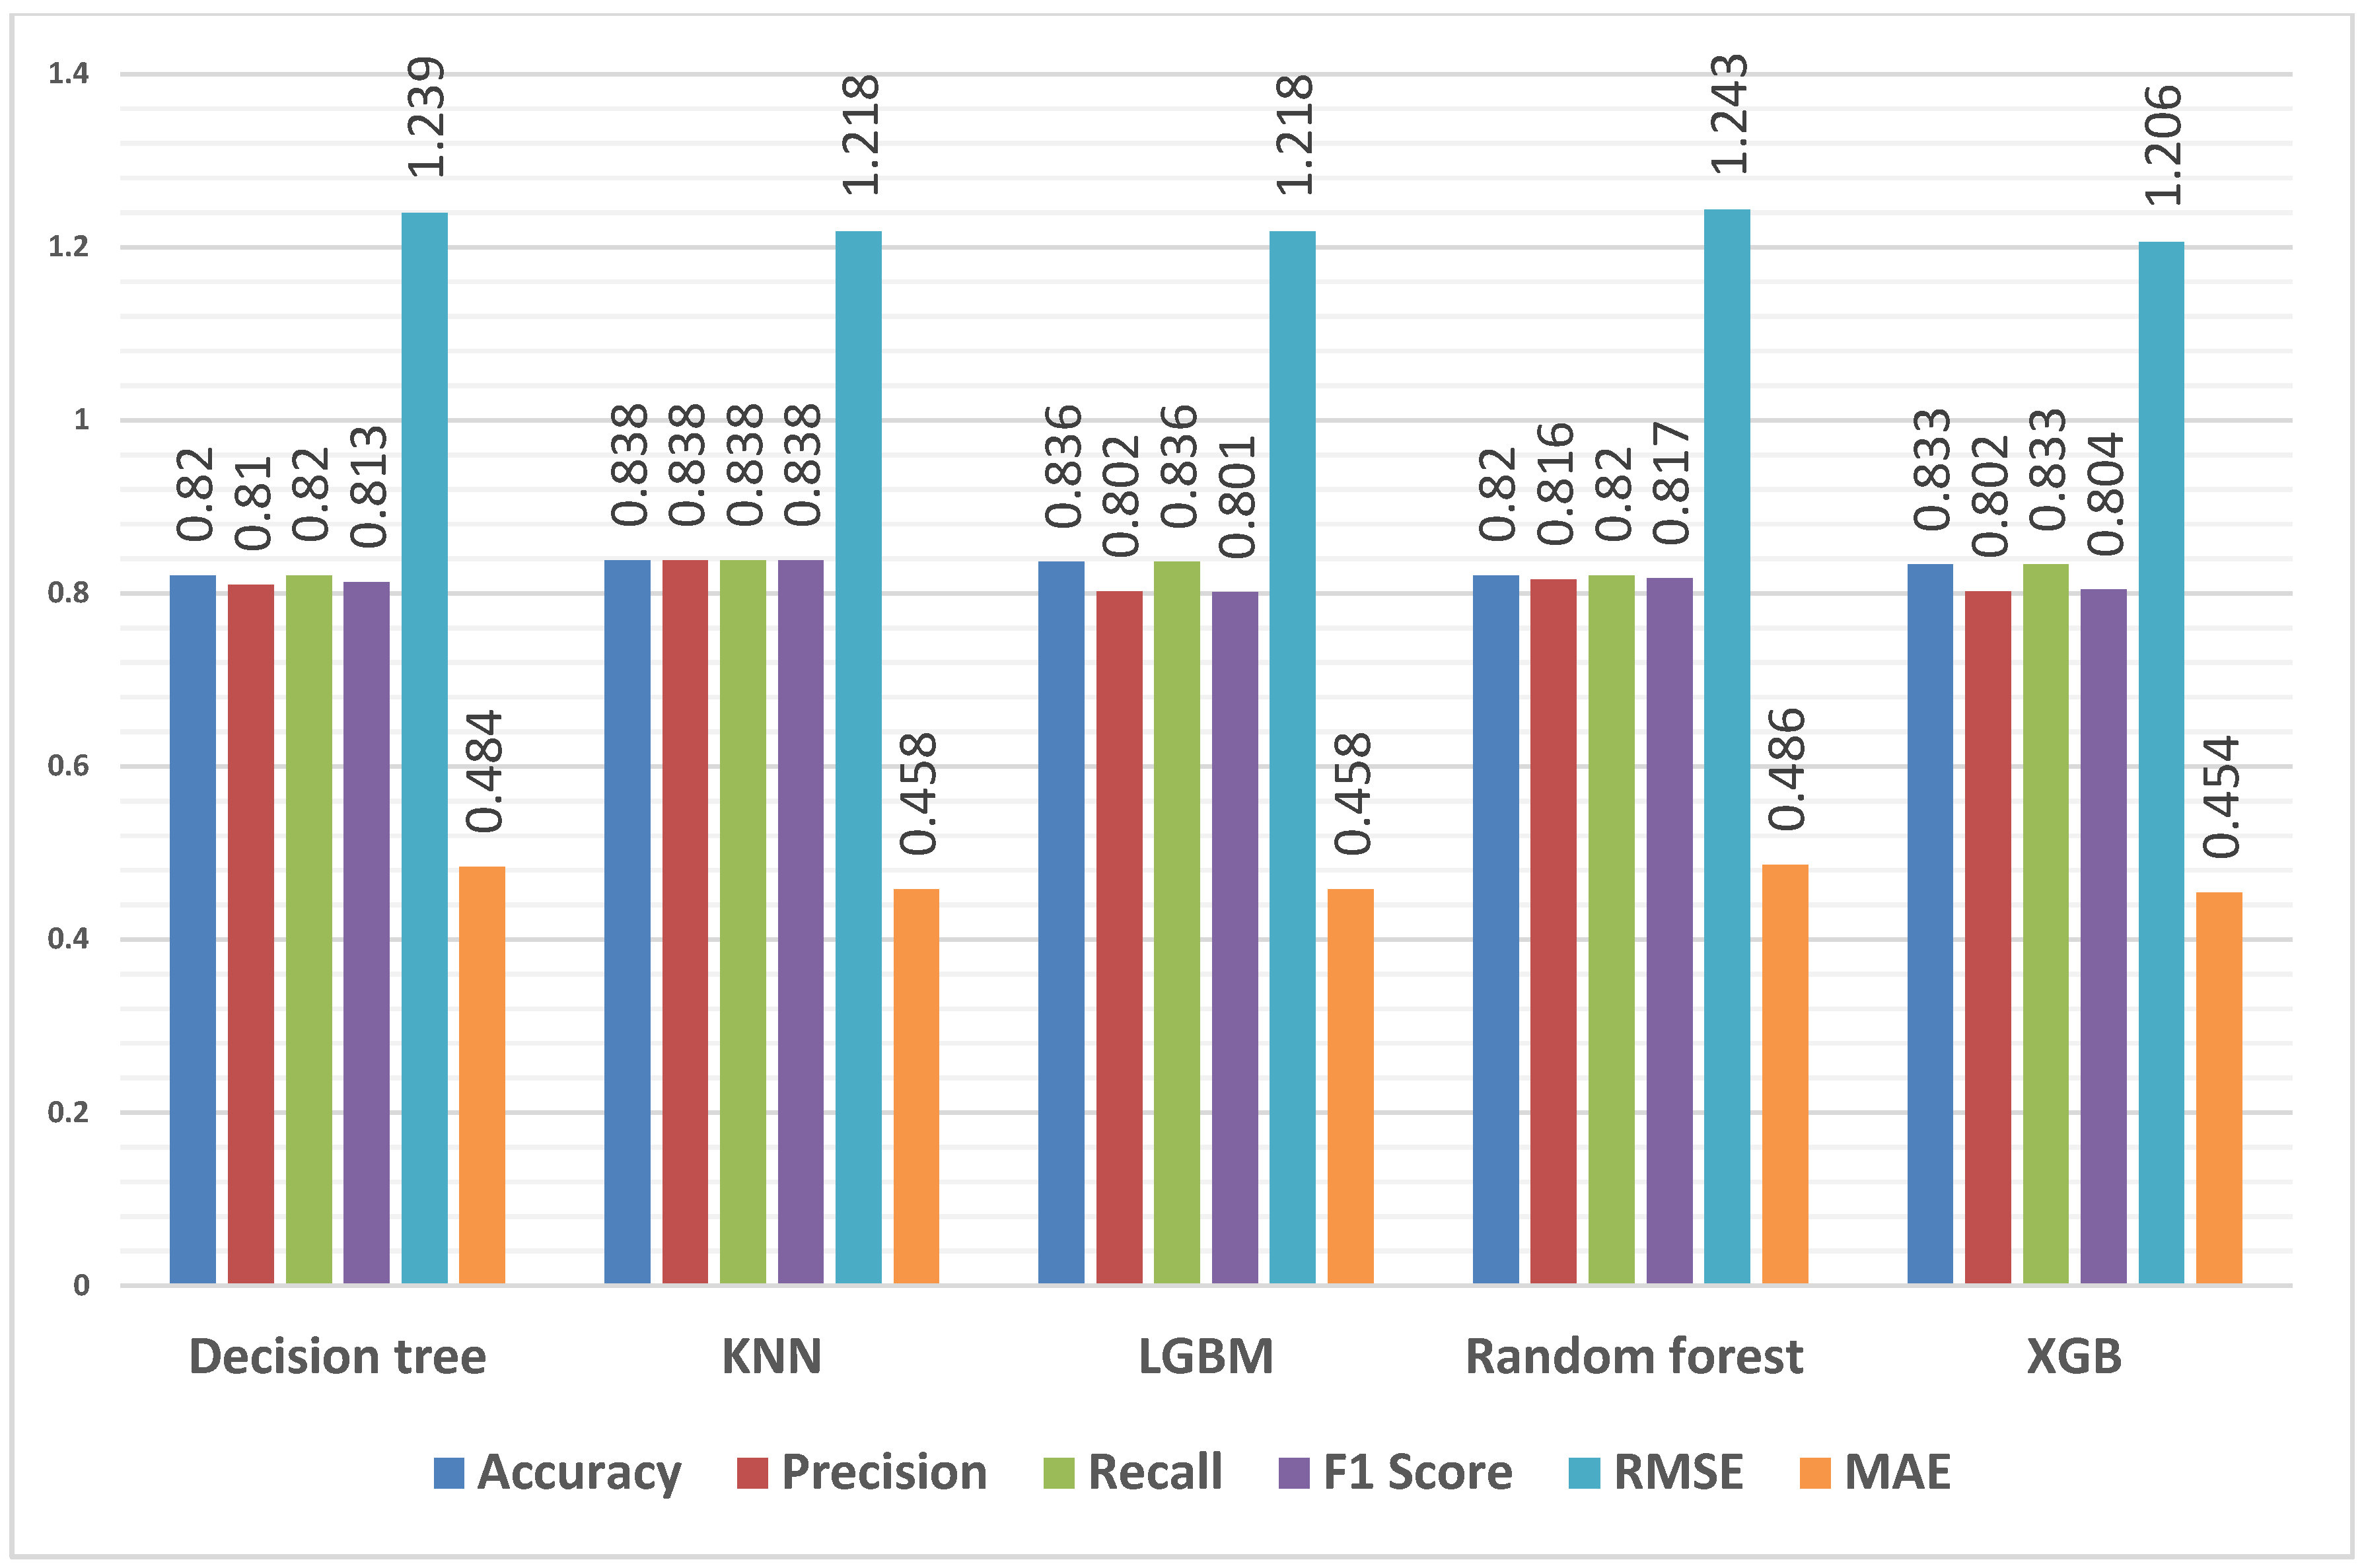
4.3.1. Predicting Overall Students’ Performance

Figure 5 presents the performance metrics for different models applied to the entire dataset for the first, second, third and fourth years to determine overall student performance. The algorithms tested the ability to predict the student’s performance in the university based on three features from their performance in high school—APS, mathematics, and physical sciences.
These models were evaluated using the following metrics: accuracy, precision, recall, F1 score, RMSE and MAE. All models had an accuracy above 82%, demonstrating their ability to predict student performance. KNN has the highest accuracy, followed by LGBM and then XGB. KNN also has the highest precision, with 83.8%, followed by the random forest model. A recall of more than 82% was attained by all models, indicating their capacity to identify positive instances. The F1 score, which balances precision and recall, was more than 80% for all models. Lower RMSE and MAE values indicate better accuracy. With reasonable levels of prediction error, the models perform similarly. The RMSE values vary from 1.206 to 1.243, and the MAE values range from 0.454 to 0.486.

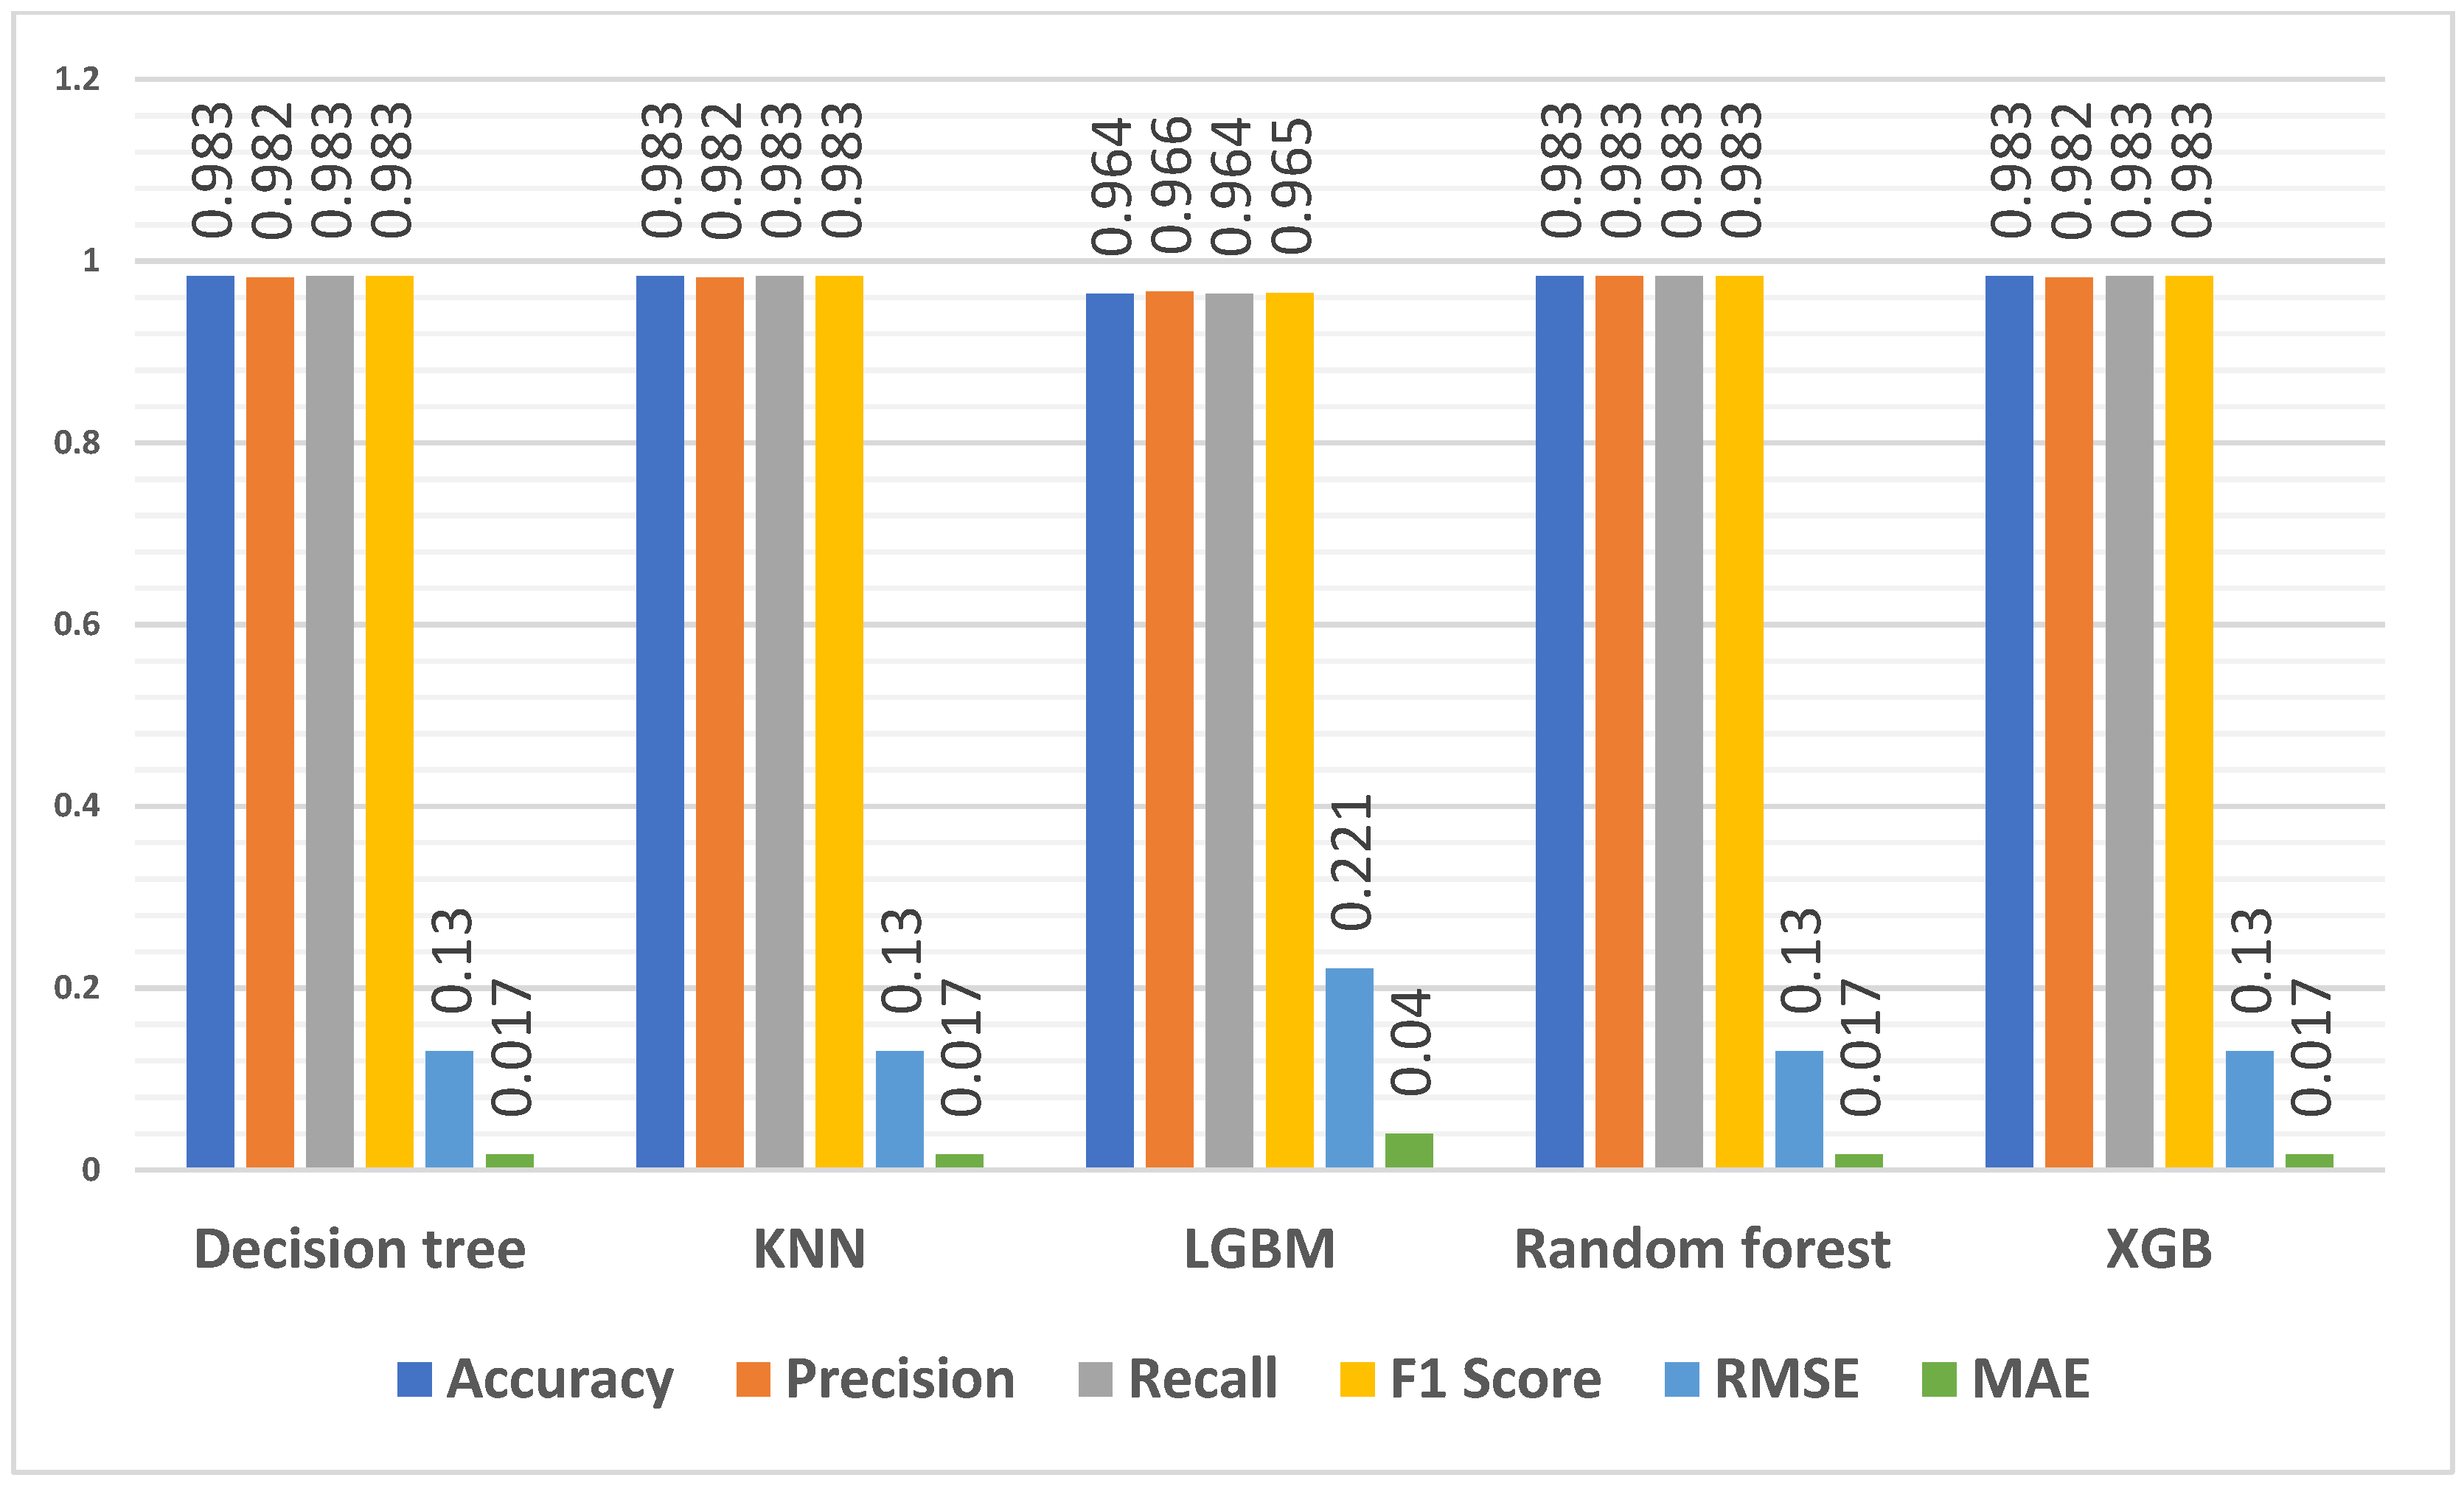
4.3.2. Predicting First-Year Students’ Performance

The findings from the correlation map show that higher scores in APS, mathematics, and physical sciences show a slightly positive association with module marks at the university level, leading us to investigate the effect of these three features on student performance. Figure 6 presents the performance metrics for different classification models to predict first-year students’ performance. The algorithms used APS, mathematics and physical sciences as input parameters and the result grouping as the target. The first-year data consisted of 705 student records.
When considering accuracy, four models achieved high accuracy rates, with an accuracy of 98.3% for the decision tree, KNN, random forest, and XGB models. LGBM has a slightly lower accuracy of 96.4%. This implies that these models can accurately predict first-year students’ performance. Regarding precision, which measures the ability to avoid false positives, all models perform consistently. Each model achieved 96.6% and 98.3% precision scores, indicating that they can minimise false positives. Similarly, the models demonstrate high recall scores, ranging from 96.4% to 98.3%. Regarding the F1 score, LGBM has a slightly lower score of 96.5%. The other models all achieved a score of 98.3%. The values in the table indicate that the models perform consistently. The RMSE values are between 0.130 and 0.221, and MAE values range from 0.017 to 0.040 between predicted and actual student performance.
When comparing Figure 5 with Figure 6, notable differences emerge in the performance of the models. Figure 6 exhibits higher accuracy values, ranging from 96.4% to 98.3%, compared to Figure 5’s 82% to 83.8% range. Additionally, the models in Figure 5 consistently demonstrate slightly higher precision, recall, and F1 scores, indicating better overall performance in correctly identifying the data and striking a balance between precision and recall. Moreover, Figure 6’s models display significantly lower RMSE and MAE values, reflecting higher accuracy and more minor average deviations in their predictions. These results suggest that using APS, mathematics, and physical sciences as input parameters to predict student performance yields better results for first-year students than overall student performance.

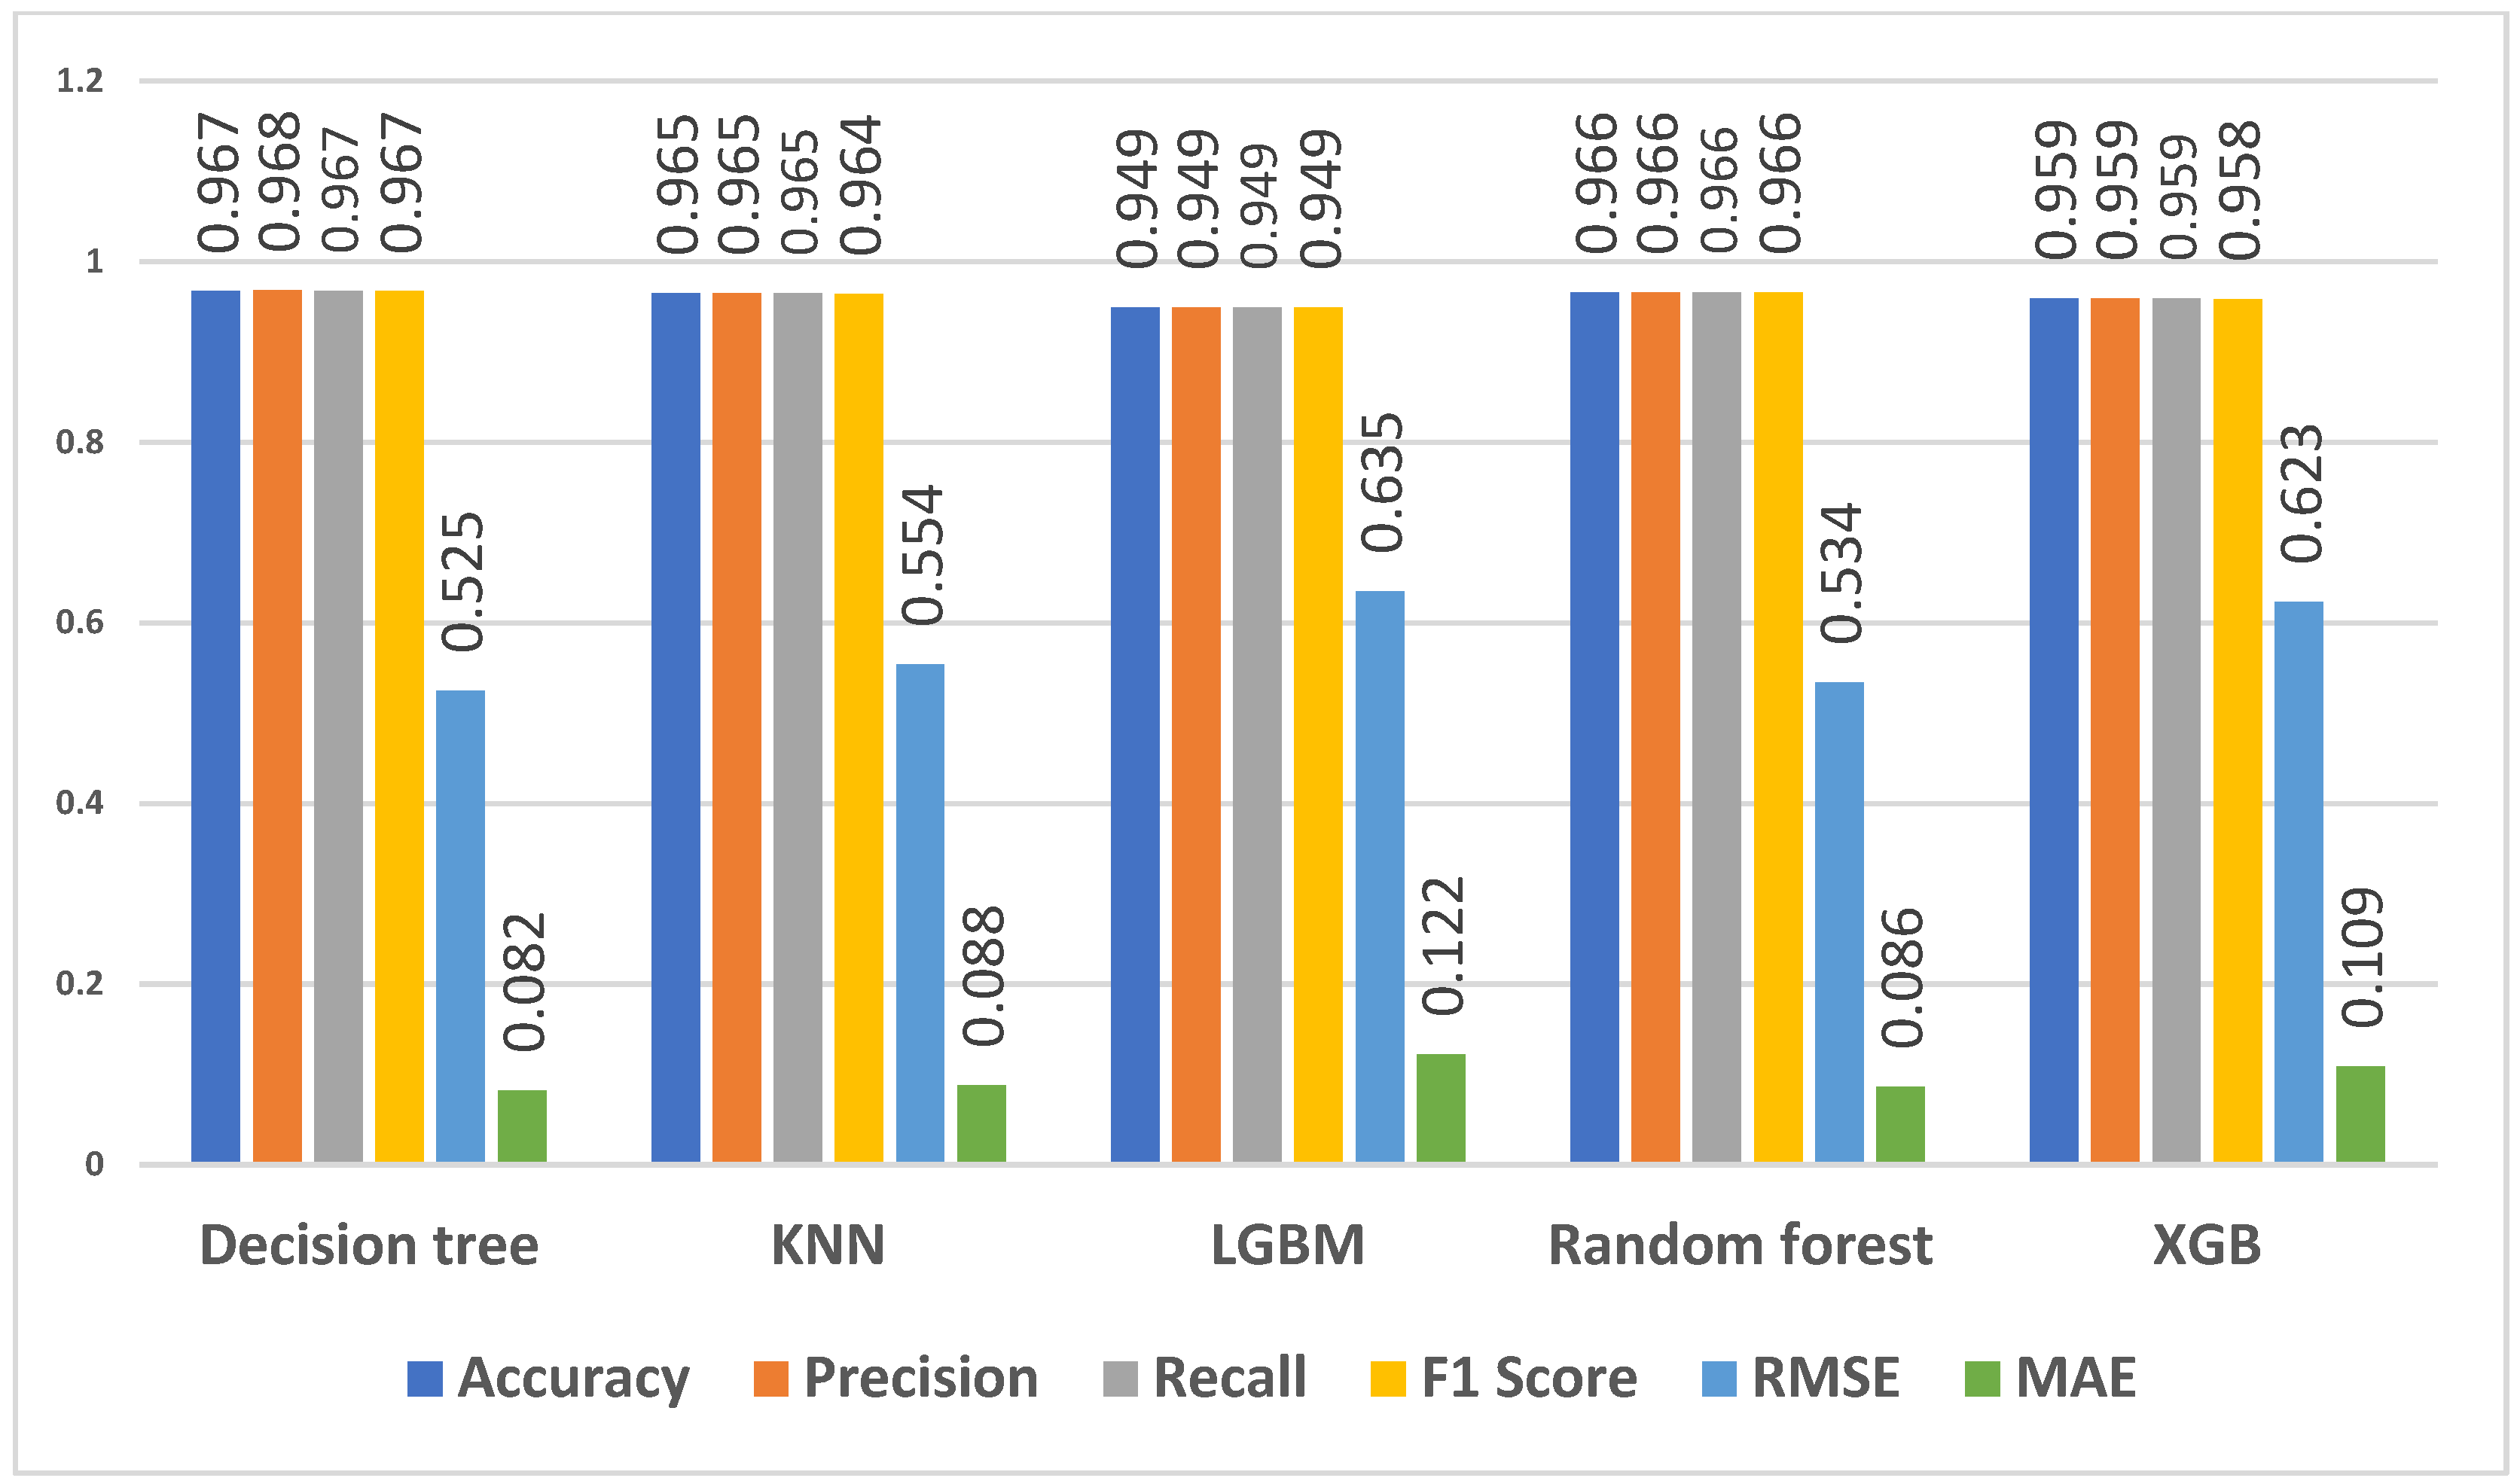
4.3.3. Predicting Qualifications for All Students

Figure 7 shows the performance metrics for different models predicting qualifications for all students. The model used APS, mathematics and physical sciences as input parameters and qualification as the target. The accuracy of the models ranges from 94.9% to 96.7%, demonstrating their ability to predict the qualifications students enrolled for correctly. Among the models, the decision tree achieved an accuracy of 96.7%, followed closely by the random forest and XGB models, which also achieved an accuracy of 96.6%. In terms of precision and recall, all models consistently performed well, with precision and recall scores ranging from 94.9% to 96.8%.
The decision tree, KNN, random forest, and XGB models achieved precision and recall scores of 96.8%. The LGBM model also exhibited strong precision and recall at 94.9%. The F1 scores, which balance precision and recall, ranged from 95.8% to 96.7% for the models. The decision tree, random forest, and XGB models achieved F1 scores of 96.7%. The LGBM model attained an F1 score of 95.8%, showcasing its solid performance. The RMSE values ranged from 0.525 to 0.635. The MAE values ranged from 0.082 to 0.122. The decision tree model achieved the lowest RMSE and MAE values, at 0.525 and 0.082, respectively, of the models’ overall accuracy.

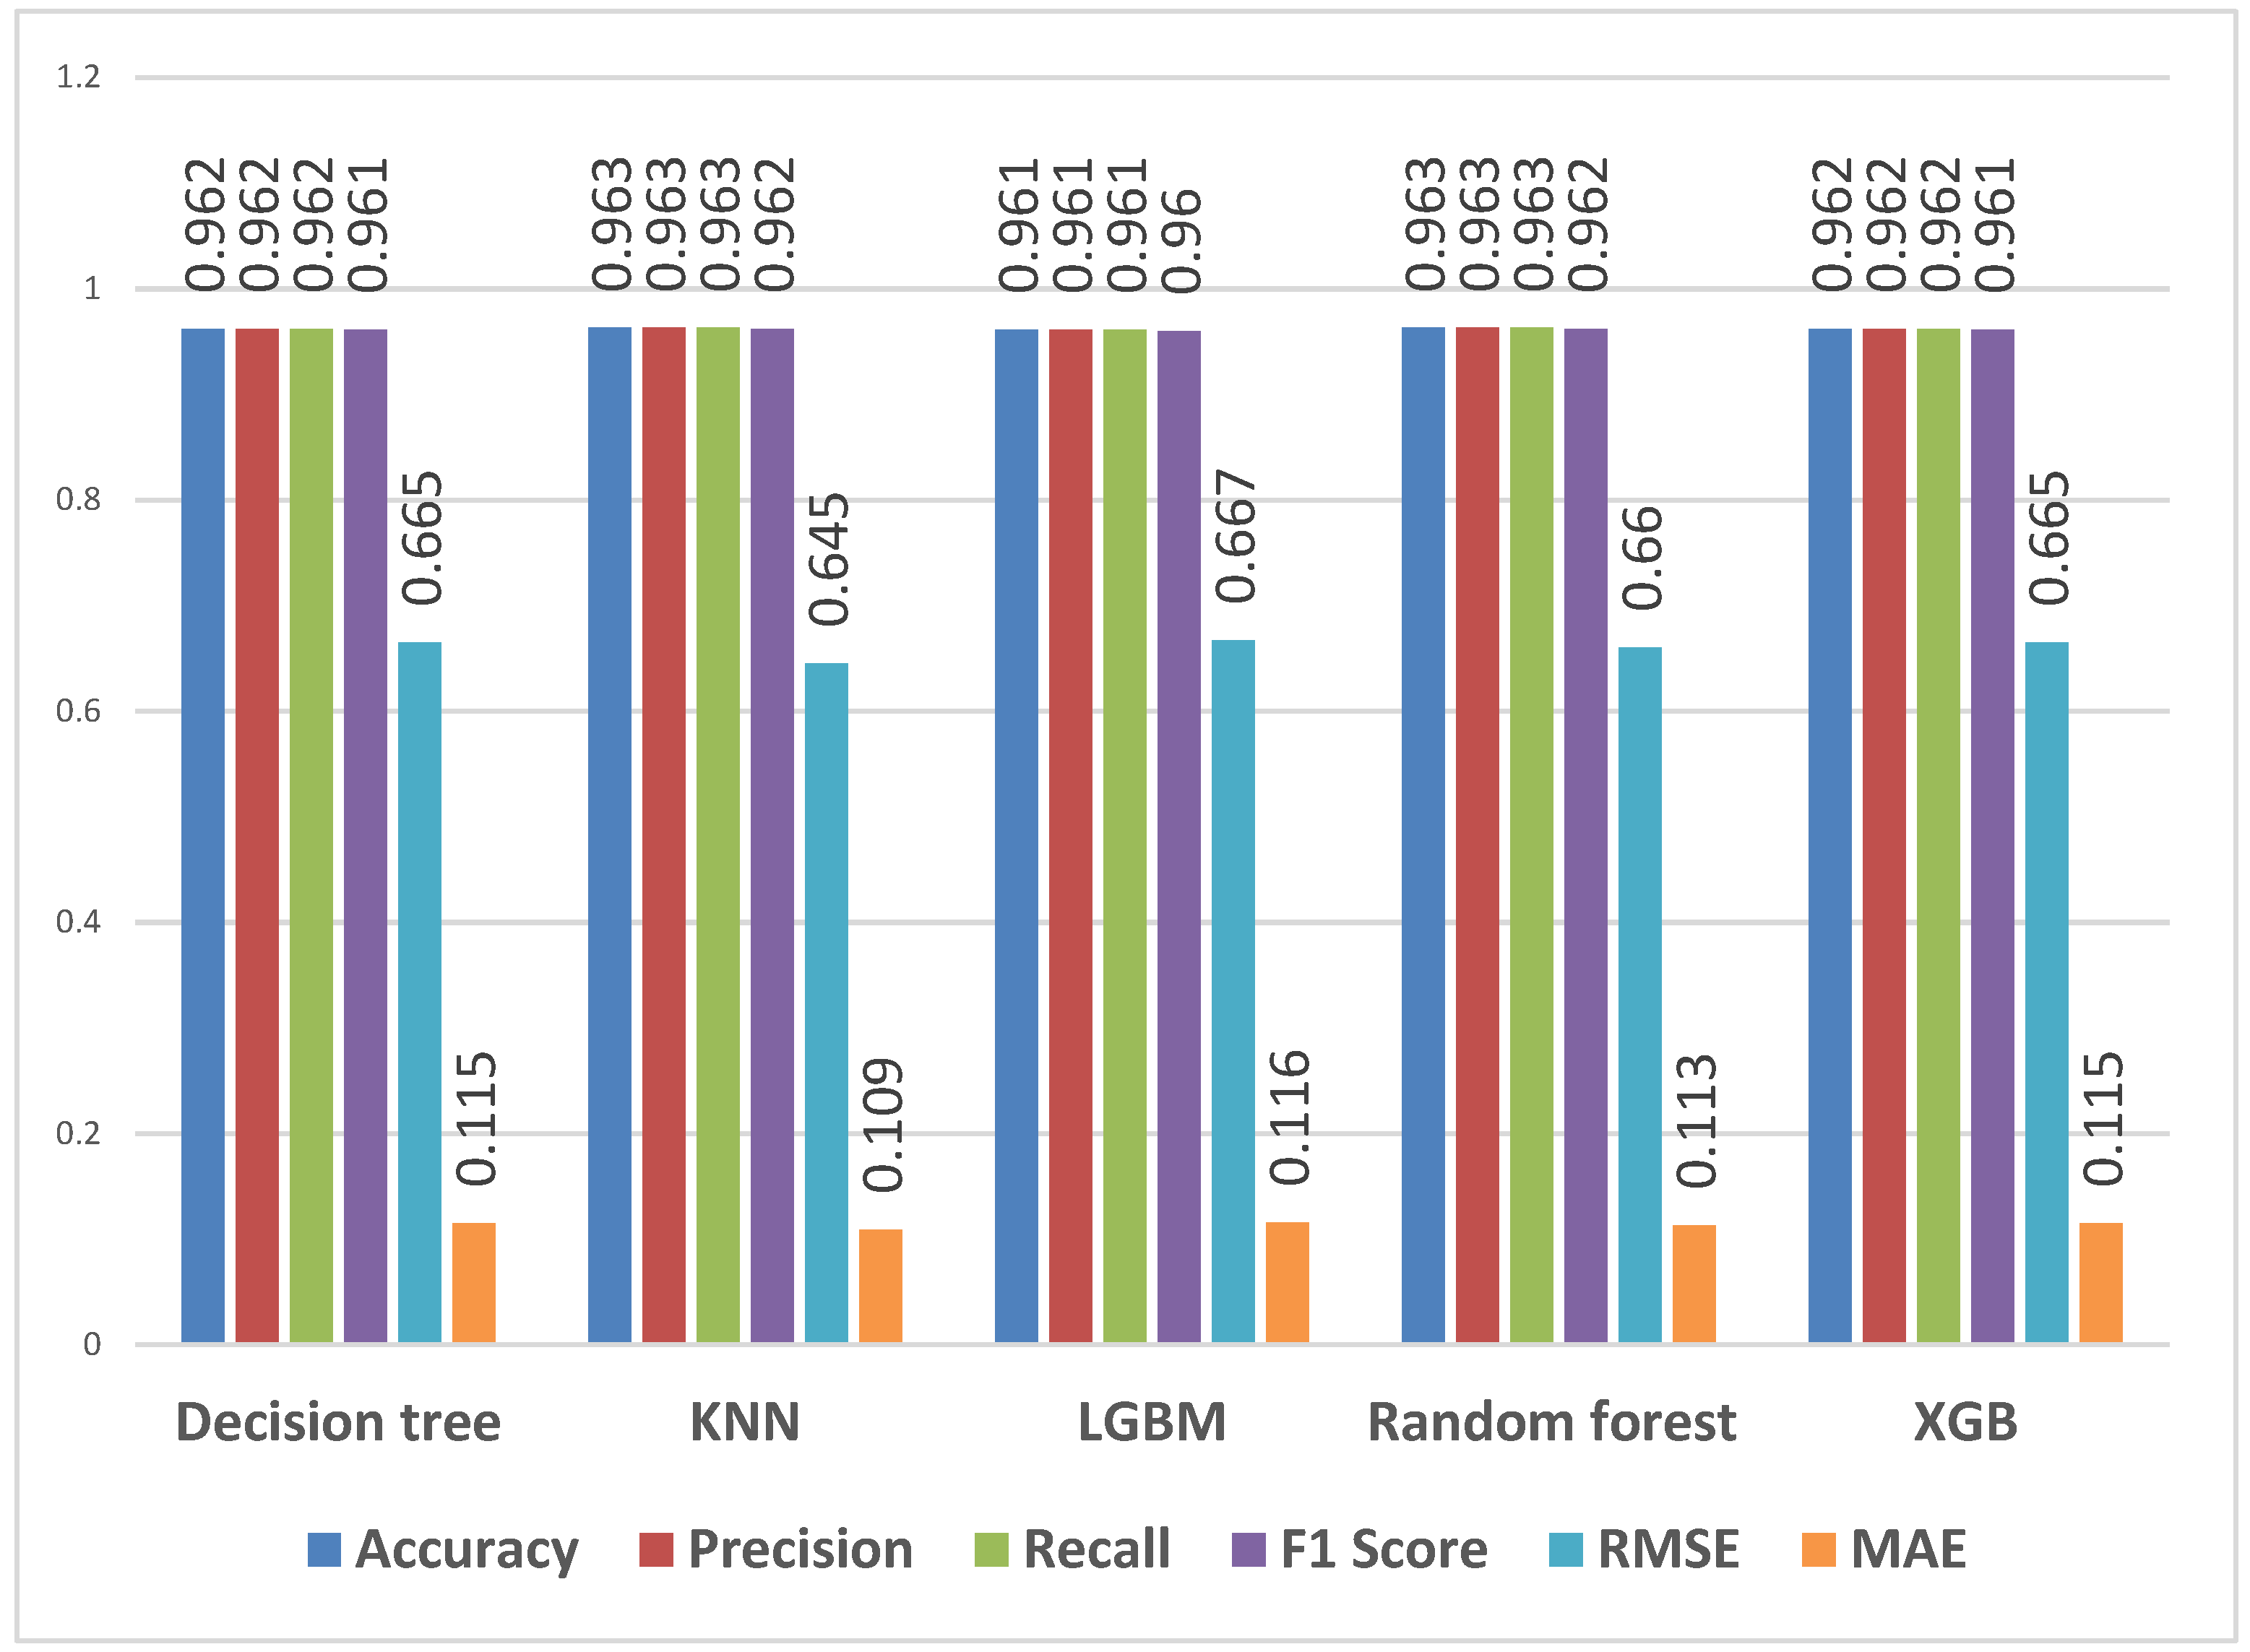
4.3.4. Predicting Qualifications for First-Year Students

Figure 8 shows the performance metrics for different models applied to first-year students’ data (for both the mainstream and the extended programmes). The model used APS, mathematics and physical sciences as input parameters and qualification as the target. Regarding accuracy, all models showcase high values, ranging from 96.1% to 96.3%. The decision tree, LGBM, and XGB models all achieve an accuracy of 96.2%, closely followed by the KNN and random forest models, with an accuracy of 96.3%. Precision and recall scores exhibit consistency across the models, ranging from 96.1% to 96.3%. The decision tree, KNN, LGBM, random forest, and XGB models demonstrate precision and recall rates of 96.1% to 96.3%.
F1 scores range from 96.0% to 96.2% for the models. The decision tree, KNN, LGBM, random forest, and XGB models achieve F1 scores of 96.0% to 96.2%. The RMSE values range from 0.645 to 0.667, and the MAE values range from 0.109 to 0.116. The models display consistently high accuracy, precision, recall, and F1 scores. They showcase the capability to predict the qualification of first-year data students accurately. The RMSE and MAE values suggest a relatively low level of prediction error, further underlining the models’ accuracy in classification tasks.
When comparing Figure 7 with Figure 8, the models demonstrate high accuracy, precision, recall, and F1 scores. However, when predicting qualification for first-year data students, the models exhibit slightly higher accuracy and more accurate predictions based on RMSE and MAE values. These findings suggest that the models perform well in accurately predicting qualifications in both contexts, with a slightly more robust performance predicting qualifications specifically for first-year data students.

4.3.5. Predicting Qualification Flag for First-Year Students

We sought to determine the ability to predict whether students are best suited to study in mainstream or extended qualification using students’ first-year data. Figure 9 shows the performance metrics for different models applied to first-year students’ data using APS, mathematics and physical sciences as input parameters and qualification flag (mainstream or extended) as the target. Across the models, accuracy values range from 98.1% to 98.6%. The decision tree and random forest models achieve the highest accuracy of 98.6%, closely followed by the KNN model at 98.5%. Precision and recall scores consistently surpass 98% for all models, with the decision tree, KNN, and random forest models achieving 98.6% precision and recall. The LGBM and XGB models demonstrate slightly lower but impressive precision and recall scores of 95.8% and 98.1%, respectively. F1 scores range from 95.6% to 98.6%. The decision tree, KNN, and random forest models exhibit F1 scores of 98.6%. RMSE values range from 0.118 to 0.208, and MAE values range from 0.014 to 0.043. These results indicate that the models effectively predict the qualification flag chosen using students’ first-year data with high accuracy and minimal prediction error.

5. Discussion

This study used a real-world dataset of students enrolled in four engineering disciplines in 2016 and 2017 at a public South African university. We identified the important features from the dataset that influence student performance and investigated the use of these features to predict student performance at the University. Our approach included data pre-processing, identifying the important features and model training and evaluation. In this section, we discuss the study’s findings and their implications.
Feature scaling ensures fair and accurate feature comparisons by bringing all features to a uniform scale, preventing any one feature from controlling the learning process of the model purely based on its magnitude. This normalisation eliminates the bias resulting from larger-scale features dominating smaller-scale features. Increasing machine learning models’ convergence rate and stability is another benefit of standardising features [64]. When features are scaled to a similar range, optimisation techniques converge more quickly, enabling the model to arrive at an optimal solution quickly. Additionally, feature scaling can prevent potential numerical instabilities that could arise during the training process and minimise the model’s sensitivity to the initial values.

5.1. Important Features When Predicting Student Performance and Predicting Qualifications

Feature importance helps us understand why some features are important in a model [65]. Feature importance shows how a model generates predictions by analysing the relative contributions of various features. This knowledge benefits model interpretation by creating explainable models, not just black box models. Furthermore, feature importance makes it feasible to identify prospective areas for development and improvement, whether by enhancing current features or introducing new ones to improve the model’s functionality and predictive accuracy.
When predicting student performance and determining qualification enrolment, certain features from the dataset demonstrate varying levels of significance. The module name feature shows the highest coefficient score, indicating its substantial impact on the model’s predictions. Features such as mathematics, physical sciences, and APS also exhibit notable importance ratings. These can be used to predict first-year student performance at the university. These findings align with other research showing that high school students with low marks in mathematics and sciences who enrol for engineering studies are at a higher risk of dropping out [66]. Physical science and mathematics are fundamental subjects frequently required for admission in engineering fields. A good comprehension of core concepts and analytical abilities, which are essential in higher education, are suggested by substantial success in these areas.

5.2. Performance of Models

The findings show that when utilising APS, mathematics, and physical sciences as input parameters, some models perform better than others when predicting student performance and qualification enrolment, especially for first-year students. The study reveals that employing these particular features will likely generate more accurate predictions for first-year student performance relative to overall student performance among the models studied, including decision trees, LGBM, KNN, random forests, and XGB.
The models evaluated for predicting student performance and qualification enrolment demonstrate varying performance levels. The KNN model performs the best for overall student performance, followed closely by the decision tree, LGBM, and random forest models. All models perform exceptionally well when predicting first-year students’ performance, achieving identical high scores. This study suggests that APS, mathematics, and physical sciences are valuable features for predicting first-year students’ academic performance.
The decision tree and random forest models consistently demonstrate strong performance when predicting qualification enrolment for all students and the qualification flags using first-year data. At the same time, the KNN and XGB models also exhibit high accuracy and precision. The decision tree, KNN, random forest, and XGB models show consistent and strong performance across multiple prediction tasks, with the LGBM model also demonstrating good performance in some instances.
When predicting overall student performance, this study’s results closely resemble those of Atalla et al. [3]. In their research, random forest achieved an accuracy of 86%, with the AdaBoost regressor following closely at 85%. Meanwhile, KNN had an accuracy of 82%, and the decision tree scored 81%. Our study observed similar accuracies: the decision tree at 82%, KNN at 84%, LGBM at 84%, the random forest at 82%, and XGB at 83%. The minor variations in accuracy between our study and Atalla et al.’s [3] research may be attributed to factors like dataset size. Nonetheless, these results indicate a remarkable similarity between the two studies.
A study by Al-kmali et al. [67] used traditional classifiers that demonstrated exceptional accuracy, with SVM and Naïve Bayes achieving accuracy scores of 89.6% and 90.3%, respectively. The decision tree achieved 93.1% accuracy, and the random forest classifier 96.9% accuracy. Our study presented slightly lower accuracy values ranging from 82% to 84% but introduced diverse classifiers, such as KNN, LGBM, and XGB, demonstrating their adaptability in various contexts. This study also provided insights into prediction error through RMSE and MAE metrics, showcasing reasonable prediction accuracy.
A recent study suggested a method to remove bias by excluding data about protected features that are not biased against race without sacrificing predictive accuracy [68]. This study followed the same process of eliminating demographic factors, which helps to reduce the risk of perpetuating discriminatory practices. By removing features like ethnicity or nationality and using high school performance features, the models ensure that predictions are based solely on their abilities and achievements, not demographics. This approach also safeguards against discriminatory or unfair practices from considering personal information, fostering a more equitable commitment to responsible and ethical data mining practices [31].
The high accuracy means that a recommender system is good at differentiating between students who can succeed in mainstream and those who are more likely to benefit from extended programmes. Using this predictive study, academic advisors and institutions can identify students who may be in danger of falling behind and need more help to meet academic standards. Universities can increase their chances of success and fill in any gaps in their fundamental knowledge by proactively targeting and offering the right interventions for students in extended programmes.

6. Conclusions

The study aimed to identify the important features using a dataset when predicting student performance and identifying the most suitable qualifications. We identified important features and used these in model training. Moreover, the specified features can be utilised to determine whether a student is better suited for mainstream or extended qualifications. This study adds to the literature on improving academic advising in engineering education by using a machine-learning approach.
This study used a real-world dataset from a public university in South Africa to identify features that significantly influence the task of identifying the most suitable qualifications from a dataset. The study also assessed and compared how well various classification techniques performed using these features. This study employed a comprehensive methodology encompassing data pre-processing, feature engineering, imbalanced data handling, and model training. The study showed that mathematics, physical sciences, and APS are important features when predicting student performance and qualification enrolment. These features were used in models to predict overall student performance, first-year student performance, qualification enrollment for all students, qualification enrollment for first-year students, and predicting the qualification flag for first-year students successfully.
The KNN model exhibited exceptional performance in predicting overall student performance, while decision trees, LGBM, and random forest models also excelled. When predicting first-year student performance, all models demonstrated equally high accuracy. When predicting qualification enrollment, models yielded consistently strong performance, with decision trees and random forests leading the pack. These findings underscore the value of features like APS, mathematics, and physical sciences in predicting first-year student performance. This study represents a positive step toward harnessing student data to improve academic advising and promote student success. It highlights the potential of data-driven interventions to address student attrition in engineering education. As education continues to evolve, incorporating predictive modelling into academic advising can contribute to more personalised and effective student support.
Given the strong influence of features like mathematics, physical sciences, and APS on predicting student success, it is possible to use these features as important inputs in recommender systems that incorporate student performance data from high school. These recommender systems can be used by faculty-student advisors to improve decision-making in student advising. By combining these data-driven advising systems, educational institutions may better serve students on an ongoing basis, help them succeed academically, and increase their overall success rates. The application of recommender systems by student-faculty advisors has the potential to revolutionise how students navigate their academic and professional journeys.
This study shows that using a real-world dataset makes accurate prediction of student performance and qualifications possible. These models can be incorporated into recommender systems to better support students in their academic and professional careers by arming faculty-student advisors with making data-driven recommendations. This can save student-faculty advisors time and effort since they will not have to manually access enormous amounts of data. This aligns with a study that showed that recommender systems enable advisors to evaluate a broader range of scenarios efficiently, facilitating better-informed and cost-effective decisions, particularly in challenging situations [69].
There are a few limitations to this study. The study’s use of the engineering student cohort from 2016 and 2017 has several limitations due to the limited range of the data that can be analysed. This limitation may constrain the generalisability of the results to other cohorts or students in different periods, as various factors may have transformed the educational landscape. Furthermore, using a medium dataset of student records enrolled in engineering may be challenging. Another area for improvement is that the dataset only contained students who qualified to study engineering. It excluded students who may have shown interest but could not register as they needed to meet the minimum requirements. As a result, it is possible that the findings need to accurately reflect the complete diversity and range of students who want to major in engineering.
Future studies could focus on investigating the integration of student performance prediction within recommender systems. This includes exploring gender-based biases in predicting student performance and understanding how prediction accuracy varies across different student age groups. Additionally, it includes investigating biases based on ethnicity or race, examining the influence of socioeconomic backgrounds on predictions, and assessing how prediction accuracy may differ based on a student’s geographic location. Given the reliance on traditional machine learning methods in current research, there is substantial potential for advancing the field by shifting focus towards implementing deep learning approaches. This evolution in methodology holds promise for refining the accuracy and inclusivity of academic performance prediction within recommender systems. This strategic approach contributes to a targeted understanding of academic performance prediction, particularly for engineering students, and lays the groundwork for future recommender system developments. Integrating student performance prediction as a key input for recommender systems underscores its potential to effectively recommend the most suitable courses based on insights from student performance prediction and personal information.
This study contributes to the corpus by using machine learning techniques to analyse real-world data, predict student performance, and determine the suitability of students for mainstream or extended programmes, exemplifying the integration into recommendation systems for academic advising in engineering education. These findings enhance advising strategies, offering more effective support for students across their educational journey. The demonstrated efficacy of the prediction models in engineering student performance underscores their potential scalability to encompass diverse subject domains.

Author Contributions

M.M.—Conceptualisation, methodology, validation, formal analysis, data curation, visualisation, and writing—Original draft preparation. W.D. and B.P.—Study conceptualisation and writing—review and editing, supervision, and project administration. All authors have read and agreed to the published version of the manuscript.

Funding

This research did not receive external funding.

Data Availability Statement

The data are not publicly available due to restrictions from the subject’s agreement.

Acknowledgments

The authors would like to thank the Institutional Planning, Evaluation and Monitoring Department at the University of Johannesburg for compiling the dataset used for the study.

Conflicts of Interest

The authors declare no conflict of interest.

References

  1. Ahmed, N.; Kloot, B.; Collier-Reed, B.I. Why Students Leave Engineering and Built Environment Programmes When They Are Academically Eligible to Continue. Eur. J. Eng. Educ. 2015, 40, 128–144. [Google Scholar] [CrossRef]
  2. Cole, M. Literature Review Update: Student Identity about Science, Technology, Engineering and Mathematics Subject Choices and Career Aspirations; Australian Council of Learned Academies: Melbourne, Australia, 2013; Available online: https://www.voced.edu.au/content/ngv:56906 (accessed on 7 July 2023).
  3. Atalla, S.; Daradkeh, M.; Gawanmeh, A.; Khalil, H.; Mansoor, W.; Miniaoui, S.; Himeur, Y. An Intelligent Recommendation System for Automating Academic Advising Based on Curriculum Analysis and Performance Modeling. Mathematics 2023, 11, 1098. [Google Scholar] [CrossRef]
  4. Kuhail, M.A.; Al Katheeri, H.; Negreiros, J.; Seffah, A.; Alfandi, O. Engaging Students With a Chatbot-Based Academic Advising System. Int. J. Human–Comput. Interact. 2023, 39, 2115–2141. [Google Scholar] [CrossRef]
  5. Ball, R.; Duhadway, L.; Feuz, K.; Jensen, J.; Rague, B.; Weidman, D. Applying Machine Learning to Improve Curriculum Design. In Proceedings of the 50th ACM Technical Symposium on Computer Science Education, Minneapolis, MN, USA, 27 February–2 March 2019; SIGCSE ’19. Association for Computing Machinery: New York, NY, USA, 2019; pp. 787–793. [Google Scholar] [CrossRef]
  6. Gordon, V.N.; Habley, W.R.; Grites, T.J. Academic Advising: A Comprehensive Handbook; John Wiley & Son: Hoboken, NJ, USA, 2011. [Google Scholar]
  7. Daramola, O.; Emebo, O.; Afolabi, I.; Ayo, C. Implementation of an Intelligent Course Advisory Expert System. Int. J. Adv. Res. Artif. Intell. 2014, 3, 6–12. [Google Scholar] [CrossRef]
  8. Soares, A.P.; Guisande, A.M.; Almeida, L.S.; Páramo, F.M. Academic achievement in first-year Portuguese college students: The role of academic preparation and learning strategies. Int. J. Psychol. 2009, 44, 204–212. [Google Scholar] [CrossRef] [PubMed]
  9. Vulperhorst, J.; Lutz, C.; De Kleijn, R.; Van Tartwijk, J. Disentangling the Predictive Validity of High School Grades for Academic Success in University. Assess. Eval. High. Educ. 2018, 43, 399–414. [Google Scholar] [CrossRef]
  10. Mengash, H.A. Using Data Mining Techniques to Predict Student Performance to Support Decision Making in University Admission Systems. IEEE Access 2020, 8, 55462–55470. [Google Scholar] [CrossRef]
  11. Maphosa, M.; Doorsamy, W.; Paul, B. A Review of Recommender Systems for Choosing Elective Courses. Int. J. Adv. Comput. Sci. Appl. IJACSA 2020, 11, 287–295. [Google Scholar] [CrossRef]
  12. Maphosa, M.; Doorsamy, W.; Paul, B.S. Factors Influencing Students’ Choice of and Success in STEM: A Bibliometric Analysis and Topic Modeling Approach. IEEE Trans. Educ. 2022, 65, 657–669. [Google Scholar] [CrossRef]
  13. Maphosa, M.; Doorsamy, W.; Paul, B.S. Student Performance Patterns in Engineering at the University of Johannesburg: An Exploratory Data Analysis. IEEE Access 2023, 11, 48977–48987. [Google Scholar] [CrossRef]
  14. Nachouki, M.; Naaj, M.A. Predicting Student Performance to Improve Academic Advising Using the Random Forest Algorithm. Int. J. Distance Educ. Technol. 2022, 20, 1–17. [Google Scholar] [CrossRef]
  15. Albreiki, B.; Zaki, N.; Alashwal, H. A Systematic Literature Review of Student’ Performance Prediction Using Machine Learning Techniques. Educ. Sci. 2021, 11, 552. [Google Scholar] [CrossRef]
  16. Haixiang, G.; Yijing, L.; Shang, J.; Mingyun, G.; Yuanyue, H.; Bing, G. Learning from Class-Imbalanced Data: Review of Methods and Applications. Expert Syst. Appl. 2017, 73, 220–239. [Google Scholar] [CrossRef]
  17. Rahman, S.R.; Islam, M.A.; Akash, P.P.; Parvin, M.; Moon, N.N.; Nur, F.N. Effects of Co-Curricular Activities on Student’s Academic Performance by Machine Learning. Curr. Res. Behav. Sci. 2021, 2, 100057. [Google Scholar] [CrossRef]
  18. Assiri, A.; AL-Ghamdi, A.A.-M.; Brdesee, H. From Traditional to Intelligent Academic Advising: A Systematic Literature Review of e-Academic Advising. Int. J. Adv. Comput. Sci. Appl. IJACSA 2020, 11, 507–517. [Google Scholar] [CrossRef]
  19. Noaman, A.Y.; Ahmed, F.F. A New Framework for E Academic Advising. Procedia Comput. Sci. 2015, 65, 358–367. [Google Scholar] [CrossRef]
  20. Coleman, M.; Charmatz, K.; Cook, A.; Brokloff, S.E.; Matthews, K. From the Classroom to the Advising Office: Exploring Narratives of Advising as Teaching. NACADA Rev. 2021, 2, 36–46. [Google Scholar] [CrossRef]
  21. Mottarella, K.E.; Fritzsche, B.A.; Cerabino, K.C. What Do Students Want in Advising? A Policy Capturing Study. NACADA J. 2004, 24, 48–61. [Google Scholar] [CrossRef]
  22. Zulkifli, F.; Mohamed, Z.; Azmee, N. Systematic Research on Predictive Models on Students’ Academic Performance in Higher Education. Int. J. Recent Technol. Eng. 2019, 8, 357–363. [Google Scholar] [CrossRef]
  23. Shahiri, A.M.; Husain, W.; Rashid, N.A. A Review on Predicting Student’s Performance Using Data Mining Techniques. Procedia Comput. Sci. 2015, 72, 414–422. [Google Scholar] [CrossRef]
  24. Putpuek, N.; Rojanaprasert, N.; Atchariyachanvanich, K.; Thamrongthanyawong, T. Comparative Study of Prediction Models for Final GPA Score: A Case Study of Rajabhat Rajanagarindra University. In Proceedings of the 2018 IEEE/ACIS 17th International Conference on Computer and Information Science (ICIS), Singapore, 6–8 June 2018; IEEE: Piscataway, NJ, USA, 2018; pp. 92–97. [Google Scholar]
  25. Aluko, R.O.; Daniel, E.I.; Oshodi, O.S.; Aigbavboa, C.O.; Abisuga, A.O. Towards Reliable Prediction of Academic Performance of Architecture Students Using Data Mining Techniques. J. Eng. Des. Technol. 2018, 16, 385–397. [Google Scholar] [CrossRef]
  26. Singh, W.; Kaur, P. Comparative Analysis of Classification Techniques for Predicting Computer Engineering Students’ Academic Performance. Int. J. Adv. Res. Comput. Sci. 2016, 7, 31–36. [Google Scholar]
  27. Anuradha, C.; Velmurugan, T. A Comparative Analysis on the Evaluation of Classification Algorithms in the Prediction of Students Performance. Indian J. Sci. Technol. 2015, 8, 1–12. [Google Scholar] [CrossRef]
  28. Guo, B.; Zhang, R.; Xu, G.; Shi, C.; Yang, L. Predicting Students Performance in Educational Data Mining. In 2015 International Symposium on Educational Technology (ISET); IEEE: Wuhan, China, 2015; pp. 125–128. [Google Scholar] [CrossRef]
  29. Iatrellis, O.; Kameas, A.; Fitsilis, P. Academic Advising Systems: A Systematic Literature Review of Empirical Evidence. Educ. Sci. 2017, 7, 90. [Google Scholar] [CrossRef]
  30. Manouselis, N.; Drachsler, H.; Verbert, K.; Duval, E. Recommender Systems for Learning; SpringerBriefs in Electrical and Computer Engineering; Springer: New York, NY, USA, 2013. [Google Scholar] [CrossRef]
  31. Wu, Z.; Lin, W.; Ji, Y. An Integrated Ensemble Learning Model for Imbalanced Fault Diagnostics and Prognostics. IEEE Access 2018, 6, 8394–8402. [Google Scholar] [CrossRef]
  32. Elreedy, D.; Atiya, A.F. A Comprehensive Analysis of Synthetic Minority Oversampling Technique (SMOTE) for Handling Class Imbalance. Inf. Sci. 2019, 505, 32–64. [Google Scholar] [CrossRef]
  33. Barua, S.; Islam, M.M.; Murase, K. A Novel Synthetic Minority Oversampling Technique for Imbalanced Data Set Learning. In Neural Information Processing; Lu, B.-L., Zhang, L., Kwok, J., Eds.; Lecture Notes in Computer Science; Springer: Berlin/Heidelberg, Germany, 2011; pp. 735–744. [Google Scholar] [CrossRef]
  34. Prati, R.C.; Batista, G.E.; Monard, M.C. Data Mining with Imbalanced Class Distributions: Concepts and Methods. In Proceedings of the 4th Indian International Conference on Artificial Intelligence, Tumkur, India, 16–18 December 2009; pp. 359–376. [Google Scholar]
  35. Fernández-García, A.J.; Rodríguez-Echeverría, R.; Preciado, J.C.; Manzano, J.M.C.; Sánchez-Figueroa, F. Creating a Recommender System to Support Higher Education Students in the Subject Enrollment Decision. IEEE Access 2020, 8, 189069–189088. [Google Scholar] [CrossRef]
  36. Sothan, S. The Determinants of Academic Performance: Evidence from a Cambodian University. Stud. High. Educ. 2019, 44, 2096–2111. [Google Scholar] [CrossRef]
  37. Kamiran, F.; Calders, T. Classifying without Discriminating. In Proceedings of the 2009 2nd International Conference on Computer, Control and Communication, Karachi, Pakistan, 17–18 February 2009; IEEE: Karachi, Pakistan, 2009; pp. 1–6. [Google Scholar] [CrossRef]
  38. Gębka, B. Psychological Determinants of University Students’ Academic Performance: An Empirical Study. J. Furth. High. Educ. 2014, 38, 813–837. [Google Scholar] [CrossRef]
  39. Maphosa, M.; Maphosa, V. Educational Data Mining in Higher Education in Sub-Saharan Africa: A Systematic Literature Review and Research Agenda. In Proceedings of the 2nd International Conference on Intelligent and Innovative Computing Applications; ICONIC ’20, Plaine Magnien, Mauritius, 24–25 September 2020; Association for Computing Machinery: New York, NY, USA, 2020; pp. 1–7. [Google Scholar] [CrossRef]
  40. Petwal, S.; John, K.S.; Vikas, G.; Rawat, S.S. Recommender System for Analyzing Students’ Performance Using Data Mining Technique. In Data Science and Security; Jat, D.S., Shukla, S., Unal, A., Mishra, D.K., Eds.; Lecture Notes in Networks and Systems; Springer: Singapore, 2021; pp. 185–191. [Google Scholar] [CrossRef]
  41. Arunkumar, N.M.; Miriam A, A. Automated Student Performance Analyser and Recommender. Int. J. Adv. Res. Comput. Sci. 2018, 9, 688–698. [Google Scholar] [CrossRef]
  42. Cassel, M.; Lima, F. Evaluating One-Hot Encoding Finite State Machines for SEU Reliability in SRAM-Based FPGAs. In Proceedings of the 12th IEEE International On-Line Testing Symposium (IOLTS’06), Lake Como, Italy, 10–12 July 2006; pp. 1–6. [Google Scholar] [CrossRef]
  43. Yao, S.; Huang, B. New Fairness Metrics for Recommendation That Embrace Differences. arXiv 2017. Available online: http://arxiv.org/abs/1706.09838 (accessed on 30 October 2023).
  44. Obeid, C.; Lahoud, I.; El Khoury, H.; Champin, P.-A. Ontology-Based Recommender System in Higher Education. In Companion Proceedings of the The Web Conference 2018, Lyon France, 23–27 April 2018; WWW ’18; International World Wide Web Conferences Steering Committee: Geneva, Switzerland, 2018; pp. 1031–1034. [Google Scholar] [CrossRef]
  45. Cerda, P.; Varoquaux, G.; Kégl, B. Similarity Encoding for Learning with Dirty Categorical Variables. Mach. Learn. 2018, 107, 1477–1494. [Google Scholar] [CrossRef]
  46. Ozsahin, D.U.; Mustapha, M.T.; Mubarak, A.S.; Ameen, Z.S.; Uzun, B. Impact of Feature Scaling on Machine Learning Models for the Diagnosis of Diabetes. In Proceedings of the 2022 International Conference on Artificial Intelligence in Everything (AIE), Lefkosa, Cyprus, 2–4 August 2022; pp. 87–94. [Google Scholar] [CrossRef]
  47. Seiffert, C.; Khoshgoftaar, T.M.; Van Hulse, J. Improving Software-Quality Predictions with Data Sampling and Boosting. IEEE Trans. Syst. Man Cybern. Part Syst. Hum. 2009, 39, 1283–1294. [Google Scholar] [CrossRef]
  48. Huynh-Cam, T.-T.; Chen, L.-S.; Le, H. Using Decision Trees and Random Forest Algorithms to Predict and Determine Factors Contributing to First-Year University Students’ Learning Performance. Algorithms 2021, 14, 318. [Google Scholar] [CrossRef]
  49. Alsubihat, D.; Al-shanableh, D.N. Predicting Student’s Performance Using Combined Heterogeneous Classification Models. Int. J. Eng. Res. Appl. 2023, 13, 206–218. [Google Scholar]
  50. Pedregosa, F.; Varoquaux, G.; Gramfort, A.; Michel, V.; Thirion, B.; Grisel, O.; Blondel, M.; Prettenhofer, P.; Weiss, R.; Dubourg, V.; et al. Scikit-Learn: Machine Learning in Python. J. Mach. Learn. Res. 2011, 12, 2825–2830. [Google Scholar]
  51. Charbuty, B.; Abdulazeez, A. Classification Based on Decision Tree Algorithm for Machine Learning. J. Appl. Sci. Technol. Trends 2021, 2, 20–28. [Google Scholar] [CrossRef]
  52. Hosmer, D.W.; Lemeshow, S.; Sturdivant, R.X. Applied Logistic Regression, 1st ed.; Wiley Series in Probability and Statistics; Wiley: Hoboken, NJ, USA, 2013. [Google Scholar] [CrossRef]
  53. Ke, G.; Meng, Q.; Finley, T.; Wang, T.; Chen, W.; Ma, W.; Ye, Q.; Liu, T.-Y. LightGBM: A Highly Efficient Gradient Boosting Decision Tree. In Advances in Neural Information Processing Systems; Curran Associates, Inc.: Red Hook, NW, USA, 2017; Volume 30. [Google Scholar]
  54. Lorena, A.C.; Jacintho, L.F.O.; Siqueira, M.F.; Giovanni, R.D.; Lohmann, L.G.; de Carvalho, A.C.P.L.F.; Yamamoto, M. Comparing Machine Learning Classifiers in Potential Distribution Modelling. Expert Syst. Appl. 2011, 38, 5268–5275. [Google Scholar] [CrossRef]
  55. Athey, S.; Tibshirani, J.; Wager, S. Generalized Random Forests. Ann. Stat. 2019, 47, 1148–1178. [Google Scholar] [CrossRef]
  56. Chen, T.; Guestrin, C. XGBoost: A Scalable Tree Boosting System. In Proceedings of the 22nd ACM SIGKDD International Conference on Knowledge Discovery and Data Mining, San Francisco, CA, USA, 13–17 August 2016; KDD ’16. Association for Computing Machinery: New York, NY, USA, 2016; pp. 785–794. [Google Scholar] [CrossRef]
  57. Ferri, C.; Hernández-Orallo, J.; Modroiu, R. An Experimental Comparison of Performance Measures for Classification. Pattern Recognit. Lett. 2009, 30, 27–38. [Google Scholar] [CrossRef]
  58. Sokolova, M.; Lapalme, G. A Systematic Analysis of Performance Measures for Classification Tasks. Inf. Process. Manag. 2009, 45, 427–437. [Google Scholar] [CrossRef]
  59. Isinkaye, F.O.; Folajimi, Y.O.; Ojokoh, B.A. Recommendation Systems: Principles, Methods and Evaluation. Egypt. Inform. J. 2015, 16, 261–273. [Google Scholar] [CrossRef]
  60. Goldberg, K.; Roeder, T.; Gupta, D.; Perkins, C. Eigentaste: A Constant Time Collaborative Filtering Algorithm. Inf. Retr. 2001, 4, 133–151. [Google Scholar] [CrossRef]
  61. Kumar, S.; Gupta, P. Comparative Analysis of Intersection Algorithms on Queries Using Precision, Recall and F-Score. Int. J. Comput. Appl. 2015, 130, 28–36. [Google Scholar] [CrossRef]
  62. Ben-David, A. About the Relationship between ROC Curves and Cohen’s Kappa. Eng. Appl. Artif. Intell. 2008, 21, 874–882. [Google Scholar] [CrossRef]
  63. Kleiman, R.; Page, D. AUCμ: A Performance Metric for Multi-Class Machine Learning Models. In Proceedings of the 36th International Conference on Machine Learning, Long Beach, CA, USA, 9–15 June 2019; PMLR. pp. 3439–3447. [Google Scholar]
  64. Aldino, A.A.; Saputra, A.; Nurkholis, A.; Setiawansyah, S. Application of Support Vector Machine (SVM) Algorithm in Classification of Low-Cape Communities in Lampung Timur. Build. Inform. Technol. Sci. BITS 2021, 3, 325–330. [Google Scholar] [CrossRef]
  65. Saarela, M.; Jauhiainen, S. Comparison of Feature Importance Measures as Explanations for Classification Models. SN Appl. Sci. 2021, 3, 272. [Google Scholar] [CrossRef]
  66. Dibbs, R. Forged in Failure: Engagement Patterns for Successful Students Repeating Calculus. Educ. Stud. Math. 2019, 101, 35–50. [Google Scholar] [CrossRef]
  67. Al-kmali, M.; Mugahed, H.; Boulila, W.; Al-Sarem, M.; Abuhamdah, A. A Machine-Learning Based Approach to Support Academic Decision-Making at Higher Educational Institutions. In Proceedings of the 2020 International Symposium on Networks, Computers and Communications (ISNCC), Montreal, QC, Canada, 20–22 October 2020; pp. 1–5. [Google Scholar] [CrossRef]
  68. Johndrow, J.E.; Lum, K. An Algorithm for Removing Sensitive Information: Application to Race-Independent Recidivism Prediction. arXiv 2017. [Google Scholar] [CrossRef]
  69. Gutiérrez, F.; Seipp, K.; Ochoa, X.; Chiluiza, K.; De Laet, T.; Verbert, K. LADA: A Learning Analytics Dashboard for Academic Advising. Comput. Hum. Behav. 2020, 107, 105826. [Google Scholar] [CrossRef]
Figure 1. The methodology followed for the study shows the sub-elements in the data pre-processing, determining feature importance and module training and evaluation phases.
Algorithms 17 00085 g001
Figure 2. The correlation matrix of the dataset was produced using a heatmap of the Seaborn library.
Algorithms 17 00085 g002
Figure 3. The importance of the bar feature when predicting student performance using the random forest classifier.
Algorithms 17 00085 g003
Figure 4. Important features when predicting qualifications using the random forest model.
Algorithms 17 00085 g004
Figure 5. Predicting result grouping (students’ performance) using all students’ data for features—APS, mathematics and physical sciences.
Algorithms 17 00085 g005
Figure 6. Predicting result grouping (students’ performance) using first-year students’ data for features—APS, mathematics and physical sciences.
Algorithms 17 00085 g006
Figure 7. Predicting qualifications selected using all students’ data for features—APS, mathematics and physical sciences.
Algorithms 17 00085 g007
Figure 8. Predicting qualifications selected using first-year students’ data for features—APS, mathematics and physical sciences.
Algorithms 17 00085 g008
Figure 9. Predicting qualification flag that was chosen using students’ first-year data for features—APS, mathematics and physical sciences.
Algorithms 17 00085 g009
Table 1. Summary of studies in the field.
Ref.PurposeAdvantagesDisadvantages
[1]Addresses the concern of student retention in engineering and built environment programmes.Provides insights into the factors influencing student persistence and attrition in higher education.Does not investigate the relationship between emotional factors and academic performance in voluntary withdrawals.
[23]To enhance students’ success and benefit educators and academic institutions.We have identified the most suitable prediction methods for predicting students’ performance.Lack of investigations on the factors affecting students’ achievements in particular courses within the Malaysian context
[31]Proposes an imbalance learning algorithm that uses Synthetic Minority Over-sampling Technique (SMOTE) to augment minority faulty classes and to address the imbalanced class learning problem.Addresses the issue of imbalanced distributions, leading to more precise fault diagnostics and prognostics in industrial systems.Does not explicitly mention any disadvantages or limitations of the algorithm or the research approach used.
[32]Investigates the accuracy of SMOTE in replicating the original data distribution and evaluates its impact on classification boundaries and overall performance.Provides a comprehensive theoretical analysis of the popular over-sampling method, SMOTE, which needs to be improved in the literature.There’s a point where bias becomes more critical than variance, indicating the need to stop generating more data.
[40]Employs the K-means clustering algorithm to classify students into performance-based clusters.Aids students and instructors in pinpointing areas for improvement.Needs to provide specific information about the dataset size used to analyse students’ performance.
[41]Introduces an automated student performance analyser and recommender system using prediction algorithms and content-based recommendations.Employs an automated data visualiser to illustrate students’ performance, showcasing their strengths and weaknesses.Does not fully implement automation, with room for improvements, such as automating processes like attendance checking.
Table 2. Variables and their distribution in the initial dataset.
ColumnDescriptionCountData Type
Academic YearYear of registration29,158Int8
Student NumberStudent’s unique identifier29,158Int16
Qualification FlagType of qual (mainstream or extended)29,158Int8
QualificationThe qualification enrolled for29,158Int8
Result GroupingsStudent’s results for the year29,158Int8
Period of StudyStudent’s year of study29,158Int8
GenderStudent’s gender29,158Int8
BirthdateStudent’s date of birth29,158Int16
Marital StatusStudent’s marital status29,158Int8
LanguageStudent’s native language29,158Int8
NationalityStudent’s country of birth29,158Int8
Ethnic GroupStudent’s ethnicity29,158Int8
RaceStudent’s race group29,158Int8
APSThe student’s admission point score29,158Int8
Urban-RuralStudent’s home location—urban or rural29,158Int8
Study AddressStudent’s residence29,158Int16
Previous ActivityStudent’s activity the previous year29,158Int8
Matric Date YearYear student completed matric29,158Int8
Module NameName of module enrolled for29,158Int16
Module MarkMark obtained from the module29,158Int8
MathematicsMathematics mark in high school29,158Int8
Physical SciencesScience mark in high school29,158Int8
Table 3. Variables Retained in the Dataset.
FeatureTypeClasses/Value Range
Academic yearCategorical2 (2016, 2017)
Qualification flagCategorical2 (mainstream, extended)
QualificationCategorical8 (list of qualifications)
Result GroupingCategorical5 (obtained qualification, continuing with studies, no/slow progress, no result, no readmission)
Period of studyNumerical4 (1, 2, 3, 4)
APSNumerical18–46
Previous activityCategorical6 (employed, unemployed, grade 12, college, university, national service)
Module nameCategorical92 (list of modules)
Module markNumerical0–100
MathematicsNumerical0–100
Physical SciencesNumerical0–100
Table 4. Target variable class distribution before and after SMOTE.
ClassBefore SMOTEAfter SMOTE
May continue studies17,77117,771
No/slow progress211217,771
Obtained qualification132017,771
No re-admission65517,771
No result1017,771
Table 5. Description of Evaluation Metrics.
MetricDescription
AccuracyMeasures the classification’s correctness.
PrecisionMeasures how accurately a classification is made. It represents a categorisation model’s capacity to return only pertinent instances.
RecallMeasures how accurately a classification was made. It represents a categorisation model’s capacity to find all pertinent examples.
F1 scoreThe standard harmonic mean of the precision and recall results in a single score representing the model’s quality.
MAECalculates the average square of the errors or the average square of the differences between the estimated and actual values.
RMSEIndicates either the quadratic mean of these discrepancies or the square root of the second sample moment of the differences between expected and observed values.
Disclaimer/Publisher’s Note: The statements, opinions and data contained in all publications are solely those of the individual author(s) and contributor(s) and not of MDPI and/or the editor(s). MDPI and/or the editor(s) disclaim responsibility for any injury to people or property resulting from any ideas, methods, instructions or products referred to in the content.

