Article

Mapping the Distribution of High-Value Broadleaf Tree Crowns through Unmanned Aerial Vehicle Image Analysis Using Deep Learning

1
Department of Global Agricultural Sciences, Graduate School of Agricultural and Life Sciences, The University of Tokyo, Tokyo 113-8657, Japan
2
The University of Tokyo Hokkaido Forest, Graduate School of Agricultural and Life Sciences, The University of Tokyo, Furano 079-1563, Hokkaido, Japan
*
Author to whom correspondence should be addressed.
Algorithms 2024, 17(2), 84; https://doi.org/10.3390/a17020084
Submission received: 20 January 2024 / Revised: 2 February 2024 / Accepted: 13 February 2024 / Published: 17 February 2024
(This article belongs to the Special Issue Machine Learning Algorithms for Sensor Data and Image Understanding)

Abstract

:
High-value timber species with economic and ecological importance are usually distributed at very low densities, such that accurate knowledge of the location of these trees within a forest is critical for forest management practices. Recent technological developments integrating unmanned aerial vehicle (UAV) imagery and deep learning provide an efficient method for mapping forest attributes. In this study, we explored the applicability of high-resolution UAV imagery and a deep learning algorithm to predict the distribution of high-value deciduous broadleaf tree crowns of Japanese oak (Quercus crispula) in an uneven-aged mixed forest in Hokkaido, northern Japan. UAV images were collected in September and October 2022 before and after the color change of the leaves of Japanese oak to identify the optimal timing of UAV image collection. RGB information extracted from the UAV images was analyzed using a ResU-Net model (U-Net model with a Residual Network 101 (ResNet101), pre-trained on large ImageNet datasets, as backbone). Our results, confirmed using validation data, showed that reliable F1 scores (>0.80) could be obtained with both UAV datasets. According to the overlay analyses of the segmentation results and all the annotated ground truth data, the best performance was that of the model with the October UAV dataset (F1 score of 0.95). Our case study highlights a potential methodology to offer a transferable approach to the management of high-value timber species in other regions.

1. Introduction

High-value tree species are economically important [1,2] as they are used in various industries, support local economies, and are the basis of valuable products for domestic and international markets. Moreover, they play a central role in ecosystem functioning, by supporting biodiversity (such as through the provision of habitat and food resources) and providing essential ecosystem services, and in ecological interactions that help maintain ecological balance and sustainability [3]. The conservation and sustainable management of high-value tree species are therefore essential not only from an economic perspective, but also for the health and resilience of ecosystems and the well-being of natural and human communities. Meanwhile, as these high-value timber species with economic and ecological importance are usually distributed at very low densities [4], acquiring accurate information on the distribution of these trees within a forest is critical to forest management practices.
The traditional method of acquiring this information is based on individual tree species and thus time-consuming and laborious [5,6], as well as difficult to apply on complex uneven–mixed forests [7]. The recent development of remote sensing techniques has provided an effective and efficient means of obtaining highly accurate forest information [6]. In particular, high- or very-high-resolution remote sensing imagery data [8,9], high-spatial-resolution airborne multispectral or hyperspectral data, and high-point-density Light Detection and Ranging (LiDAR) point cloud data [10,11,12], can provide precise information on tree species. However, due to the high data acquisition cost, the applicability of remote sensing for individual tree species detection in the field is limited, particularly over large forest areas [8,13].
Over the past decade, the use of unmanned aerial vehicles (UAVs) to assess forest regeneration, monitor forest health and identify individual trees has grown rapidly due to the advantages of low cost, high efficiency, and high precision [14]. Furthermore, recent technological advances integrating UAV imagery and machine learning algorithms have provided an efficient method for tree species mapping. Specifically, accurate results in predicting individual tree distribution have been obtained using Convolutional Neural Network (CNN)-based deep learning algorithms, given their ability to extract deeper features from the UAV imagery [13,15].
Among the many deep learning models, U-Net has demonstrated state-of-the-art performance in multiple image segmentation tasks in the forestry sector, including forest change detection, post-forest-fire monitoring, forest type classification, and the mapping of tree species distribution [16,17,18,19,20]. However, the U-Net architecture, like many deep neural networks, may suffer from the vanishing gradient problem, which can make the models less capable of capturing fine details and distinguishing borders between different objects or classes. Meanwhile, Residual Network (ResNet) is known for its ability to train very deep neural networks. It introduces residual connections that allow gradients to flow more easily during training, addressing the vanishing gradient problem [21]. The combination of the semantic segmentation network U-Net and the feature extraction network ResNet has therefore garnered considerable research interest [22]. This combined approach has been applied in the areas of single-target applications, such as sea–land segmentation, the extraction of buildings, individual plant detection, and urban land classification [23,24,25,26]. Furthermore, these two models’ combination allows for the preservation of both global and local spatial contexts, which are critical for recognizing intricate patterns and details in tree species identification. Thus, the use of this combined technique is a robust choice for tree species identification tasks [13,22].
Nonetheless, the application of deep learning models to achieve convergence across all layers of the network is computationally expensive. Computational costs can, however, be reduced by using pre-trained models that draw on the rich hierarchical features of a large dataset, such as ImageNet, Common Objects in Context (COCO) or Microsoft COCO. Pre-training serves as a good starting point for other tasks and improves a model’s ability to capture meaningful patterns and features in the specific segmentation task, even when the available labeled data for that task are limited [27]. Thus far, the combined use of U-Net and pre-trained ResNet models integrated with UAV remote sensing datasets in the forestry sector has been limited with respect to the segmentation of individual tree species in uneven-aged mixed forests.
Thus, the present study explored the applicability of high-resolution UAV imagery and the ResU-Net model (U-Net model with ResNet101, pre-trained on large ImageNet datasets, as backbone) to predict the distribution of a high-value deciduous broadleaf tree crowns in an uneven-aged mixed forest located at the University of Tokyo Hokkaido Forest (UTHF). Specifically, because Japanese oak is not only a high-value timber species of northern Japanese mixed forests but also a dominant tree species in the UTHF [1], it was selected for our individual tree segmentation task. In addition, we used UAV images taken before and after the color change of Japanese oak leaves to determine the optimal timing of UAV image collection for integration with the ResU-Net model. We also investigated the influence of data augmentation techniques on the accuracy of the ResU-Net model with a limited training dataset.
The rest of this paper is organized as follows: Section 2 describes the detailed information regarding the study area, data collection (including field data, UAV image acquisition and processing, and data augmentation), the applied deep learning algorithm (ResU-Net), the identification of Japanese oak using the ResU-Net model, and the evaluation metrics for the trained ResU-Net model. Section 3 presents the results of the identification of Japanese oak using UAV datasets without and with data augmentation, as well as the performance of the ResU-Net model with each of the UAV datasets. The discussion and conclusions, based on the key findings, are presented in Section 4 and Section 5, respectively.

2. Materials and Methods
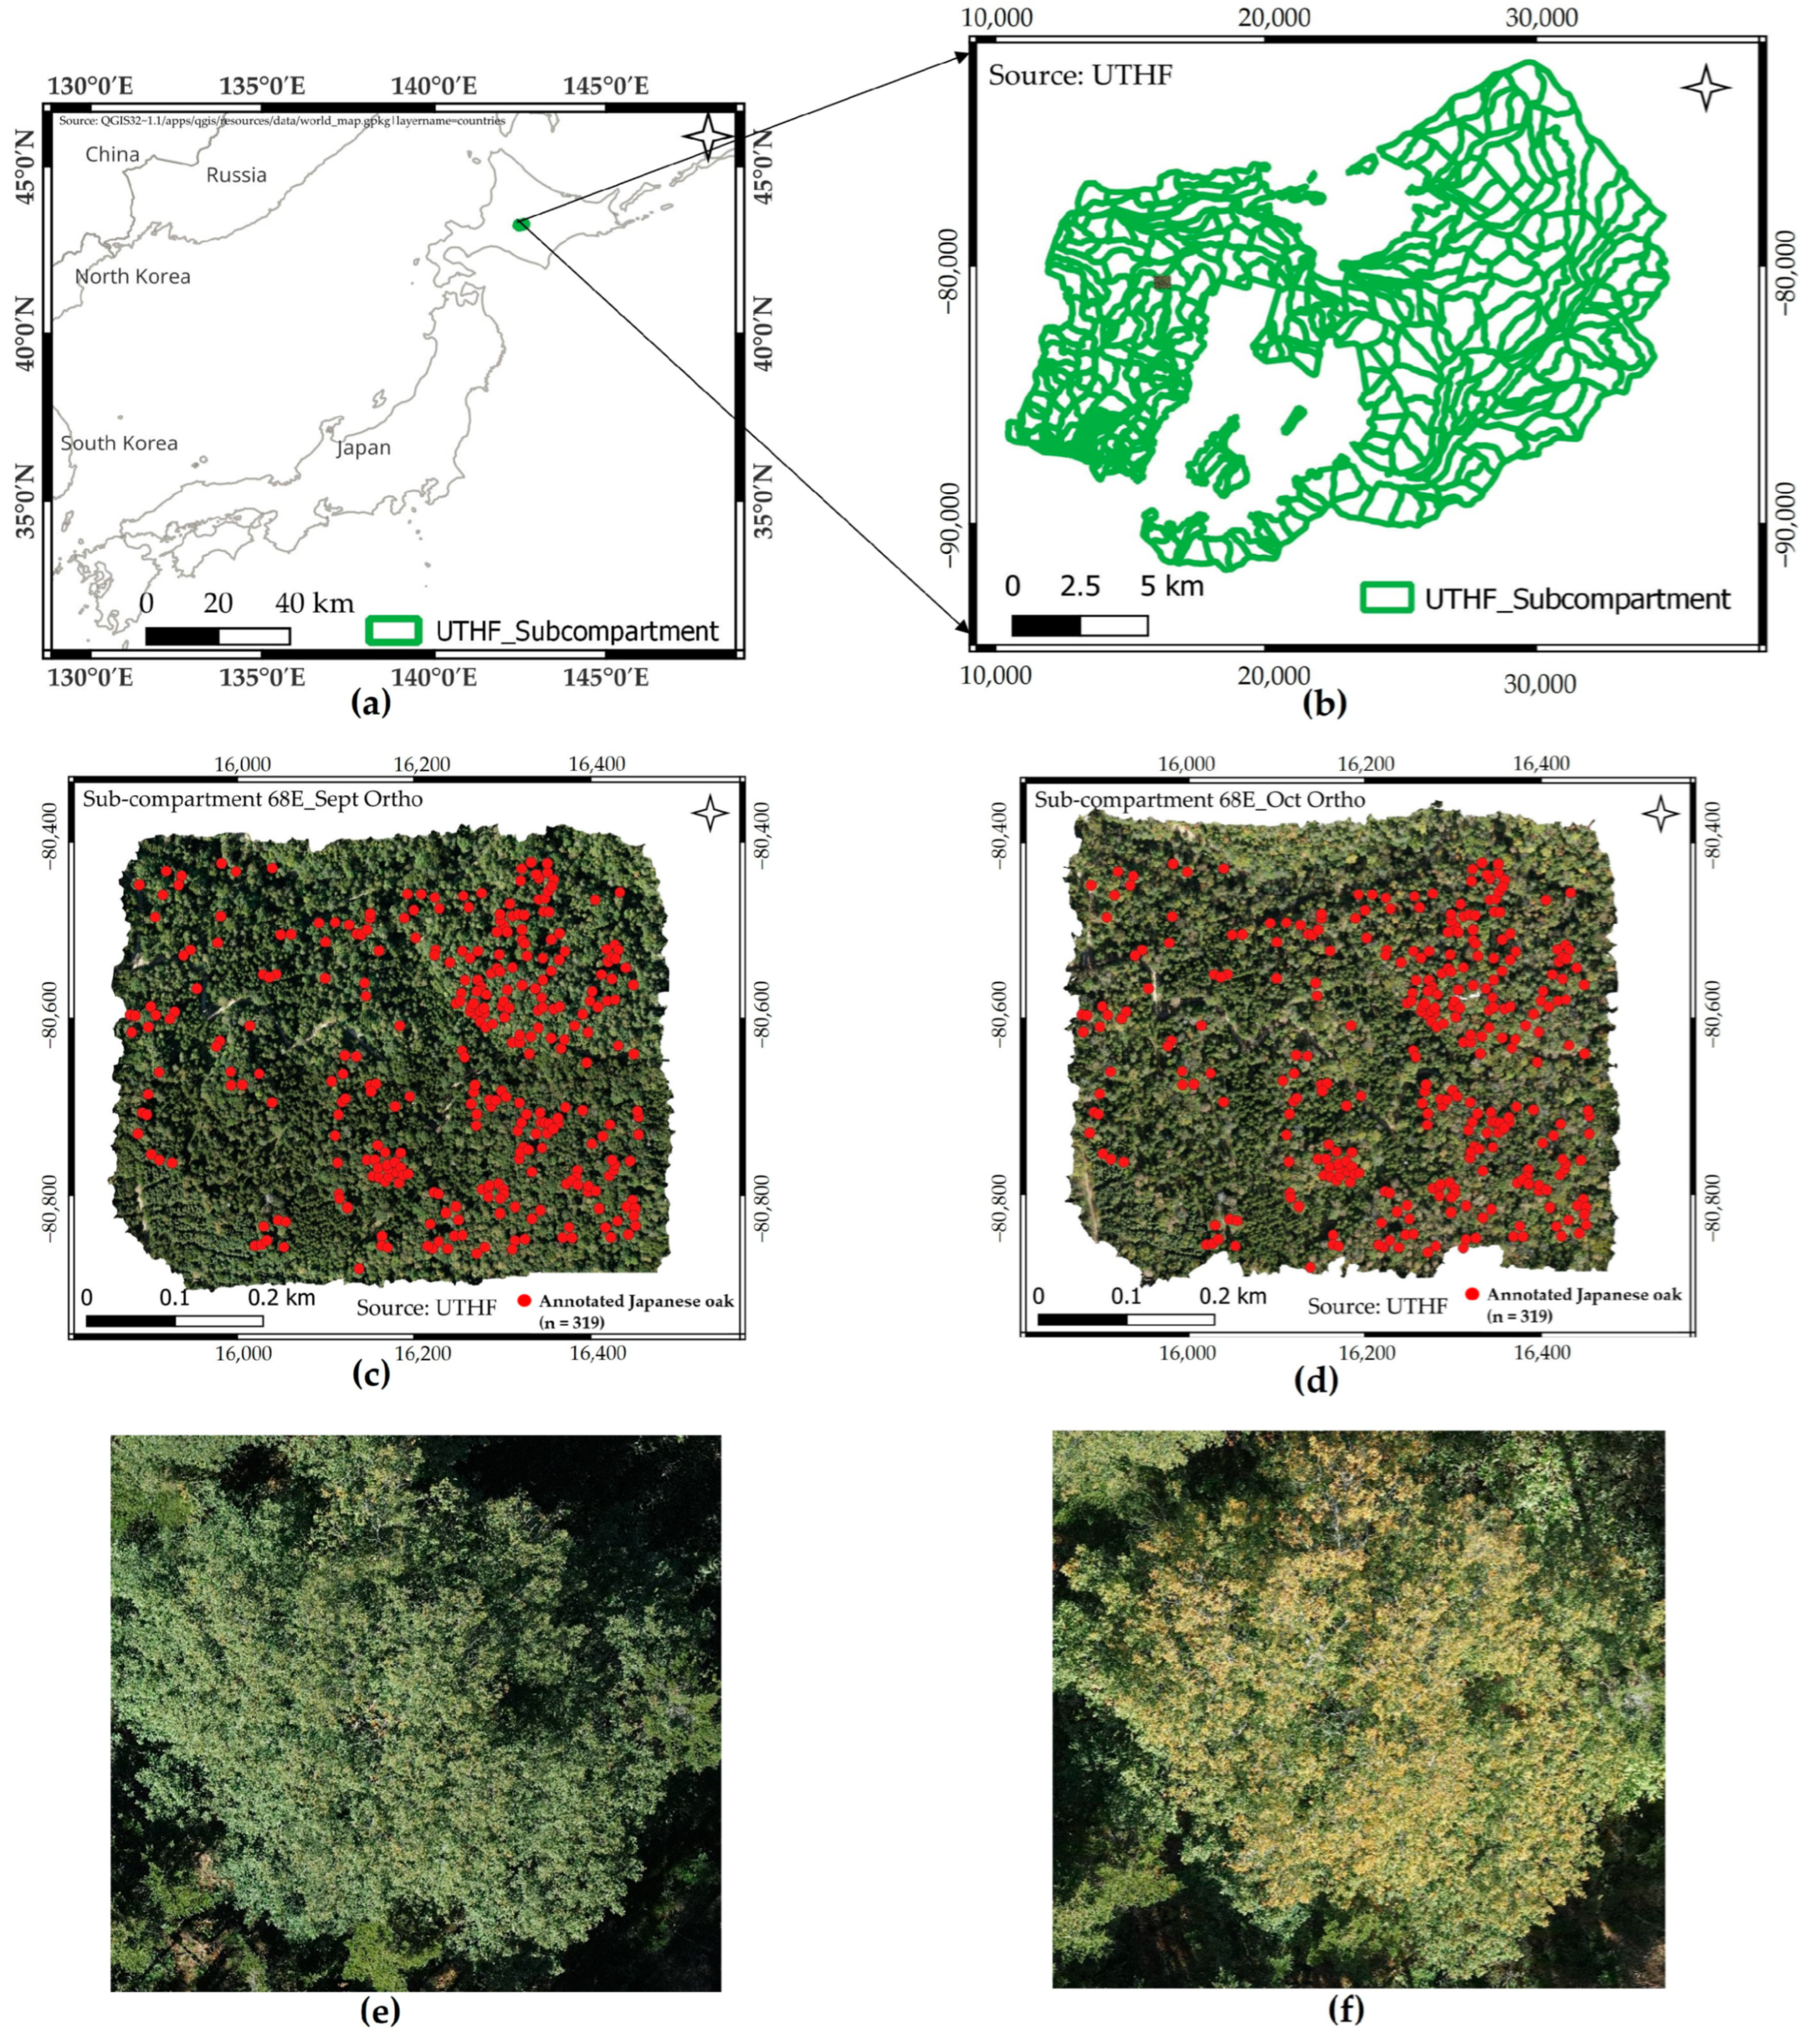
2.1. Study Site

The study area is located in the UTHF (43°10–20′ N, 142°18–40′ E), in the central part of Hokkaido Island, northern Japan (Figure 1a,b). The UTHF is an uneven-aged, mixed coniferous and broadleaf forest, with a total area of 22,717 ha. The predominant species are Abies sachalinensis, Picea jezoensis, Acer pictum var. mono, Picea glehnii, Fraxinus mandshurica, Kalopanax septemlobus, Q. crispula, Betula maximowicziana, Taxus crispula, and Tilia japonica, while the dwarf bamboo (Sasa senanensis and S. kurilensis) is common on the forest floor. The elevation within the UTHF ranges from 190 m to 1459 m above sea level (asl). The mean annual temperature and annual precipitation at the arboretum in 2001–2008 were 6.4 °C and 1297 mm (230 m asl), respectively. From late November to early April of each year, the ground is usually covered with snow to a depth of about 1 m [1,28].
Particularly, the study was undertaken in Sub-compartment 68E of UTHF, which covers an area of 31 ha and contains an abundance of Japanese oak (Figure 1c,d). The altitude of Sub-compartment 68E is within the range from 425 m to 500 m asl. In addition to Q. crispula, the dominant tree species include other deciduous broadleaf species such as F. mandshurica, K. septemlobus, B. maximowicziana T. japonica, and coniferous species such as A. sachalinensis, P. jezoensis. Tree density for trees with a diameter at breast height >23 cm and a height >22.6 m is ~43 trees per hectare (source: UTHF 2022 inventory data).

2.2. Data Collection

2.2.1. Field Data

A field survey was carried out in February 2023 to record tree positions, which were used as a reference for the generation of label masks. Prior to the field survey, sample trees were determined across the study site, based on the previous inventory data of the UTHF and the collected very high-resolution UAV imagery, to cover the entire area. The positions of trees were recorded on the ground by using a real-time kinematic (RTK) dual-frequency global navigation satellite system (GNSS) receiver (DG-PRO1RWS, BizStation Corp., Matsumoto City, Japan). In total, 67 sample trees of Japanese oak and 188 sample trees of other common broadleaf trees species and coniferous species were recorded. Samples of Japanese oak taken by UAV before and after the change in leaf color are shown in Figure 1e,f.

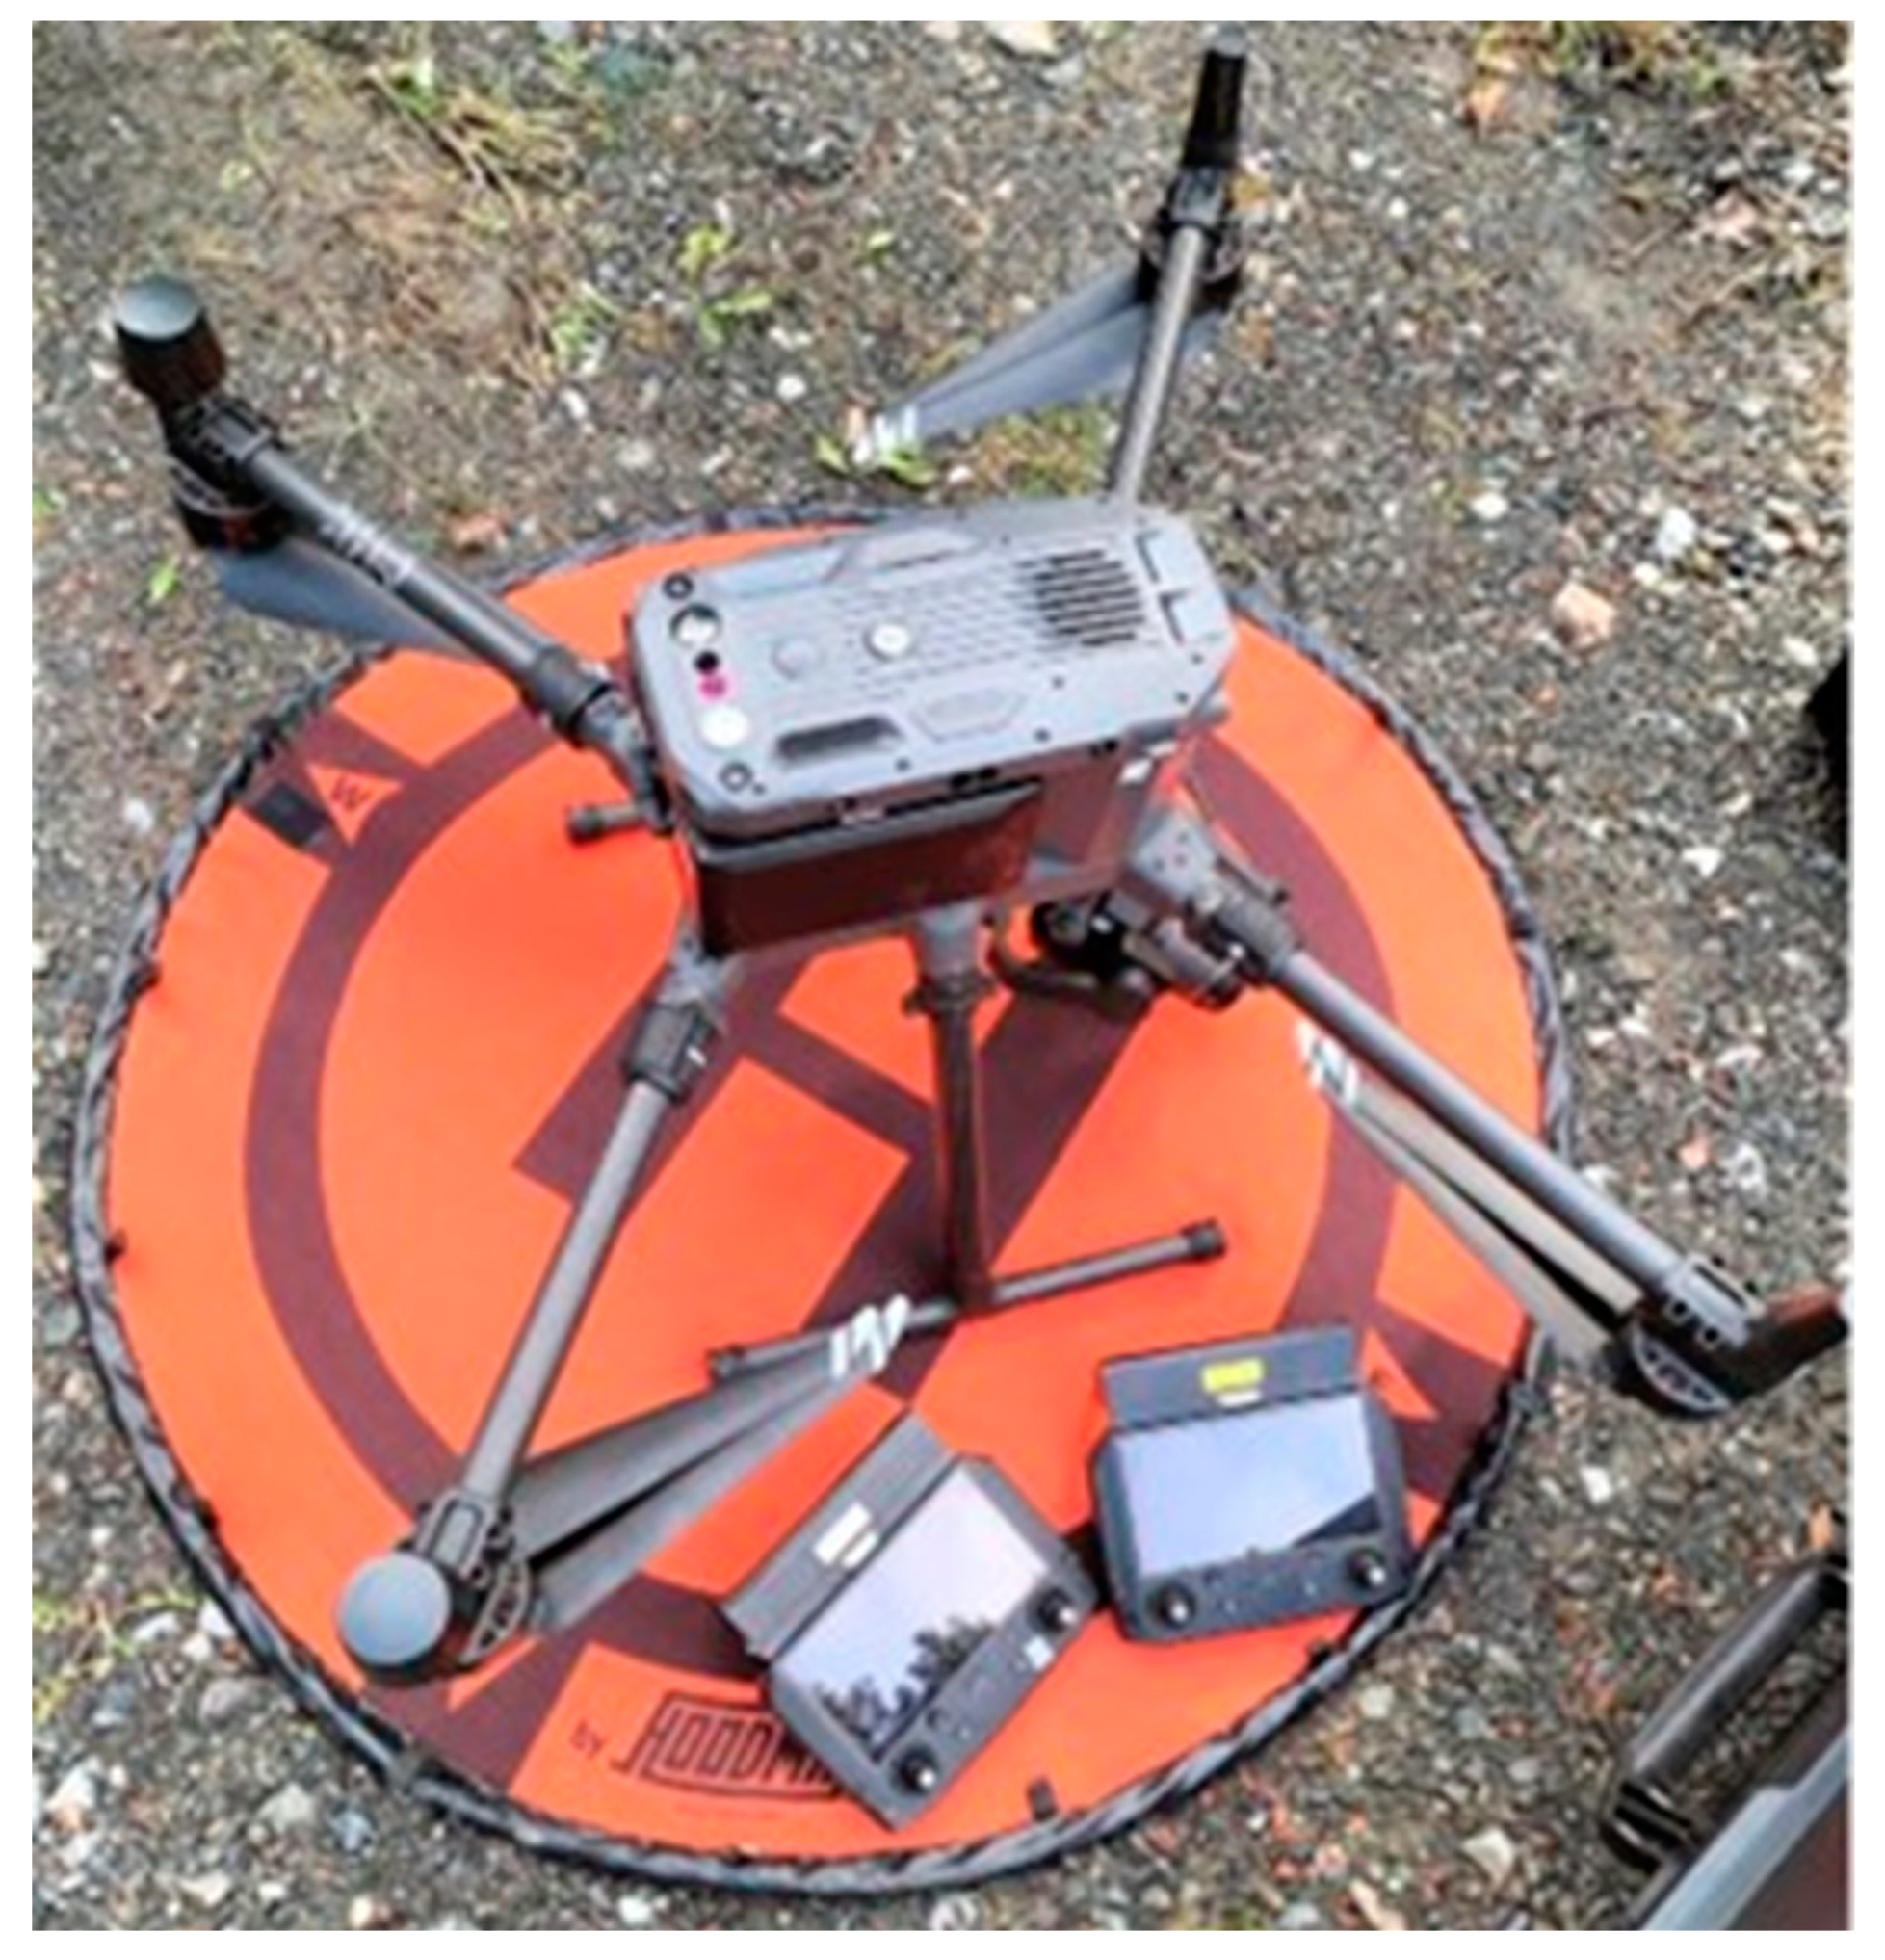
2.2.2. UAV Image Collection and Processing

Since deciduous trees, and especially Japanese oak, have distinct color patterns when their leaves change during the fall season, UAV images were collected on 14 September 2022 (September UAV dataset) and on 7 October 2022 (October UAV dataset), corresponding to before and after the leaf color change of Japanese oak, to determine the optimal timing of UAV image collection to achieve the best performance of the ResU-Net model. A DJI Matrice 300 RTK UAV platform mounted with a DJI Zenmuse P1 camera (with a lens featuring a 35 mm focal length) was used to acquire the UAV images (Figure 2). The image sensor in the Zenmuse P1 delivers 45 megapixels, with an image resolution of 8192 × 5490 pixels and a ground resolution of 0.8 cm per pixel. Regarding the camera setting, we set up aperture (f/8), shutter speed (1/1000 s), and ISO speed (ISO-3200) to minimize motion blur and exposure concerns in the collected UAV images. The weight of the UAV platform, including two TB60 batteries, is 6.3 kg. Both UAV flights were scheduled as a square parallel flight plan with a fixed altitude of ~80 m above ground and a flight speed of 8–8.5 m/s. The flights were operated along the sub-compartment and images were obtained at 3-s intervals to achieve 90% longitudinal overlap and 85% side lap overlap, covering a total area of 31 ha. Normally, the external orientation and overall high level of precision of the photogrammetric model can be improved by the proper planning of ground control points (GCPs) prior to the aerial survey [29]. But Matrice 300 enables direct georeferencing of UAV imagery without the need for GCPs by using dual-frequency RTK GNSS [30]; thus, GCPs were not established in this study.
The collected UAV images were processed using Pix4Dmapper Professional software version 4.8.0 (Lausanne, Switzerland), employing the ‘structure from motion’ technique. The workflow starts with an image alignment step, in which camera positions and orientations are computed by analyzing feature points across various images and intrinsic camera calibration parameters such as focal length, principal point, and three radial and two tangential distortion coefficients are refined. Then, a three-dimensional point cloud is reconstructed, ultimately generating an orthomosaic of the study area. In this study, the orthophotos generated from the September and October UAV datasets were used after being resized from an original resolution of 0.8 cm per pixel to 5 cm/pixel to reduce the computational load and to allow them to be used in combination with other data sources in future studies.
The corresponding binary mask was generated by manually labeling the orthophotos of the study area using the Fiji plugin “Labkit” [31]. In total, 319 Japanese oaks were manually annotated over the entire study area by referencing the field data and visually interpreting the high-resolution UAV imagery. The labels were Japanese oak and background, with the latter referring to all pixels in an image that were not Japanese oak. Then, the binary mask was processed using the OpenCV library to create a new mask containing the border class, to increase the robustness of the model in delineating occluded tree crowns. Dilation, one of the fundamental morphological operations used in image processing, was applied to the binary mask to add a border class using the elliptical kernel size of (3, 3), which allowed the borders to expand by one pixel in all directions. However, because the structuring element was an ellipse, the net effect was zero thickness when considering the original and dilated regions. As a result, a new mask was created with the same dimensions as the original binary mask. Pixels corresponding to the Japanese oaks were set to 1, pixels corresponding to the border were set to 127, and the background remained 0, yielding class 1, class 2, and class 0, respectively.

2.2.3. Image Data Augmentation
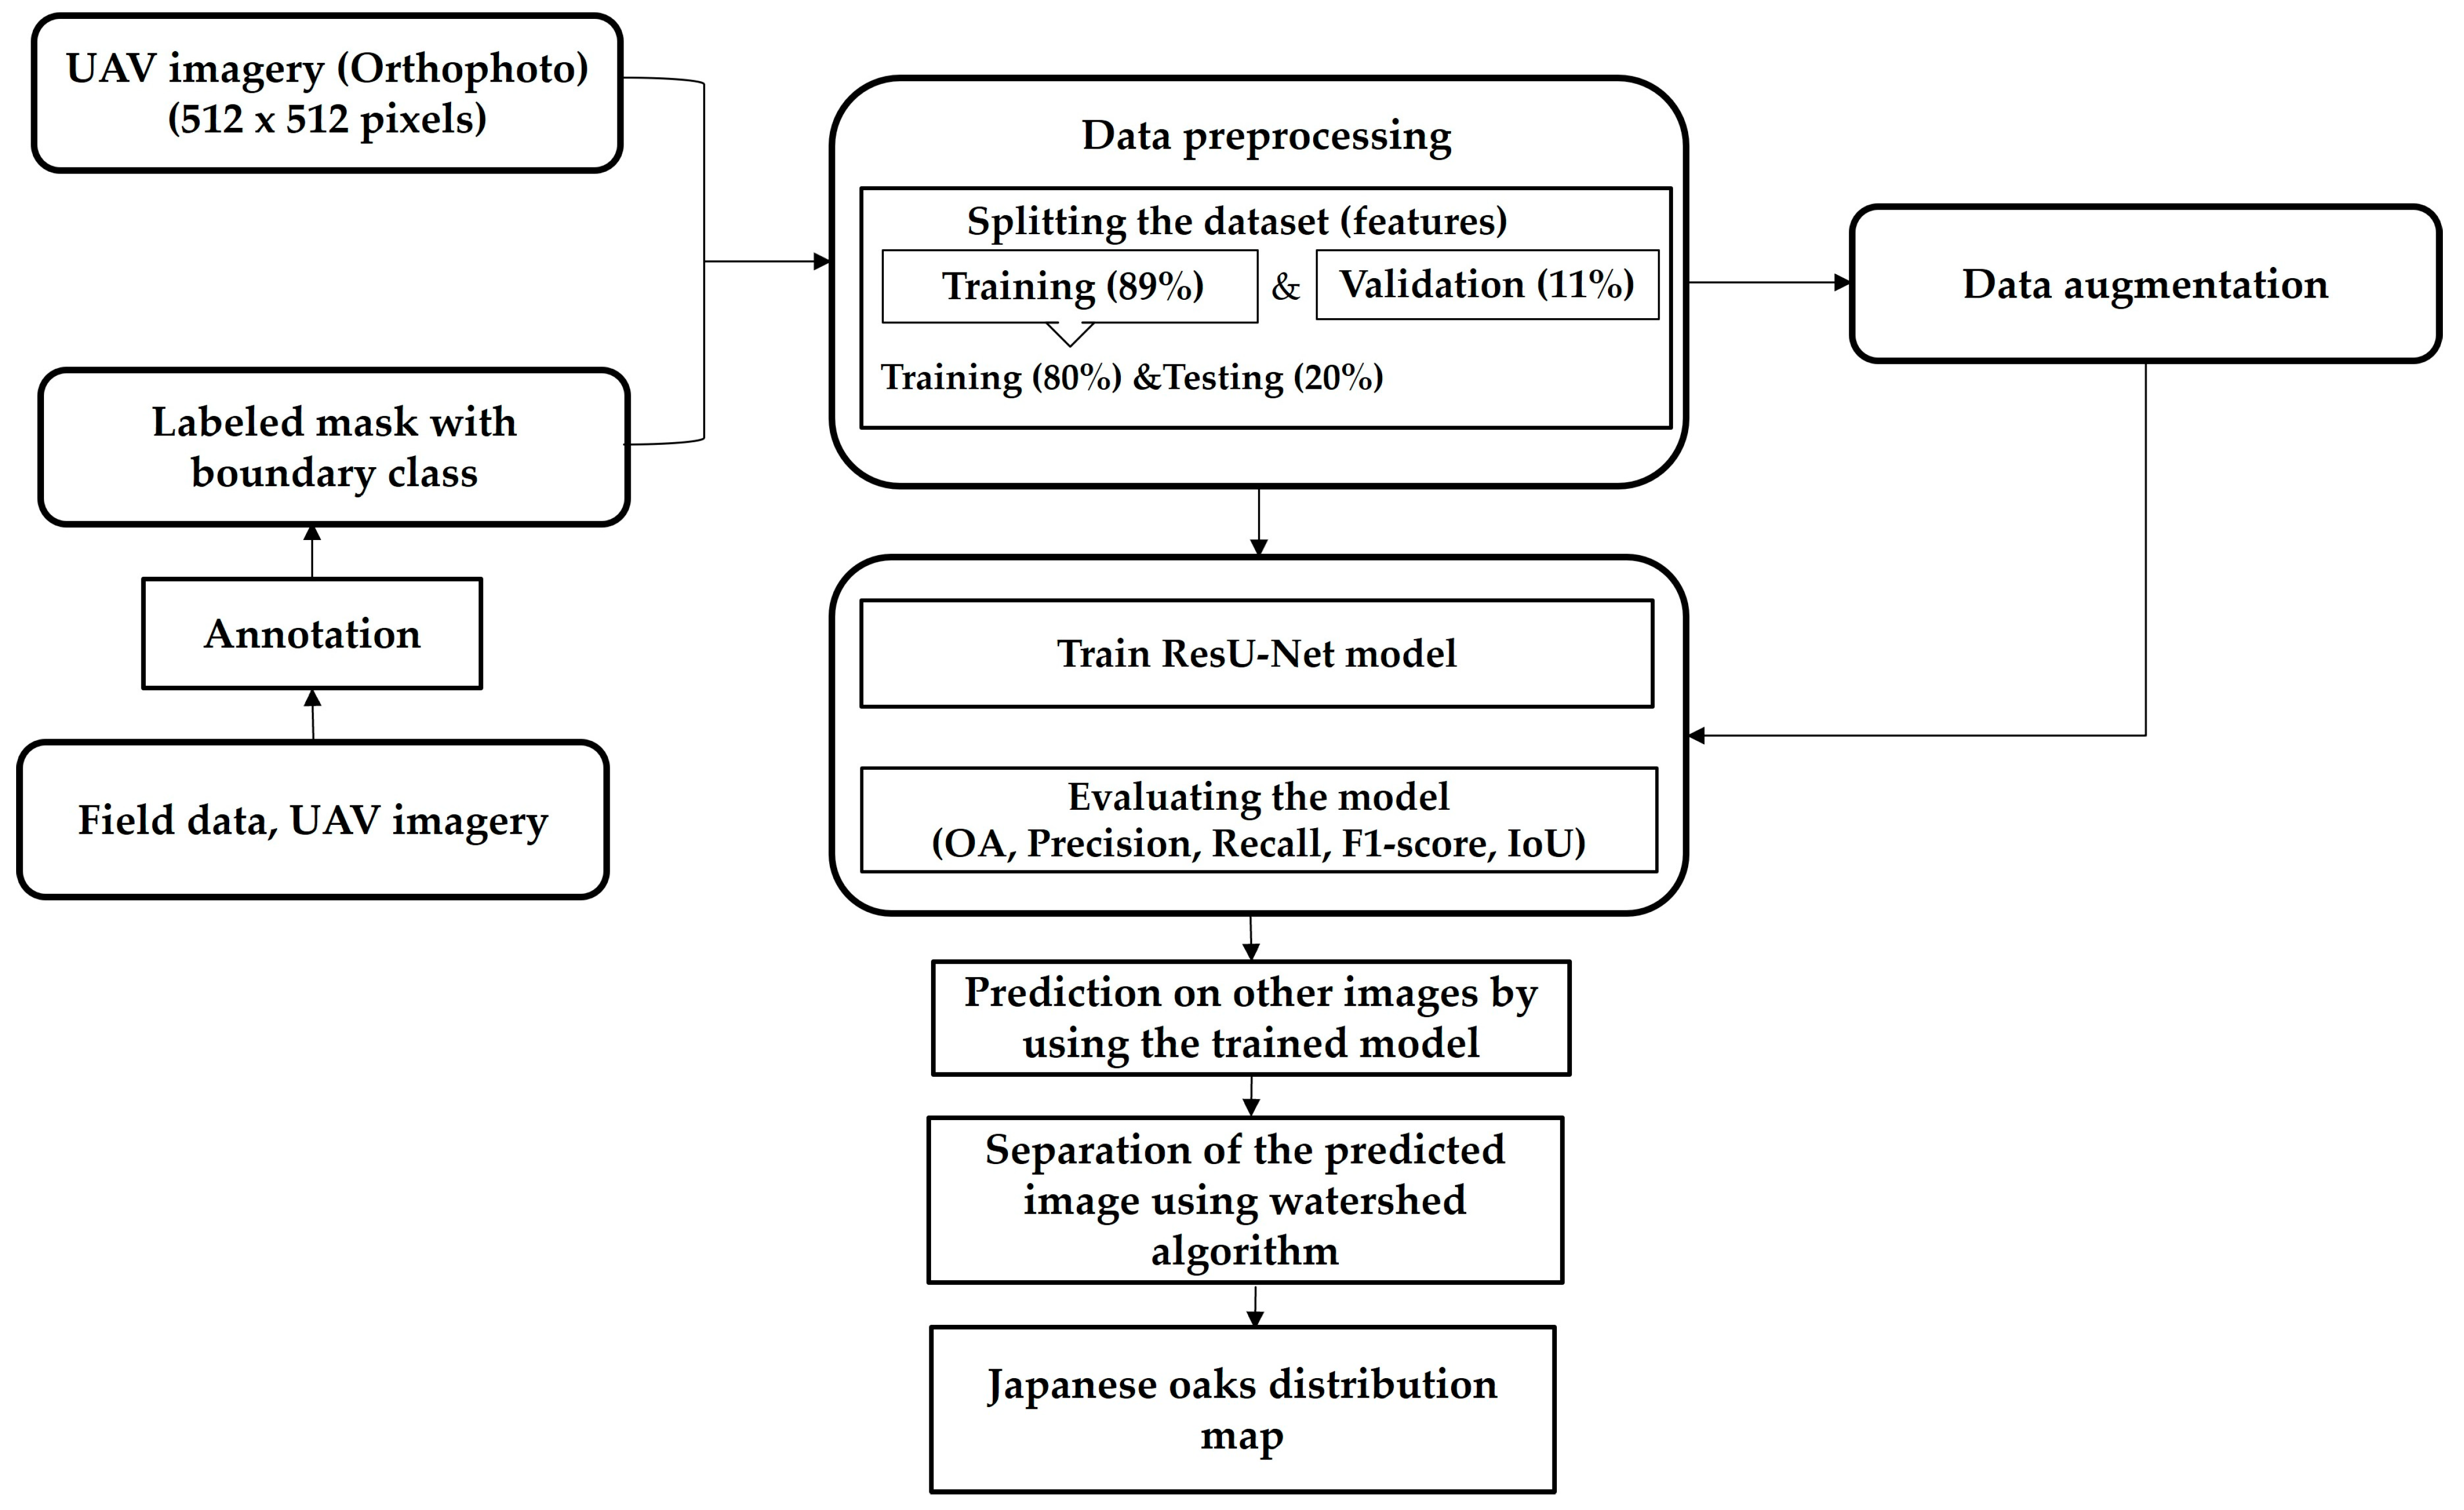
By its very nature, deep learning architecture relies on a large sample dataset to achieve good accuracy results and to avoid overfitting. However, this is not practically possible as the preparation of large datasets is costly and time-consuming. An alternative way to overcome this challenge could be the application of data augmentation techniques that artificially increase the volume of sample data [12,13,32]. In this context, previous studies have achieved better classification results by applying this technique [32,33,34]. The total number of Japanese oaks was only 319 in the present study, making it a small dataset for training deep learning architectures. Therefore, we also used data augmentation technique to increase the number of input data and to make the model more generalized and robust to different variations in the input data.
For this purpose, we used the ImageDataGenerator class provided by the Keras library (version 2.10.0), which is used for real-time data augmentation during neural network training, especially for image classification tasks [33]. Initially, many image transformations were applied, such as rotation, shifting, flipping, brightness/darkness adjustment, and scale adjustment, which are commonly used in tree species segmentation tasks. However, after several trials, we decided to augment the input images by rotating them, shifting their width and height, and flipping them vertically and horizontally, because these five image transformations provided the highest performance of the ResU-Net model. In the following, the UAV datasets without and with augmentation will be referred to as non-augmented and augmented UAV datasets.

2.3. Data Analysis

2.3.1. Deep Learning Algorithm

In this study, we used the U-Net algorithm, which is a popular CNN used for semantic segmentation tasks, where the goal is to classify each pixel in an image to its appropriate class. The U-Net architecture was originally developed by Ronneberger et al. (2015) [35] for biomedical image segmentation, but it has since been widely adopted for many applications, including forestry, as described in Section 1. In particular, the U-Net has been widely used in forestry sector because of its ability to capture intricate details and hierarchical features from high-resolution satellite or aerial imagery, which are essential for improving the accuracy of tasks such as vegetation analysis, land cover classification, forest-type classification, tree species identification, and so on. The U-Net has a distinctive U-shaped structure. The left side of the U-Net, called the encoder, consists of a series of convolutional and pooling layers that reduce the spatial resolution of the input image while increasing the number of feature channels. Meanwhile, the right side of the U-Net, decoder, includes up-sampling and concatenation operations to gradually increase the spatial resolution. This helps to recover detailed information lost during the down-sampling process. At the center of the network is a bottleneck connecting the encoder to the decoder that serves to capture high-level features and provides a context for segmentation. In forestry, where objects of interest may vary in size, it is essential to have a network that can understand features at different levels of granularity. The U-Net architecture allows it to capture features at multiple scales through its encoder and decoder [16]. Moreover, the U-Net incorporates skip connections that can preserve spatial information during down-sampling and up-sampling steps [36], which is important for accurately delineating the boundaries of individual trees. However, the U-Net can face the problem of vanishing gradients [13], especially in the decoder part where gradients need to be backpropagated over a long sequence of layers. On the other hand, ResNet proposed by He et al. (2016) [37], is a deep neural network architecture that plays an important role in computer vision problems. The key innovation of ResNet is its use of residual learning blocks. Each residual block consists of a residual connection that allows the flow of gradients more easily along the deep layers in the network during both forward and backward propagation. As a result, the ResNet mitigates the vanishing gradient problem encountered by the U-Net [13,21,22].
Therefore, the combination of the two state-of-the-art architectures of U-Net and ResNet was used for the prediction of Japanese oak crowns in the present study. Specifically, we used the U-Net model available in the “segmentation_models” library, a Python library of neural networks for image segmentation based on Keras and TensorFlow (https://github.com/qubvel/segmentation_models, accessed on 30 November 2023). When used together with this library, the U-Net model can be easily instantiated for different pre-trained backbones such as VGG16, VGG19, ResNet, and MobileNet. As mentioned above, we chose ResNet, which was weight-trained on the 2012 ILSVRC ImageNet dataset, as the backbone of the U-Net model. In particular, ResNet101, which has more deep layers than other ResNet architectures, was used because the increased deep layers enable the network to learn more complex and hierarchical features [38]. This can be beneficial for the Japanese oak crown segmentation task, which requires a more detailed understanding of the input data. Specifically, ResNet101 was used as the encoder of the U-Net model (Figure 3).
In ResNet101, the number 101 refers to the total number of layers in the network, including 1 input layer, 1 fully connected layer, and 99 convolutional layers. ResNet101 is structurally organized in five stages, each containing several blocks. Stage (1) contains the convolutional layer and the max-pooling layer; stage (2) contains three identity blocks, stage (3) four identity blocks, stage (4) 23 identity blocks, and stage (5) three identity blocks (Figure 4). Each identity block typically consists of a combination of convolutional layers, batch normalization, and activation functions.
In our study, the ResNet101 encoder part serves as a feature extractor, capturing hierarchical features from the input image, while the decoder part of the U-Net takes the features extracted by the ResNet101 and progressively up-samples and refines them to generate the final output segmentation map.

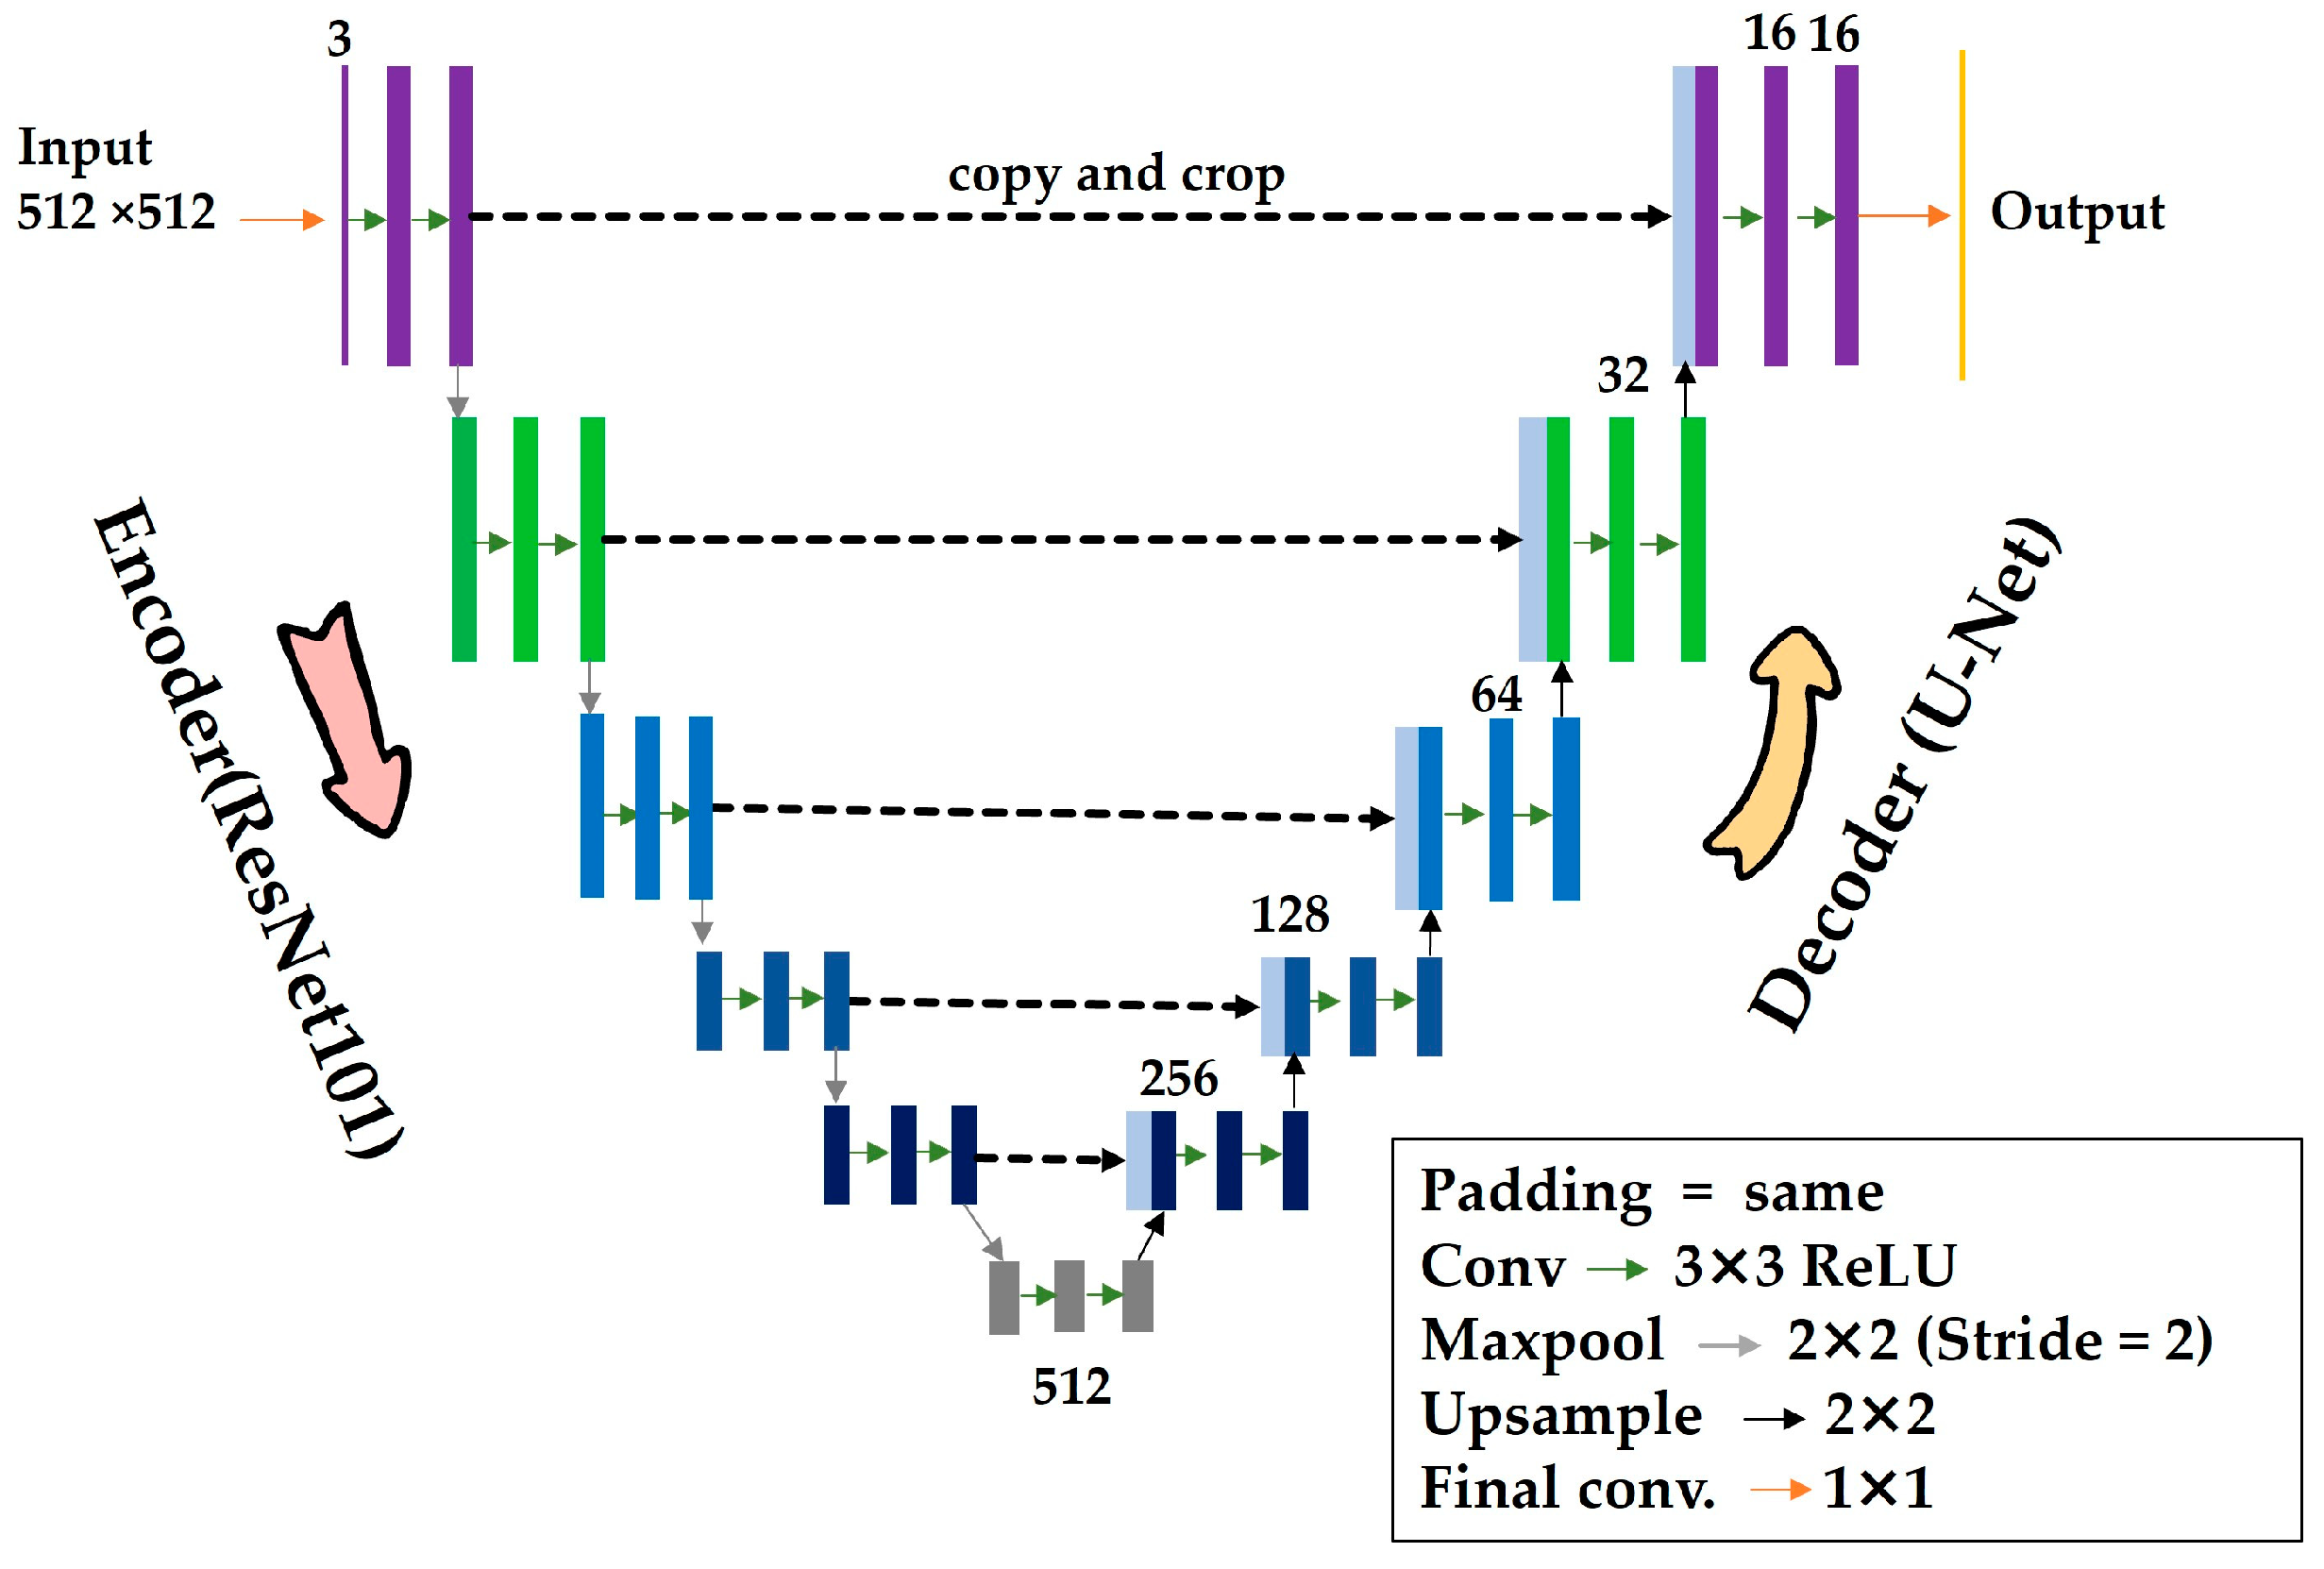
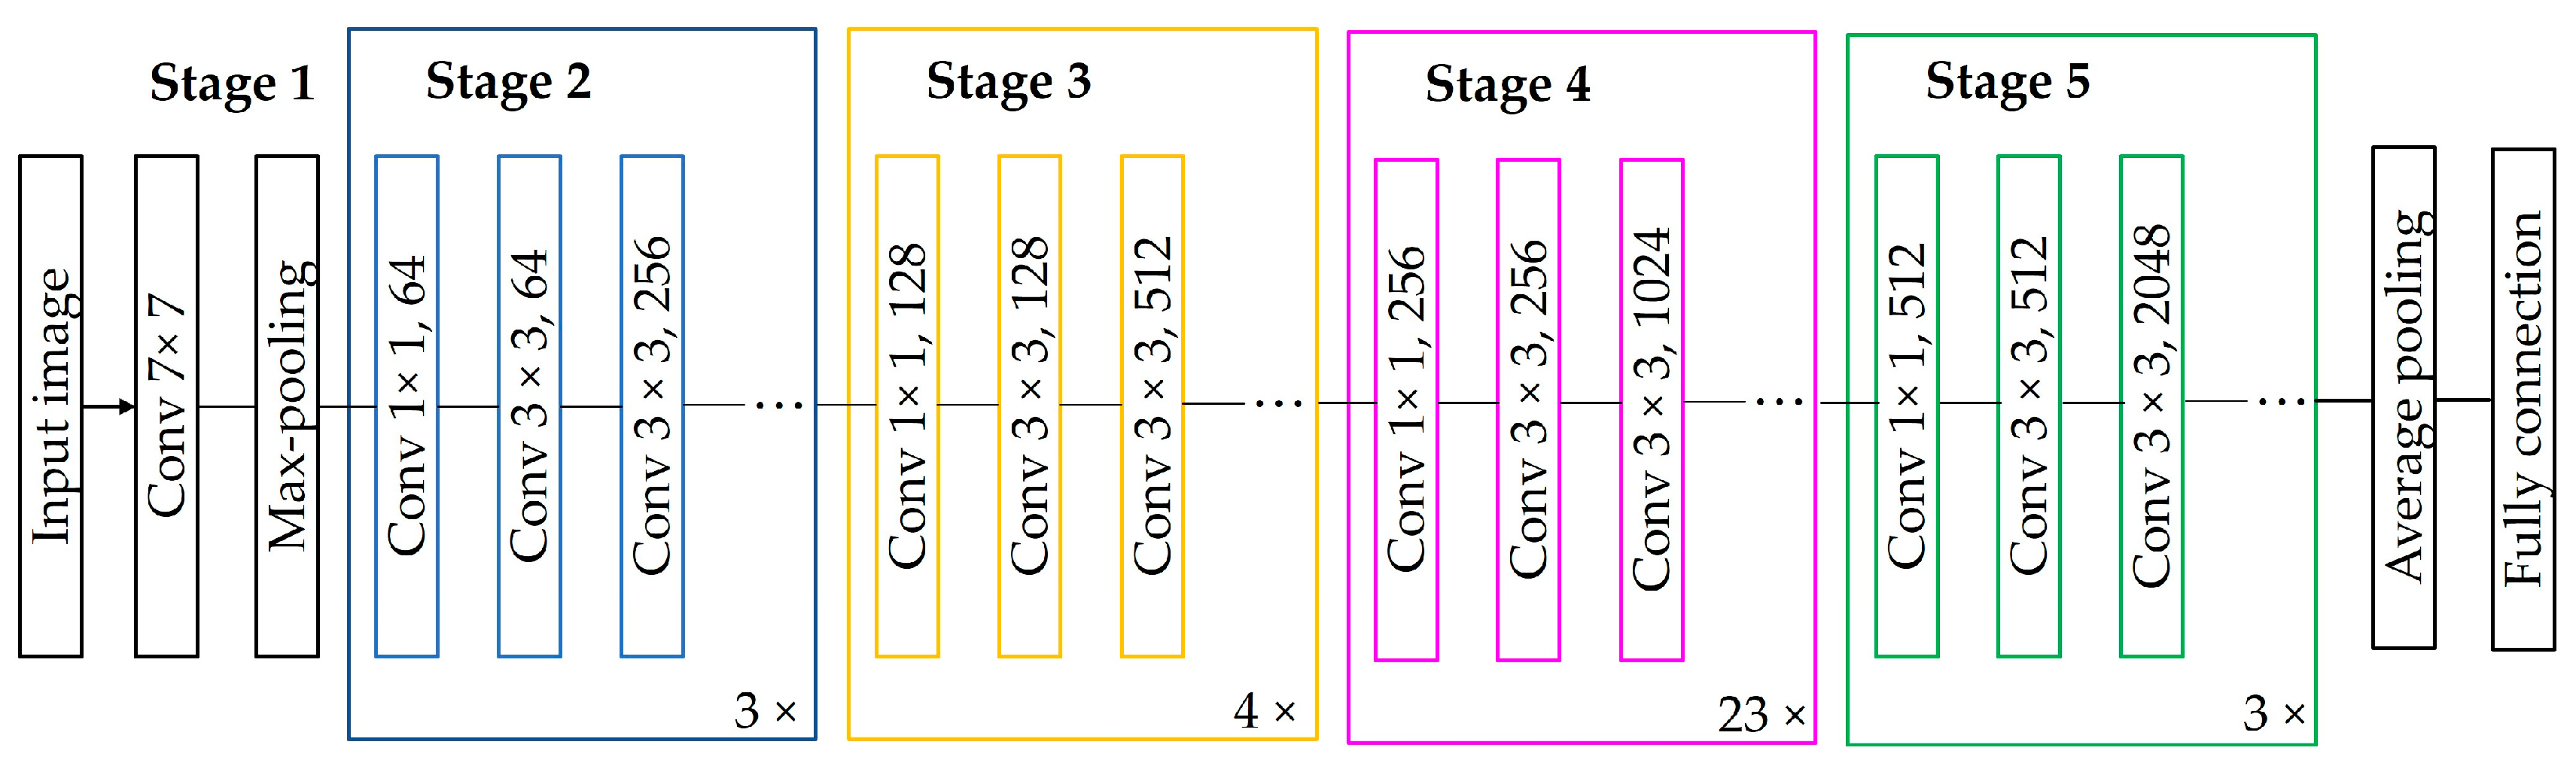
2.3.2. Identification of Japanese Oak Crowns Using the ResU-Net Model

In the present study, the orthophotos of the September and October UAV datasets were cropped into small patches of 512 × 512 pixels to avoid overloading the computer memory. For each dataset, 217 images, covering the full number of annotated oaks, were generated, resulting in 217 corresponding labeled masks. Due to the small number of our datasets, we tested by splitting the dataset into different training and validation ratios (i.e., 70% and 30%, 80% and 20%, 90% and 10%, 89% and 11%, respectively) to ensure a meaningful evaluation of the model’s performance. After these tests, since 89% and 11% provided the best performance of the model, 89% of the images and masks were used for model development and 11% were allocated for validation. The validation dataset consisted of 24 images that included only Japanese oaks recorded in the field (n = 17). For quick testing of the model’s performance on new data during model development, the training dataset was split into a training set (80%) and a test set (20%).
For network training, we employed the Adam optimizer configured with the specified learning rate of 0.0001. Regarding loss function, we used the composite function, which includes both dice loss and focal loss, to balance the importance of different loss components during training. While dice loss is useful for dealing with class imbalance in segmentation tasks (i.e., where the positive (target object) and negative (background) classes are not evenly distributed), focal loss introduces a modulating factor to assign more weight to challenging samples and allows for the improved accuracy of boundary detection (SERP AI, https://serp.ai/loss-functions/, accessed on 31 January 2024). The combined strengths of these two loss functions are particularly important in sparse instance tasks such as Japanese oak crown segmentation.
As the accuracy scores of the model during training were unstable until epoch 100 after test runs, the models were trained for 100 epochs for all UAV datasets, with the best model saved using the ModelCheckpoint callback function provided in the Keras library. Each epoch of all of the UAV datasets had eight batches, with a verbosity of 1. After the ResU-Net models had been trained, the watershed separation approach, commonly employed in the separation of overlapping tree crowns in images [39,40], was used to separate the borders from the crowns of Japanese oaks in the predicted images. The general flow of the entire procedure for identifying Japanese oaks is shown in Figure 5.
ResU-Net models were coded in Spyder (version 5.4.1) using the Python programming language with a Keras front end and a TensorFlow back end [13]. When a 2ML54VSB laptop (ASUSTeK Computer Inc., Taipei, Taiwan) with an AMD Ryzen 7 4800H processor and 16.0 GB of RAM was used, the model training time for each non-augmented UAV dataset was 330 s per epoch, and that for each augmented UAV dataset 290 s per epoch.

2.3.3. Evaluation Metrics for the Model

The model was evaluated using overall accuracy (OA), precision, recall and F1 scores based on the validation dataset. Moreover, these metrics were used in the overlay analysis of the segmented results and all annotated ground truth data to quantify the model performance for the entire dataset. OA measures the correctness of predictions made by the model across all classes. It is defined as the ratio of the number of pixels that match between the predicted class label and the ground truth label and the total number of pixels in the dataset. Precision is a measure of the accuracy of the positive predictions made by the model. It answers the question: “How many of the pixels predicted as positive are truly positive?”. Recall is a measure of the ability of the model to capture all positive instances. It answers the question: “How many of the truly positive pixels did the model correctly predict?”. The F1 score is the harmonic mean of precision and recall and provides a balance between these two metrics. Together, these metrics provide a comprehensive understanding of the model’s performance, considering aspects such as accuracy, reliability of predictions, ability to detect the target class, and the trade-off between false positives and false negatives (SPOT INTELLIGENCE, https://spotintelligence.com/2023/05/08/f1-score/; accessed on 14 December 2023). OA, precision, recall, and F1 scores were calculated using the following formulas:
Overall accuracy (OA) = Number of correctly predicted pixels/total number of pixels
Precision = TP/(TP + FP)
Recall = TP/(TP + FN)
F1 = 2 × {(Precision × Recall)/(Precision + Recall)}
where
  • TP (True Positives): Pixels correctly predicted as positive (belonging to the target class).
  • FP (False Positives): Pixels incorrectly predicted as positive (model predicts the class, but it is not actually present).
  • FN (False Negatives): Pixels incorrectly predicted as negative (model fails to predict the class when it should have).
The intersection over union (IoU), which measures the ratio of the intersection of the predicted and ground truth regions to their union, was also determined. The IoU quantifies how well the predicted segmentation aligns with the actual segmentation and is particularly useful for evaluating the spatial accuracy of the segmentation. The formula for IoU is as follows:
IoU = (Area of Intersection)/(Area of Union)
In addition, confusion matrices were constructed as heat maps to visualize the performance of machine learning models in predicting Japanese oak crown.

3. Results

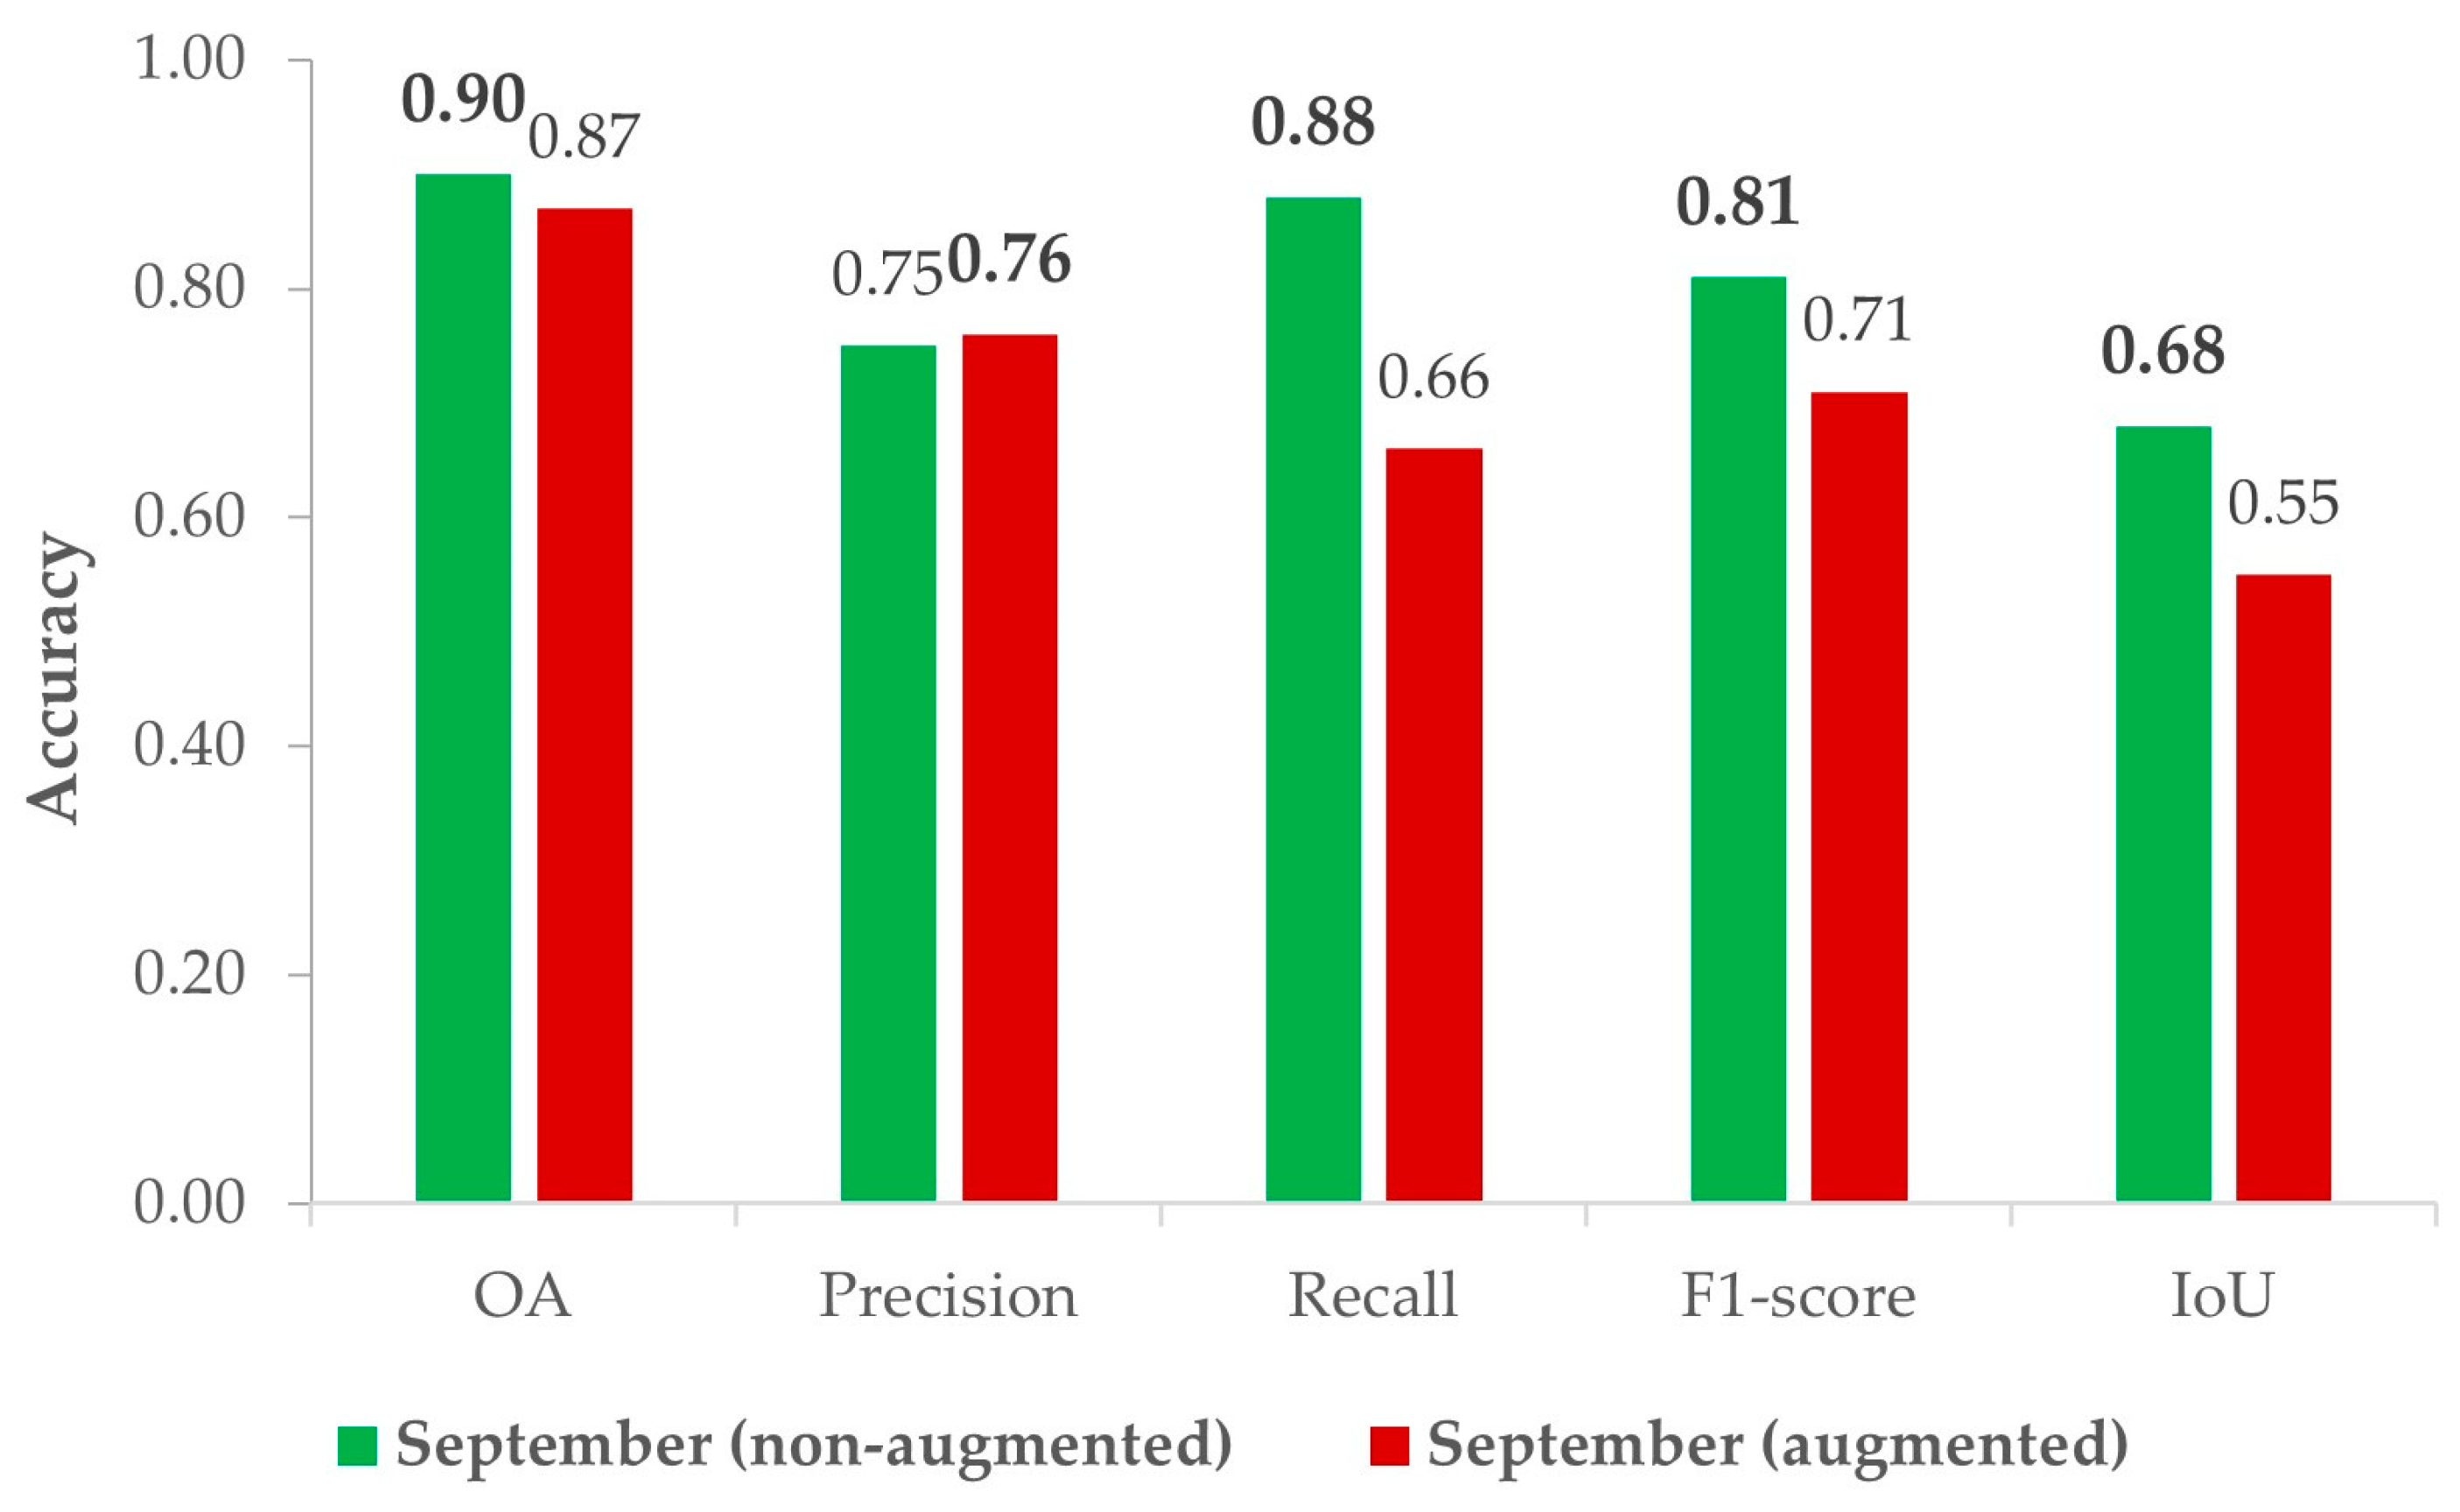
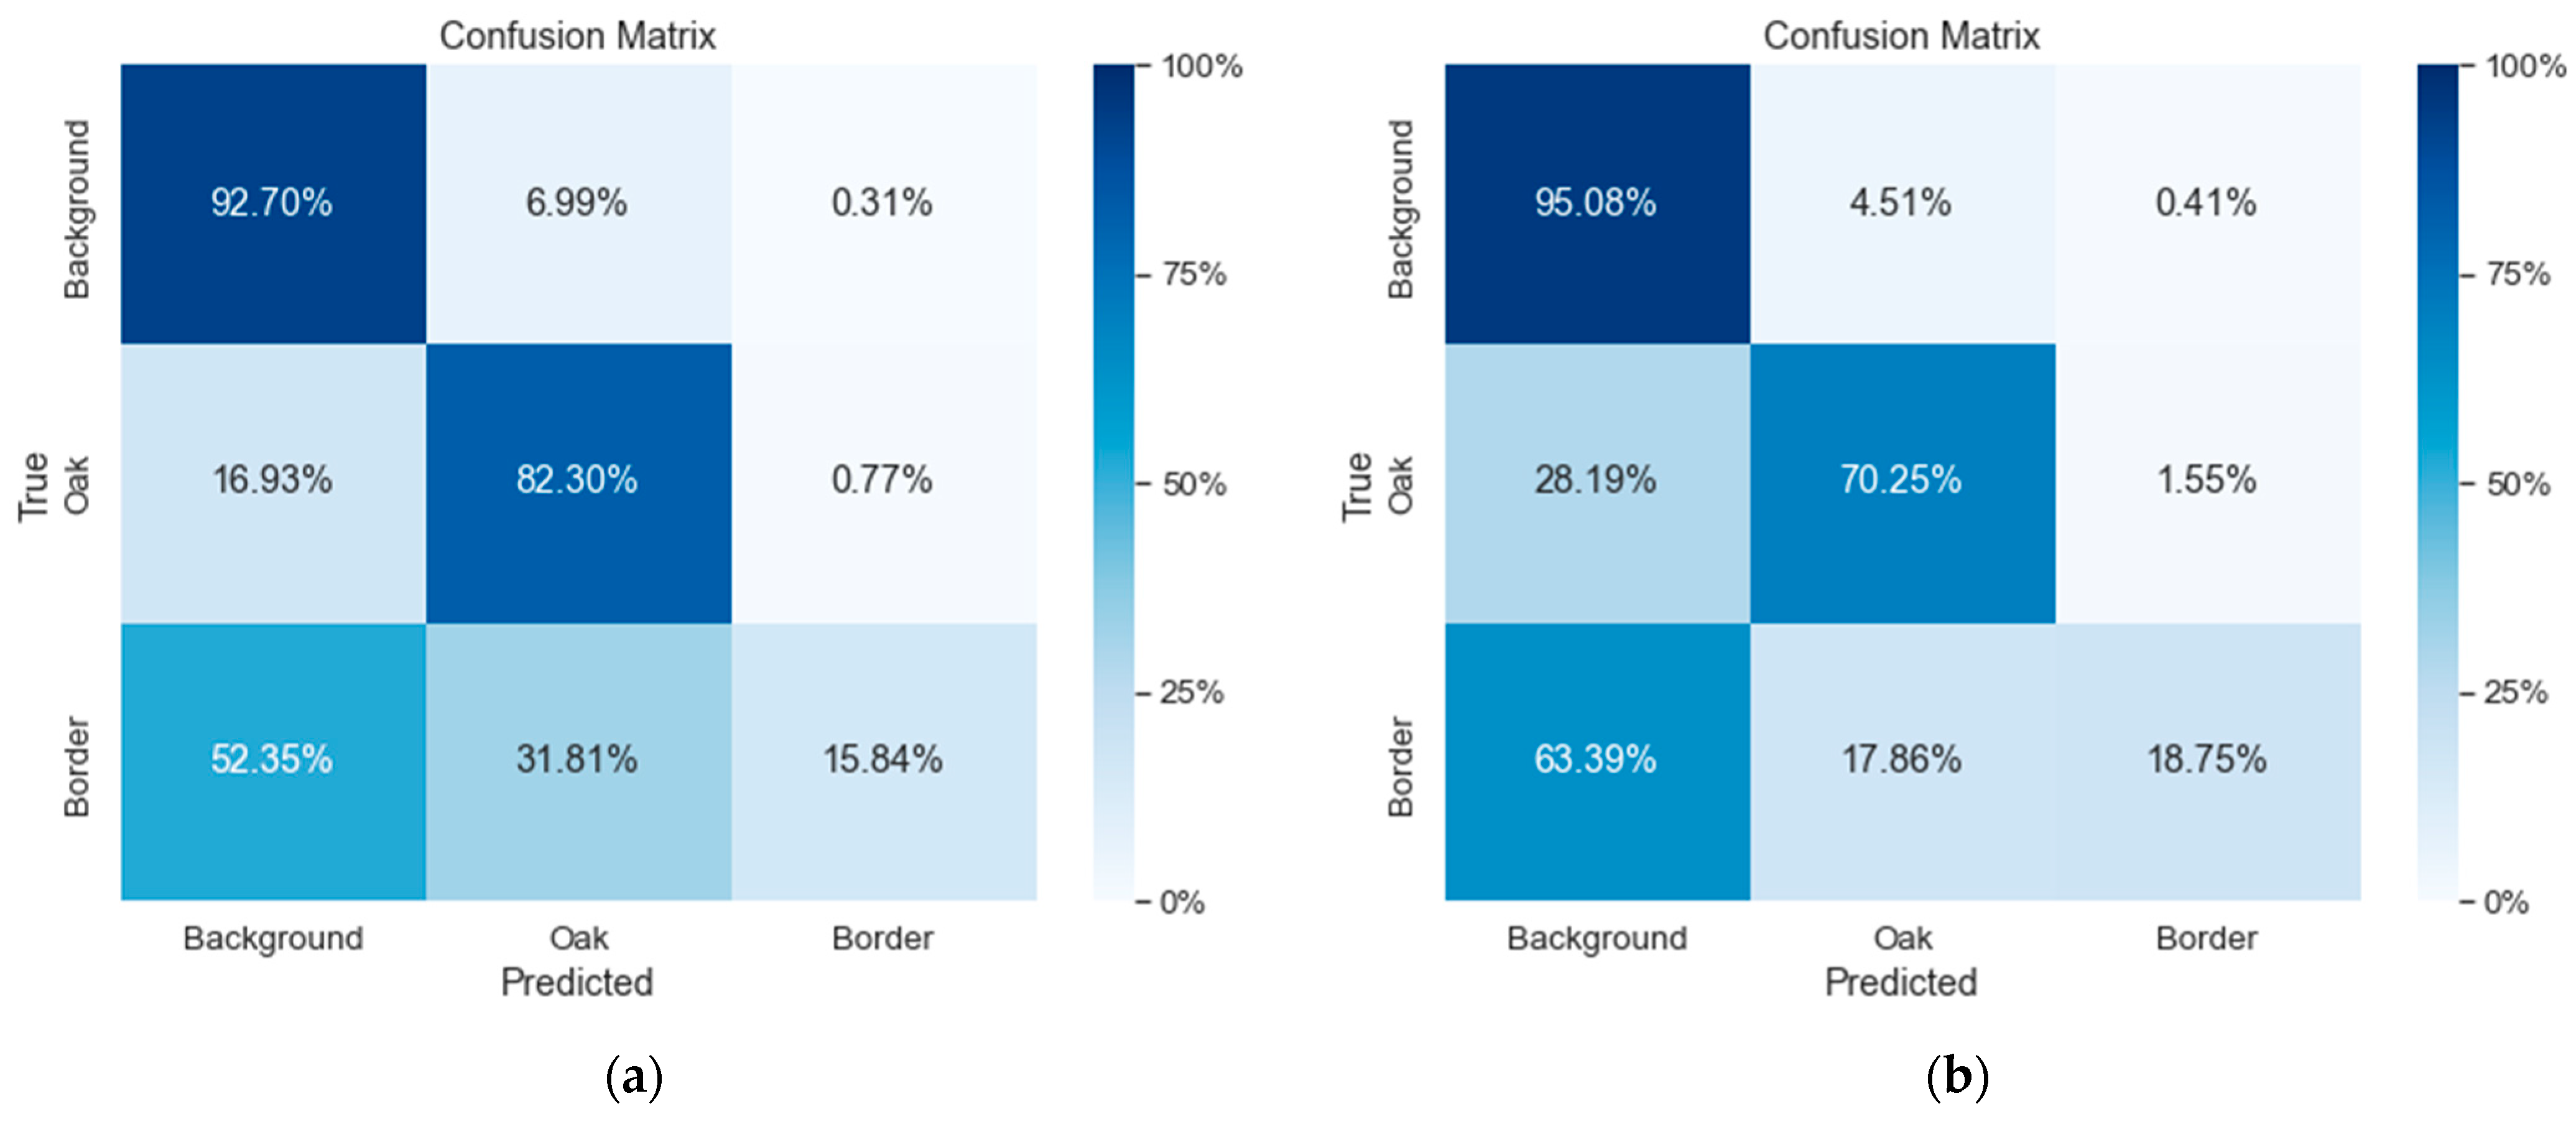
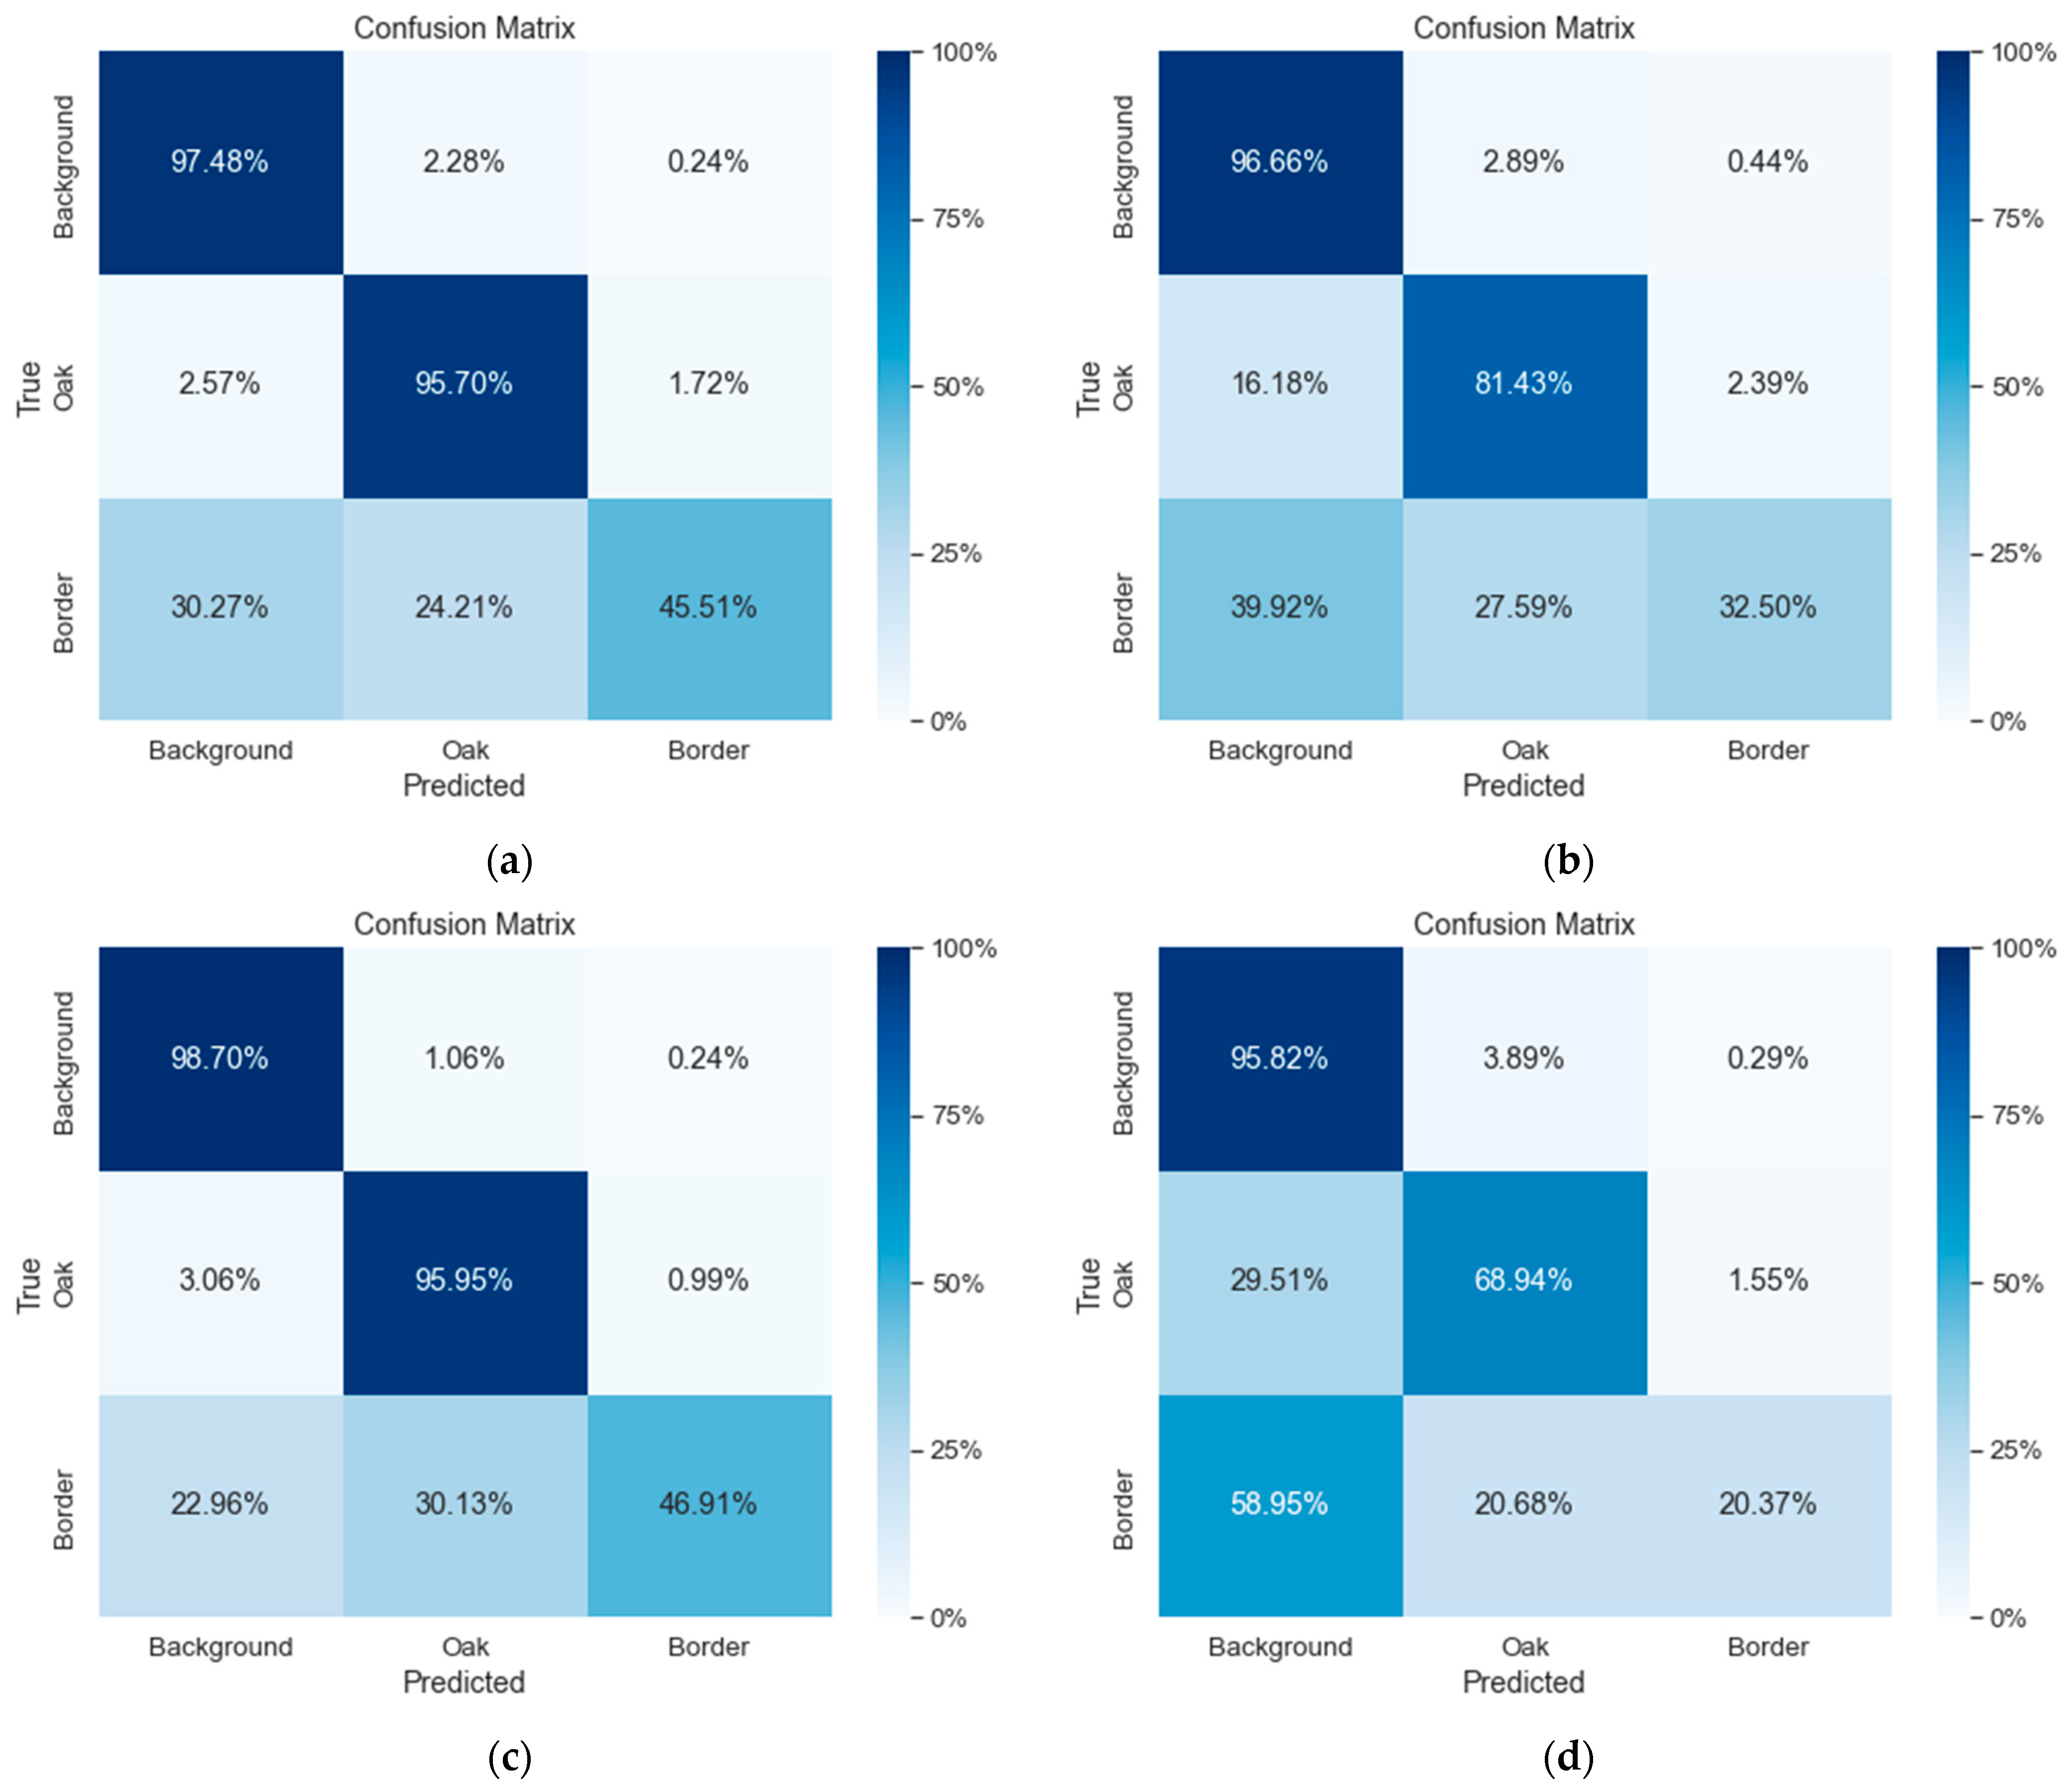
3.1. Japanese Oak Segmentation Using the ResU-Net Model and the UAV Datasets Acquired before the Leaf Color Change (without and with Augmentation)

When the ResU-Net model was trained on the September UAV datasets taken before the change in leaf color, in terms of OA, recall, the F1-score, and IoU, the performance of the model using the non-augmented dataset was significantly better, with values of 0.90, 0.88, 0.81, and 0.68, respectively. The corresponding values of the model using the augmented UAV dataset were 0.87, 0.66, 0.71, and 0.55; only the precision was slightly higher. The accuracy scores obtained in the identification of Japanese oak using the ResU-Net model and September UAV datasets (without and with augmentation) are shown in Table 1 and visualized in Figure 6.
According to the results of the confusion matrices shown in Figure 7, the ResU-Net model trained with the non-augmented September UAV dataset achieved an accurate prediction of Japanese oak of 87.70% of the cases but misclassified 11.03% and 1.27% of the Japanese oak as background and border, respectively. Conversely, 7.81% and 31.14% of the background and border identifications were misidentified as Japanese oak. Meanwhile, when the augmented September UAV dataset was used to train the ResU-Net model, accurate predictions were obtained in only 66.20% of the cases, with Japanese oak classified incorrectly as background and border at rates of 31.91% and 1.89%, which were higher compared to when using the non-augmented UAV dataset. However, the rates of misidentifications of background and border as Japanese oak (5.68% and 20.10%, respectively) were lower than those of the non-augmented September UAV dataset. Particularly, the non-augmented UAV dataset misclassified other deciduous broadleaf species such as Japanese linden (T. japonica) and castor aralia (K. septemlobus) as Japanese oak at a higher rate than the augmented UAV dataset. A sample patch of misdetection on the predicted images by the ResU-Net model using both non-augmented and augmented September UAV datasets is visualized in Figure 8. The visualization of separation of Japanese oak and the border class using the watershed algorithm is shown in Figure 9.

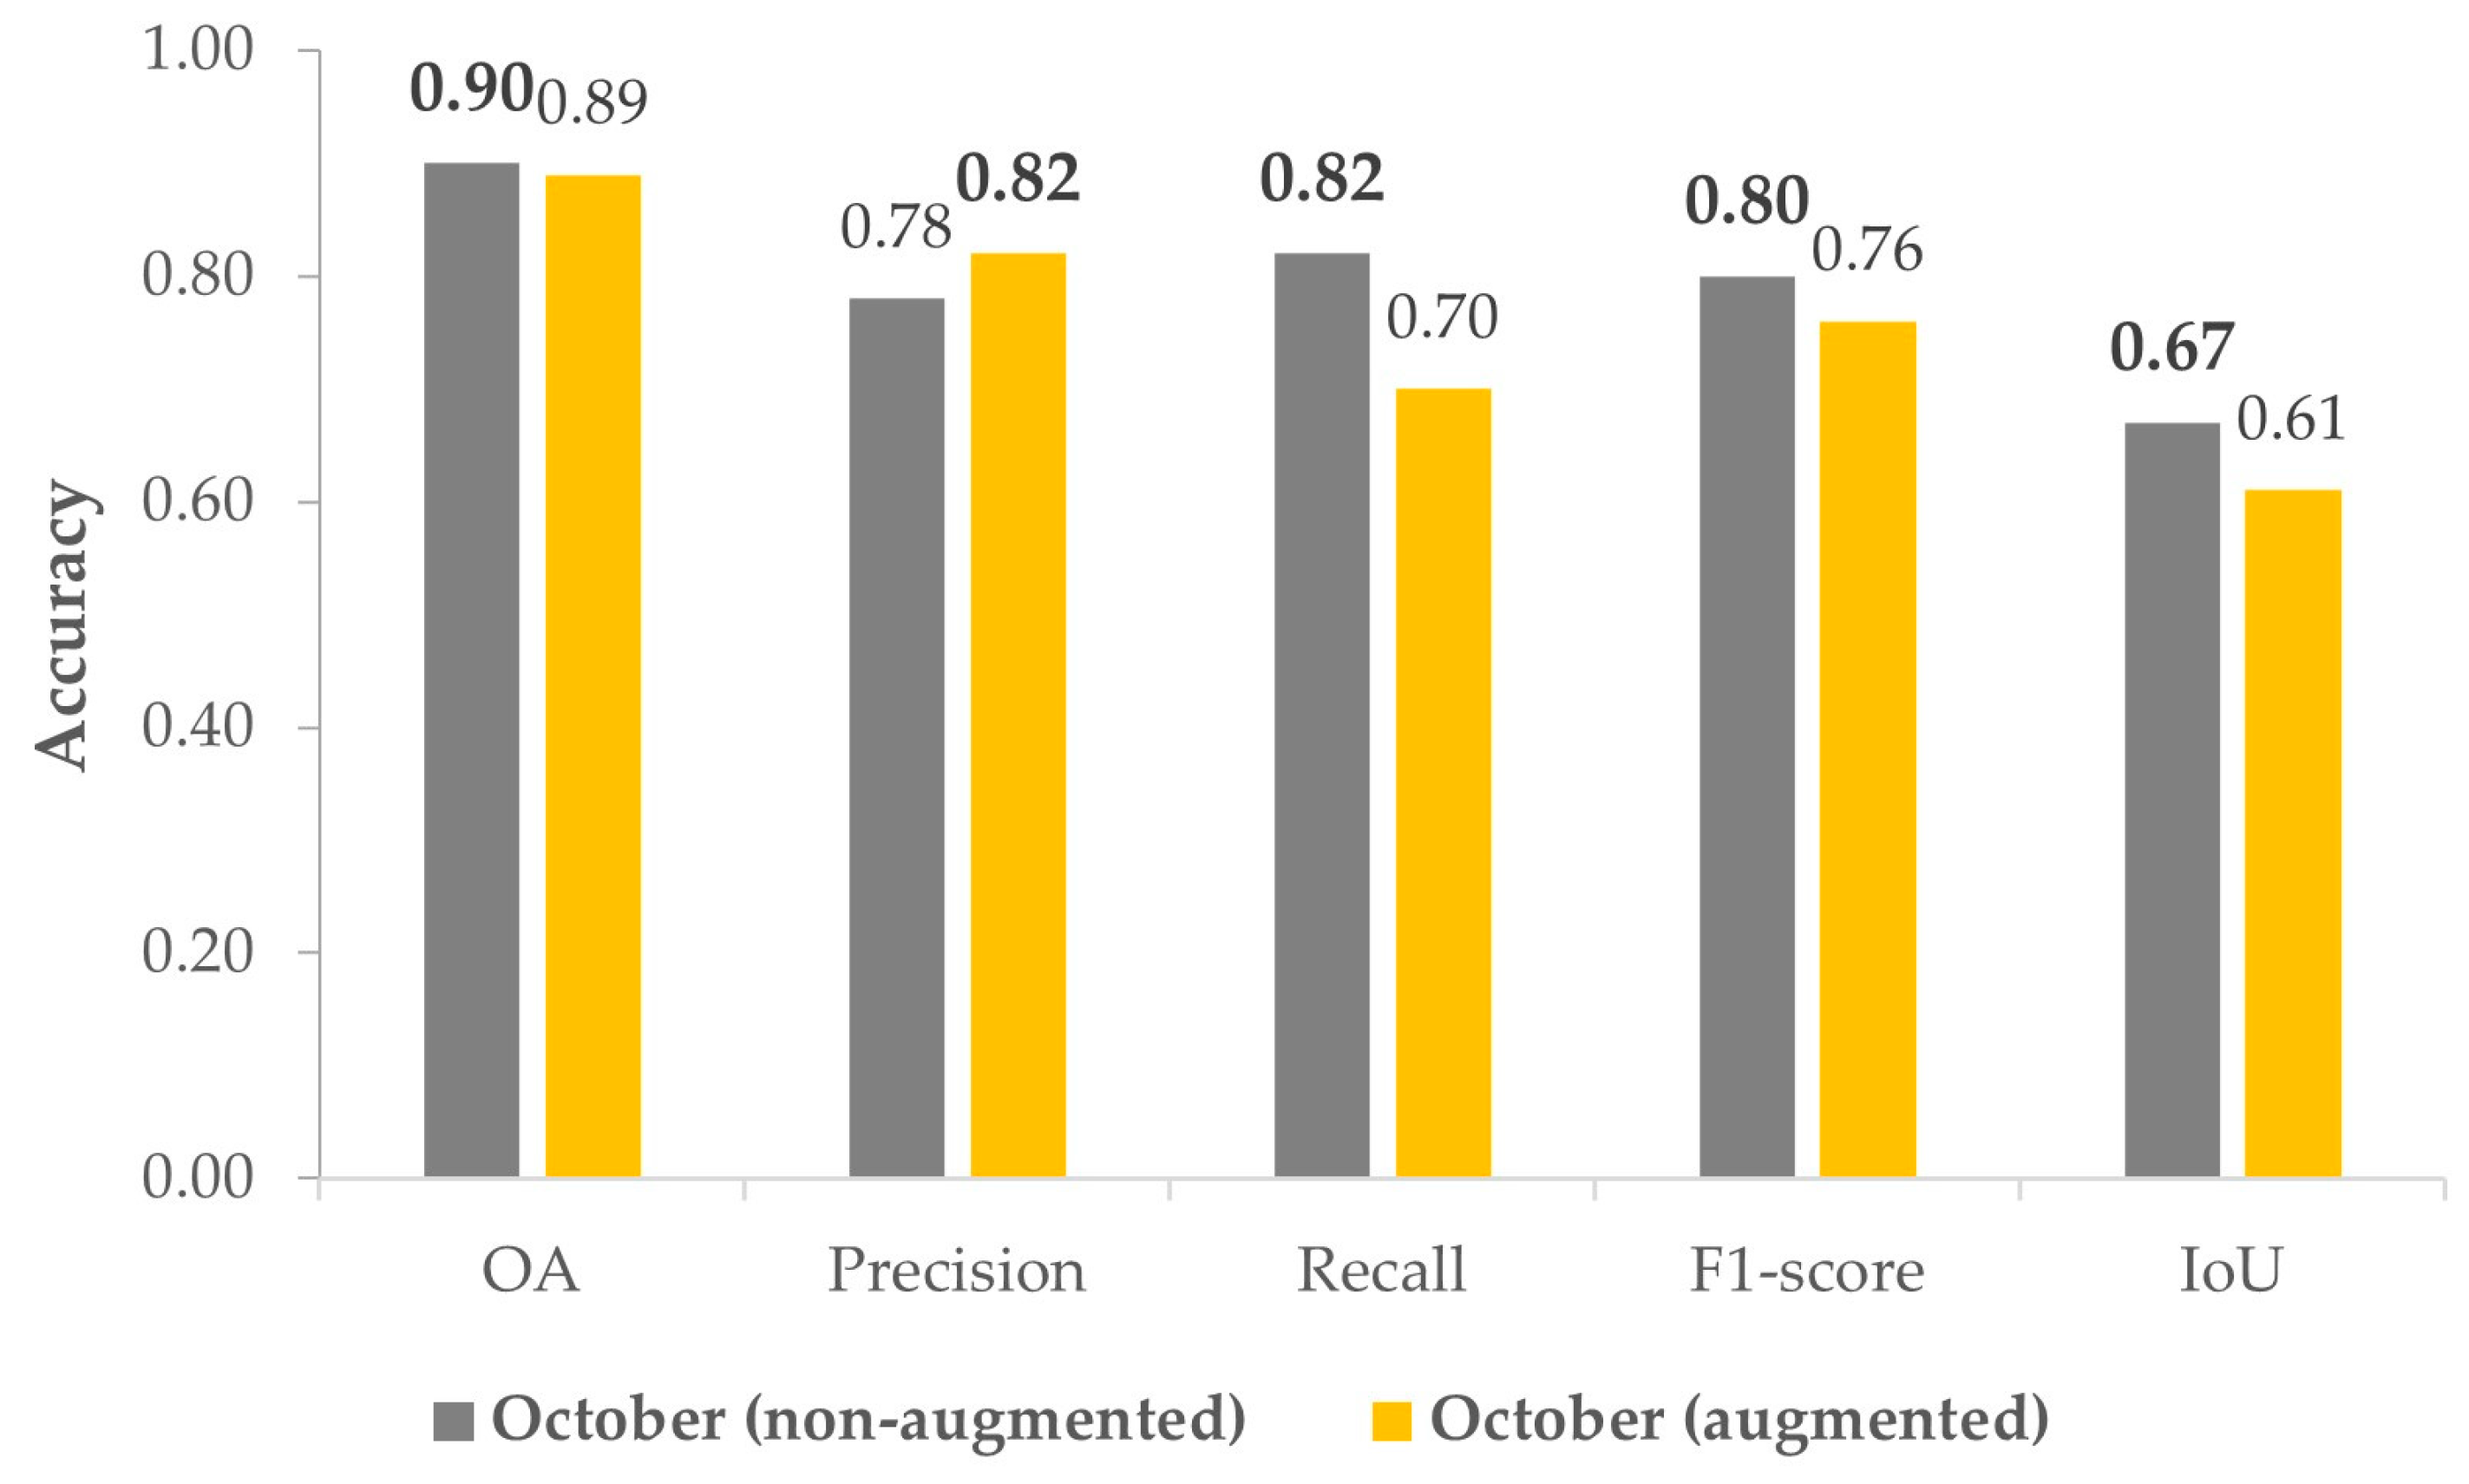
3.2. Japanese Oak Segmentation Using the ResU-Net Model and the UAV Datasets Acquired after the Change in Leaf Color (without and with Augmentation)

The results of Japanese oak crown segmentation using the ResU-Net model with the non-augmented and augmented October UAV datasets are summarized in Table 2 and Figure 10. For both datasets, the performance of the ResU-Net model was high in terms of OA, precision, recall, and the F1-socre, but the IoU values were slightly low. In particular, the model performed better with the non-augmented than with the augmented UAV dataset in terms of recall, the F1-score, and IoU (0.82, 0.80, and 0.67 vs. 0.70, 0.76, and 0.61, respectively) although not with respect to precision, which was higher with the augmented than with the non-augmented UAV dataset.
As seen in the confusion matrices (Figure 11), the ResU-Net model correctly identified 82.30% of Japanese oak using the non-augmented UAV dataset and 70.25% using the augmented UAV dataset. Meanwhile, the false prediction rates of Japanese oak as background and border were smaller using the model based on the non-augmented than the augmented UAV dataset: 16.93% and 0.77% vs. 28.19% and 1.55%, respectively. However, the misidentification rate of the border class as Japanese oak using the non-augmented UAV dataset was 31.81%, which was even higher than that of using the augmented UAV dataset (17.86%). The same was true for the misidentification of the background class as Japanese oak: 6.99% vs. 4.51%. Similar to the September UAV datasets, some other broadleaf trees species were also incorrectly identified as Japanese oaks using either October UAV datasets, although the misclassification rates were lower. An example of the predicted results of Japanese oak using the ResU-Net model and the October UAV datasets and the separation of Japanese oak and the border class using the watershed algorithm are visualized in Figure 12 and Figure 13, respectively.

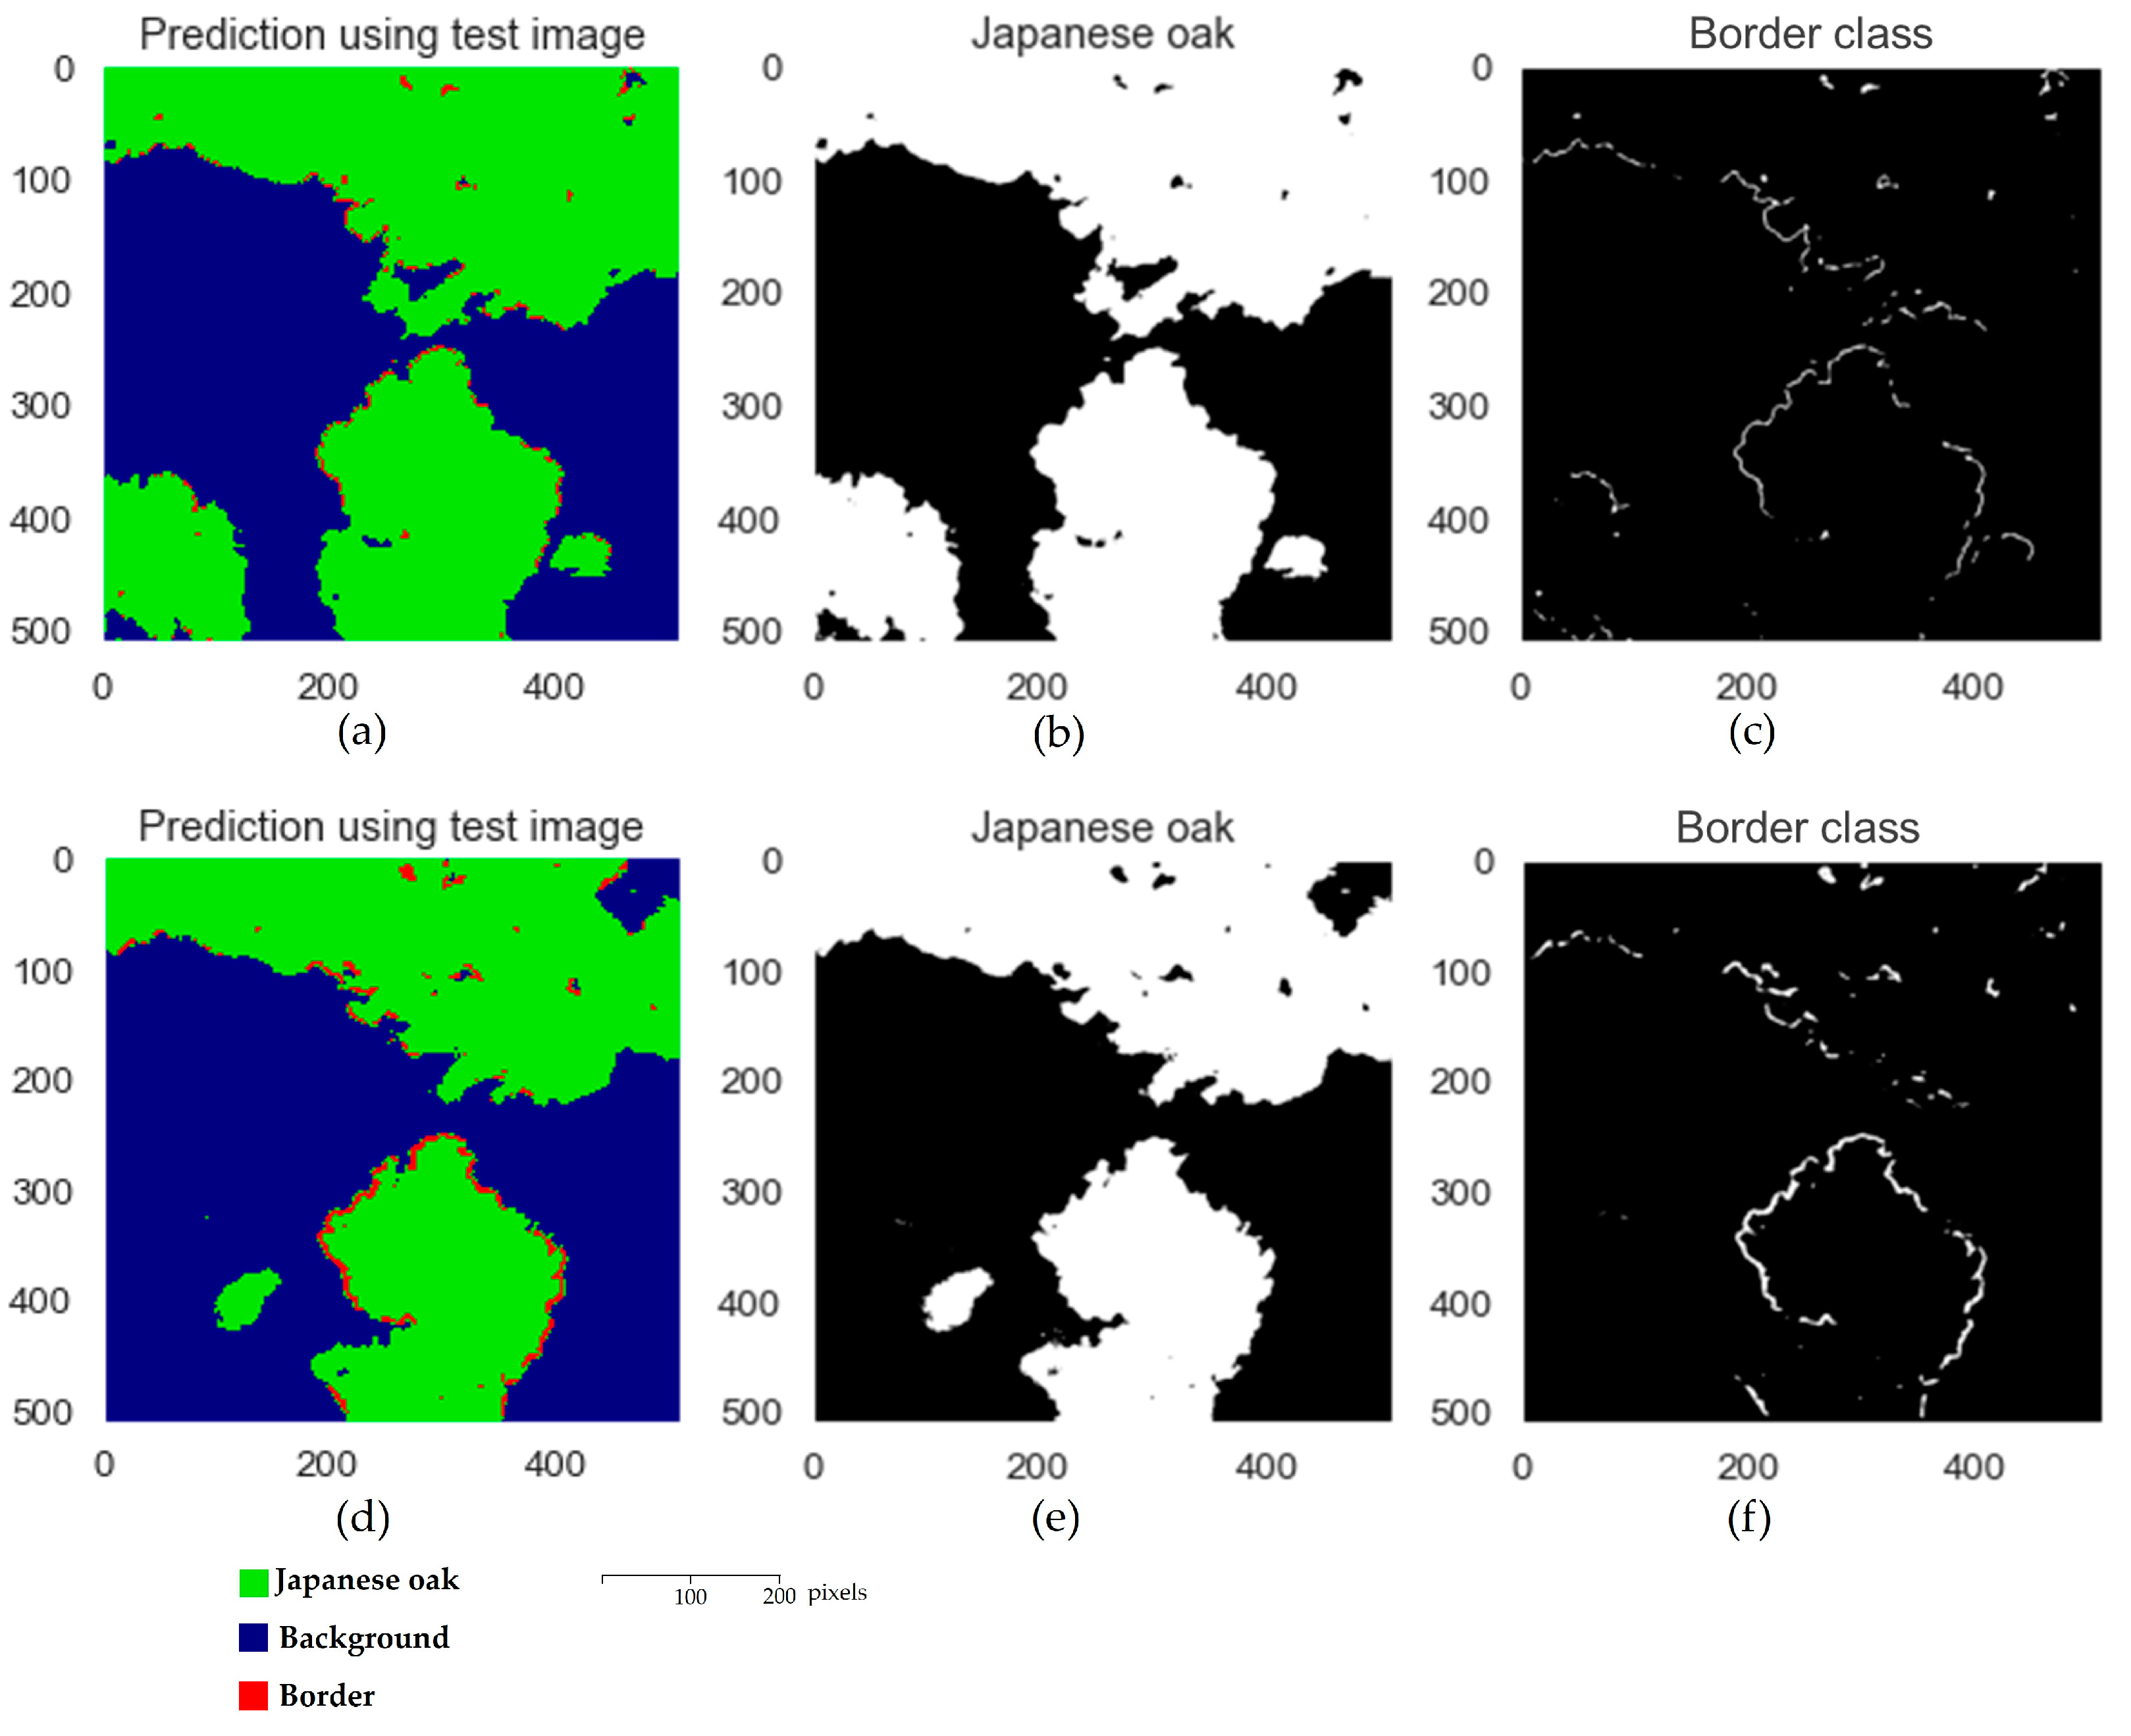
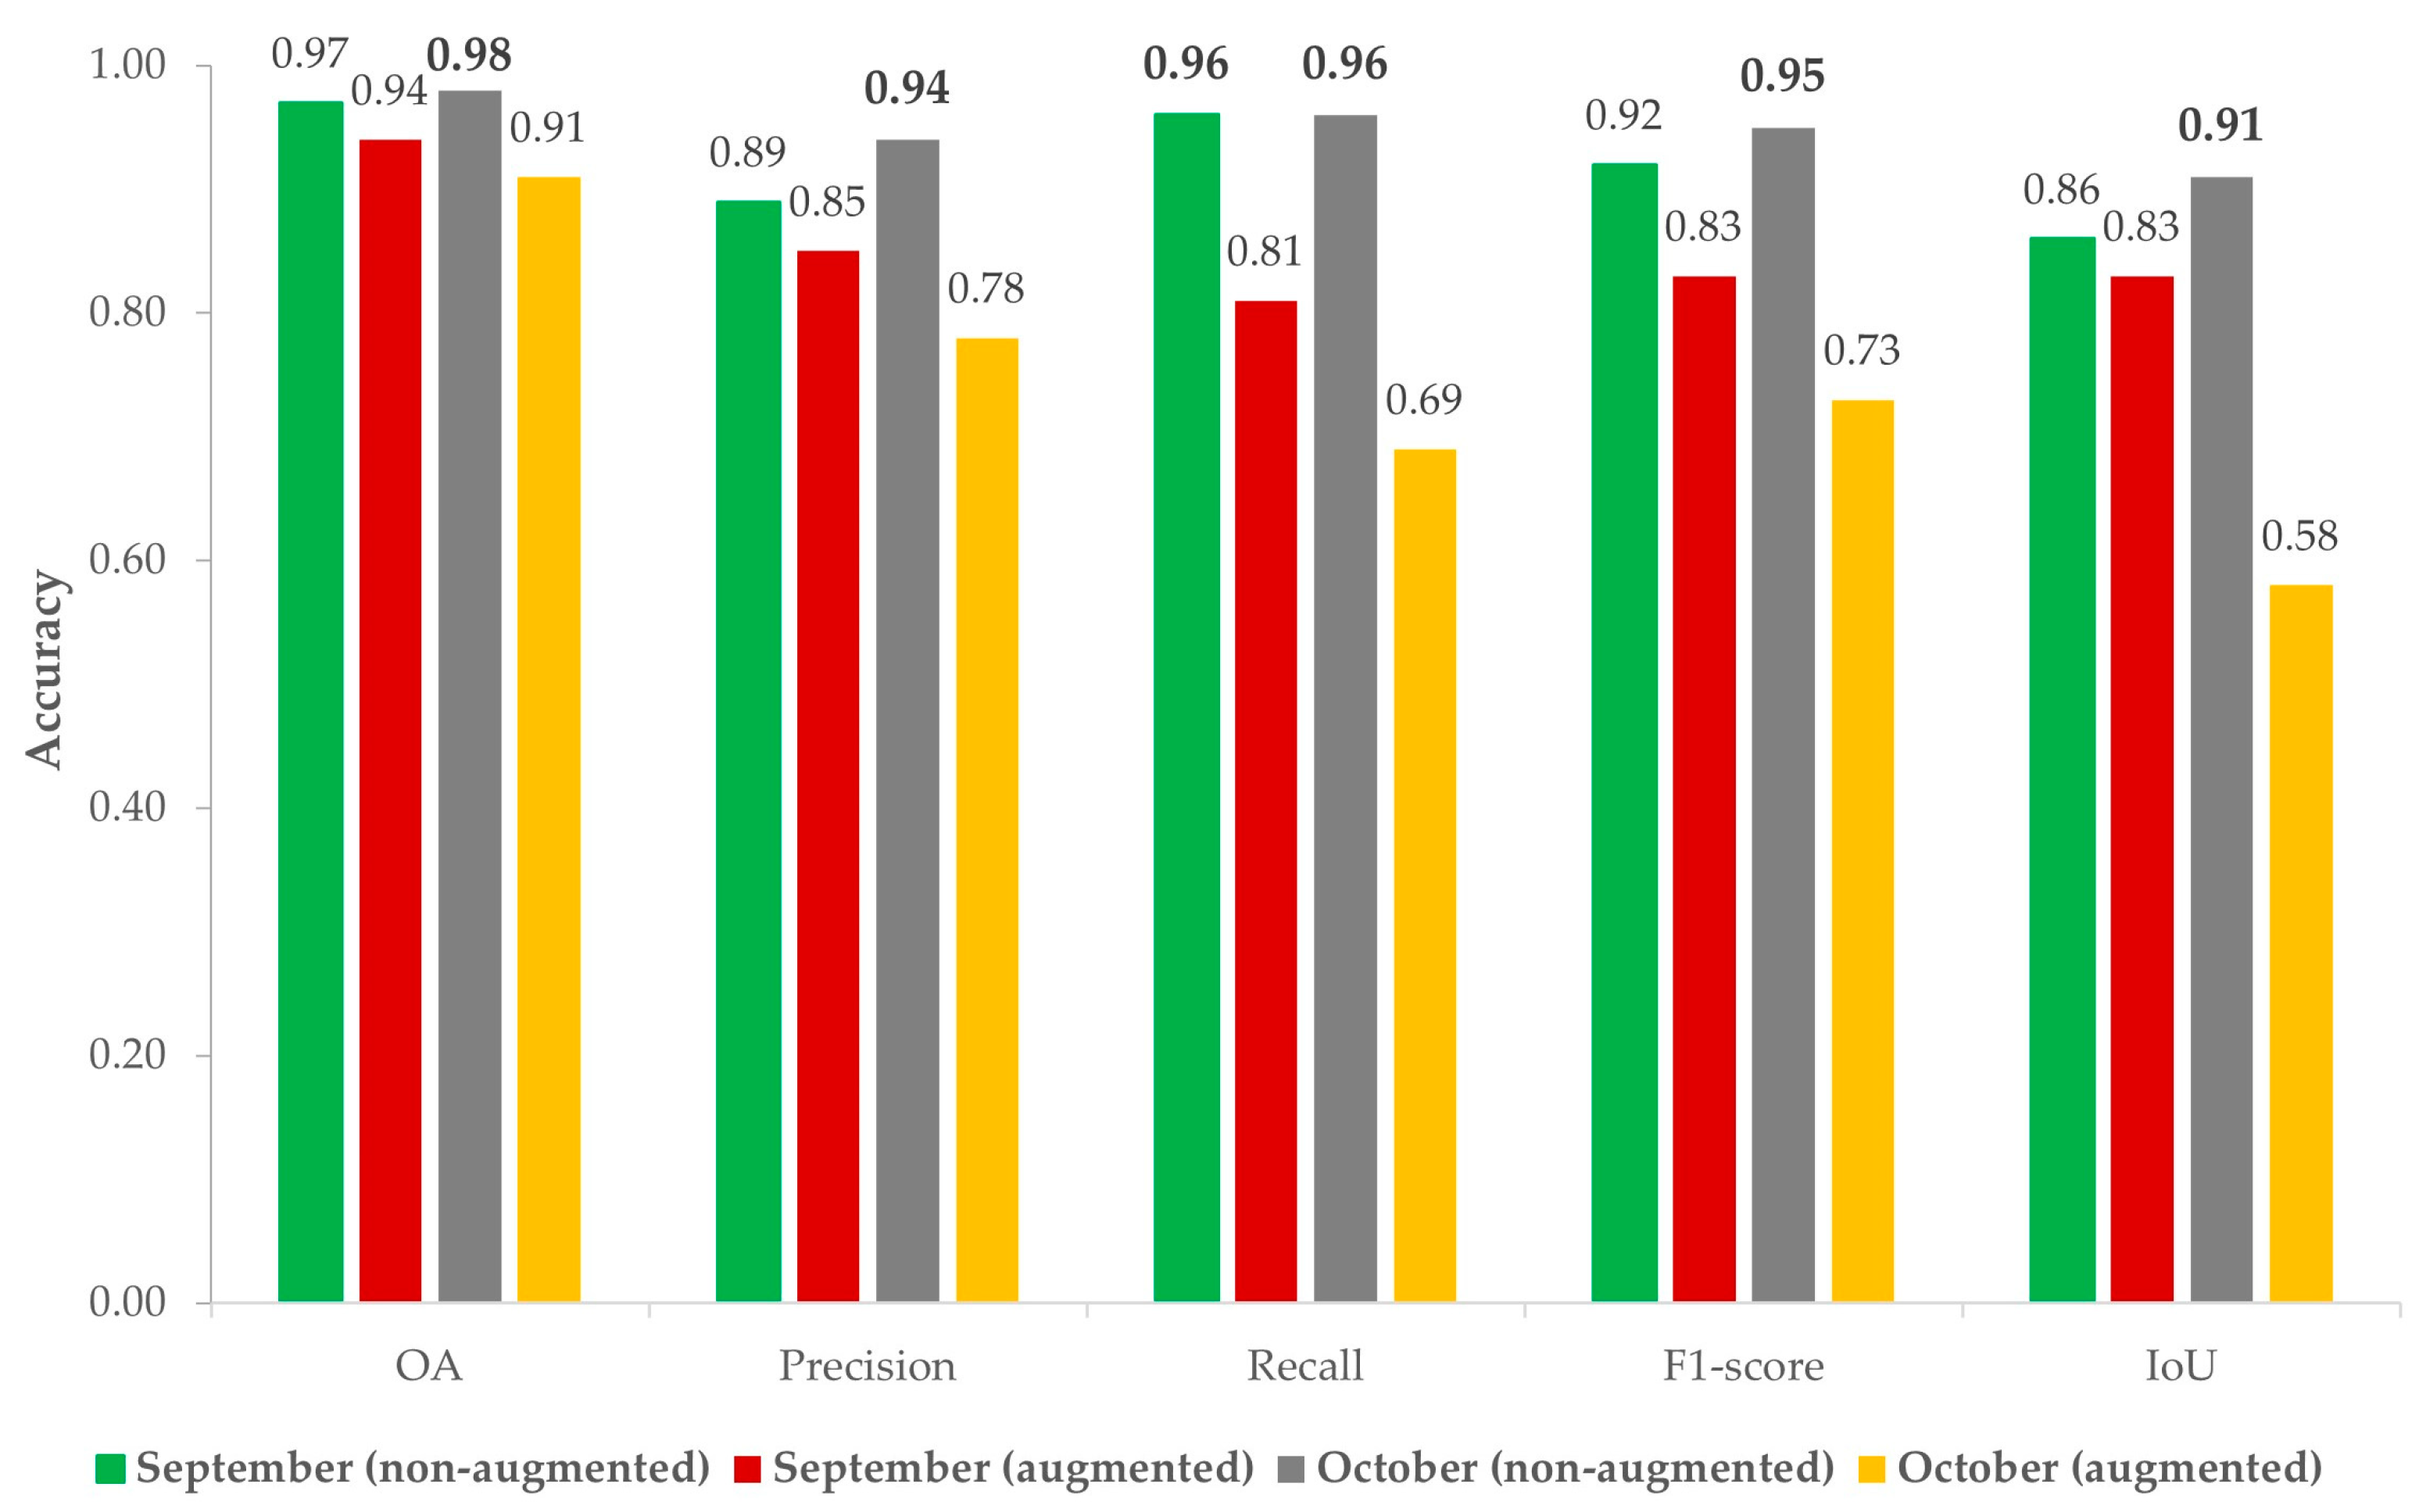
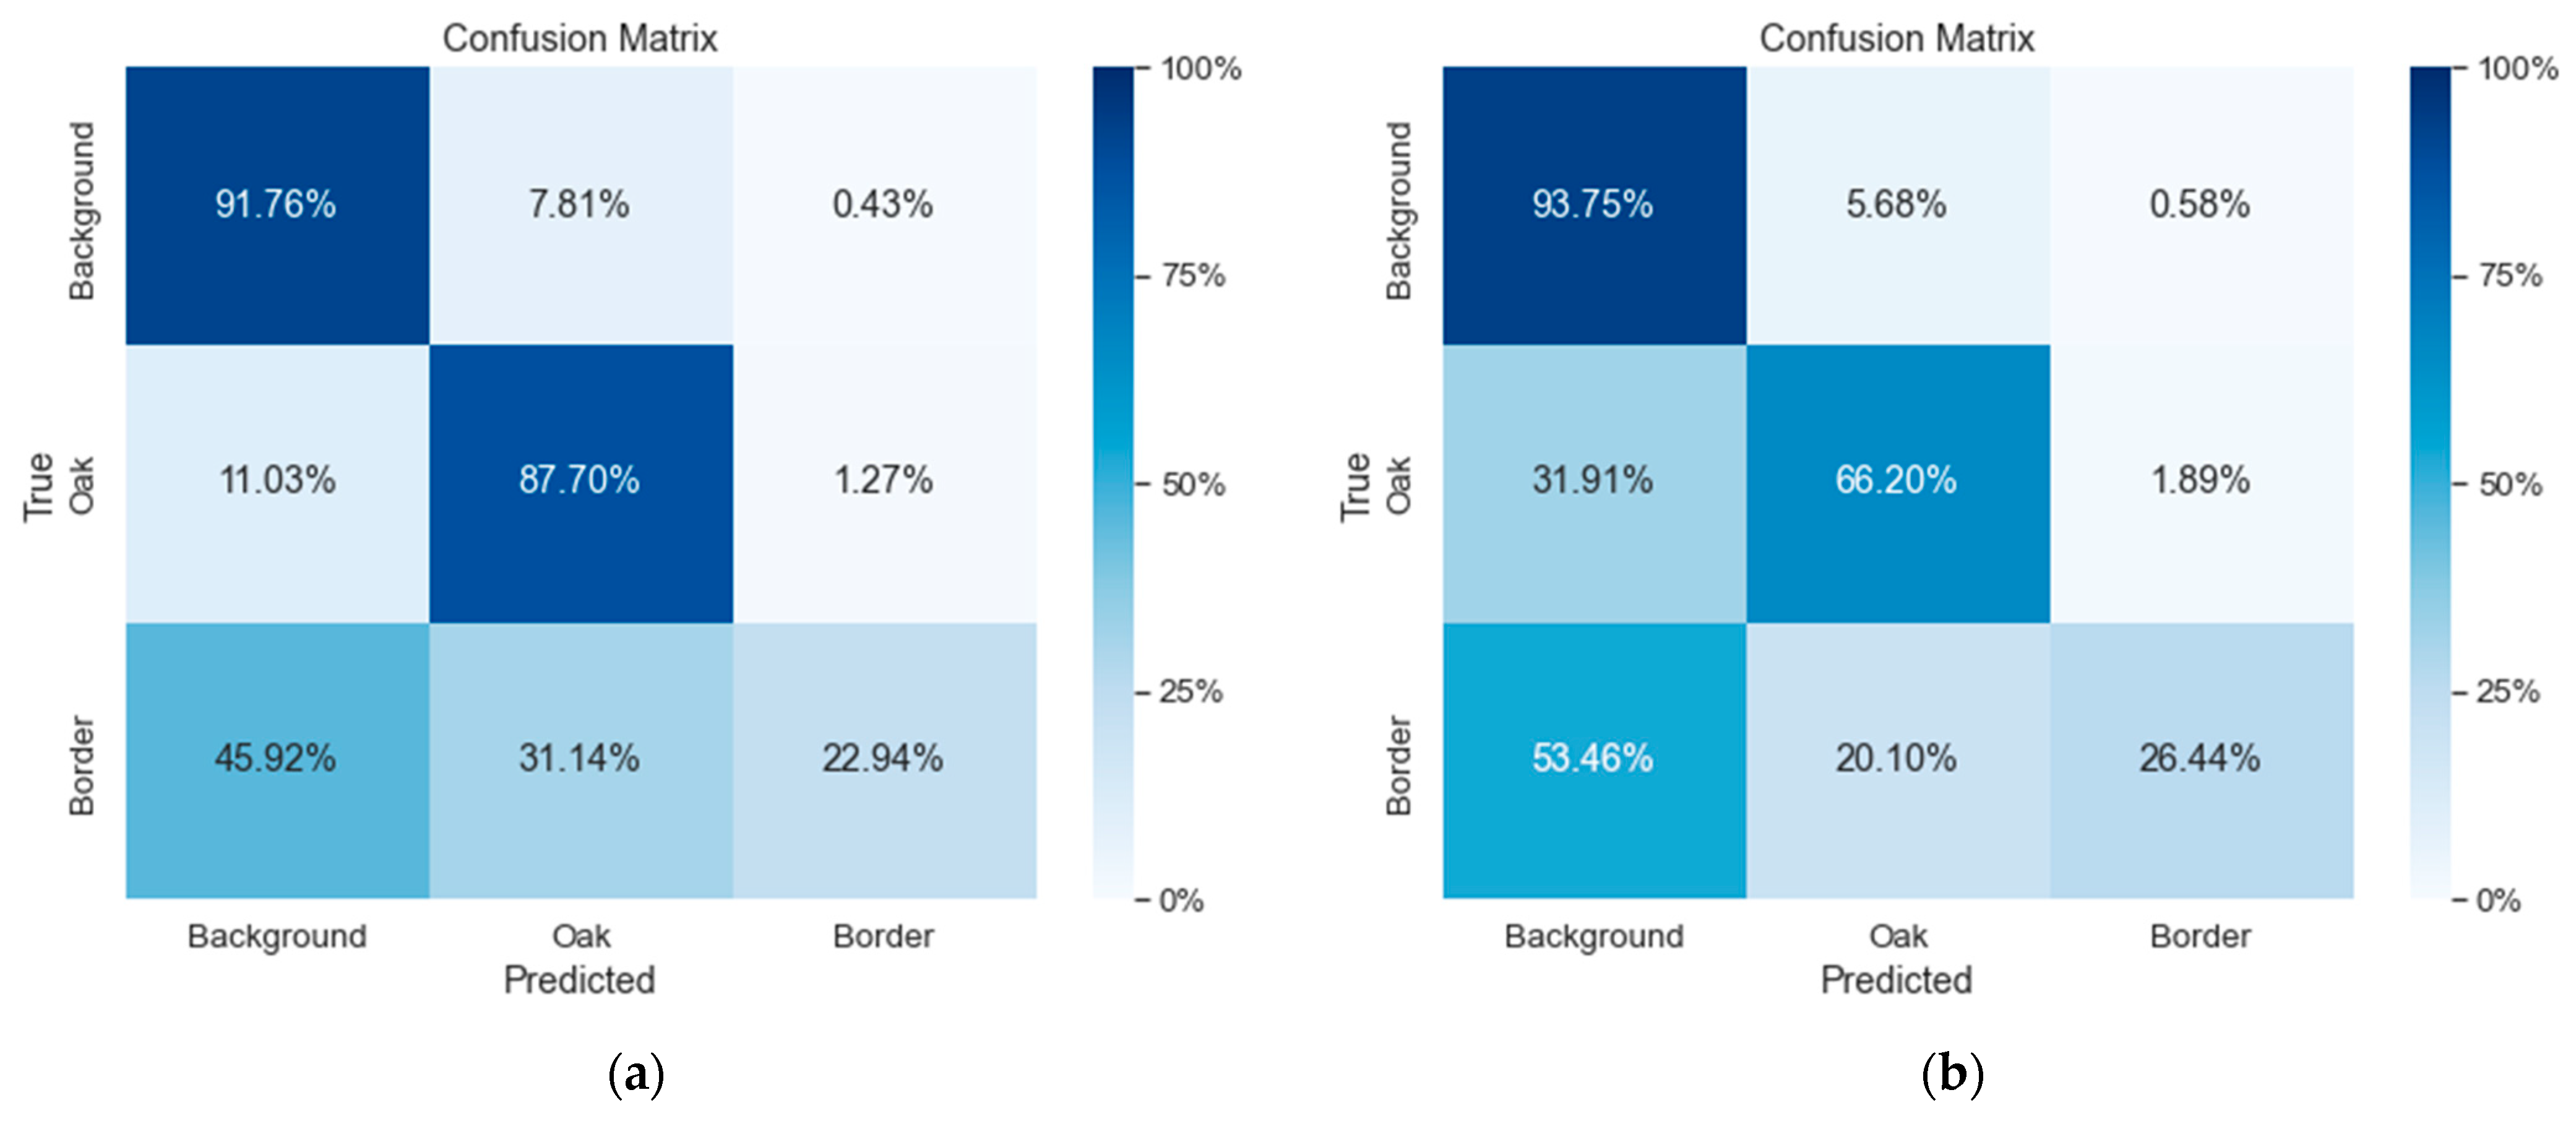
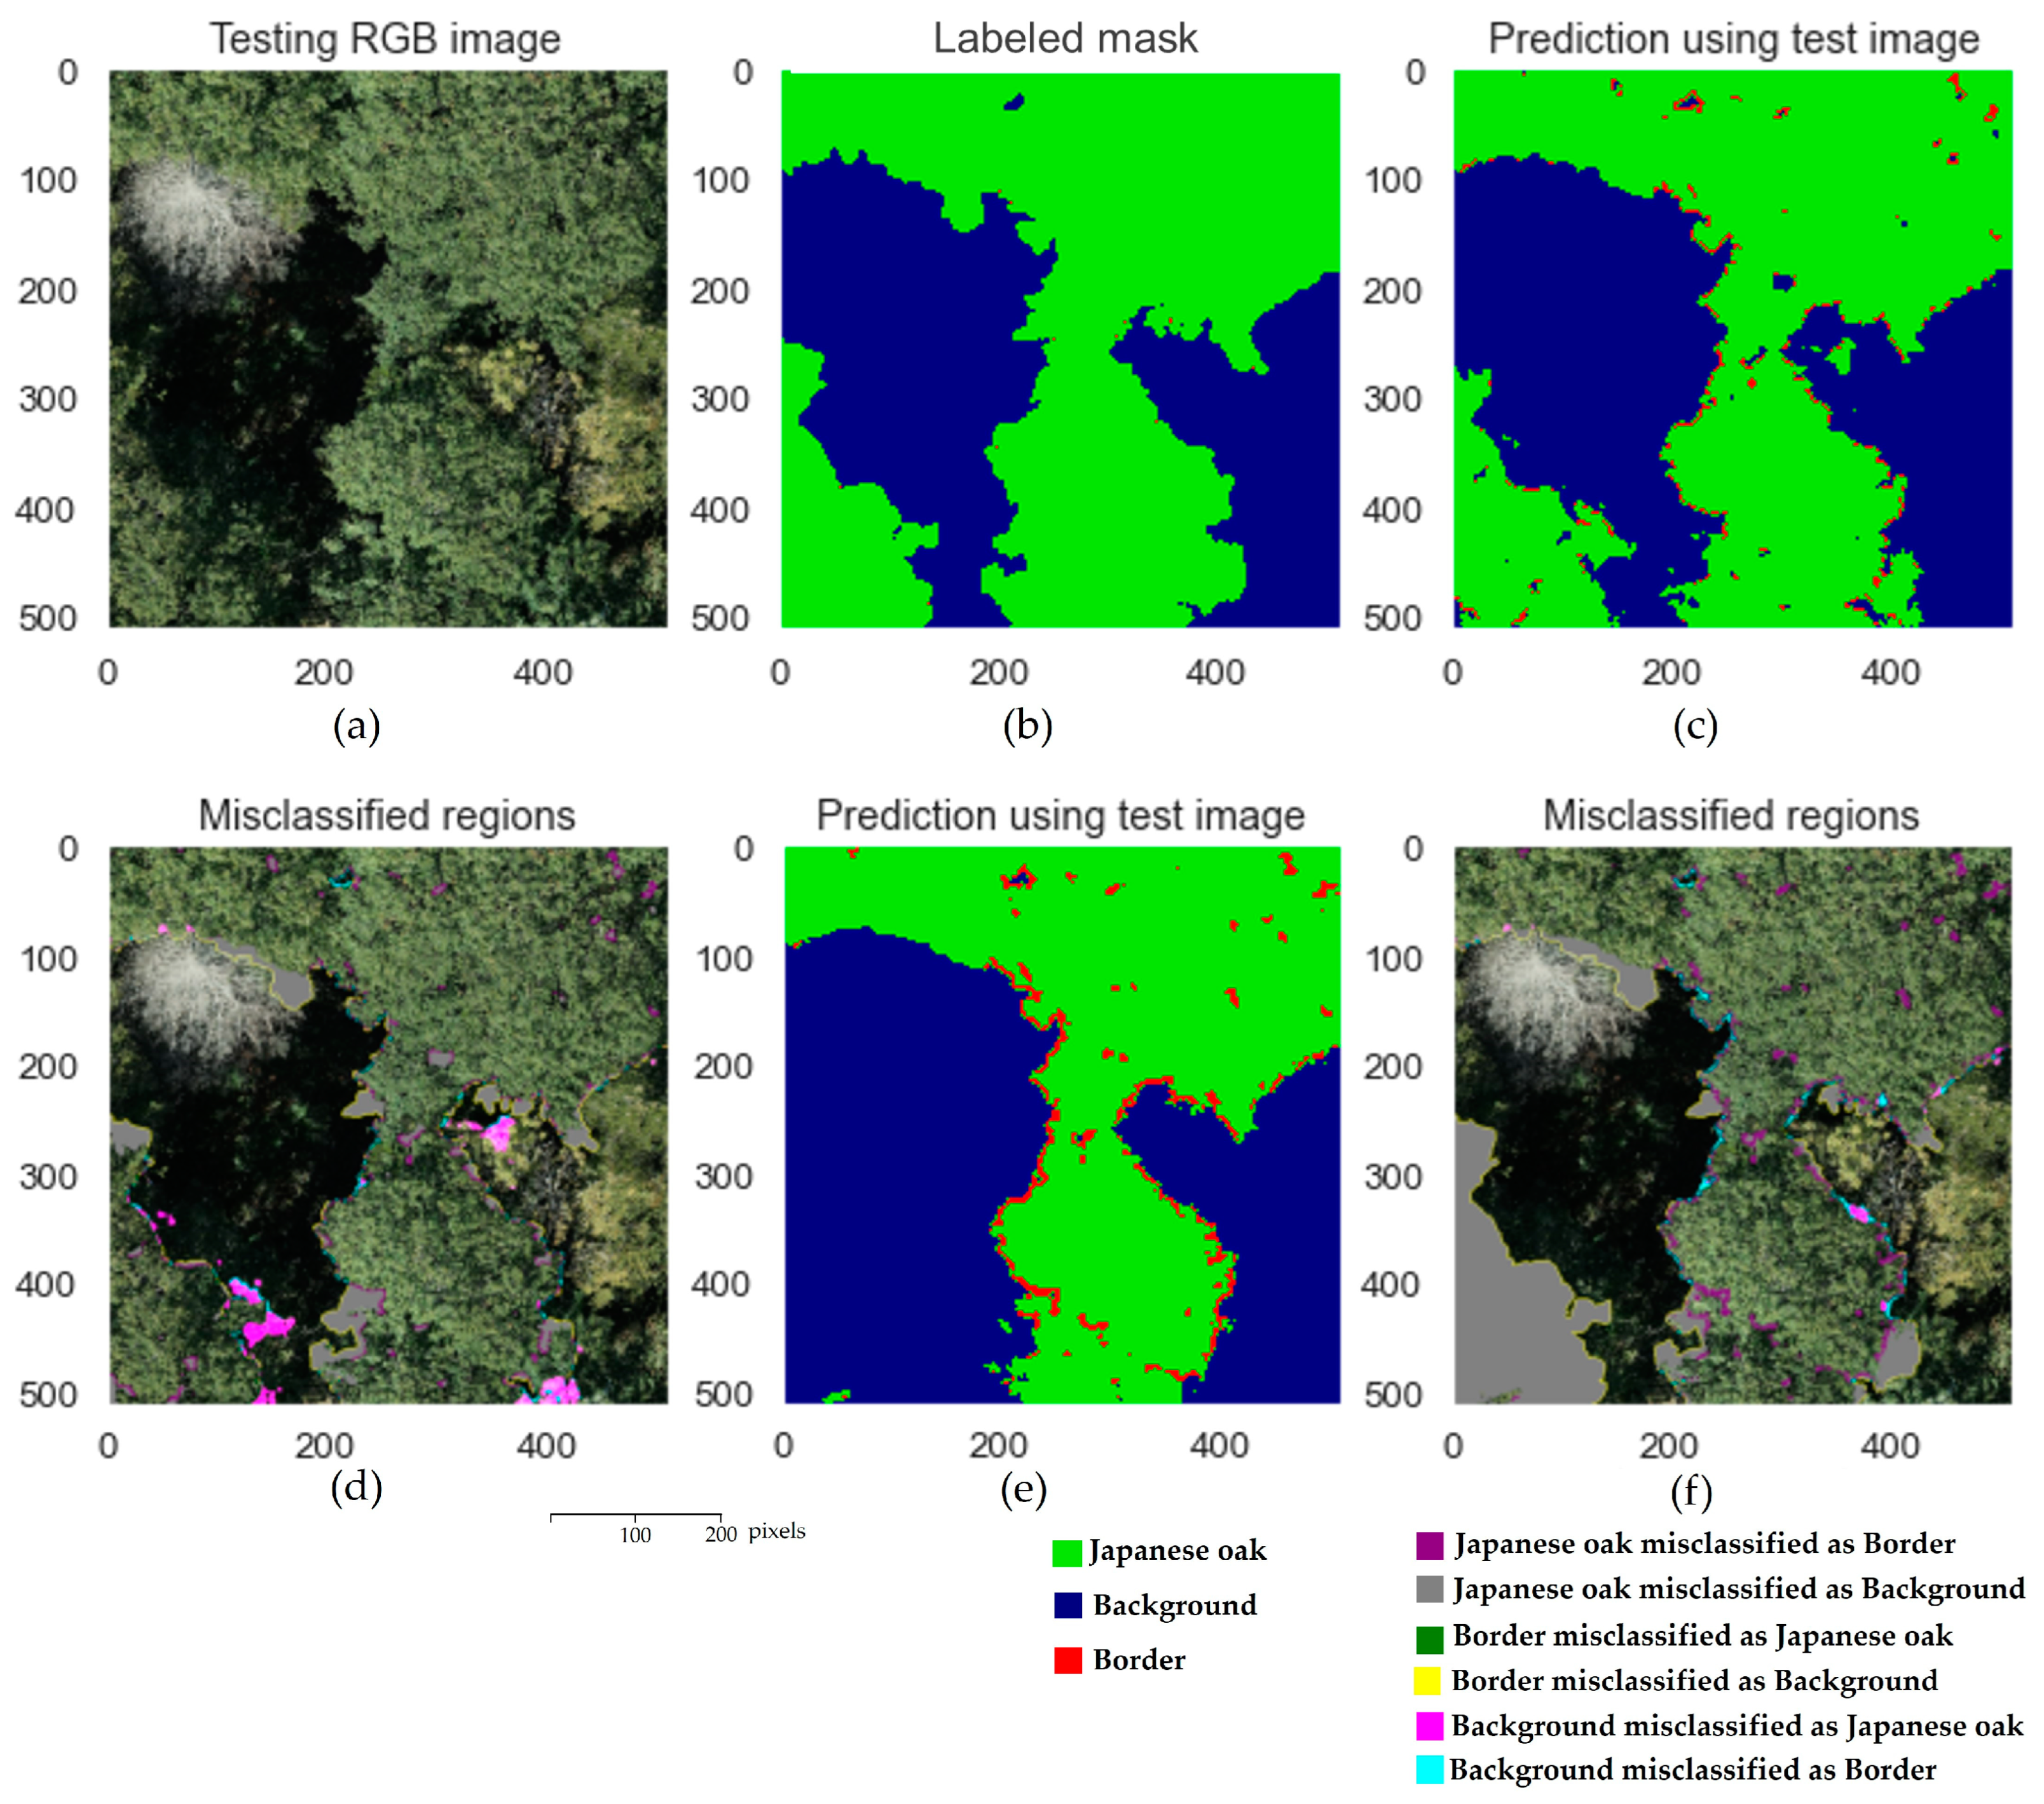
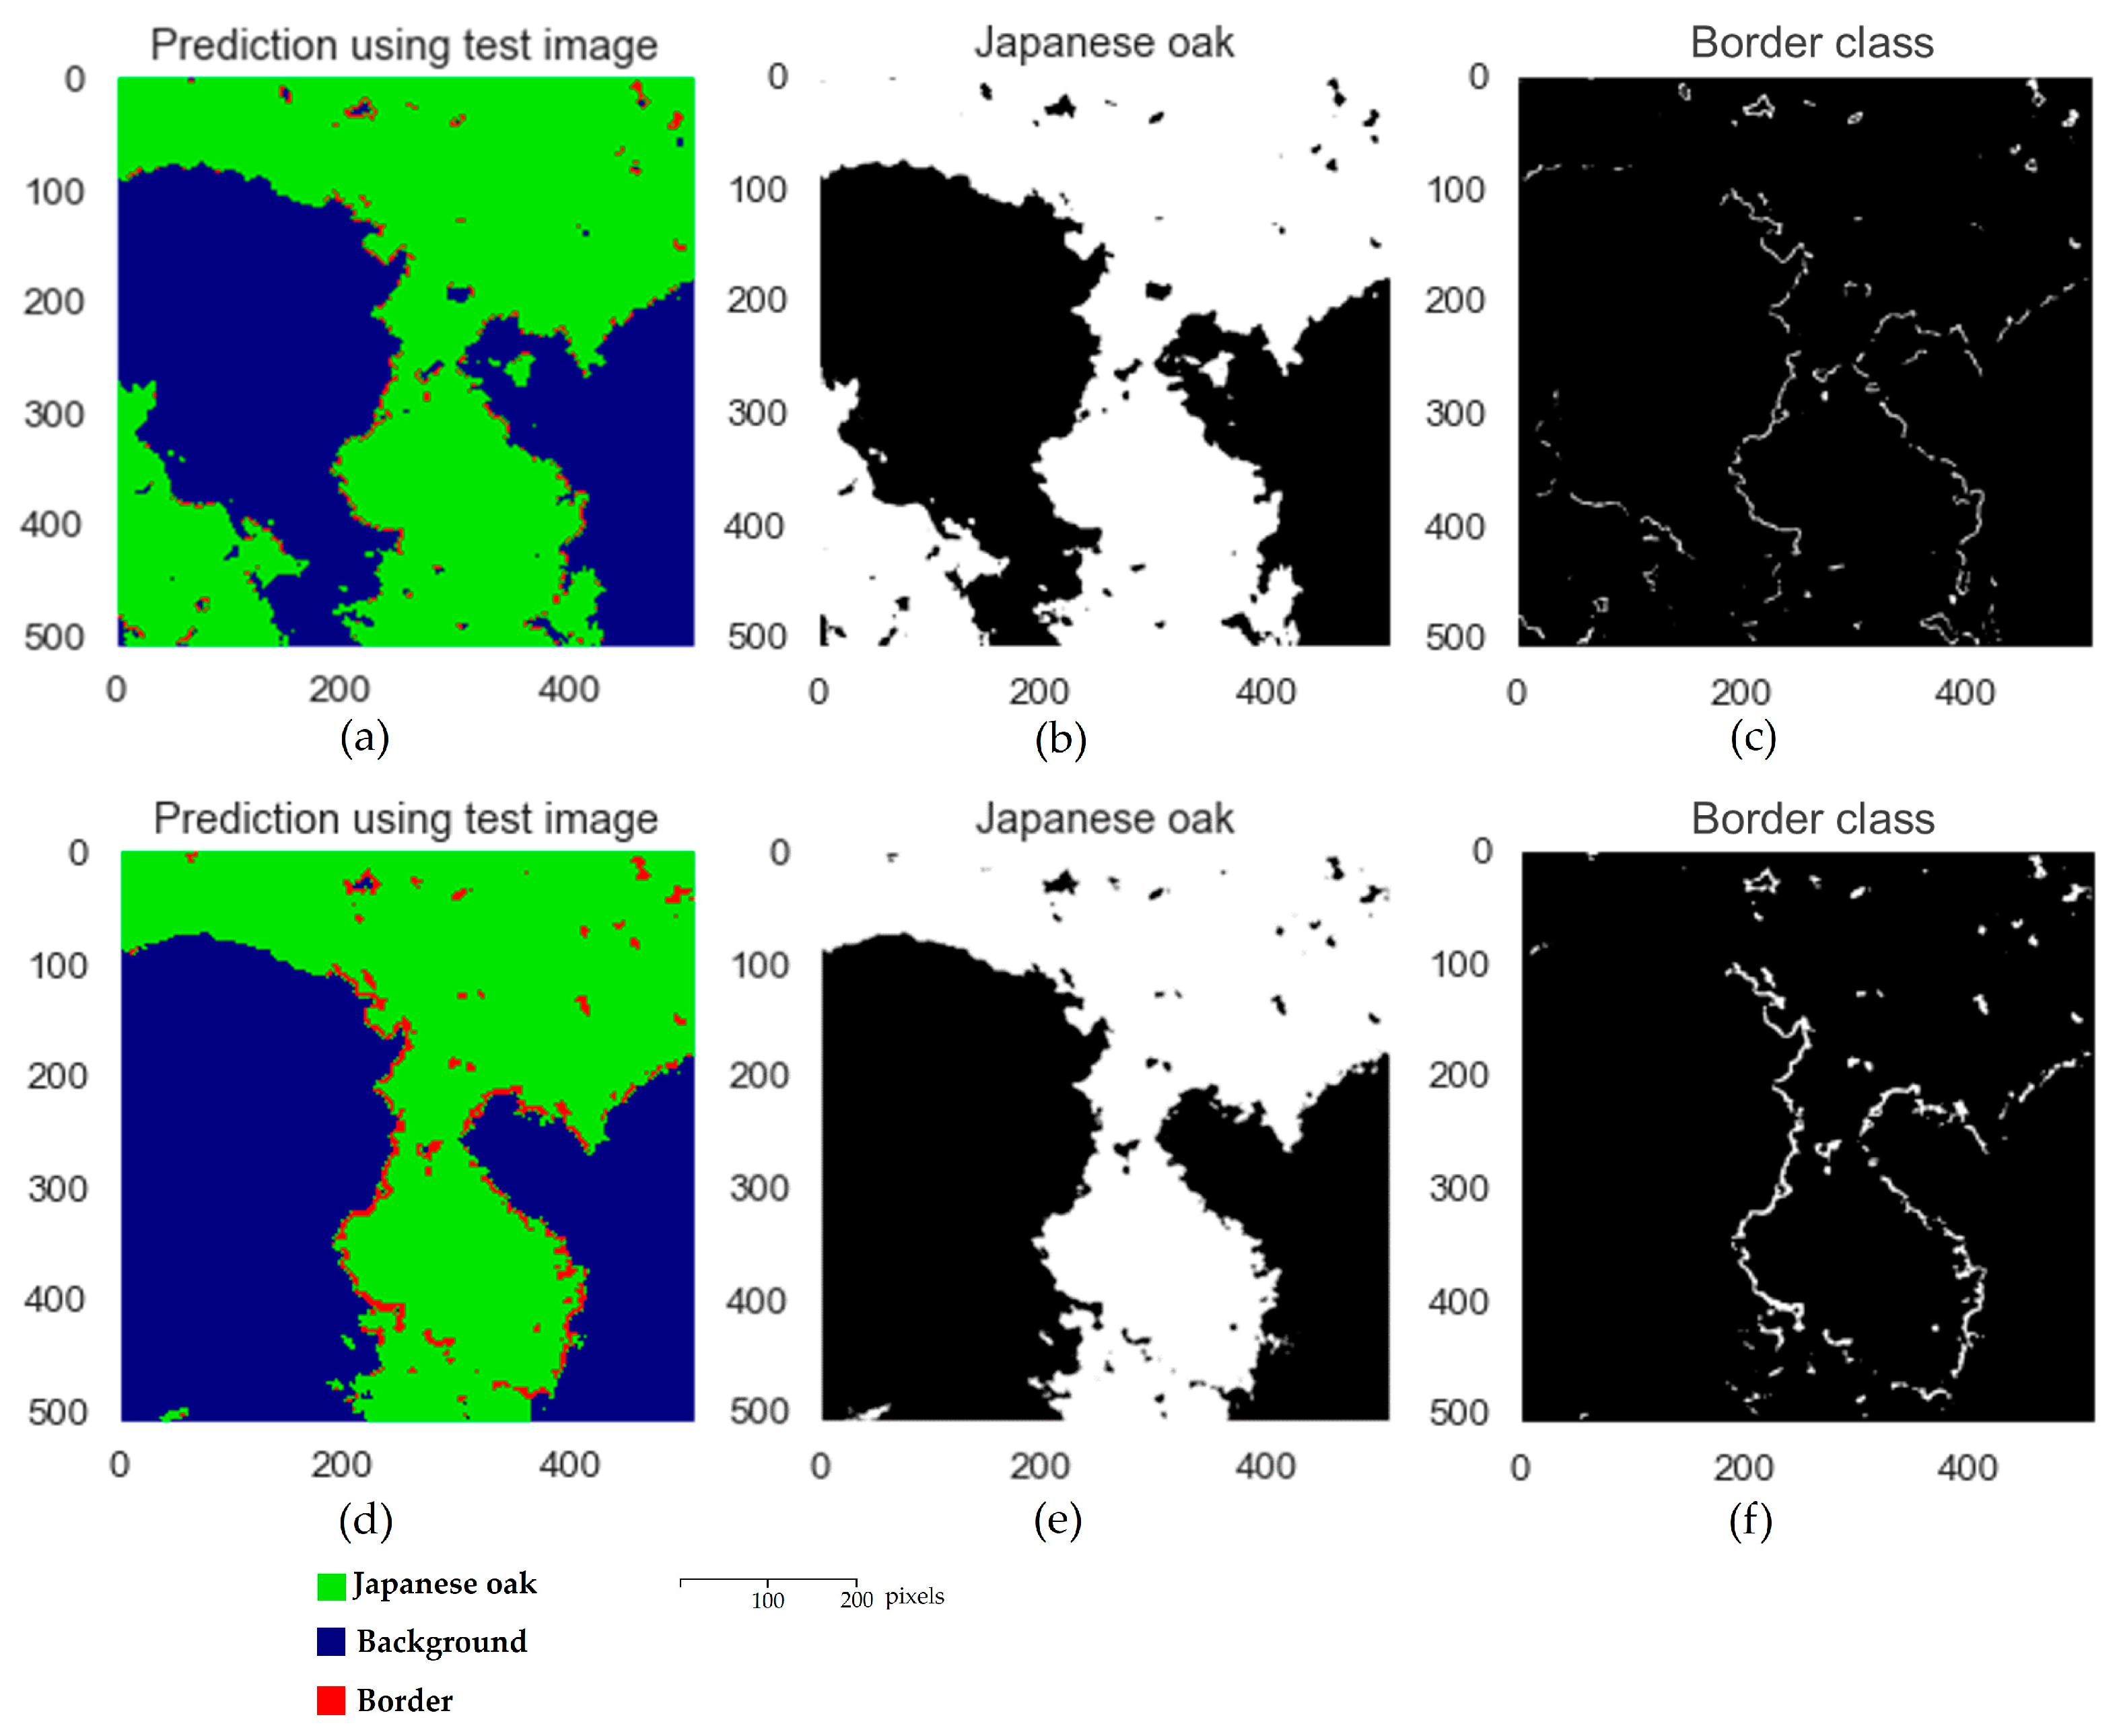
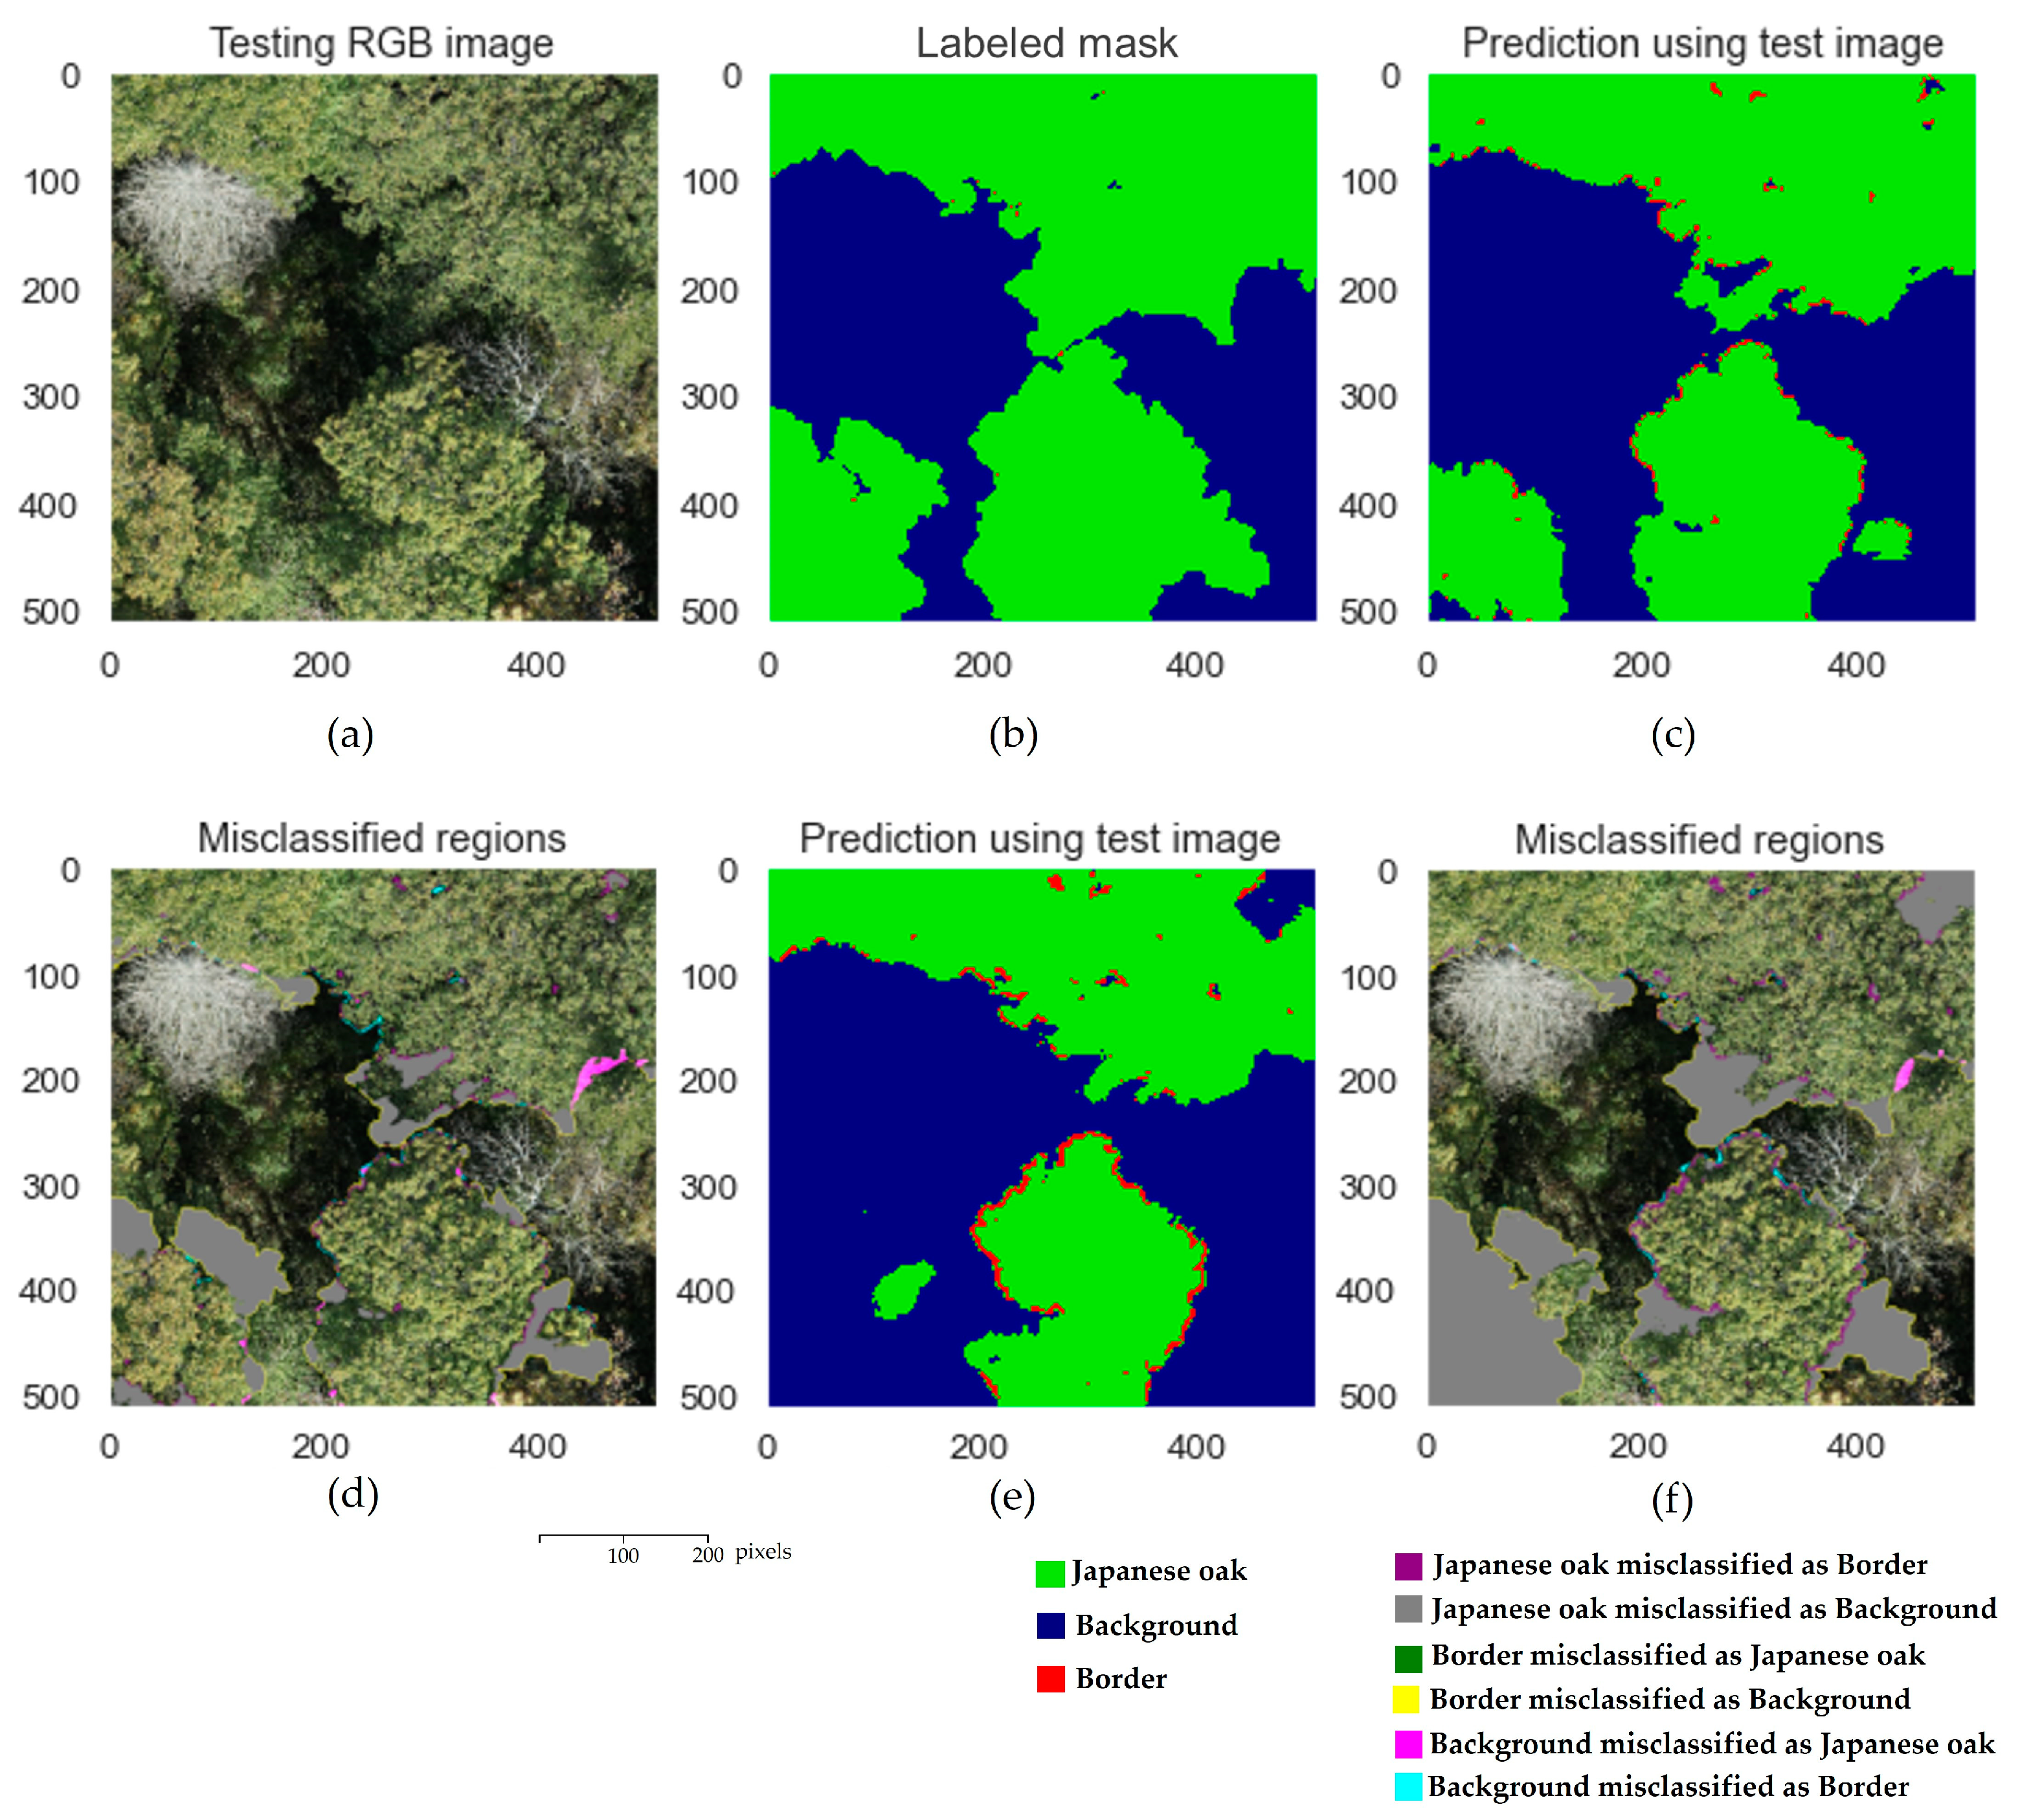
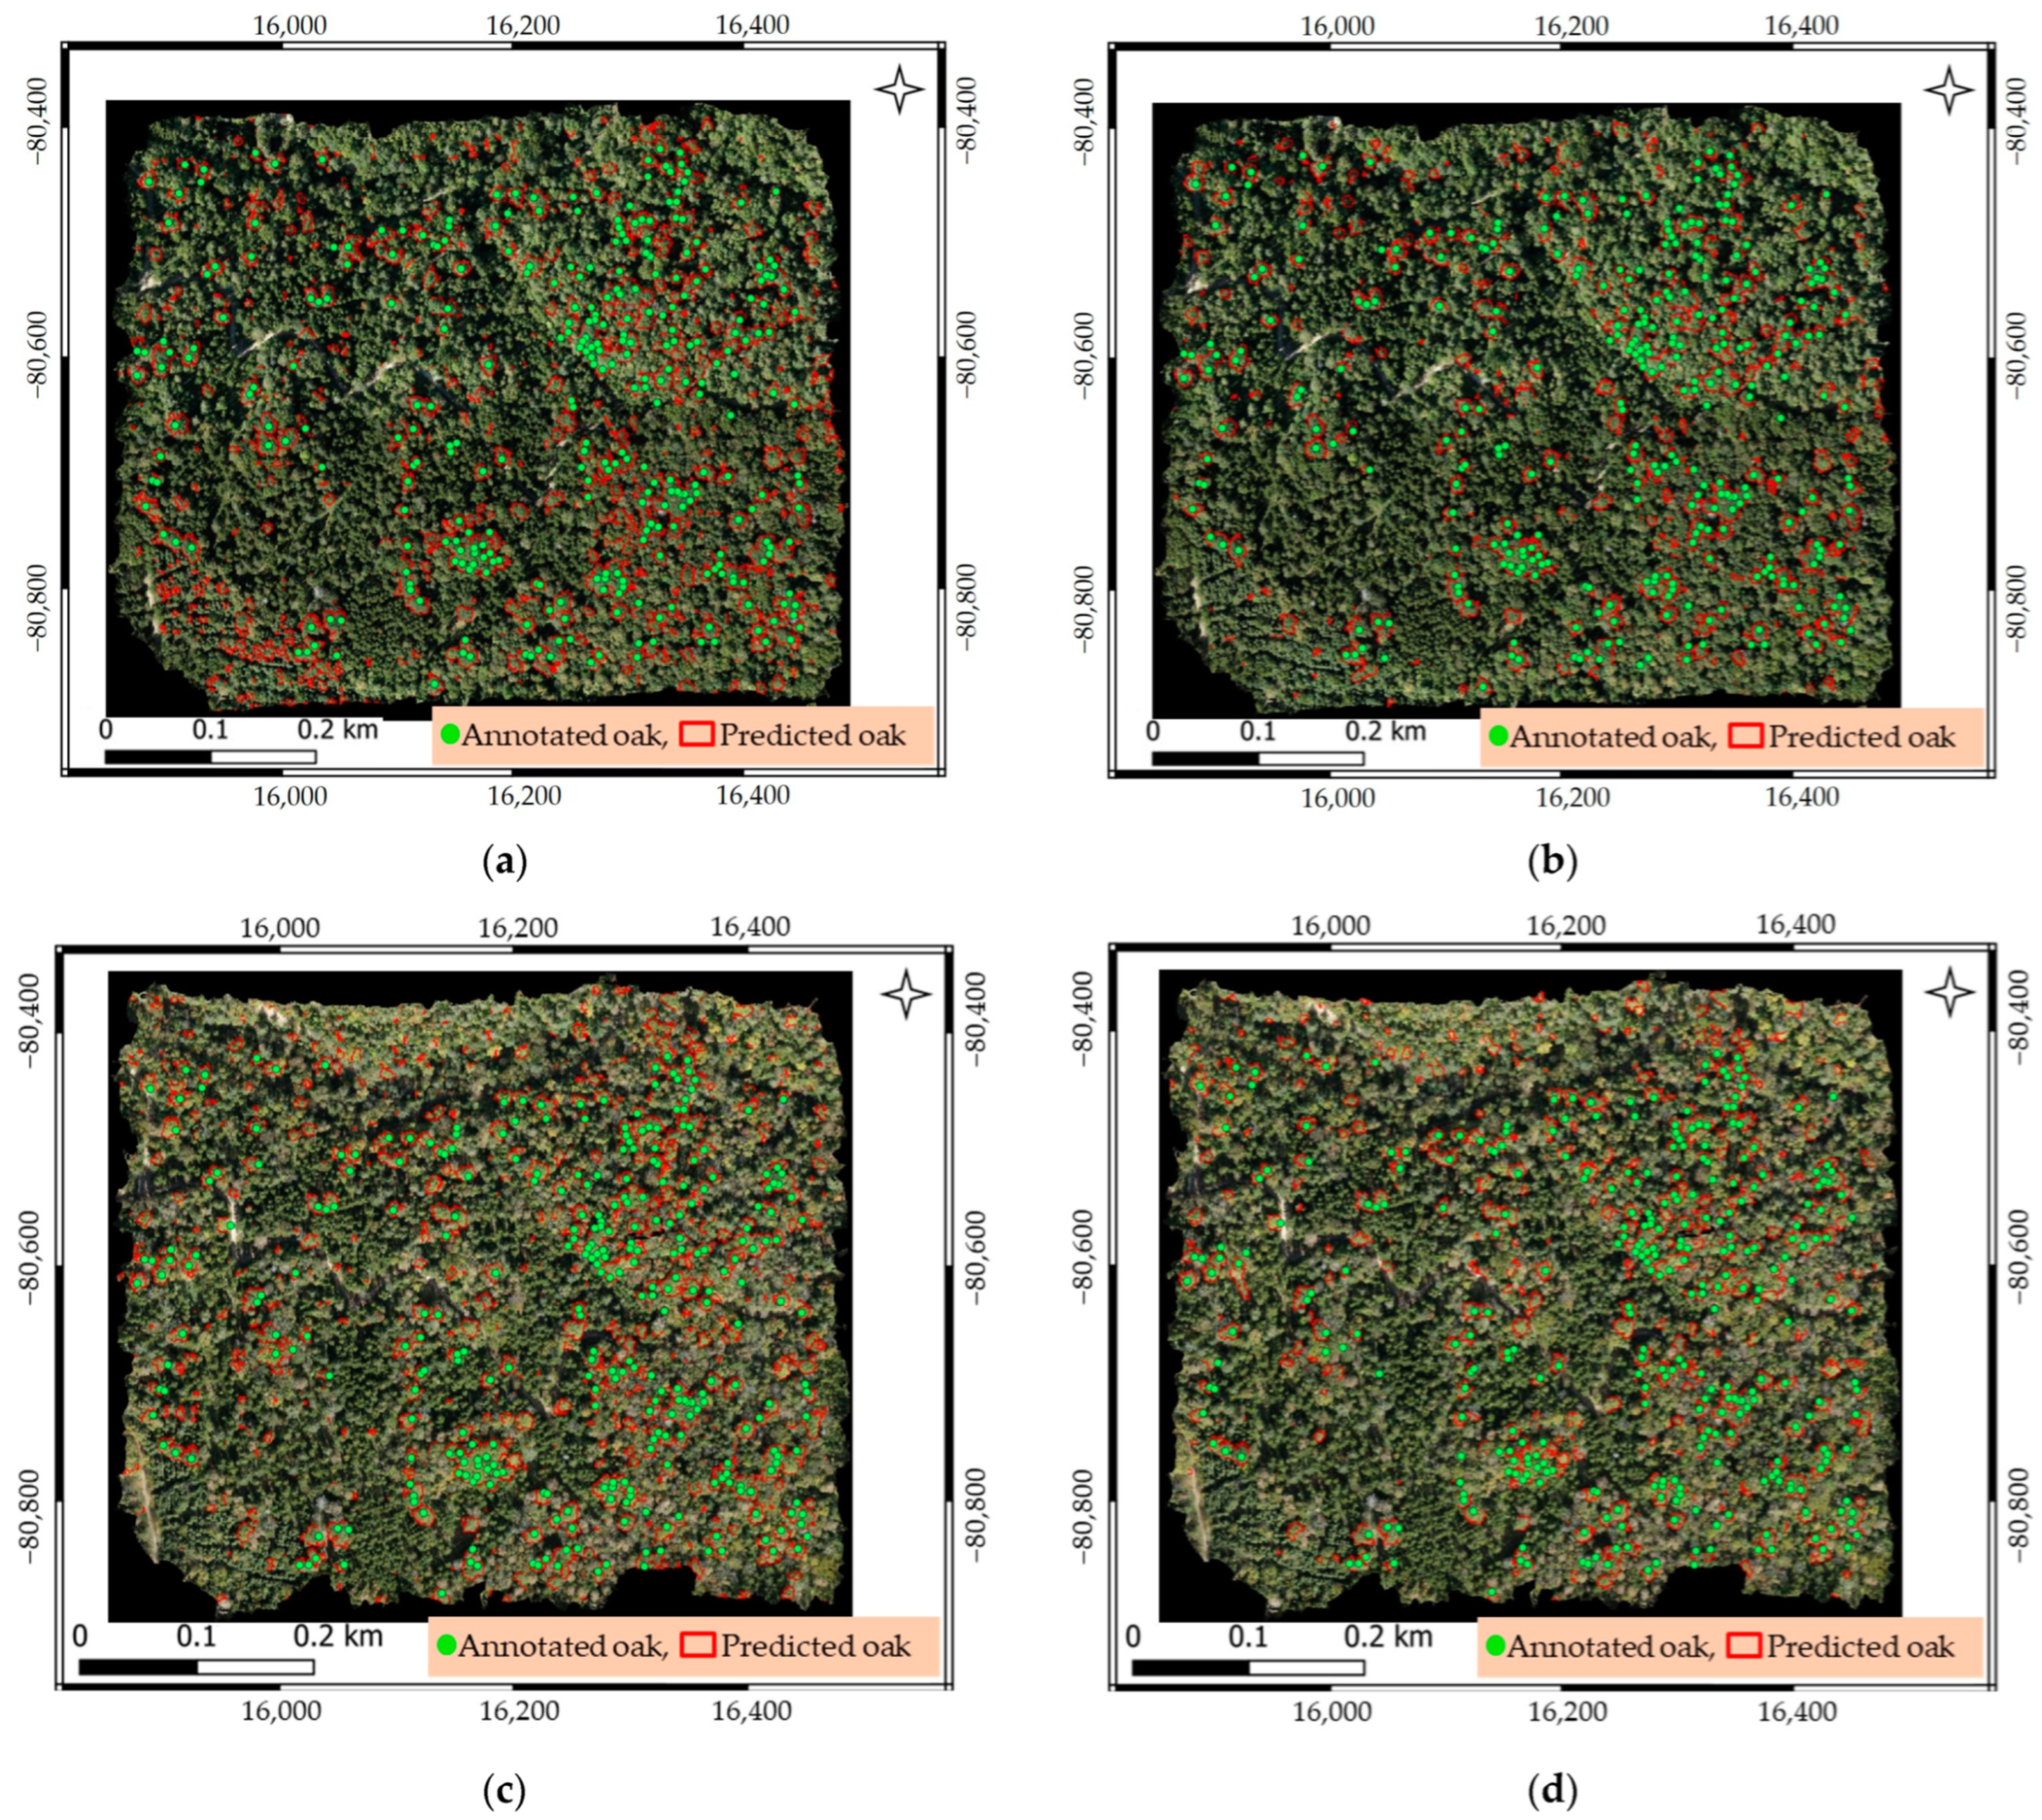
3.3. Performance of the ResU-Net Model with UAV Datasets for Mapping Japanese Oak Crowns Distribution in an Uneven-Aged Mixed Forest

As described in Section 3.1 and Section 3.2, the performance of the ResU-Net model using the four datasets in predicting Japanese oak crowns was consistently high, as evidenced by OA values of 0.87–0.90 and F1 scores of 0.71–0.81, with higher values from the non-augmented UAV datasets. When we performed overlay analyses using the segmentation results on each entire dataset and the annotated ground truth data over the study area, the OA and F1 scores ranged from 0.91 to 0.98 and 0.73 to 0.95, respectively. Specifically, based on all of the evaluation metric scores, the best performance and best segmentation results were obtained with the model using the non-augmented October UAV dataset, followed by the model with the non-augmented September UAV dataset (Table 3 and Figure 14).
Furthermore, according to the confusion matrices (Figure 15), the non-augmented October UAV dataset resulted in the highest rate of Japanese oak detection (95.95%), followed by the non-augmented September UAV dataset (95.70%), the augmented September UAV dataset (81.43%) and the augmented October UAV dataset (68.94%). Consistent with this finding, the misclassification rates of Japanese oak as border and background as Japanese oak were lowest with the model using the non-augmented October UAV dataset (0.99% and 1.06%). However, the misclassification rate of Japanese oak as background (3.06%) was slightly higher than that of the non-augmented September UAV dataset (2.57%), although it was lower than the rates obtained with the augmented September and October UAV datasets. Moreover, the incorrect prediction of the border as Japanese oak was highest (30.13%) using the non-augmented October UAV dataset. A comparison of the augmented September and October UAV datasets showed the better performance of the former in predicting Japanese oak, as seen in Table 3, Figure 14 and confusion matrices (Figure 15b,d).
Figure 16 shows the predictions of Japanese oak over the entire study area using the trained ResU-Net model and each of the UAV datasets. It was observed that the misclassification of other broadleaf trees (i.e., background) as Japanese oaks was lower with the non-augmented October UAV datasets than with the non-augmented September UAV datasets. However, the latter was better at detecting Japanese oak crowns whereas the non-augmented October UAV datasets sometimes failed, especially at the edges of the crowns. Meanwhile, the models with both augmented September and October UAV datasets often failed to detect Japanese oak crowns.

4. Discussion

4.1. Performance of the ResU-Net Model for Individual Tree Crown Segmentation

Overall, the ResU-Net model together with UAV datasets was able to recognize the crowns of Japanese oak in an uneven-aged mixed forest with reliable accuracy in terms of OA values (0.87 to 0.90) and F1 scores (0.71 to 0.81), as summarized in Table 1 and Table 2. Particularly, the model could be trained successfully with a small training dataset. This is probably due to the backbone ResNet101, the weight of which was initialized on the ImageNet dataset, because the previous researchers have already discussed the applicability of pre-trained models to deal with insufficient training datasets in the case of applying the deep learning models [27,41,42,43].
The F1 scores of the ResU-Net model using the non-augmented and augmented October UAV datasets (0.80 and 0.76) as well as the non-augmented September UAV dataset (0.81) were higher than the F1 score (0.75) obtained in the previous study [44] for the canopy detection of a deciduous tree species (Fagus sylvatica) in structurally heterogeneous forests using aerial RGB imagery and Faster R-CNN. Moreover, our study provided higher performance in terms of OA when compared to Moe et al. (2020) [45] (OA = 0.63 and 0.73), which classified five categories of the tree canopy including Japanese oak in uneven-aged mixed forests using object-based random forest classification algorithm and digital aerial photogrammetry derived from UAV imagery.
Our ResU-Net model also performed better than the model described in the past study [22] that investigated different ResU-Net model structures. Their overall classification accuracy was 87% for tree species classified using airborne high-resolution images. However, the performance of our model using the UAV datasets did not match that of a Mask R-CNN model employed, in combination with aerial images [42], to map the distribution of dominant tree species, including Mongolian oak, in an uneven-aged mixed forest. In that study, F1 scores ranged from 0.20 to 0.94 for six tree species and the F1 score for Mongolian oak was 0.91. The difference compared to our study may be due to the larger number of reference trees in the training dataset, as their total number of reference trees was 958, while ours was only 319. In future research, the performance of the model should be improved by using larger sample datasets.

4.2. Impact of Data Augmentation on the Classification Results

Regarding data augmentation, the former authors have discussed that this technique was able to increase the accuracy of the classification results for tree species classification [5,42,46]. By contrast, in our study, the augmented September and October UAV datasets either did not improve or decreased the accuracy of Japanese oak crown detection, as evaluated in terms of OA, recall, F1-score, and IoU values (Table 1 and Table 2). However, our study was consistent with the previous study [44], which discussed that data augmentation was not conclusively applicable for single-species CNN models and it was more effective for multi-species segmentation models. Thus, further studies should consider using other model improvement techniques such as hyperparameter tuning and feature engineering (i.e., by adding other information like texture and height information) in addition to data augmentation for single tree detection.

4.3. Importance of Preparing a Representative Validation Dataset for the Diversity of the Entire Dataset

In the present study, the F1 scores of both the non-augmented September and October UAV validation datasets were not very different in detecting Japanese oak crowns, with the values of 0.81 and 0.80. In the overlay analysis using the segmented images and all ground truth masks, as described in Section 3.3, however, higher F1 scores of 0.92 and 0.95 were obtained, with the superior score that of the model using the non-augmented October UAV dataset. This difference probably reflected the nature of the validation datasets, which may not have fully represented the diversity of the entire datasets. For example, in the case of the October UAV dataset, there were a few trees whose leaf color had not completely changed, but some of these trees were included when the validation dataset was created. Thus, it is likely that the model misidentified these areas of Japanese oak as other deciduous trees. This demonstrates the importance of carefully preparing the validation dataset to ensure that it represents the entire dataset.

4.4. Response of the ResU-Net Model to Two Different Seasonal UAV Datasets for Japanese Oak Crown Detection

In this study, the performance of the ResU-Net model with both the non-augmented September and October datasets was good, with reliable OA values of 0.90 and F1 scores > 0.80 obtained from validation datasets. Of note, the model appears to be sensitive to different features. For example, in the September UAV dataset, taken before leaf color change, the model likely focused on structural features such as crown shape, texture, and other spatial features because the color profile of Japanese oak was almost the same as that of other broadleaf species prior to leaf color change. Therefore, the similar structural characteristics of Japanese oak and other broadleaf species sometimes resulted in misclassification. Meanwhile, the model using the October UAV images, taken after the leaf color change, likely prioritized the color features. As a result, the model incorrectly predicted some Japanese oaks, whose crown color profile is similar to that of other deciduous trees, as others. Similarly, the October dataset sometimes incorrectly identified the edges of the crowns because the color of these crowns had not completely changed.
According to the accuracy scores obtained from the overlay analyses using all the segmentation results and the annotated ground truth data (Table 3 and Figure 14), the performance of the ResU-Net model was better on the non-augmented October UAV dataset than on the non-augmented September UAV dataset. This finding suggested that the ResU-Net model seems to be better at learning the color characteristics than structural characteristics in the UAV images. The lower accuracy of the September dataset compared to the October dataset can thus be attributed to the similar color of Japanese oak and other broadleaf species before the change in leaf color.
Regarding tree species classification using the multiple seasonal aerial images, previous studies have demonstrated that merging images from multiple seasons improves average tree species classification accuracy [47,48].

4.5. General Discussion of the Misclassifications

Another possible reason for the misclassifications in both the September and October UAV datasets was that the UAV orthophotos were resampled at a lower resolution, as explained in Section 2.2.2. Resampling reduces the spatial information of the images to some extent, which can affect the model’s interpretation of the contexts and spatial relationships critical for accurate classification. In addition, resampling can lead to pixel blending, making it difficult for the model to distinguish between tree species with similar colors or textures. Chen et al. (2023) [49] observed that, following the resampling of UAV imagery, the results of classifying vegetation species and ground objects using different machine learning classifiers decreased as the spatial resolution decreased. Thus, some misclassification of Japanese oak might be improved by using the UAV datasets at the original resolution.

5. Conclusions

Integrated UAV imagery and the ResU-Net model (U-Net model with ResNet101 backbone) were used to describe the distribution of high-value Japanese oak crowns in an uneven-aged mixed forest. The RGB information of two UAV datasets, taken before and after the leaf color change of Japanese oak, was extracted to identify the optimal timing of UAV image collection.
Our results showed that the ResU-Net model could be used together with both UAV datasets to detect Japanese oak in an uneven-aged mixed forest with reliable accuracy. In particular, more robust results were obtained with the UAV dataset taken after the change in leaf color (October UAV dataset). Our case study demonstrated that the ResU-Net model can be applied even with a small training dataset to map the distribution of high-value deciduous broadleaf tree crowns in a complex uneven-aged mixed forest. Data augmentation techniques were, however, not applicable to improve the individual tree segmentation results in the present study. Moreover, we also found that the importance of preparation of the validation datasets representing the full diversity and complexity of the whole sample datasets. These findings can therefore be a valuable contribution to forest management practices.
Nevertheless, to achieve the full capacity of the ResU-Net model in identifying high value Japanese oak and to improve the classification results, preparation of larger training datasets should be considered in the future study. Application of UAV orthophotos at their original resolution rather than after resampling to a lower coarse resolution can improve the performance of the model. Furthermore, we will investigate the robustness of the ResU-Net model by comparing it with other deep learning models commonly used for the mapping of individual tree species distribution, such as Mask R-CNN. In addition, merging UAV images from multiple seasons will be evaluated, as it is expected to improve the performance of the ResU-Net model in detecting high-value tree species in uneven-aged mixed forests.

Author Contributions

Conceptualization, methodology, formal analysis, and writing—original draft preparation, N.M.H.; resources, supervision, writing—review and editing, and project administration, T.O.; review and editing, S.T. and T.H. All authors have read and agreed to the published version of the manuscript.

Funding

This research work was supported by the collaborative research project entitled “Single-tree management of superior Japanese oak in natural forests and data collection for the development of a method to select Japanese oak trees suitable for barrel wood” between Suntory Spirits Ltd., Kitanihon Lumber Co., Ltd., and the University of Tokyo.

Data Availability Statement

Dataset in the present study will be available on request to the first author’s email with appropriate justification.

Acknowledgments

The authors gratefully acknowledge the technical staff of the University of Tokyo Hokkaido Forest (UTHF); Kenji Fukushi, Mutsuki Hirama, Akio Oshima, Eiichi Nobu, Hisatomi Kasahara, Satoshi Chiino, Yuji Nakagawa, Ayuko Ohkawa and Shinya Inukai, for collecting the UAV imagery and kind support during our field survey in Sub-compartment 68E.

Conflicts of Interest

The authors declare no conflicts of interest.

References

  1. Moe, K.T.; Owari, T. Sustainability of High-Value Timber Species in Mixed Conifer–Broadleaf Forest Managed under Selection System in Northern Japan. Forests 2020, 11, 484. [Google Scholar] [CrossRef]
  2. Owari, T.; Okamura, K.; Fukushi, K.; Kasahara, H.; Tatsumi, S. Single-Tree Management for High-Value Timber Species in a Cool-Temperate Mixed Forest in Northern Japan. Int. J. Biodivers. Sci. Ecosyst. Serv. Manag. 2016, 12, 74–82. [Google Scholar] [CrossRef]
  3. Moe, K.; Owari, T.; Furuya, N.; Hiroshima, T. Comparing Individual Tree Height Information Derived from Field Surveys, LiDAR and UAV-DAP for High-Value Timber Species in Northern Japan. Forests 2020, 11, 223. [Google Scholar] [CrossRef]
  4. Schulze, M.; Grogan, J.; Landis, R.M.; Vidal, E. How Rare Is Too Rare to Harvest? Management Challenges Posed by Timber Species Occurring at Low Densities in the Brazilian Amazon. For. Ecol. Manage 2008, 256, 1443–1457. [Google Scholar] [CrossRef]
  5. Huang, Y.; Wen, X.; Gao, Y.; Zhang, Y.; Lin, G. Tree Species Classification in UAV Remote Sensing Images Based on Super-Resolution Reconstruction and Deep Learning. Remote Sens. 2023, 15, 2942. [Google Scholar] [CrossRef]
  6. Liu, B.; Hao, Y.; Huang, H.; Chen, S.; Li, Z.; Chen, E.; Tian, X.; Ren, M. TSCMDL: Multimodal Deep Learning Framework for Classifying Tree Species Using Fusion of 2-D and 3-D Features. IEEE Trans. Geosci. Remote Sens. 2023, 61, 1–11. [Google Scholar] [CrossRef]
  7. Immitzer, M.; Atzberger, C.; Koukal, T. Tree Species Classification with Random Forest Using Very High Spatial Resolution 8-Band WorldView-2 Satellite Data. Remote Sens. 2012, 4, 2661–2693. [Google Scholar] [CrossRef]
  8. Wessel, M.; Brandmeier, M.; Tiede, D. Evaluation of Different Machine Learning Algorithms for Scalable Classification of Tree Types and Tree Species Based on Sentinel-2 Data. Remote Sens. 2018, 10, 1419. [Google Scholar] [CrossRef]
  9. Korznikov, K.A.; Kislov, D.E.; Altman, J.; Doležal, J.; Vozmishcheva, A.S.; Krestov, P.V. Using U-Net-like Deep Convolutional Neural Networks for Precise Tree Recognition in Very High Resolution Rgb (Red, Green, Blue) Satellite Images. Forests 2021, 12, 66. [Google Scholar] [CrossRef]
  10. Safonova, A.; Hamad, Y.; Dmitriev, E.; Georgiev, G.; Trenkin, V.; Georgieva, M.; Dimitrov, S.; Iliev, M. Individual Tree Crown Delineation for the Species Classification and Assessment of Vital Status of Forest Stands from UAV Images. Drones 2021, 5, 77. [Google Scholar] [CrossRef]
  11. Abdollahnejad, A.; Panagiotidis, D. Tree Species Classification and Health Status Assessment for a Mixed Broadleaf-Conifer Forest with Uas Multispectral Imaging. Remote Sens. 2020, 12, 3722. [Google Scholar] [CrossRef]
  12. Mäyrä, J.; Keski-Saari, S.; Kivinen, S.; Tanhuanpää, T.; Hurskainen, P.; Kullberg, P.; Poikolainen, L.; Viinikka, A.; Tuominen, S.; Kumpula, T.; et al. Tree Species Classification from Airborne Hyperspectral and LiDAR Data Using 3D Convolutional Neural Networks. Remote Sens. Environ. 2021, 256, 112322. [Google Scholar] [CrossRef]
  13. Chen, C.; Jing, L.; Li, H.; Tang, Y. A New Individual Tree Species Classification Method Based on the Resu-Net Model. Forests 2021, 12, 1202. [Google Scholar] [CrossRef]
  14. Chen, X.; Shen, X.; Cao, L. Tree Species Classification in Subtropical Natural Forests Using High-Resolution UAV RGB and SuperView-1 Multispectral Imageries Based on Deep Learning Network Approaches: A Case Study within the Baima Snow Mountain National Nature Reserve, China. Remote Sens. 2023, 15, 2697. [Google Scholar] [CrossRef]
  15. Kattenborn, T.; Leitloff, J.; Schiefer, F.; Hinz, S. Review on Convolutional Neural Networks (CNN) in Vegetation Remote Sensing. ISPRS J. Photogramm. Remote Sens. 2021, 173, 24–49. [Google Scholar] [CrossRef]
  16. Pei, H.; Owari, T.; Tsuyuki, S.; Zhong, Y. Application of a Novel Multiscale Global Graph Convolutional Neural Network to Improve the Accuracy of Forest Type Classification Using Aerial Photographs. Remote Sens. 2023, 15, 1001. [Google Scholar] [CrossRef]
  17. Tran, D.Q.; Park, M.; Jung, D.; Park, S. Damage-Map Estimation Using Uav Images and Deep Learning Algorithms for Disaster Management System. Remote Sens. 2020, 12, 4169. [Google Scholar] [CrossRef]
  18. Pyo, J.C.; Han, K.J.; Cho, Y.; Kim, D.; Jin, D. Generalization of U-Net Semantic Segmentation for Forest Change Detection in South Korea Using Airborne Imagery. Forests 2022, 13, 2170. [Google Scholar] [CrossRef]
  19. Zhang, P.; Ban, Y.; Nascetti, A. Learning U-Net without Forgetting for near Real-Time Wildfire Monitoring by the Fusion of SAR and Optical Time Series. Remote Sens. Environ. 2021, 261, 112467. [Google Scholar] [CrossRef]
  20. Wagner, F.H.; Sanchez, A.; Tarabalka, Y.; Lotte, R.G.; Ferreira, M.P.; Aidar, M.P.M.; Gloor, E.; Phillips, O.L.; Aragão, L.E.O.C. Using the U-Net Convolutional Network to Map Forest Types and Disturbance in the Atlantic Rainforest with Very High Resolution Images. Remote Sens. Ecol. Conserv. 2019, 5, 360–375. [Google Scholar] [CrossRef]
  21. Waldner, F.; Diakogiannis, F.I. Deep Learning on Edge: Extracting Field Boundaries from Satellite Images with a Convolutional Neural Network. Remote Sens. Environ. 2020, 245, 111741. [Google Scholar] [CrossRef]
  22. Cao, K.; Zhang, X. An Improved Res-UNet Model for Tree Species Classification Using Airborne High-Resolution Images. Remote Sens. 2020, 12, 1128. [Google Scholar] [CrossRef]
  23. Zhang, P.; Ke, Y.; Zhang, Z.; Wang, M.; Li, P.; Zhang, S. Urban Land Use and Land Cover Classification Using Novel Deep Learning Models Based on High Spatial Resolution Satellite Imagery. Sensors 2018, 18, 3717. [Google Scholar] [CrossRef]
  24. Chu, Z.; Tian, T.; Feng, R.; Wang, L. Sea-Land Segmentation with Res-Unet and Fully Connected CRF. In Proceedings of the International Geoscience and Remote Sensing Symposium (IGARSS), Yokohama, Japan, 14 November 2019; pp. 3840–3843. [Google Scholar] [CrossRef]
  25. Zhang, C.; Atkinson, P.M.; George, C.; Wen, Z.; Diazgranados, M.; Gerard, F. Identifying and Mapping Individual Plants in a Highly Diverse High-Elevation Ecosystem Using UAV Imagery and Deep Learning. ISPRS J. Photogramm. Remote Sens. 2020, 169, 280–291. [Google Scholar] [CrossRef]
  26. Xu, Y.; Wu, L.; Xie, Z.; Chen, Z. Building Extraction in Very High Resolution Remote Sensing Imagery Using Deep Learning and Guided Filters. Remote Sens. 2018, 10, 144. [Google Scholar] [CrossRef]
  27. Shia, W.C.; Chen, D.R. Classification of Malignant Tumors in Breast Ultrasound Using a Pretrained Deep Residual Network Model and Support Vector Machine. Comput. Med. Imaging Graph. 2021, 87, 101829. [Google Scholar] [CrossRef] [PubMed]
  28. Jayathunga, S.; Owari, T.; Tsuyuki, S. Evaluating the Performance of Photogrammetric Products Using Fixed-Wing UAV Imagery over a Mixed Conifer-Broadleaf Forest: Comparison with Airborne Laser Scanning. Remote Sens. 2018, 10, 187. [Google Scholar] [CrossRef]
  29. Alias, M.F.; Udin, W.S.; Piramli, M.K. High-Resolution Mapping Using Digital Imagery of Unmanned Aerial Vehicle (UAV) at Quarry Area, Machang, Kelantan. IOP Conf. Ser. Earth Environ. Sci. 2022, 1102, 2–9. [Google Scholar] [CrossRef]
  30. Sivanandam, P.; Turner, D.; Lucieer, A.; Sparrow, B.; Raja Segaran, R.; Ross Campbell, D.; Virtue, J.; Melville, B.; McCallum, K. Drone Data Collection Protocol Using DJI Matrice 300 RTK: Imagery and Lidar. 2022, pp. 1–58. Available online: https://www.tern.org.au/wp-content/uploads/20221103_M300_data_collection.pdf (accessed on 31 October 2023).
  31. Arzt, M.; Deschamps, J.; Schmied, C.; Pietzsch, T.; Schmidt, D.; Tomancak, P.; Haase, R.; Jug, F. LABKIT: Labeling and Segmentation Toolkit for Big Image Data. Front. Comput. Sci. 2022, 4, 10. [Google Scholar] [CrossRef]
  32. Sothe, C.; La Rosa, L.E.C.; De Almeida, C.M.; Gonsamo, A.; Schimalski, M.B.; Castro, J.D.B.; Feitosa, R.Q.; Dalponte, M.; Lima, C.L.; Liesenberg, V.; et al. Evaluating a Convolutional Neural Network for Feature Extraction and Tree Species Classification Using Uav-Hyperspectral Images. ISPRS Ann. Photogramm. Remote Sens. Spat. Inf. Sci. 2020, 5, 193–199. [Google Scholar] [CrossRef]
  33. Ahmed, I.; Ahmad, M.; Jeon, G. A Real-Time Efficient Object Segmentation System Based on U-Net Using Aerial Drone Images. J. Real. Time Image Process 2021, 18, 1745–1758. [Google Scholar] [CrossRef]
  34. Nguyen, H.T.; Caceres, M.L.L.; Moritake, K.; Kentsch, S.; Shu, H.; Diez, Y. Individual Sick Fir Tree (Abies Mariesii) Identification in Insect Infested Forests by Means of UAV Images and Deep Learning. Remote Sens. 2021, 13, 260. [Google Scholar] [CrossRef]
  35. Ronneberge, O.; Fischer, P.; Brox, T. INet: Convolutional Networks for Biomedical Image Segmentation. IEEE Access 2015, 9, 16591–16603. [Google Scholar] [CrossRef]
  36. Shumeng, H.; Gaodi, X.; Houqun, Y. A Semantic Segmentation Method for Remote Sensing Images Based on Multiple Contextual Feature Extraction. Concurr. Comput. 2022, 10, 77432–77451. [Google Scholar] [CrossRef]
  37. He, K.; Zhang, X.; Ren, S.; Sun, J. Deep Residual Learning for Image Recognition. In Proceedings of the IEEE Computer Society Conference on Computer Vision and Pattern Recognition, Las Vegas, NV, USA, 27–30 June 2016; pp. 770–778. [Google Scholar] [CrossRef]
  38. Li, F.; Yan, L.; Wang, Y.; Shi, J.; Chen, H.; Zhang, X.; Jiang, M.; Wu, Z.; Zhou, K. Deep Learning-Based Automated Detection of Glaucomatous Optic Neuropathy on Color Fundus Photographs. Graefe’s Arch. Clin. Exp. Ophthalmol. 2020, 258, 851–867. [Google Scholar] [CrossRef]
  39. Orbe-trujillo, E.; Novillo, C.J.; Pérez-ramírez, M.; Vazquez-avila, J.L.; Pérez-ramírez, A. Fast Treetops Counting Using Mathematical Image Symmetry, Segmentation, and Fast K-Means Classification Algorithms. Symmetry 2022, 14, 532. [Google Scholar] [CrossRef]
  40. Chen, Q.; Gao, T.; Zhu, J.; Wu, F.; Li, X.; Lu, D.; Yu, F. Individual Tree Segmentation and Tree Height Estimation Using Leaf-Off and Leaf-On UAV-LiDAR Data in Dense Deciduous Forests. Remote Sens. 2022, 14, 2787. [Google Scholar] [CrossRef]
  41. Weinstein, B.G.; Marconi, S.; Bohlman, S.; Zare, A.; White, E. Individual Tree-Crown Detection in Rgb Imagery Using Semi-Supervised Deep Learning Neural Networks. Remote Sens. 2019, 11, 1309. [Google Scholar] [CrossRef]
  42. Yoshii, T.; Lin, C.; Tatsuhara, S.; Suzuki, S.; Hiroshima, T. Tree Species Mapping of a Hemiboreal Mixed Forest Using Mask R-CNN. In Proceedings of the IGARSS 2022–2022 IEEE International Geoscience and Remote Sensing Symposium, Kuala Lumpur Convention Centre (KLCC), Kuala Lumpur, Malaysia, 17–22 July 2022; pp. 6228–6231. [Google Scholar] [CrossRef]
  43. Gan, Y.; Wang, Q.; Iio, A. Tree Crown Detection and Delineation in a Temperate Deciduous Forest from UAV RGB Imagery Using Deep Learning Approaches: Effects of Spatial Resolution and Species Characteristics. Remote Sens. 2023, 15, 778. [Google Scholar] [CrossRef]
  44. Beloiu, M.; Heinzmann, L.; Rehush, N.; Gessler, A.; Griess, V.C. Individual Tree-Crown Detection and Species Identification in Heterogeneous Forests Using Aerial RGB Imagery and Deep Learning. Remote Sens. 2023, 15, 1463. [Google Scholar] [CrossRef]
  45. Moe, K.T.; Owari, T.; Furuya, N.; Hiroshima, T.; Morimoto, J. Application of Uav Photogrammetry with Lidar Data to Facilitate the Estimation of Tree Locations and Dbh Values for High-Value Timber Species in Northern Japanese Mixed-Wood Forests. Remote Sens. 2020, 12, 2865. [Google Scholar] [CrossRef]
  46. Schiefer, F.; Kattenborn, T.; Frick, A.; Frey, J.; Schall, P.; Koch, B.; Schmidtlein, S. Mapping Forest Tree Species in High Resolution UAV-Based RGB-Imagery by Means of Convolutional Neural Networks. ISPRS J. Photogramm. Remote Sens. 2020, 170, 205–215. [Google Scholar] [CrossRef]
  47. Franklin, H.; Veras, P.; Pinheiro, M.; Paula, A.; Corte, D.; Roberto, C. Ecological Informatics Fusing Multi-Season UAS Images with Convolutional Neural Networks to Map Tree Species in Amazonian Forests. Ecol. Inform. 2022, 71, 101815. [Google Scholar] [CrossRef]
  48. Natesan, S.; Armenakis, C.; Vepakomma, U. Individual Tree Species Identification Using Dense Convolutional Network (Densenet) on Multitemporal RGB Images from UAV. J. Unmanned Veh. Syst. 2020, 8, 310–333. [Google Scholar] [CrossRef]
  49. Chen, J.; Chen, Z.; Huang, R.; You, H.; Han, X.; Yue, T.; Zhou, G. The Effects of Spatial Resolution and Resampling on the Classification Accuracy of Wetland Vegetation Species and Ground Objects: A Study Based on High Spatial Resolution UAV Images. Drones 2023, 7, 61. [Google Scholar] [CrossRef]
Figure 1. (a) Location map of the study area in Japan; (b) location map of Sub-compartment 68E in the University of Tokyo Hokkaido Forest; aerial orthomosaics of Sub-compartment 68E taken (c) before the leaf color change and (d) after the leaf color change; and a sample of Japanese oak taken (e) before the leaf color change and (f) after the leaf color change.
Algorithms 17 00084 g001
Figure 2. DJI Matrice 300 RTK UAV platform used for collection of UAV images.
Algorithms 17 00084 g002
Figure 3. The sketch of the U-Net model with ResNet101 backbone.
Algorithms 17 00084 g003
Figure 4. The ResNet101 architecture developed by He et al. (2016) [37].
Algorithms 17 00084 g004
Figure 5. General workflow for mapping the distribution of Japanese oak crowns in an uneven-aged mixed forest using UAV imagery (orthophoto) and the ResU-Net model.
Algorithms 17 00084 g005
Figure 6. Summarized accuracy scores (OA, precision, recall, F1-score and IoU values) of identifying Japanese oak crowns in an uneven-aged mixed forest by using non-augmented and augmented September UAV datasets and ResU-Net algorithm (calculated based on the validation dataset). The highest values are in bold.
Algorithms 17 00084 g006
Figure 7. Confusion matrix of Japanese oak segmentation through ResU-Net model using (a) non-augmented September UAV dataset and (b) augmented September UAV dataset.
Algorithms 17 00084 g007
Figure 8. Visualization of the predicted results of Japanese oak crown using ResU-Net model and September UAV datasets. (a) Testing RGB image; (b) labeled mask; (c) prediction using test image (non-augmented UAV dataset); (d) misclassified regions (non-augmented UAV dataset); (e) prediction using test image (augmented UAV dataset); and (f) misclassified regions (augmented UAV dataset).
Algorithms 17 00084 g008
Figure 9. Visualizing the separation of the predicted Japanese oak crown using watershed algorithm. For the prediction using non-augmented September UAV dataset; (a) prediction using test image; (b) predicted Japanese oak; and (c) predicted border class; and for the prediction using augmented September UAV dataset (d) prediction using test image; (e) predicted Japanese oak; and (f) predicted border class.
Algorithms 17 00084 g009
Figure 10. Summarized accuracy scores (OA, precision, recall, F1-score and IoU values) of identifying Japanese oak crowns in an uneven-aged mixed forest by using non-augmented and augmented October UAV datasets and ResU-Net algorithm (calculated based on the validation dataset). The highest values are in bold.
Algorithms 17 00084 g010
Figure 11. Confusion matrix of Japanese oak segmentation through ResU-Net model using (a) non-augmented October UAV dataset, and (b) augmented October UAV dataset.
Algorithms 17 00084 g011
Figure 12. Visualization of the predicted results of Japanese oak using ResU-Net model and October UAV datasets. (a) Testing RGB image; (b) labeled mask; (c) prediction using test image (non-augmented UAV dataset); (d) misclassified regions (non-augmented UAV dataset); (e) prediction using test image (augmented UAV dataset); and (f) misclassified regions (augmented UAV dataset).
Algorithms 17 00084 g012
Figure 13. Visualizing the separation of the predicted Japanese oak using watershed algorithm For the prediction using non-augmented October UAV dataset; (a) prediction using test image; (b) predicted Japanese oak; and (c) predicted border class; and for the prediction using augmented October UAV dataset; (d) prediction using test image; (e) predicted Japanese oak; and (f) predicted border class.
Algorithms 17 00084 g013
Figure 14. Summarized accuracy scores (OA, precision, recall, F1-score and IoU values) of mapping Japanese oak crowns distribution in an uneven-aged mixed forest by using all UAV datasets and ResU-Net algorithm (through overlay analyses using the segmentation results on each entire dataset). The highest values are in bold.
Algorithms 17 00084 g014
Figure 15. Confusion matrix of Japanese oak segmentation through an overlay analysis using the segmentation results and the entire annotated ground truth data over the study area through the trained ResU-Net model: (a) non-augmented September UAV dataset; (b) augmented September UAV dataset; (c) non-augmented October UAV dataset; and (d) augmented October UAV dataset.
Algorithms 17 00084 g015
Figure 16. Visualization of the predicted Japanese oak crown distribution in the Sub-compartment 68E by the ResU-Net model using UAV dataset; (a) non-augmented September UAV dataset; (b) augmented September UAV dataset; (c) non-augmented October UAV dataset; and (d) augmented October UAV dataset.
Algorithms 17 00084 g016
Table 1. OA, precision, recall, F1-score and IoU values of identifying Japanese oak crowns in an uneven-aged mixed forest by using non-augmented and augmented September UAV datasets and ResU-Net algorithm (calculated based on the validation dataset).
UAV
Dataset
OAPrecisionRecallF1-ScoreIoU
September (non-augmented)0.900.750.880.810.68
September (augmented)0.870.760.660.710.55
Table 2. OA, precision, recall, F1-score and IoU values of identifying Japanese oak crowns in an uneven-aged mixed forest by using non-augmented and augmented October UAV datasets and ResU-Net algorithm (calculated based on the validation dataset).
UAV
Dataset
OAPrecisionRecallF1-ScoreIoU
October (non-augmented)0.900.780.820.800.67
October (augmented)0.890.820.700.760.61
Table 3. OA, precision, recall, F1-score and IoU values of mapping Japanese oak crown distribution in an uneven-aged mixed forest by using UAV datasets and ResU-Net algorithm (through overlay analyses using the segmentation results on each entire dataset).
UAV
Dataset
OAPrecisionRecallF1-ScoreIoU
September (non-augmented)0.970.890.960.920.86
September (augmented)0.940.850.810.830.83
October (non-augmented)0.980.940.960.950.91
October (augmented)0.910.780.690.730.58
Disclaimer/Publisher’s Note: The statements, opinions and data contained in all publications are solely those of the individual author(s) and contributor(s) and not of MDPI and/or the editor(s). MDPI and/or the editor(s) disclaim responsibility for any injury to people or property resulting from any ideas, methods, instructions or products referred to in the content.

