1. Introduction
Cracking is one of the common distresses occurring in asphalt pavements, with causes including temperature fluctuations, aging, traffic loading, environmental/climatic issues, etc. [
1]. Load-related fatigue cracking can be further divided into bottom-up cracking and Top-Down cracking (TDC). In traditional pavement structural designs, it is often desired to cost-effectively optimize the pavement structure whilst maximizing and sustaining its longevity and endurance against load-related distresses, such as cracking, during its design life. For cost-competitiveness purposes, the pavement thickness tends to be thinner, making bottom-up and reflection crack prevention a crucial issue. As the durability and longevity requirements for pavements continue to be enhanced, there will be a convergence to an appropriate increase in the asphalt layer thickness. Correspondingly, there will also be an inherent increase in the proportion of TDC occurrence [
2]. Currently, China’s asphalt pavement design standards [
3] are predominantly focused on preventing bottom-up reflection cracks, with the governing design criteria being the bending horizontal-tensile strains at the bottom of the hot-mix asphalt (HMA) layer. To these authors’ best knowledge, at the time of writing this paper, no standardized design criteria yet exist in China for mitigating and/or limiting TDC in asphalt pavements.
In the 1980s, TDC was successively reported in South Africa, France, and the Netherlands [
4]. This phenomenon was later observed and reported in Japan, the United Kingdom, and the United States in the early 21st century [
4]. Researchers speculate that factors such as asphalt mixture design volumetrics, traffic loading, thermal stresses, aging, etc., are related to this phenomenon. Among the existing mature design methods, the American mechanistic-empirical (M-E PDG) method calculates fatigue damage using Miner’s law and then quantitatively determines the TDC life from the fatigue damage [
5,
6,
7]. However, this model does not distinguish the two stages of crack initiation and crack propagation distinctively. In addition to this method, there are other approaches, such as the viscoelastic continuous damage model [
8,
9,
10,
11] and the micromechanical model [
12,
13,
14,
15] for conducting TDC analysis. The former model utilizes pseudo-stiffness as the calculation index and considers the healing effect of viscoelastic damage and micro-damage of the asphalt mixture. This model can be employed to determine the spatial distribution of damage within a fixed timeframe, evaluate the concentration of fatigue damage (i.e., above and/or below the asphalt layer) for top-down fatigue cracking, and observe the evolution of damage over time. However, it does not consider the aging condition of the asphalt mixture and the actual traffic-loading spectrum. Additionally, it has not been locally calibrated, and its current form is relatively complex for routine practical use.
On the other hand, the latter model is inclined to strictly describe the initiation stage of top-down cracks at a microscopic scale. This includes considering the contact characteristics between aggregates, the non-uniformity of materials, and the influence of voids in the asphalt mixture. However, it is important to note that the actual validity of the model cannot be determined on the macroscopic scale. Based on the principles of viscoelastic fracture mechanics, the University of Florida [
14,
16,
17,
18] developed the Florida top-down fracture model (HMA-FM). This model posits that the transverse tensile stress generated by radial tires on pavement surfaces is chiefly responsible for causing cracking. This issue is closely associated with the observed longitudinal cracking of the outer non-wheel path band measuring 0.5 m—although it does not correspond with the longitudinal cracking of the pavement surface beneath the wheel track path. To this end, the Florida Team has introduced the concept of energy ratio, in combination with the dissipative creep strain energy limit, to design the pavement thickness and predict pavement life for top-down cracking in Florida [
14,
16,
17,
18]. This concept considers the influence of pavement structural characteristics and the impact of creep properties of the asphalt mixtures on the top-down cracking phenomenon. However, simplifying the model whilst ensuring prediction accuracy remains one of the key challenges.
The effects of healing and degradation of the viscoelastic material properties due to aging over the life of the pavement have not been fully considered, thus limiting the HMA-FM’s ability to assess the TDC resistance of asphalt pavements. Therefore, Yared [
19] proposed a new set of material sub-models based on the asphalt mixture morphology. These sub-models consider the changes in key asphalt mixture properties caused by the effects of aging and healing on damage accumulation. Additionally, they predict the cracking time of TDC induced by load using comprehensive asphalt mixture characteristics and material properties. To further enhance the predictive accuracy of the model, Yared and Birgisson et al. [
20] incorporated the axle load spectrum into the analytical framework based on fracture mechanics concepts. They also established the impact of various traffic characteristic parameters, such as vehicle category distribution, traffic seasonal variation, traffic growth rate, and lateral wheel drift, on the predictive performance of fatigue cracking. To account for the viscoelastic plasticity of the asphalt mixture, a crack initiation criterion based on energy was proposed for asphalt mixtures, drawing from Griffith’s crack initiation criterion for elastic materials [
21]. To address certain limitations of the proposed TDC model, Gu et al. [
22,
23] conducted a TDC study based on different generational locations whilst also considering the impact of aging and healing. So far, research on TDC has progressed through the stages of application and development of linear elastic fracture mechanics, fatigue fracture mechanics, and viscoelastic fracture mechanics. Currently, the focus of most research regarding asphalt pavement cracking is mostly on the application of fatigue fracture mechanics theory and related methods.
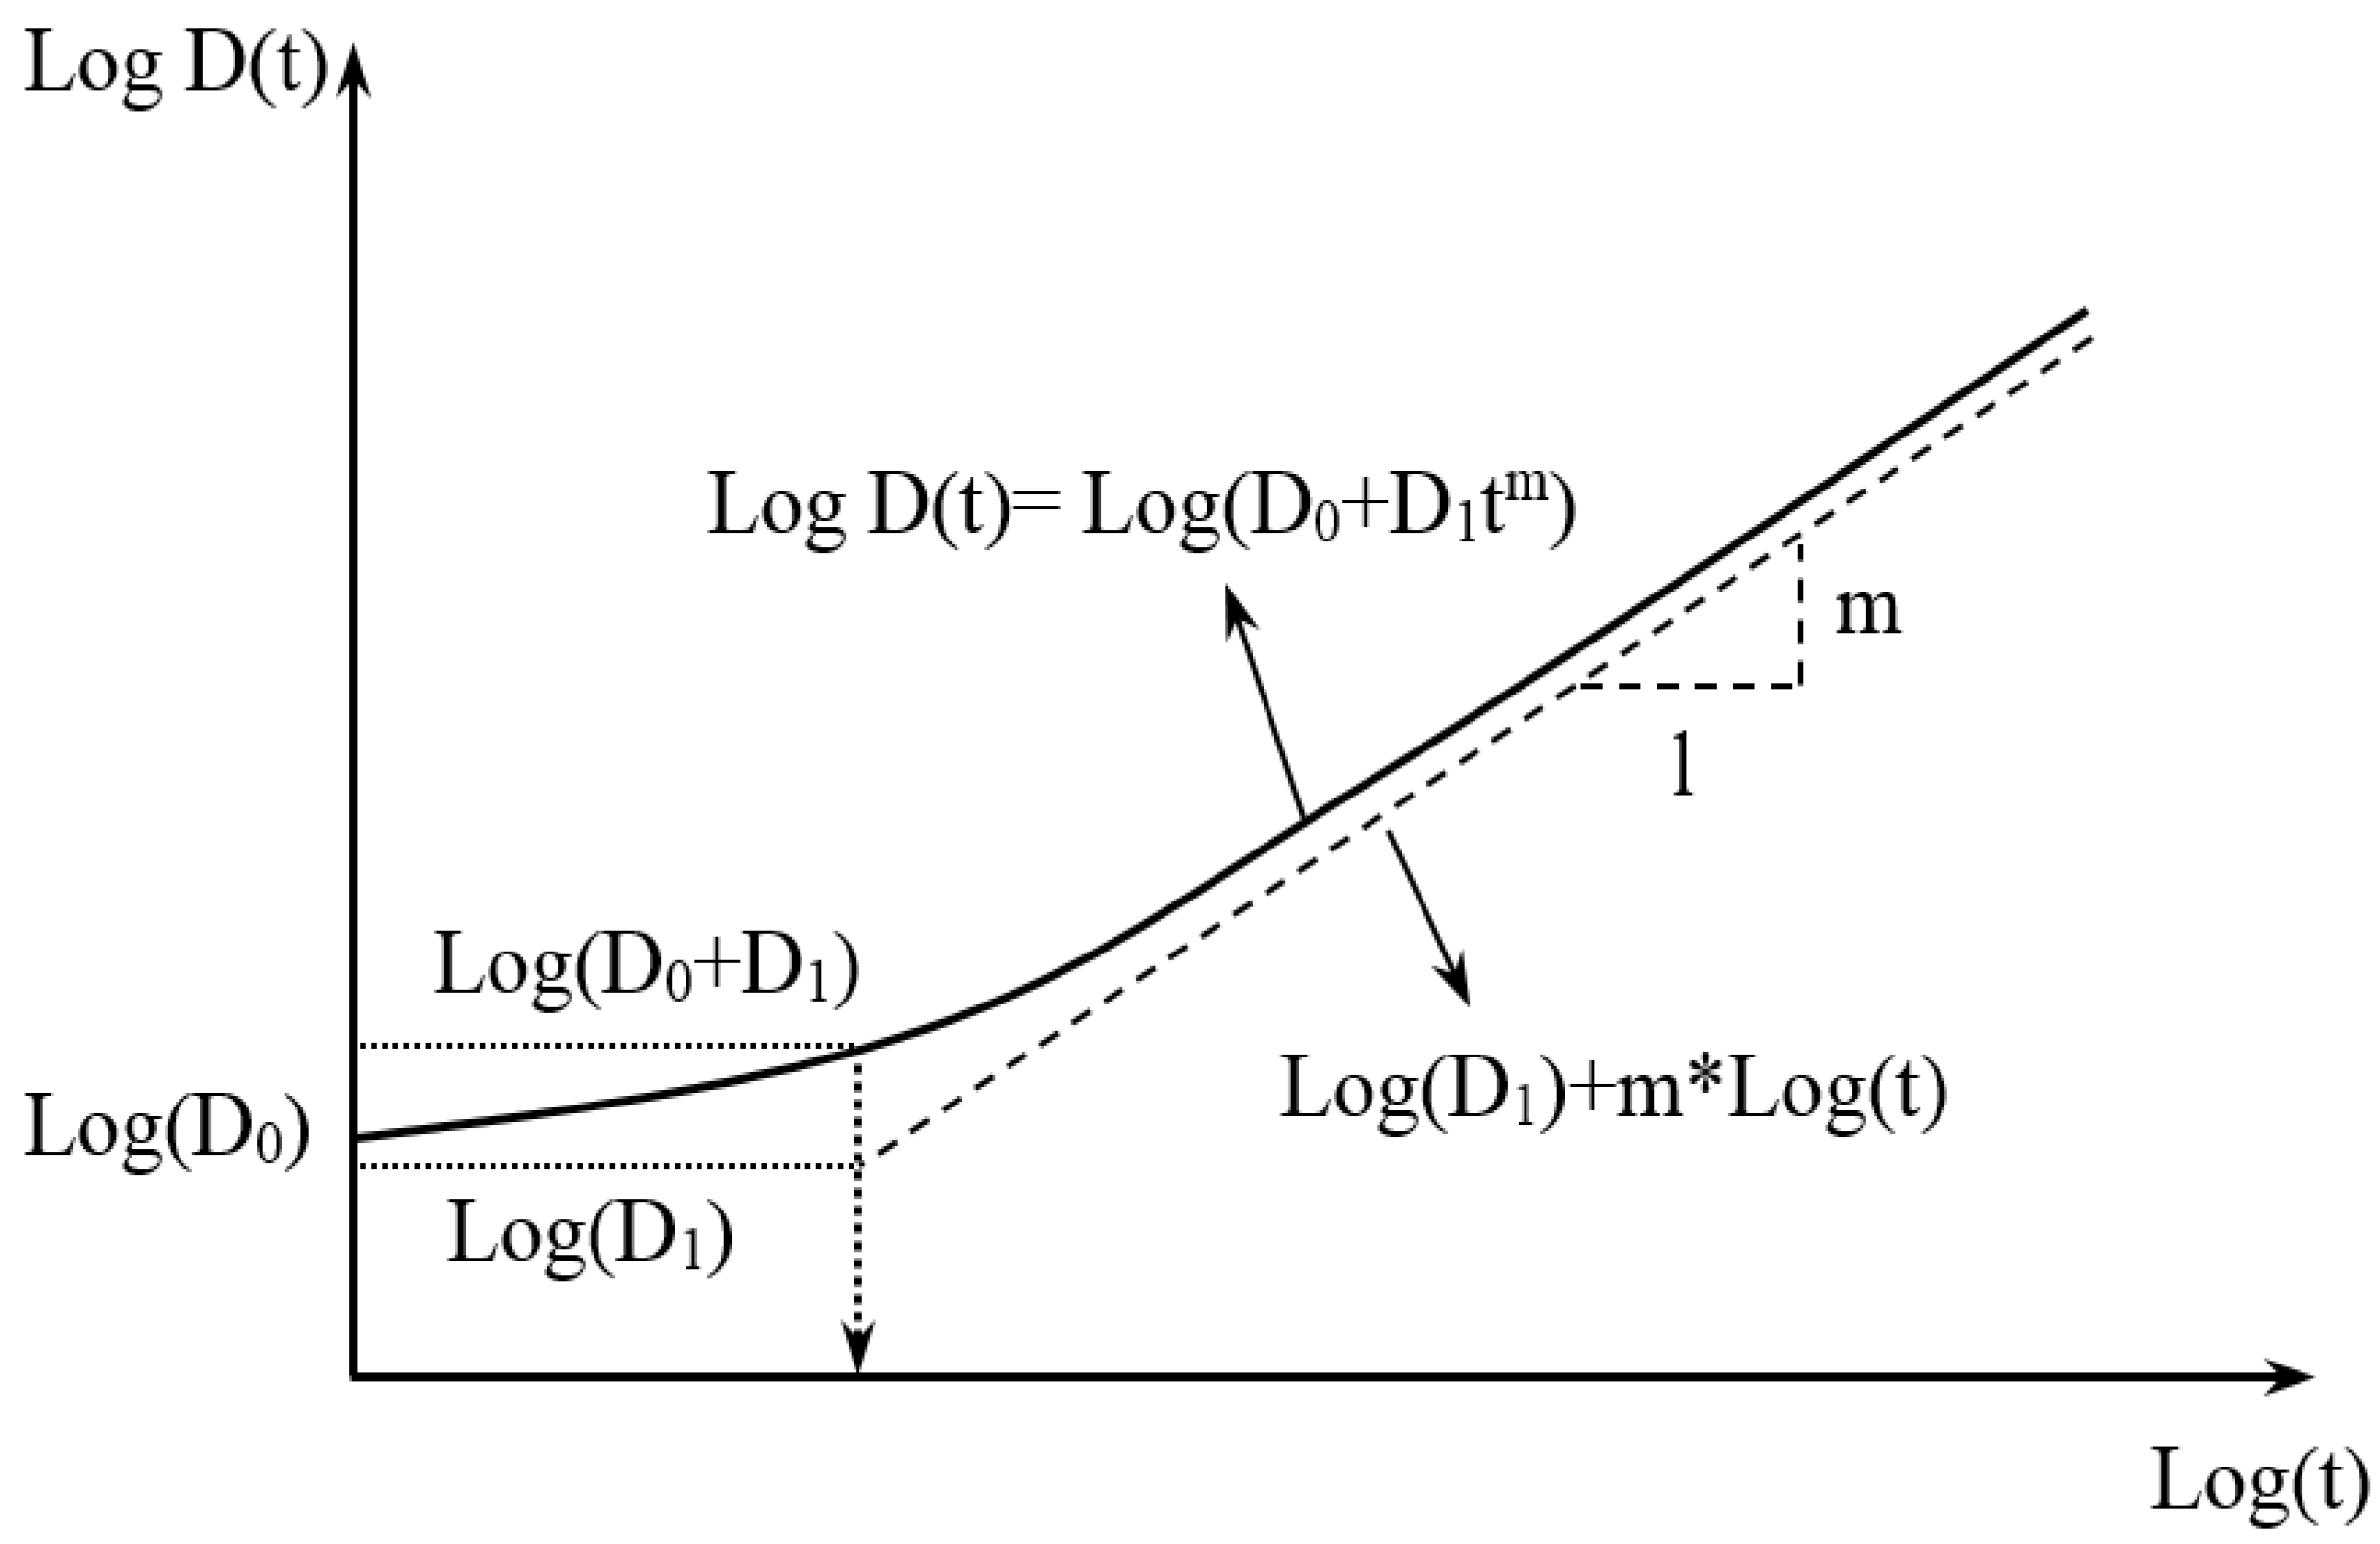
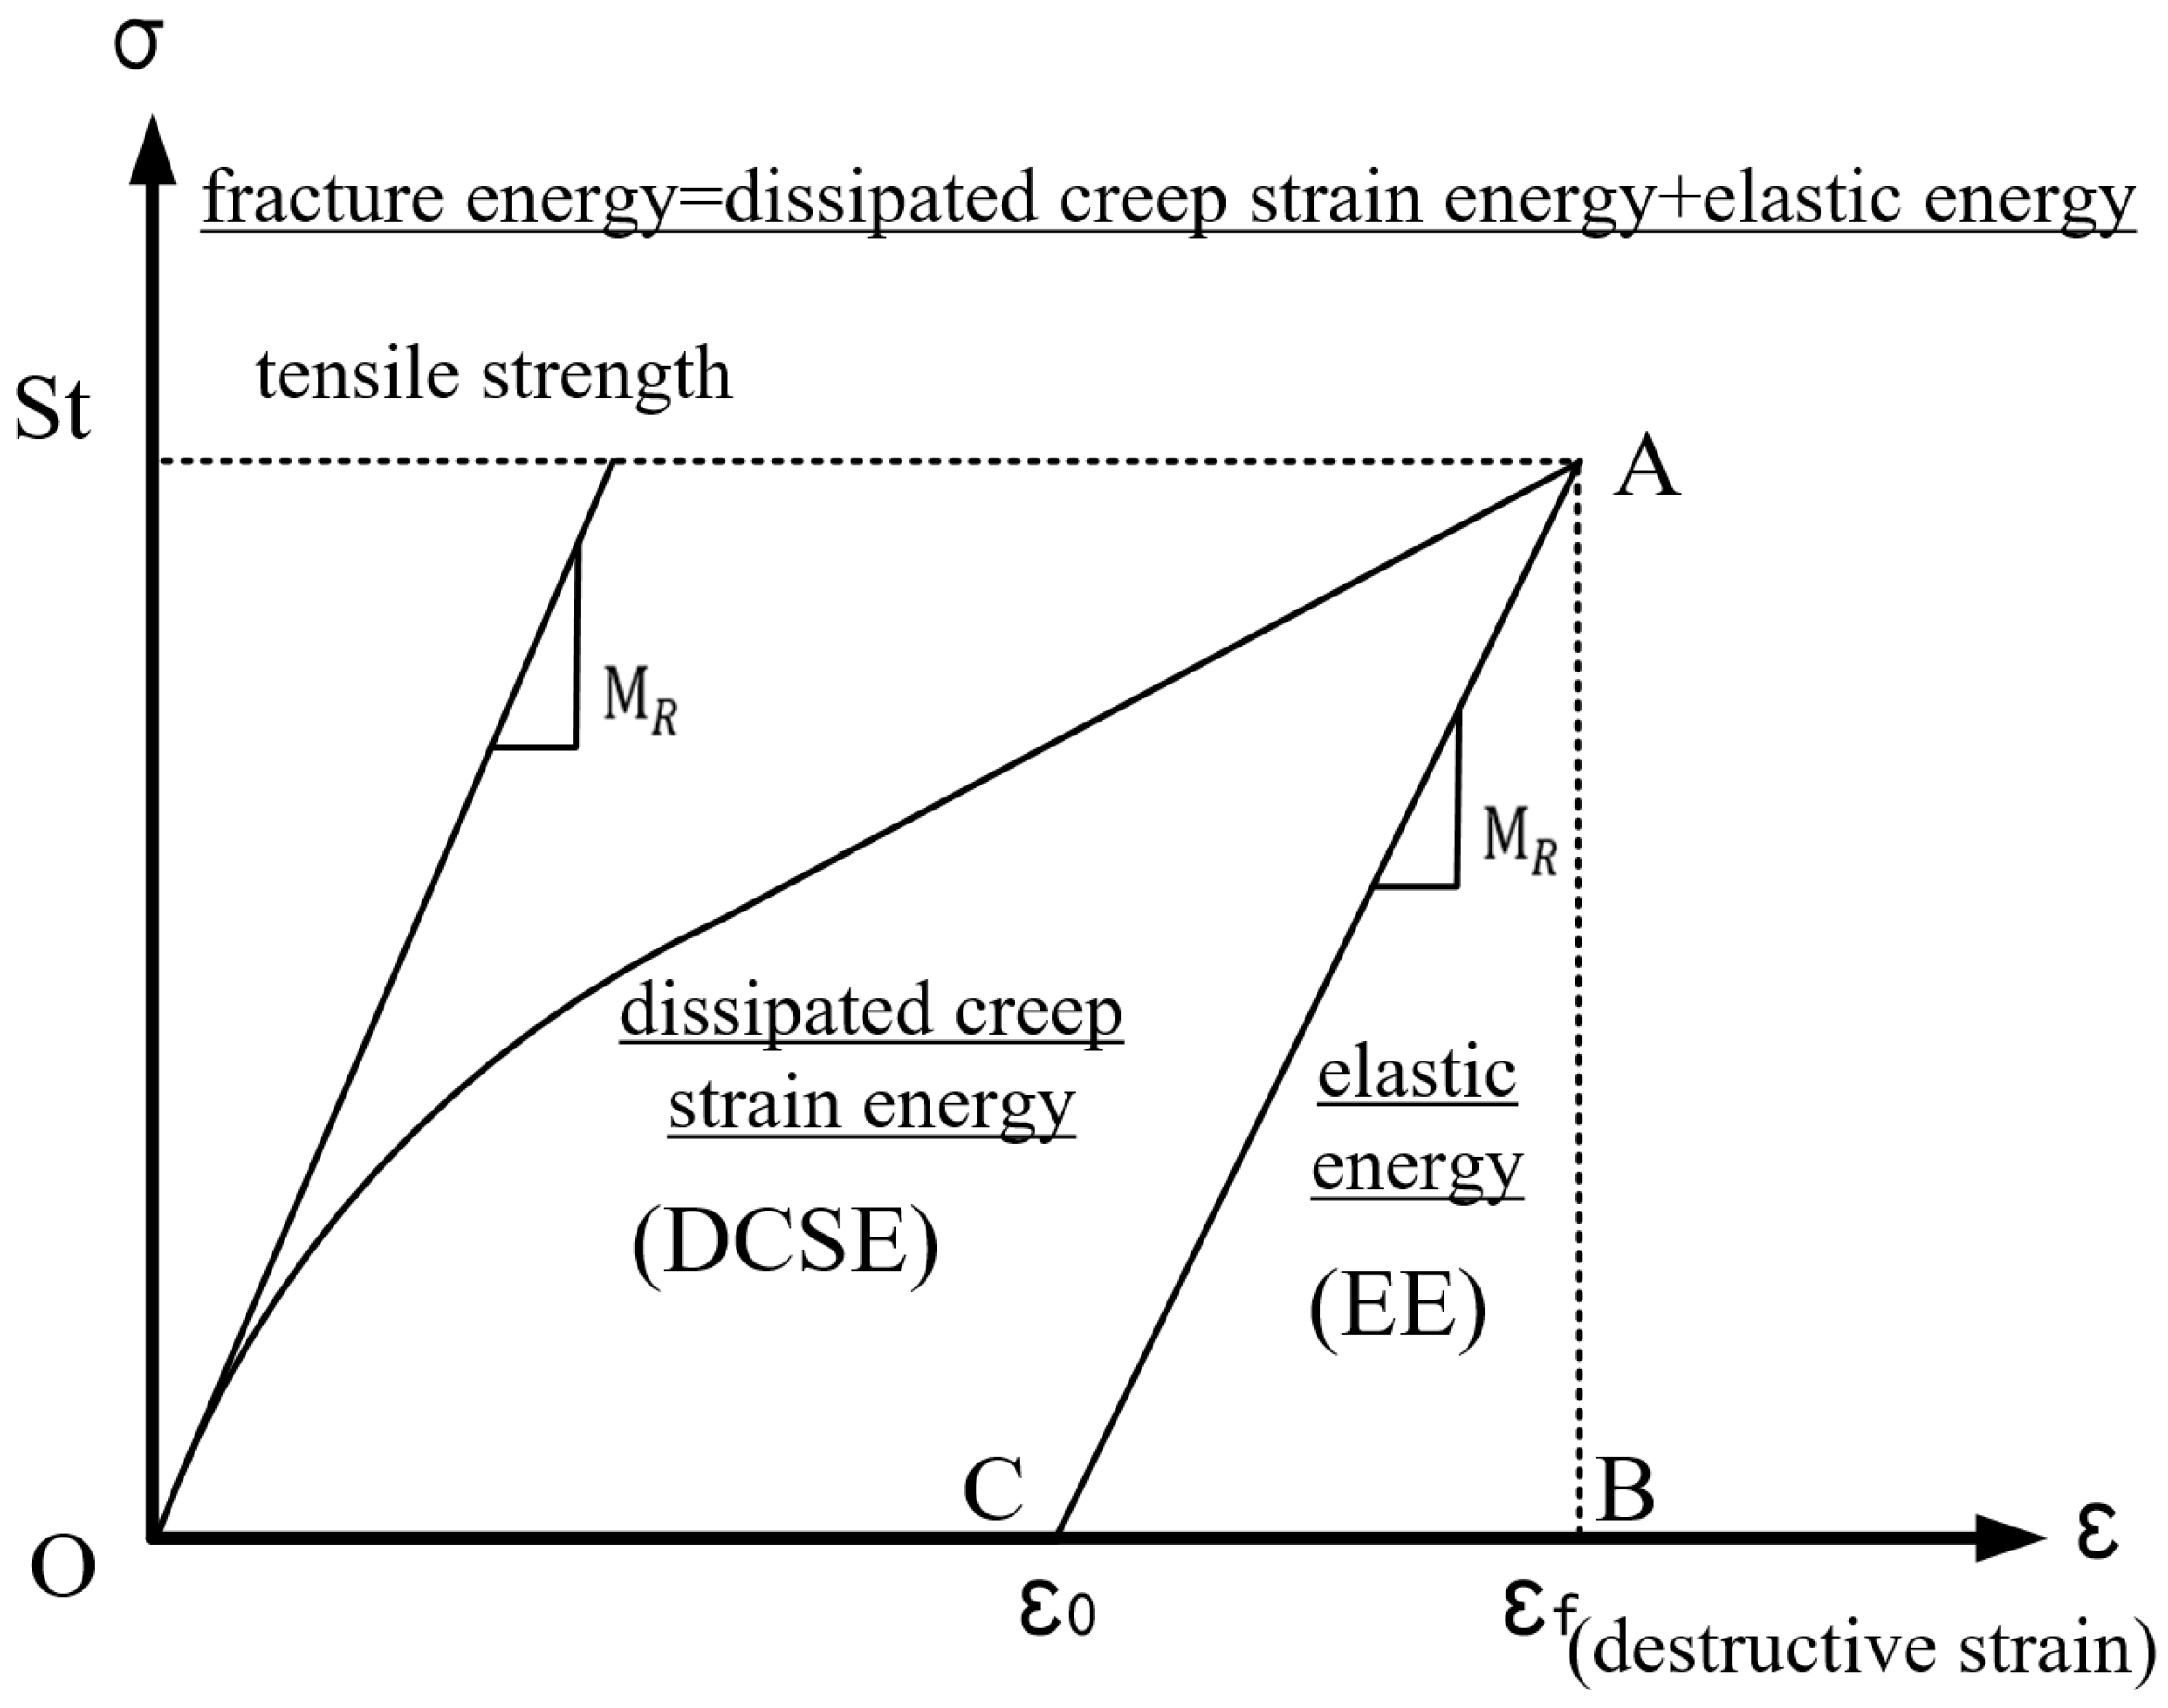
In the HMA energy-based model and fracture mechanics framework, the macroscopic crack development at any time during crack initiation is described using some upper and lower energy thresholds [
24]. These threshold limits are represented by the Dissipated Creep Strain Energy (DCSE) and Fracture Energy (FE), respectively [
25]. Once the energy threshold is surpassed, non-healing macroscopic cracks will form and propagate throughout the asphalt mixture. On the other hand, the rheological properties of the asphalt mixture cause stress redistribution in the pavement system, thereby accumulating viscoelastic residual stress under continuous repeated loading [
26]. The viscoelastic properties of the asphalt mixture should thus be considered for the asphalt pavement cracking model to be more accurately representative and effective [
27]. The study of HMA fracture mechanics indicates that the limit of DCSE in asphalt mixtures effectively defines the threshold for fracture damage [
28,
29].
In this study, an energy model developed based on the principles of material viscoelasticity and fracture mechanics was utilized to characterize and analytically quantify TDC on a hypothetical municipal road at different locations, including approximating the crack initiation life. The main objective of the study was to model and numerically characterize the cracking mechanism of TDC in typical pavement structures and determine the HMA material and structural composition that can better resist top-down fatigue cracking. The research findings are envisioned to serve as a valuable reference datum for mitigating TDC and designing crack-resistant asphalt surfaces for typical pavement structures in Urumqi, China.
4. FE Modeling, Simulations, and Numerical Results
4.1. Pavement Structural Configuration
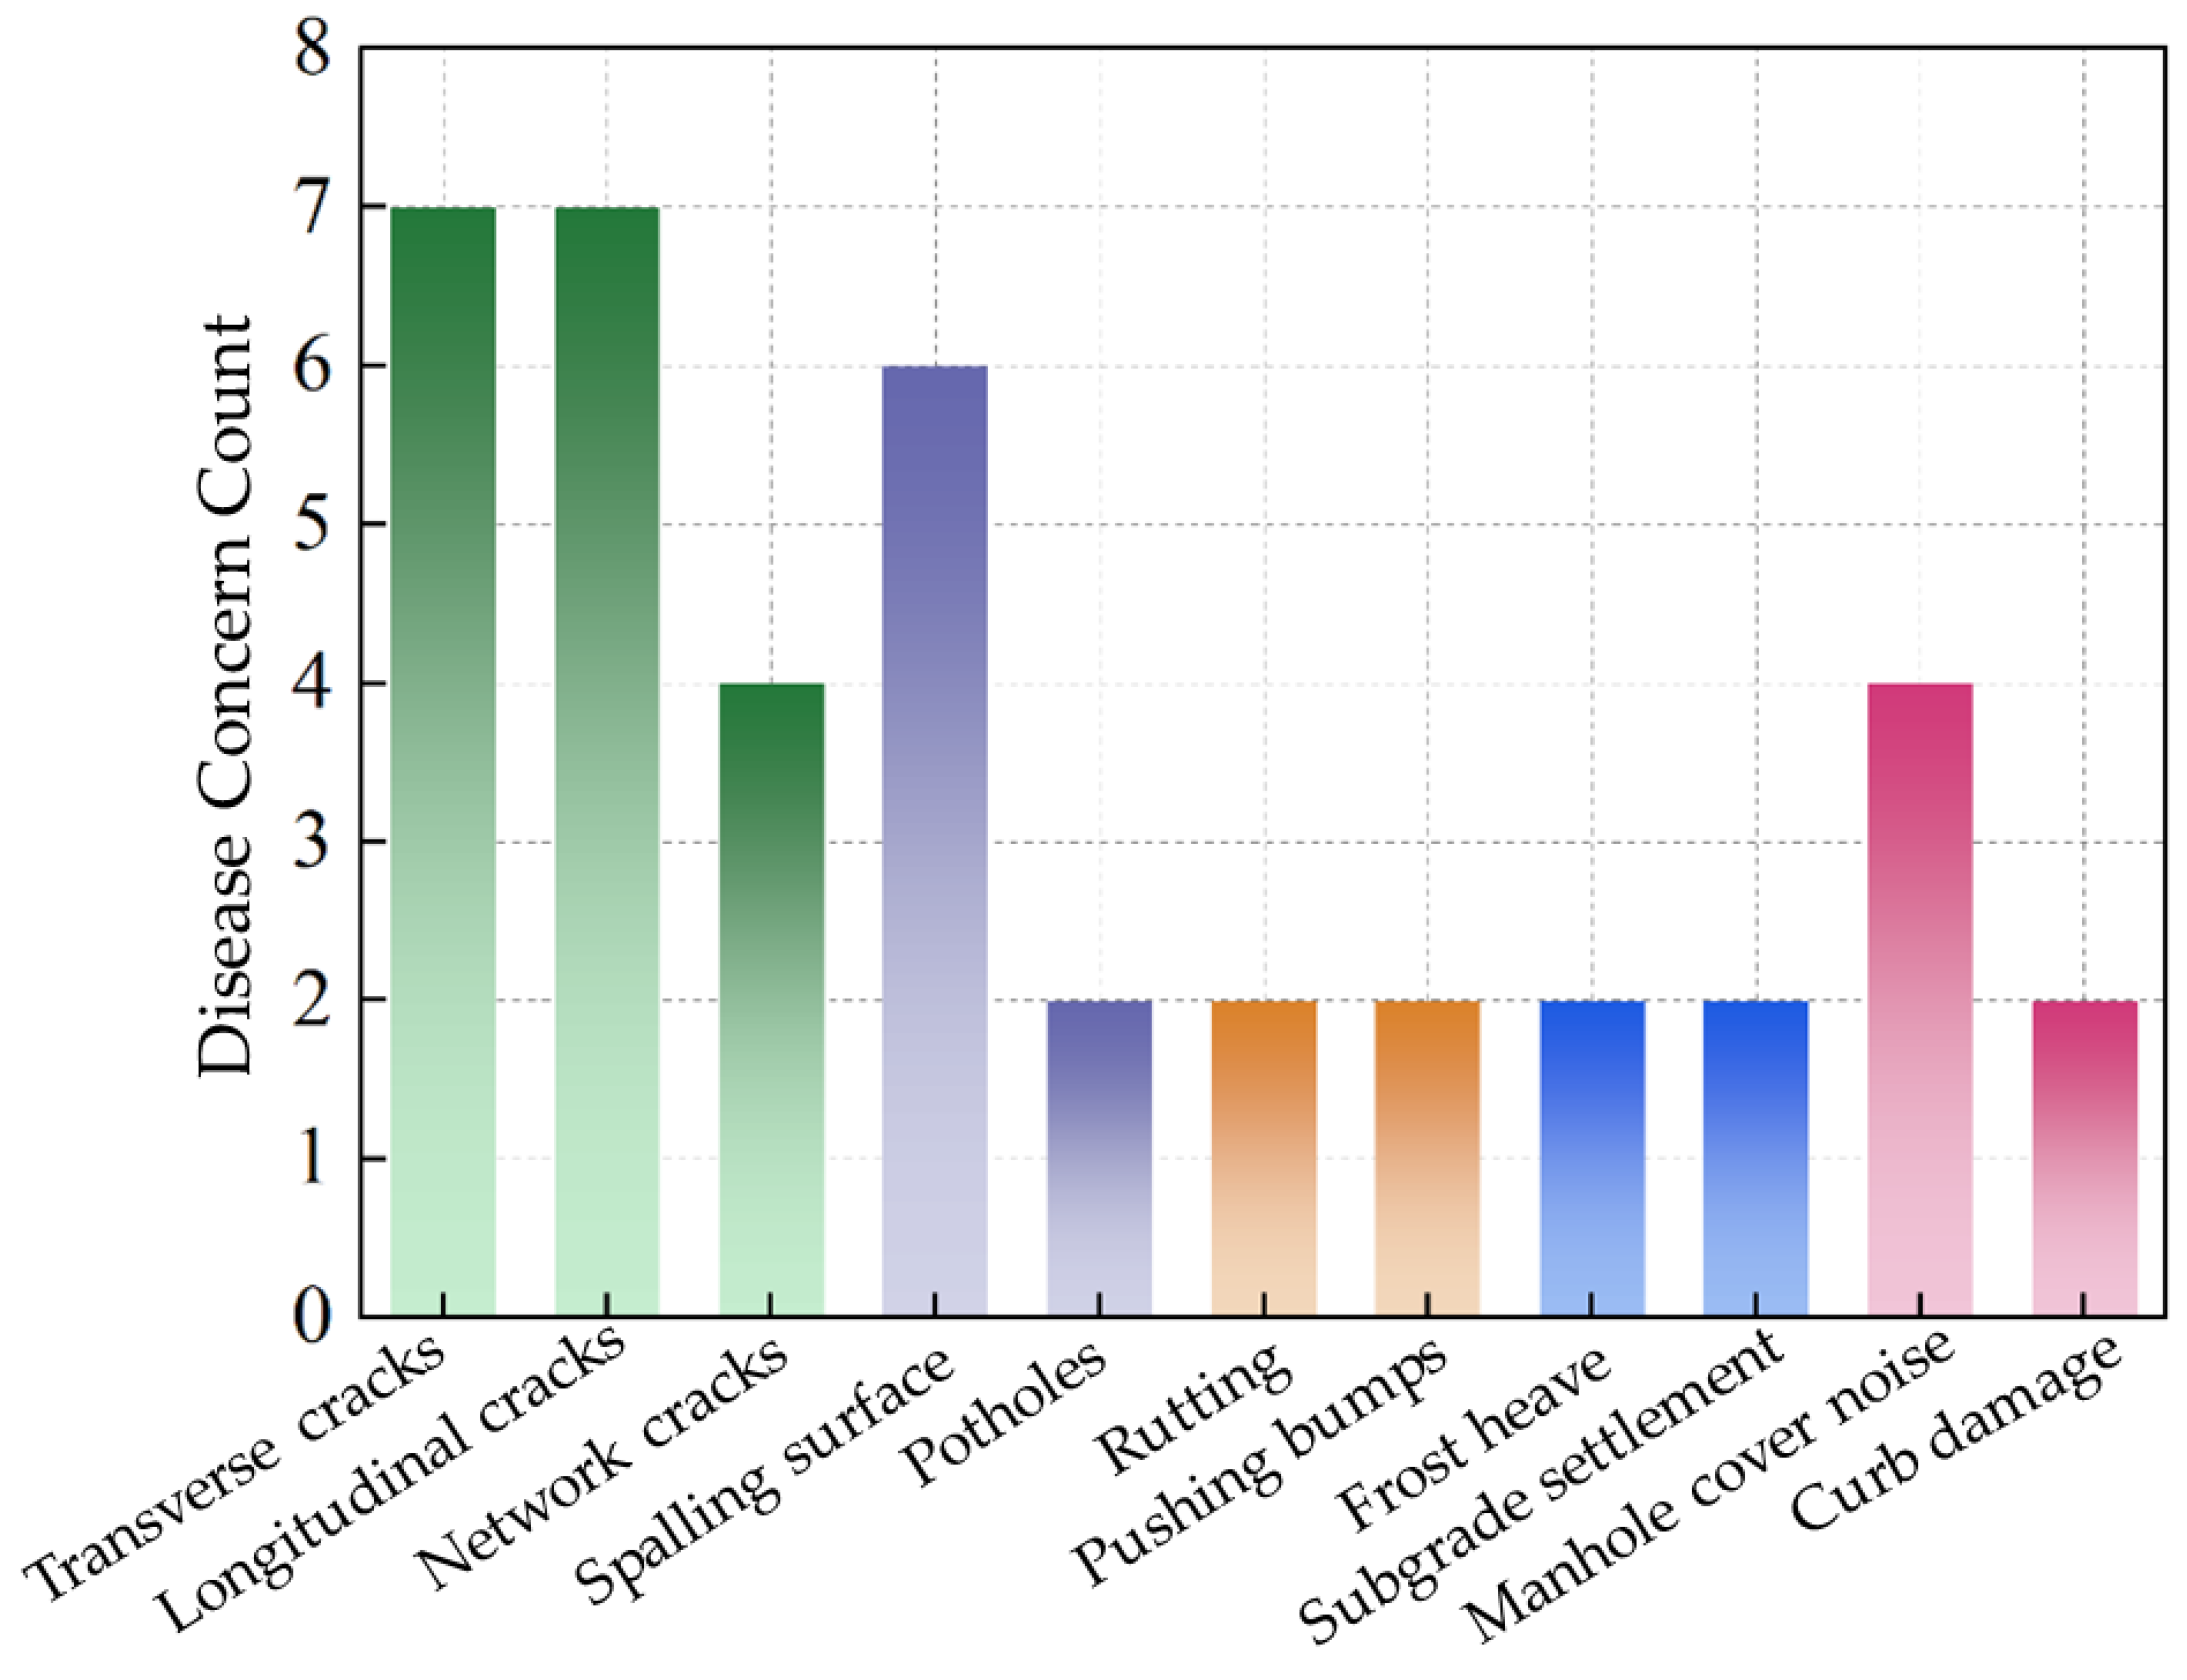
Based on the 2021 field performance monitoring and surface distress surveys conducted in Urumqi (China), it was found that cracking accounted for approximately 65% to 75% of the total pavement distress measured/recorded. See
Figure 8.
From the field surveys, the most observed cracking type was top-down cracking.
Figure 8 exemplifies a typical pavement structure for the main local municipal road consisting of an asphalt macadam SMA-16 (surfacing layer), asphalt concrete AC-20, and asphalt stabilized macadam ATB-25 as the total 20 cm asphalt mixture thickness.
As illustrated in
Figure 9, the base layer comprises a two-layer cement-stabilized sand gravel semi-rigid structural layer, totaling 36 cm thick. The sub-base comprises 30 cm of natural sand gravel resting on an in-situ compacted subgrade soil material.
Figure 10 exemplifies typical top-down cracking distresses (geographic coordinates: 87.632° E, 43.817° N) observed in Urumqi, China.
In
Figure 10, the longitudinal cracks are concentrated in a continuous band along the wheel path (WP), with wider cracks at the top and narrower cracks at the bottom (see
Figure 10b). From pavement cross-sectional saw-cuttings and forensic evaluations, these cracks were visually observed to extend through the middle and upper surface layers, i.e., they extended to various depths within these layers. The prevalence of these cracks along the WP suggests that traffic wheel loading is one of the primary causes.
Field investigations by these authors found aggregate segregation with the AC-10/13 mixture comprising mostly of the fines, whilst the SMA-16 had more of the medium-sized grain aggregates. During core sampling, it was observed that the underlying ATB layer was loosely compacted and could not be fully extracted [
53]. Therefore, the rehabilitation and reconstruction of the test section prioritized the replacement of SMA-16 with SMA-13, ATB-25 with AC-25 for the lower layer, and utilizing modified asphalt binder for the upper surfacing layer. Additionally, an anti-aging agent was added to the upper surfacing layer, whilst an anti-spalling agent was added to the lower layer. To offset the cost increment resulting from these material changes/replacements, an attempt was simultaneously made to reduce and optimize the thickness of the asphalt layers without compromising the pavement’s structural integrity and overall performance. Additionally, to investigate the effectiveness of the reconstructed pavement structure in resisting TDC further, five different pavement transitional structures were added to the study matrix for comparison purposes. The pavement structures that were modeled and numerically evaluated are presented in
Table 2. The base asphalt binder used was 90# Karamay asphalt, the modified asphalt binder was SBS grades I-B, and all the SMA mixtures were modified with lignin fiber.
Figure 11 shows the schematic diagram of different pavement structures.
The fracture energy, resilience modulus, and dynamic modulus of the asphalt mixture, as well as its creep compliance parameters,
m and
D1, were obtained through formula deductions using Equations (16)–(30). The material input parameters used in the TDC prediction model are listed in
Table 3 below.
4.2. Pavement Layer Thickness Combinations
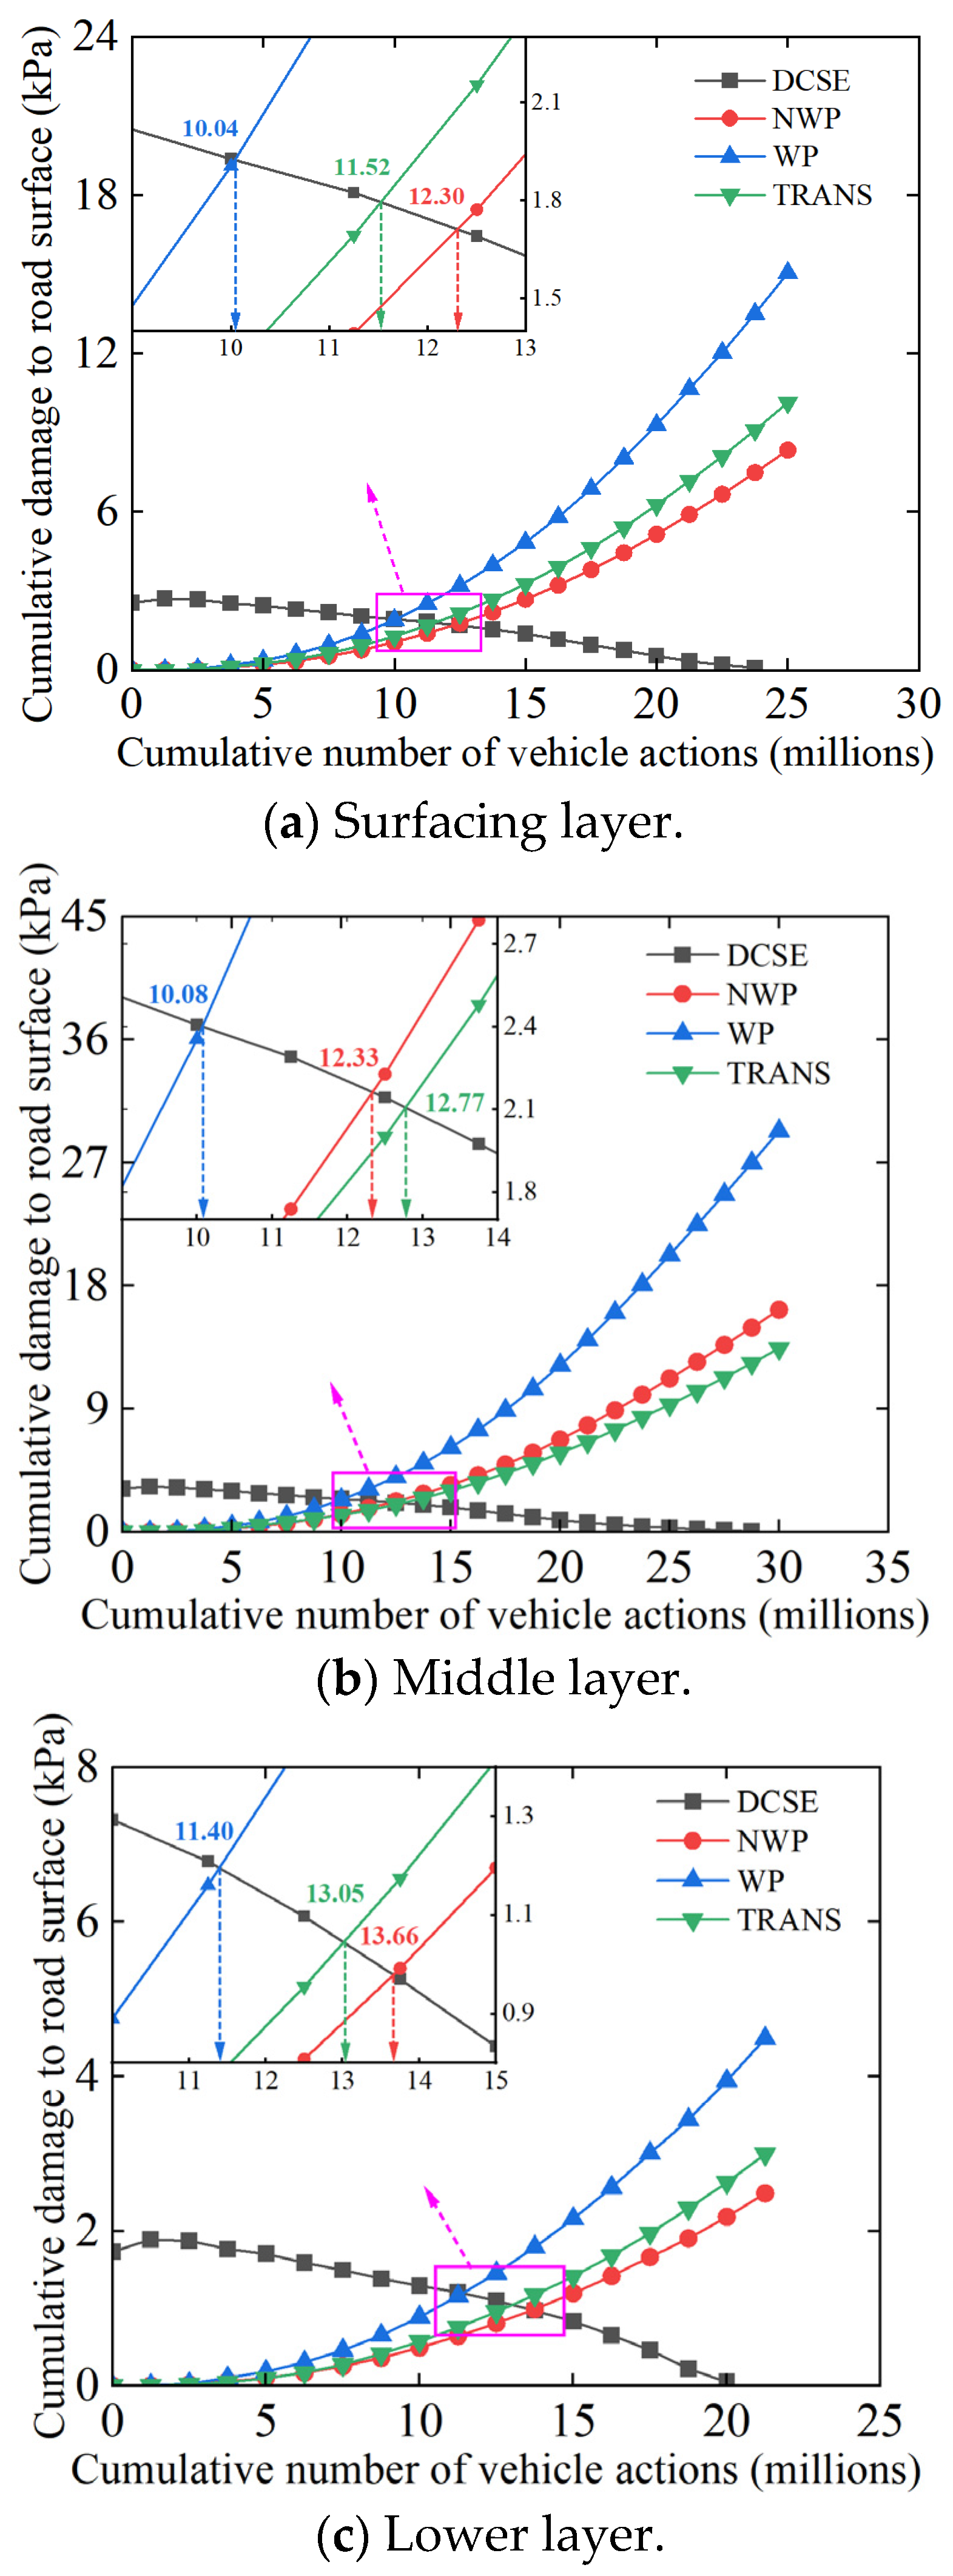
According to the meteorological data of Urumqi (China), the annual average temperature is 7.88 °C. For the practicality of this study, 10 °C was used in the asphalt binder stiffness aging model to simulate the aging environment of the asphalt binder. When UV aging is not considered, the prediction of TDC at the key horizontal locations of each layer of the original road-pavement section is shown in
Figure 12.
From
Figure 12, the cracking time of the surfacing (upper) layer occurs relatively earlier than that in the middle and lower layers, respectively, which theoretically infers that the original pavement section’s cracks could be mostly top-down. This is consistent with the on-site field observations, with the cracks always occurring in the wheel path (WP) first. As theoretically expected, the TDC generation in the non-WP (NWP) zone and transverse (TRANS) position occurred much later after that in the WP.
The response trends of the cumulative number of load repetitions at the key crack initiation locations (namely WP, NWP, and TRANS) for different pavement structures and layers are shown in
Figure 13. In particular, the figure shows that the crack initiation life in the WP and NWP changed significantly with different pavement layer thicknesses and material combinations but basically maintained a consistent response trend.
In the pavement structures with the 5/7/8 cm thickness combinations (
Table 3), the TDC cracking life at the critical locations in the surfacing (upper) layer increased after replacing the ATB-25 lower layer material with AC-25, i.e., pavement structure I versus IV. The crack initiation life increment in the WP, NWP, and TRANS were 18.2%, 15.5%, and 14.9%, respectively.
After replacing the SMA-16 top surfacing (upper) layer with SAC-13 (i.e., pavement structure I versus V, VI, VII, VIII), the surfacing (upper) layer’s WP cracking life was approximately the same as before the replacement or decreased slightly, regardless of the combination of the material and structural thickness of the middle and lower layers. This analytically shows that switching to SAC-13 does not improve the cracking life of the surfacing (upper) layers. The probable reason could be that in the structural fatigue damage analysis, the loading input (namely stress) has an important influence on the accumulation rate of damage in the pavement structure. As the input stress increases, the cumulative load-related damage caused by the increasing stress also increases. According to
Table 3, SAC-13 has a relatively higher modulus at 20 °C compared to SAM-16, and, thus, the pavement structure with the relatively stiffer SAC-13 as the top surfacing (upper) layer sustains higher critical stresses—but obviously lower compressive strains. In the TDC model, the asphalt mixture has a higher tensile strength gradient as the aging time changes. When considering the HMA strain energy threshold from the perspective of fracture energy, the asphalt mixture (HMA) with higher modulus has a larger stiffness aging coefficient,
, at different aging times. This also corresponds to
Figure 13a. Compared with Structure I, keeping the layer thickness and materials combination unchanged but only replacing the SMA-16 top surfacing (upper) layer with SAC-13 resulted in a declining response trend for the crack initiation life—even though the fracture energy increased. Compared to traditional AC-type asphalt mixtures, SMA-type asphalt mixtures generally have superior mix-design volumetrics with higher asphalt binder contents, typically exceeding 5.9%. Therefore, it is not theoretically surprising that switching from SMA-16 to SAC-13 led to a decline in the cracking resistance of the pavement top surfacing (upper) layer.
In the pavement structures with the 4/6/7 cm thickness combinations (
Table 3), after replacing SMA-16 with the less-stiff SMA-13 (i.e., a little bit more flexible) in the top surfacing (upper) layer and ATB-25 with AC-25 in the lower layer, the TDC life of the top surfacing (upper) layer at the key response positions (i.e., WP, NPW, and TRANS) increased significantly—averaging about 19.8%. After adding an anti-aging agent and anti-peeling agent, respectively, the TDC life at the key response locations of the top surfacing (upper) layer increased even further by about 3.9%. Although the overall thickness of the surfacing (upper) layer decreased by 3 cm and correspondingly reduced the cracking life of the pavement to some extent, the use of the superior binder-rich SMA-13 asphalt mixture significantly improved the cracking resistance of the pavement surface layer. In addition to being rich in the asphalt binder content, this is partly because the SMA asphalt mixture utilized in this study comprised of a skeleton compact stone-on-stone contact structure, characterized by a clavicle frame embedded with some coarse-graded gravel aggregates, resulting in a high overall structural strength, excellent stability, and high cracking resistance potential.
In general, the reconstructed Structures II and III benefited from the superior performance advantages of the SMA-type asphalt mixture, namely SMA-13. In comparison to SMA-16 and SAC-13, which were also used as the surfacing (upper) layer materials in the other pavement structures (see
Table 3), SMA-13 exhibited more flexibility with a relatively smaller modulus at 20 °C and, therefore, better resistance to cracking. Additionally, the asphalt mixture (SMA-13) demonstrated a reduced stiffness aging coefficient and tensile strength gradient over time. As a result, the cumulative rate of pavement load-related damage is more gradual. Based on Equations (13), (27) and (28), the asphalt mixture on the top surfacing (upper) layer of the reconstructed pavement structures mathematically exhibits better healing ability compared to the original and transition pavement structures, with the fracture energy depreciation rate of the asphalt mixtures being relatively flat (i.e., slope close to zero) during the aging process. According to the TDC initiation criterion, the cumulative load-related damage curve of the reconstructed pavement structures remained nearly flat and only marginally changed. However, the HMA strain energy threshold curve shows a general increase. Therefore, the crack initiation life (the intersection points between these two curves) when the cumulative damage reaches the strain energy threshold of the asphalt mixture is prolonged, as shown in
Figure 13a; with the crack initiation life response curves of the pavement Structures I, II, and III showing an upward trend.
4.3. UV Aging Cracking Analysis
When in service, asphalt pavements are subjected to prolonged exposure to light, leading to aging, age-hardening, and a decline in pavement performance [
54,
55,
56]. According to the literature [
57], the intensity of UV radiation in the Urumqi area has been gradually increasing year by year, with more than one-third of the days experiencing strong UV radiation. Considering the impact of this factor on TDC and the durability of asphalt pavements, it is imperative to consider the UV radiation environment in crack simulation models. The asphalt binder viscosity aging model considers the asphalt binder viscosity gradient under different aging times when predicting the TDC life [
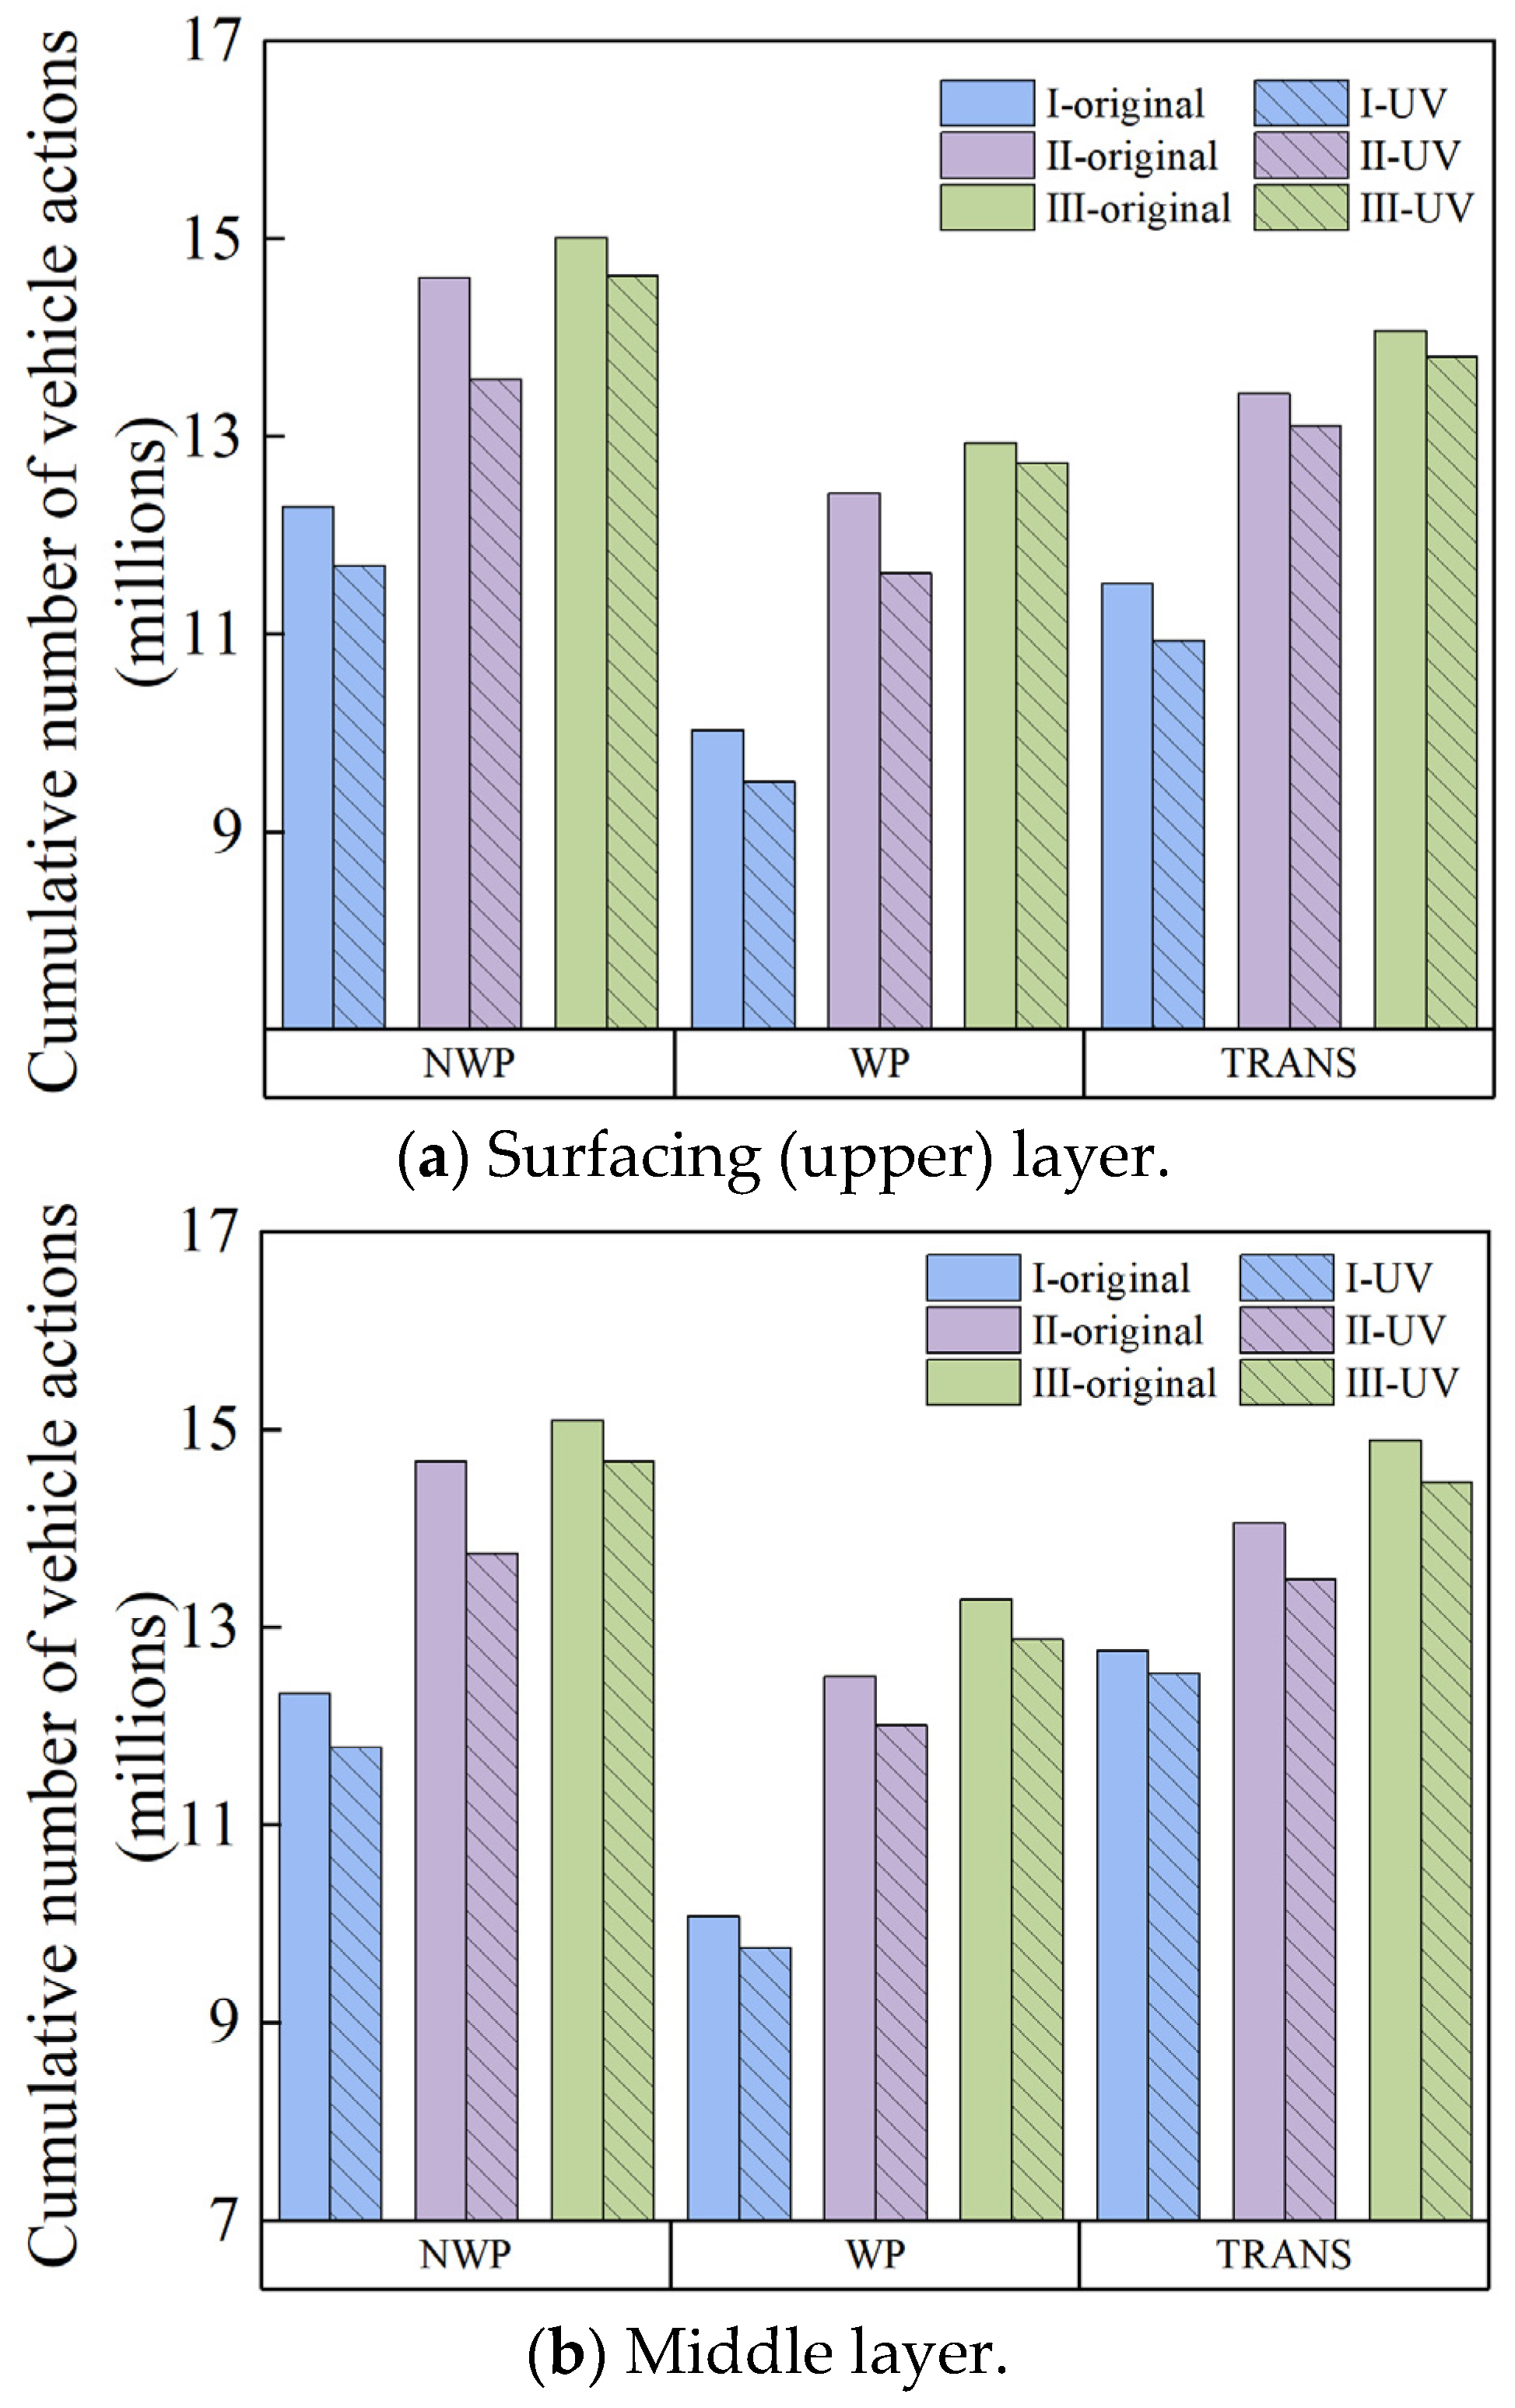
26]. In this modeling study, the stiffness gradient and tensile strength gradient of the asphalt mixture were inherently adjusted based on the asphalt binder viscosity gradient. Therefore, when considering the UV aging factor, the impact of UV aging on the cracking properties of the asphalt mixture is translated into its effects on the viscosity of the asphalt binder. In this study, the lifetime of cracking at each key location zone (namely WP, NWP, and TRANS) was numerically estimated and plotted in bar charts shown in
Figure 14. In the figure, “original” indicates that UV radiation was not considered—whilst “UV” indicates that the effects of UV aging were considered in the modeling analysis. The notations I, II, and III refer to the pavement structures listed in
Table 3, respectively.
Figure 14 illustrates that the change in cumulative pavement damage induced by loading and the variational trends without considering UV aging remained consistent. As theoretically expected, cracks first appeared in the WP zone. Under the same pavement structure, the initiation life of cracking in the different pavement layers shows a gradually increasing trend from the top surfacing (upper) layer through the middle down to the lower layer.
In the various pavement structures evaluated, the introduction of UV aging at the same key locations of the different surfacing (upper) layers resulted in a decreasing response trend in the cumulative number of sustainable load cycles, i.e., the cracking life. For example, it was observed that the cracking life of the surfacing (upper) layer of the original pavement Structure I at the key locations (namely WP, NWP, and TRANS) decreased by 4.88%, 5.18%, and 5.03%, respectively. On the other hand, the cracking life of the reconstructed pavement Structure II at the key positions decreased by 7.05%, 6.52%, and 2.46%, respectively. For the reconstructed pavement Structure III, the reductions were 2.60%, 1.55%, and 1.78%, respectively. In general, the cracking life of the original pavement structure was lower than that of the others. However, by improving the layer thickness and material combinations of the pavement structure, the cracking life tends to correspondingly improve, with the cumulative number of sustainable load repetitions increasing significantly on the reconstructed pavement structures.
As can be seen from the figure, the cracking life of the top surfacing (upper) layer of the reconstructed pavement Structure III was further increased due to the reconstructed pavement Structure II. For the top surfacing (upper) layers of the reconstructed pavement Structures II and III, the reduction in the cracking life at the critical locations before and after UV aging is 7.05%, 6.52%, and 2.46%; and 2.60%, 1.55%, and 1.78%, respectively. Evidently, these data indicate that when an anti-aging agent is included, the reconstructed pavement Structure III exhibits superior resistance to cracking in UV radiation environments than the reconstructed pavement Structure II. This is partly attributed to the enhanced flexibility of the asphalt mixture due to the addition of the anti-aging agent that inherently delays the stiffness age-hardening and possible increase in modulus caused by prolonged aging—ultimately improving the asphalt mixture’s anti-cracking properties.
The rheological properties and performance characteristics of the asphalt binder play a pivotal role in determining the quality and durability of asphalt mixtures, particularly with respect to aging and cracking. The incorporation of an anti-aging agent effectively minimizes the aging rate of the asphalt binder and ensures sustained durability, thereby significantly enhancing the anti-aging performance of the asphalt pavement and reducing its susceptibility to environmental degradation. This ultimately leads to enhancing the asphalt pavement’s overall cracking resistance potential.
4.4. Interlayer Bonding and Crack Analysis
Studies [
21] have shown that the pavement structural stress state tends to deteriorate if interlayer debonding occurs. In this study, three interlayer contact surfaces were numerically modeled and quantitatively analyzed in each pavement structural layer. These three-layer interfaces were: (a) the bottom of the asphalt (HMA) surfacing (upper) layer and the top of the asphalt mid-surface layer; (b) the bottom of the asphalt mid-surface layer and the top of the asphalt sub-layer; and (c) the bottom of the asphalt sub-layer and the top of the base layer, respectively.
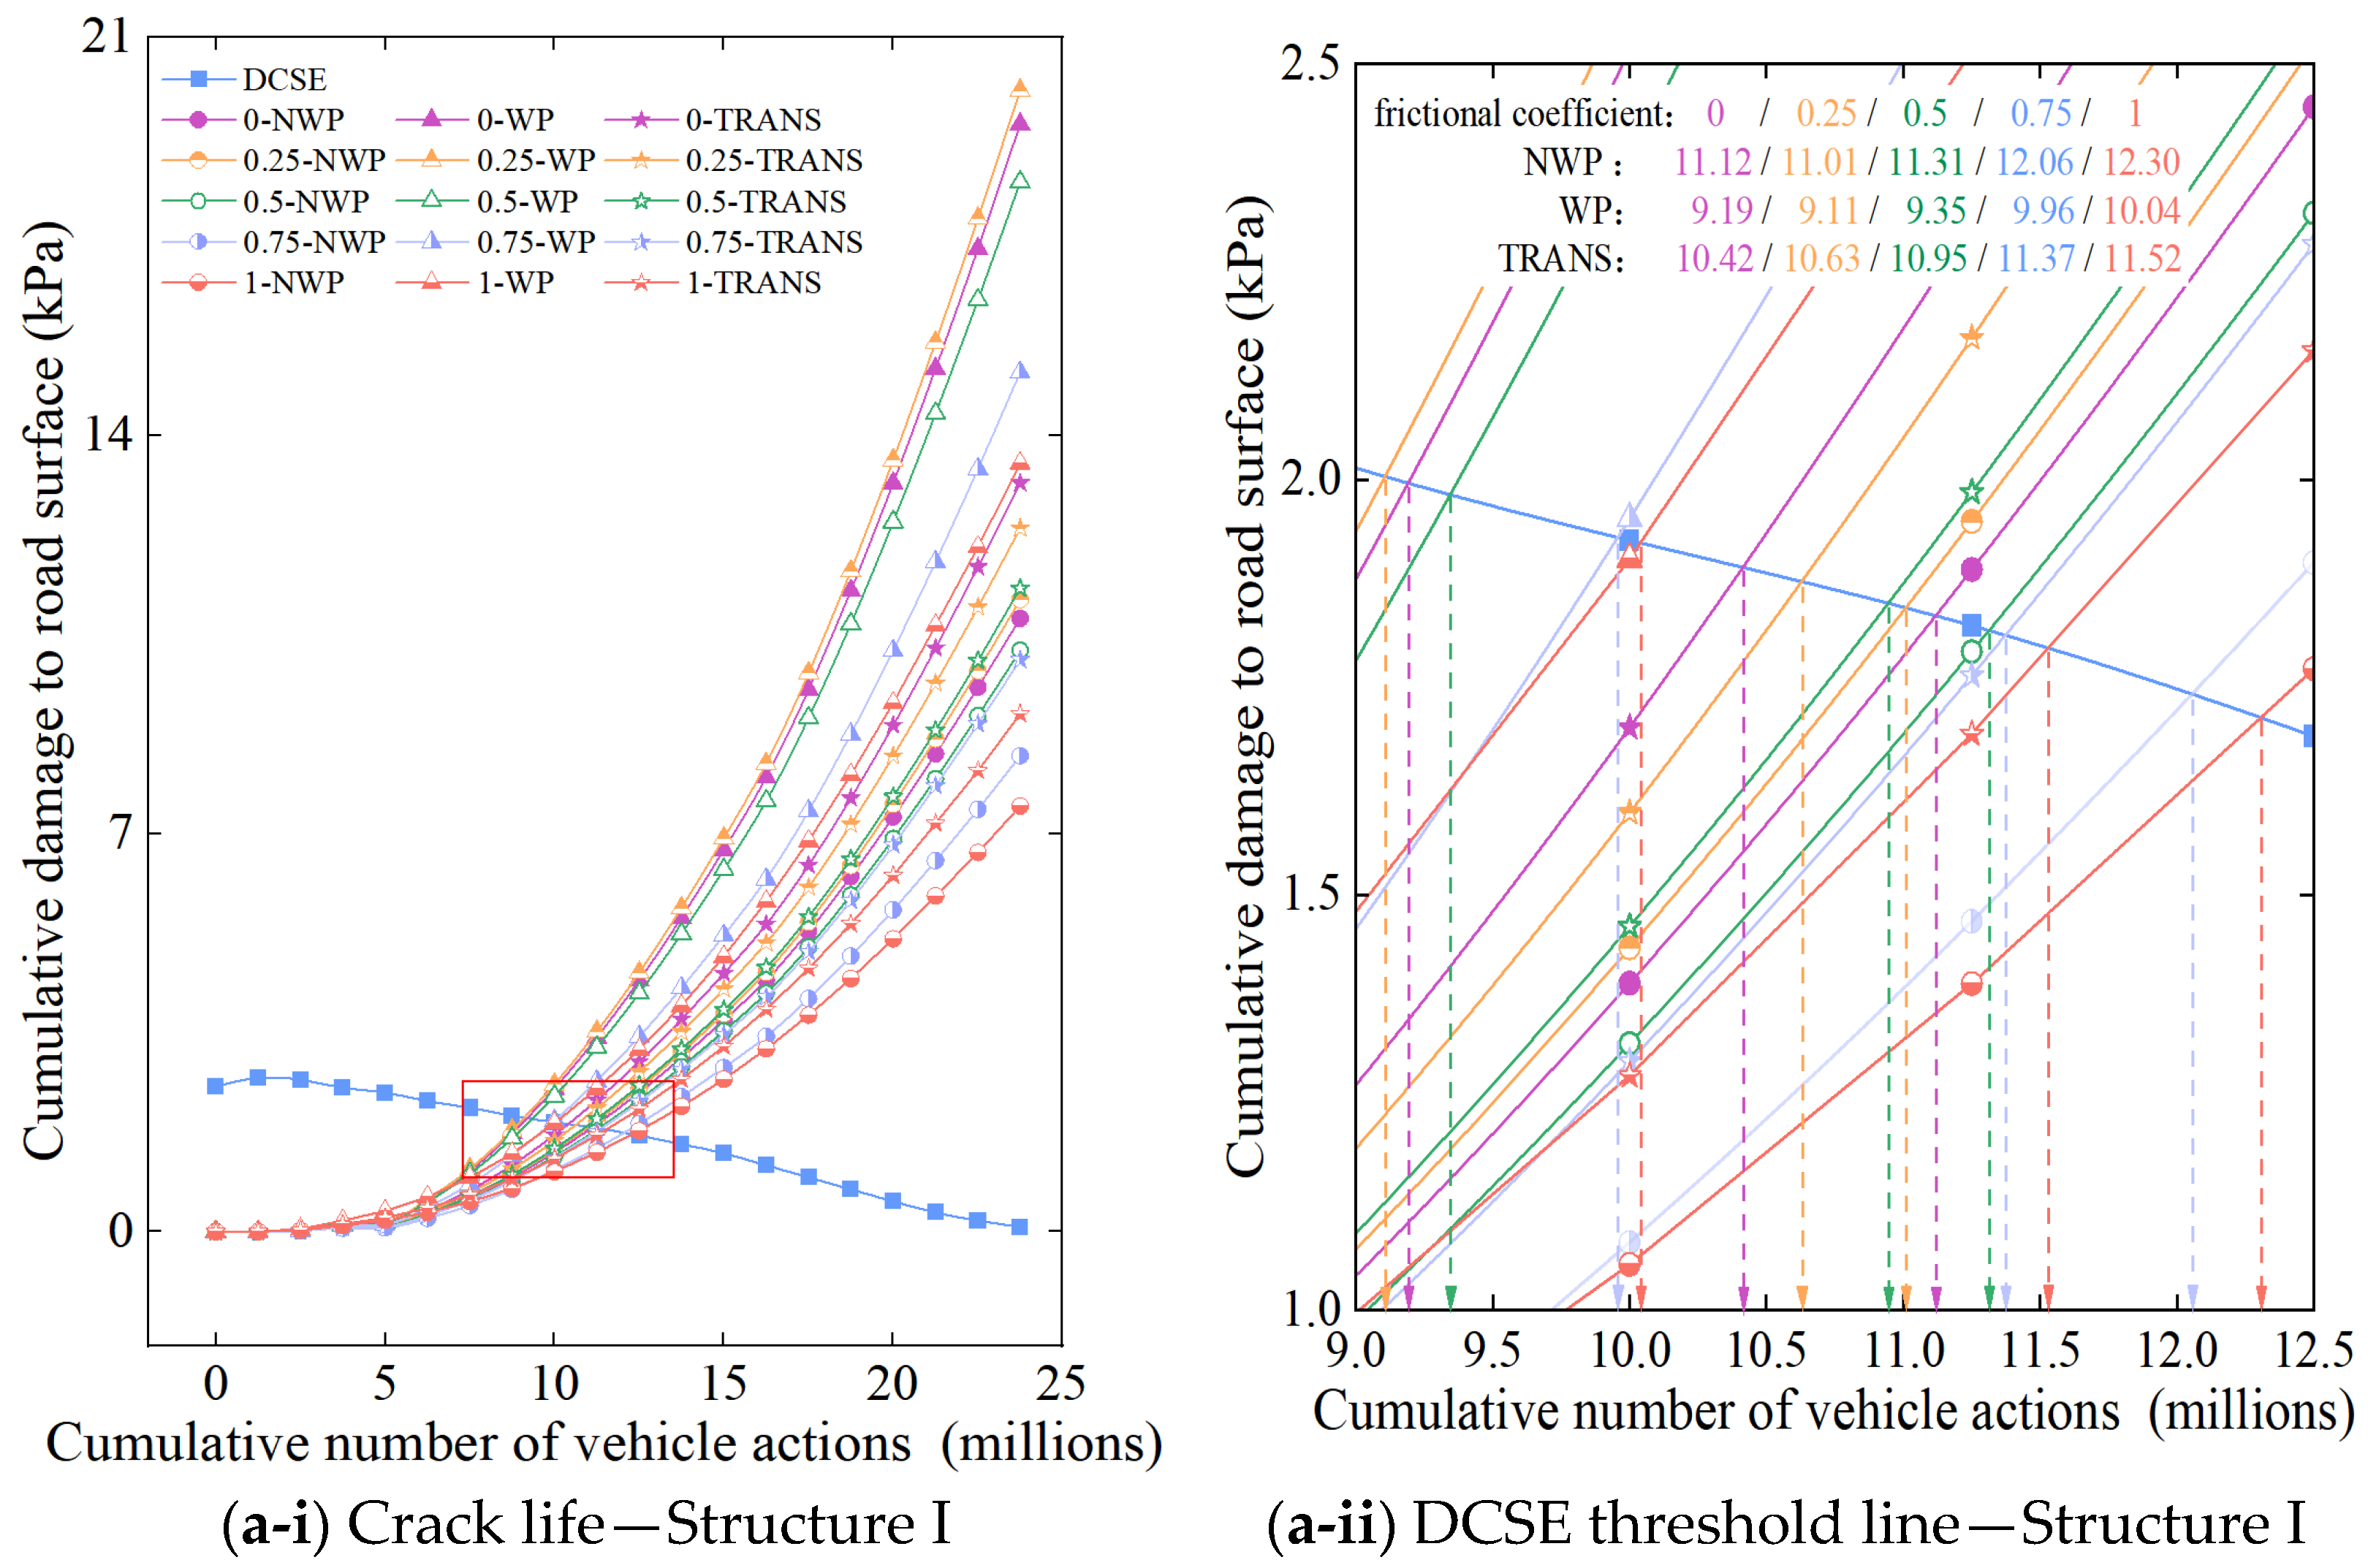
In the 3-D FE model, 0 and 1 were hypothetically assigned to represent the disengaged (i.e., fully unbonded) and fully bonded states between the two successive pavement structural layers. In the study, the friction coefficient was assumed to be between 0 and 1 with a 0.25 incremental sequence to allow for the investigation of the effects of interlayer friction on the pavement stress-strain responses and cracking performance. The lifetimes of crack initiation at each critical location on the top surfacing (upper) layer under different interlayer frictional conditions are shown in
Figure 15, where (a) indicates the original pavement Structure I, and (b) indicates the reconstructed pavement Structure II. On the other hand,
Figure 16 shows a 3-D plot of the surfacing (upper) layer’s crack life for the WP, NPW, and TRANS locations as a function of the pavement structure and friction coefficient (i.e., interlayer bonding condition).
As depicted in
Figure 16, the TDC crack initiation life exhibits a decreasing response trend in the longitudinal NWP zone, the longitudinal WP zone and the TRANS position as the interlayer bonding conditions between the pavement layers gradually deteriorated. Compared with the fully bonded interlayer condition (i.e., friction coefficient = 1.0), the reduction in the crack initiation life in the WP zone is more prominent in pavement Structures II, III, and V, with reduction percentages of 15.45%, 19.10%, and 13.94%, respectively, when fully debonded with a friction coefficient = 0.0. In the NWP zone, the crack initiation life decay is more prominent in pavement Structures III, IV, and V, with the percentage reductions reaching 16.79%, 10.63%, and 10.18%, respectively. For the TRANS location, the decline in the crack initiation life was more prevalent in pavement Structures III, IV, V, VI, and VIII, with the percentage reductions being 14.98%, 11. 86%, 13.33%, 10.62%, and 17.45%, respectively.
Computational results show that under different pavement structures, the crack initiation trend of the TDC in the surfacing (upper) layer is basically consistent with the results of the previous calculations. That is, under different interlayer states, the cracks are still being generated in the WP zone first, and the poorer the interlayer bonding condition, the smaller the crack initiation life is. With the gradual deterioration of the interlayer bonding state (i.e., the friction coefficient regressing towards zero), the degree of decay in the crack initiation life gradually increased and reached a peak reduction when full interlayer failure (i.e., complete debonding) occurred. This is partly due to the tensile stress distribution within the pavement structure being closer when the layers are partially and/or fully bonded. However, when the layers are fully debonded, the respective peaks of both the tensile and shear stresses within the pavement structure increase sharply at localized points—ultimately leading to rapid failure [
21]. Therefore, based on the deduced mechanisms of TDC, the crack initiation life in the surfacing (upper) layer of the pavement structure correspondingly decreases when the interlayer bonding state between layers deteriorates.
4.5. Energy Ratio (ER) and Crack Analysis
In this study, the ER concept was used to numerically illustrate the effects of fracture damage and quantitatively characterize the evolution of TDC in different model pavement structures. In general, the higher the ER value in magnitude, the better the cracking resistance potential of the asphalt mixture and the corresponding asphalt pavement structure. In the study, the transverse tensile stresses within the pavement layers were calculated using FE analysis under a standard wheel load based on the actual tire-pavement contact pressure (see
Figure 2). The DCSEmin calculations, on the other hand, were accomplished by combining the creep compliance parameters of the various respective asphalt mixtures for each corresponding pavement structure and layer, respectively. The results of these ER calculations are summarized in
Table 4.
Table 4, I~VIII in Column One denotes the surfacing (upper) layers of the eight pavement structures under different surfacing layer thicknesses and material combinations. When plotted, the ER response trends are shown in the bar charts in
Figure 17.
Considering the internal matrix structure and volumetric characteristics of the asphalt mixture itself (i.e., gradation, asphalt binder properties, aggregate properties, etc.) alone, an increase in the energy threshold (
) will inherently lead to an increase in the cracking resistance of the asphalt mixture. Compared to the reconstructed pavement Structures II and III, the energy threshold for the original pavement Structure I at 2.55 kPa was quantitatively the lowest. However, the energy thresholds of the reconstructed pavement Structures II and III are 27.06% and 47.06% higher than those of the original pavement Structure I, respectively. Theoretically, this suggests that the original pavement Structure I has the least ability to resist TDC among the three pavement structures and the top surfacing (upper) layer materials that were evaluated when subjected to similar environmental and loading conditions. The variation in the ER values of the asphalt mixtures at different aging times is illustrated in
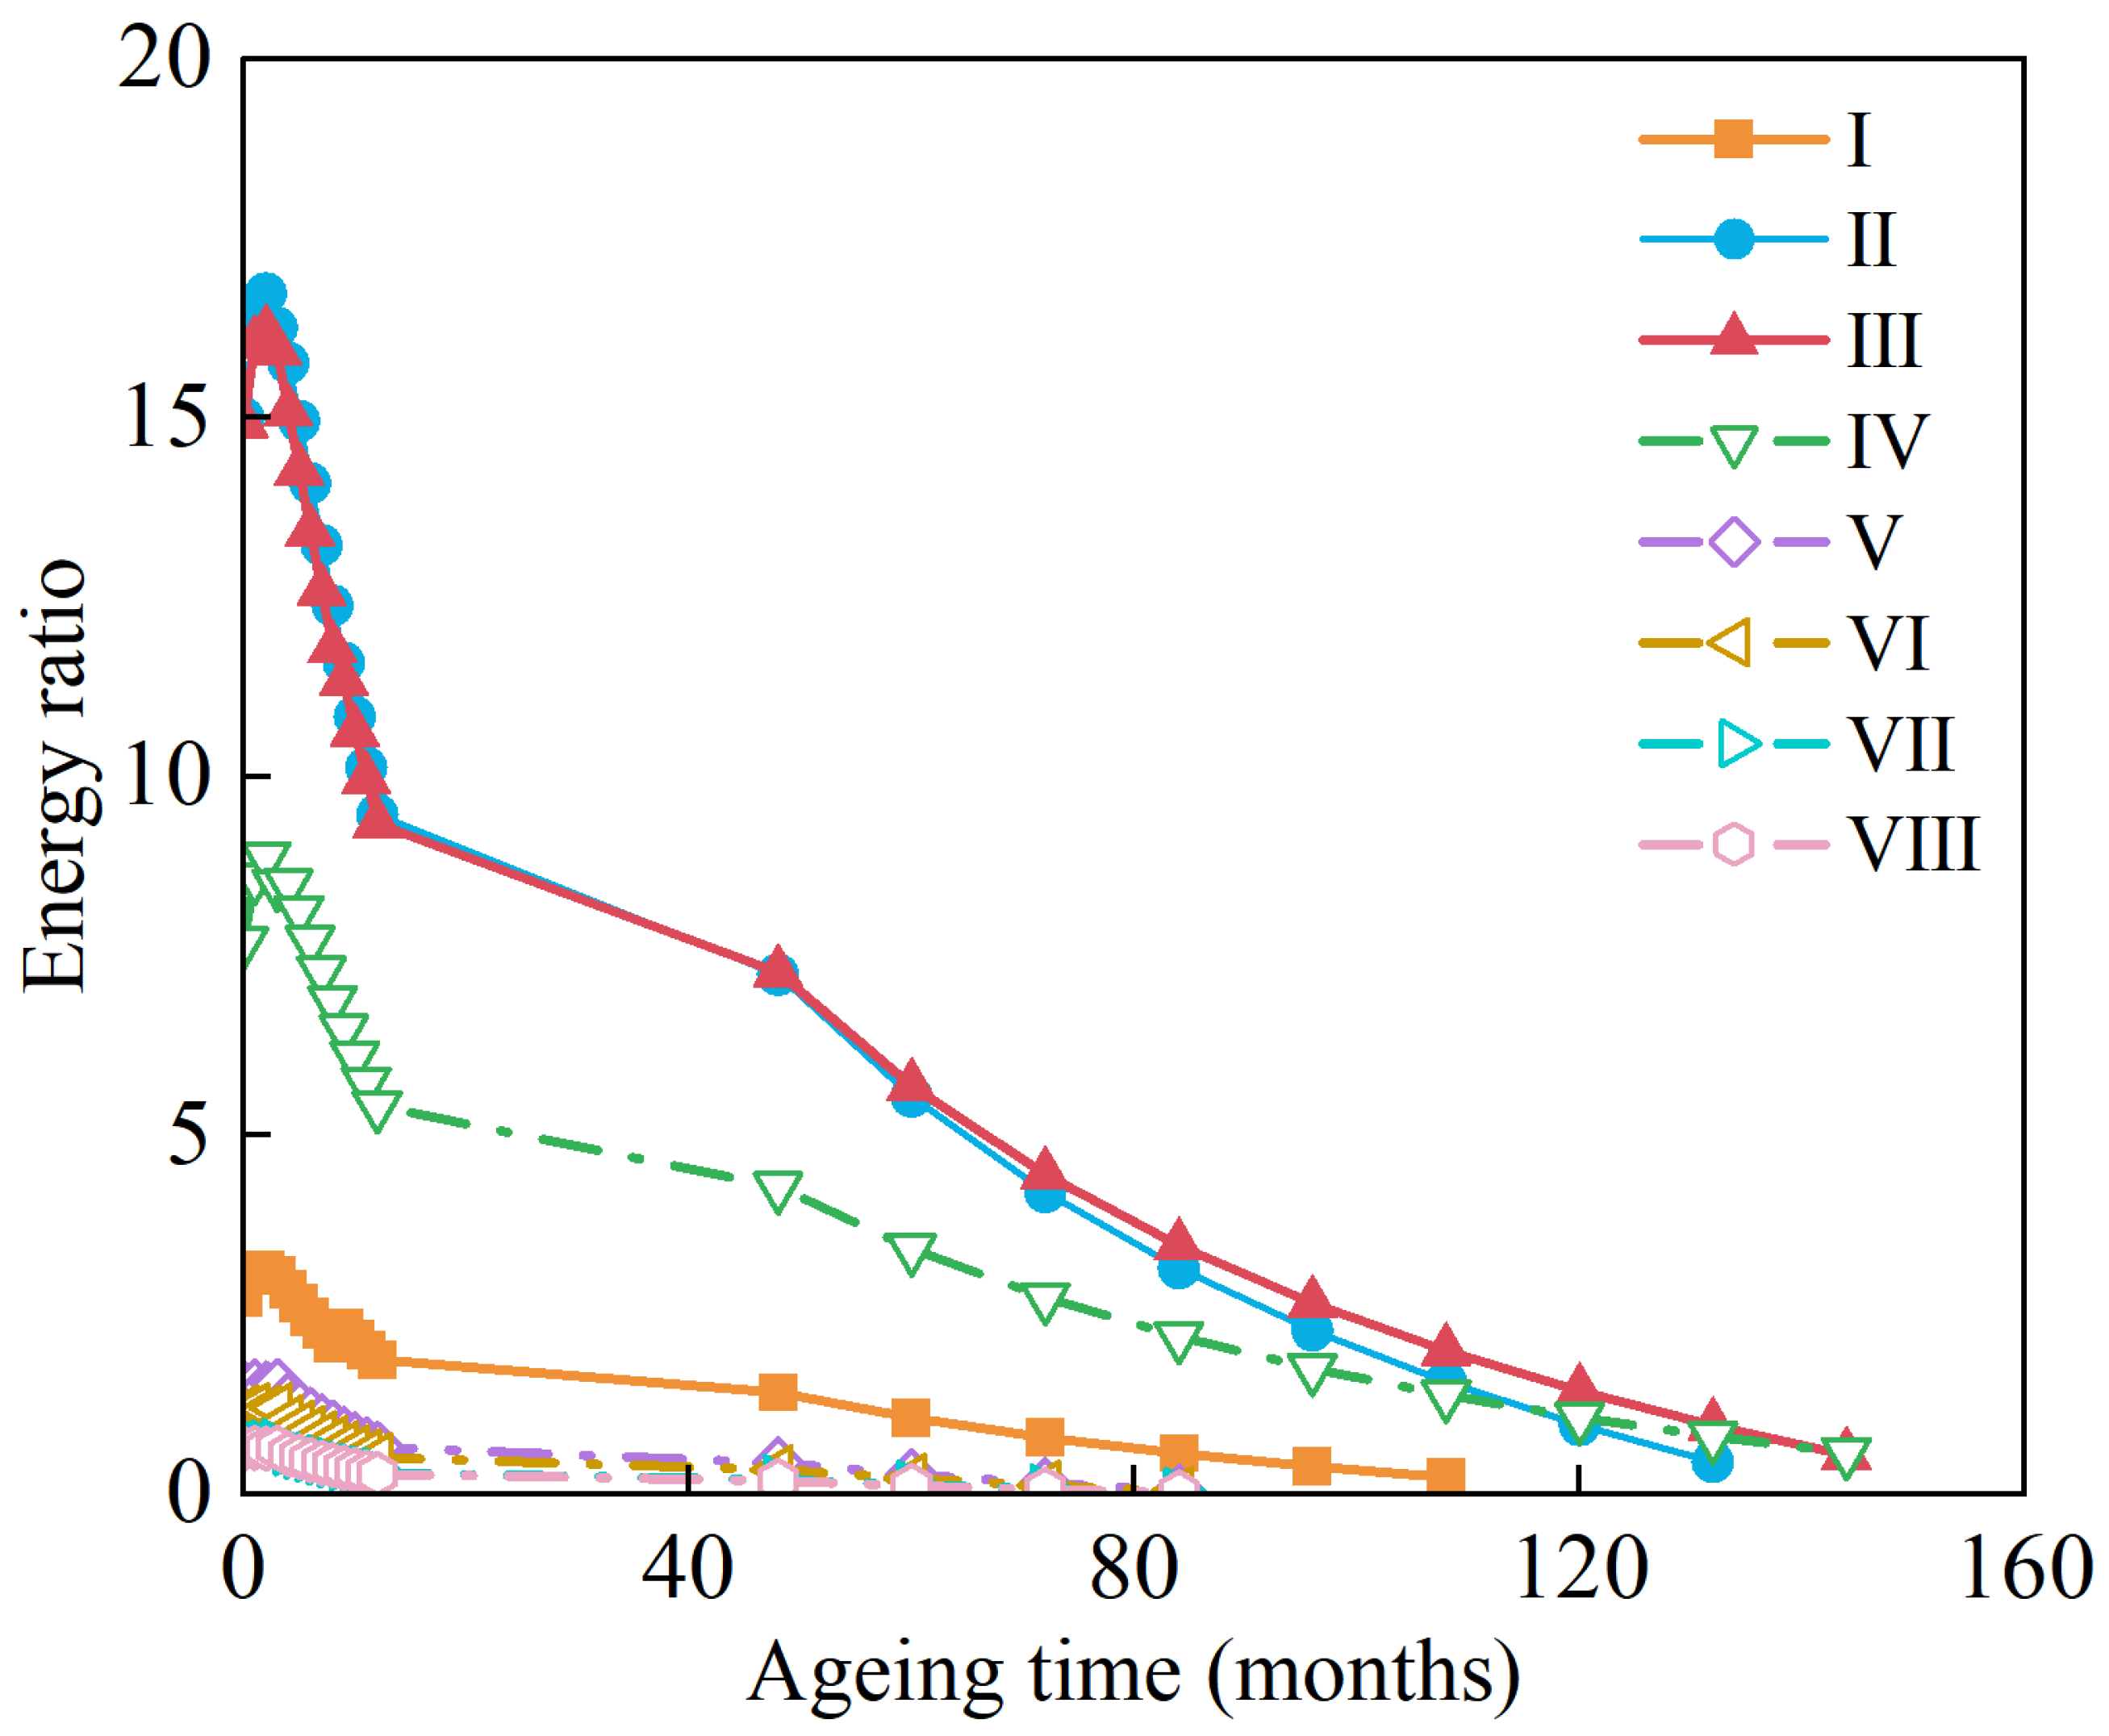
Figure 18.
As can be seen from the figure, throughout the process of changing with aging time, the ER values of the reconstructed pavement Structures II and III are much larger than that of the original pavement Structure I and the transition pavement Structures IV, V, VI, VII, and VIII, respectively. Comparing pavement Structures II and III from the pre-aging phase through to about 50 months, the ER values of the two pavement structures are comparably overlapping and indifferent. However, with more aging time exceeding 50 months, pavement Structure III tends to exhibit better cracking-resistance performance than pavement Structure II. Furthermore, the ER values of the different pavement structures all show a tendency to increase at zero months and then decrease with aging time. From the previous numerical results in
Section 4.2, it was seen that when AC-25 is used for the lower layer (namely pavement Structure I versus IV), the crack initiation life at the critical locations (i.e., 11.87, 14.21, and 13.24 million) is greater than that when ATB-25 is used (i.e., 10.04, 12.30, and 11.52 million), with the ER of pavement Structure IV (2.99) also being greater than that of pavement Structure I (2.55). When SAC-13 is used in the surfacing (upper) layer (namely pavement Structure I versus VI), the cracking life at critical locations (i.e., 10.07, 11.80, and 12.05 million) is comparable to that of SMA-16 (i.e., 10.04, 12.30, and 11.52 million), with the ER of pavement Structure I (2.99) also being greater than that of pavement Structure VI (2.55).
To summarize, considering the asphalt mixture properties and the pavement structural characteristics, the reduction in the surfacing (upper) layer thickness and change in surfacing (upper) layer materials resulted in a 61.35% increase in the ER of the rebuilt pavement Structure II and about 71.17% increase in the ER of the rebuilt pavement Structure III compared to the original pavement Structure I. Without a doubt, this theoretically suggests that the reconstructed pavement Structures II and III have better resistance to cracking than the original pavement Structure I.
5. Conclusions
This numerical study conducted modeling and simulative calculations on eight different hypothetical pavement structures, including the original (the municipal main road), two reconstructed, and five transition pavement structures. The study investigated the impact of different pavement structures and materials and various influencing parametric variables on TDC evolution and crack life. From the study results and findings, the main conclusions drawn are as follows:
(1) Macroscopically, cracks always first appeared at the WP, as theoretically expected. Among the eight pavement structures evaluated, the surfacing (upper) layer was consistently the first to develop cracks. Based on field investigations and numerical simulation results, it can be concluded that the type of cracks prevalent on the municipal main roads in Urumqi (China) is mostly TDC.
(2) Under the combination of the original surfacing (upper) layer thickness of 5/7/8 cm, replacing the underlying layer material ATB-25 with AC-25 significantly increases the cracking life—with a recorded increment of 16.23%, 13.77%, and 11.06% in the WP zone, NWP zone, and TRANS location, respectively. Furthermore, when the upper SMA-16 layer was replaced with SBS AC-13, whilst there was a slight reduction in cracking life in the NWP zone, an increase was observed in the WP zone and TRANS location. Notably, the change in the middle layer was more significant, with an average increase of 27.91%. Overall, using the AC-25 asphalt mixture instead of ATB-25 is structurally beneficial for improving resistance to TDC.
(3) Under the combination of the 4/6/7 cm reconstructed pavement structure, replacing SMA-16 with the slightly softer SMA-13 in the surfacing (upper) layer and ATB-25 with AC-25 in the lower layer led to a significant increase in the TDC life over the original pavement structure, with an average increment of 19.75%, 17.76%, and 10.46%, respectively. Compared with SBS AC-13, SMA (due to its superior mix-design volumetrics) was found to be more suitable for use as the surfacing (upper) layer material to mitigate TDC.
(4) After considering the effects of UV aging, the change pattern and response trends of the cumulative loaded-induced pavement damage were basically the same as those without UV aging consideration. In the different pavement structures evaluated, the TDC life in the different pavement layers exhibited a decreasing response trend with the influence of UV aging.
(5) Under different interlayer bonding conditions, cracks still appear in the WP zone first, with the crack initiation life exhibiting a correspondingly decreasing response trend as the interlayer bonding state gradually detdeterioratesn general, the poorer the interlayer bonding condition, the poorer the pavement structural integrity and the shorter the crack life.
(6) Based on its lower ER values, the findings indicated that the original pavement structure was less resistant to cracking when under similar environmental and loading conditions. When subjected to UV aging, the reconstructed pavement structures still exhibited superior performance with higher ER values than the original pavement structure. Whilst an increasing trend was noted in the pre-aging phase, the ER generally exhibited a declining response trend with aging time. For the two modified pavement structures, their ER values were comparably overlapping in the pre-aging phase, with pavement Structure III exhibiting superior performance (i.e., higher ER values) and better cracking resistance with more aging time exceeding 50 months.
This study analytically explored the evolution of TDC in roads in Urumqi (China) using seven different asphalt mixtures and two pavement structural layer thickness combinations. Therefore, more targeted research is still needed to enhance the model parameters and improve the reliability of the TDC prediction model in future follow-up studies. Model verification under different environmental and loading conditions, along with more field validation studies, are also recommended. Notably, the simulated cracking patterns showed qualitative consistency with field observations in Urumqi’s freeze-thaw environments, confirming the model’s applicability to regional conditions. Nonetheless, the study serves as a viable reference datum for numerically predicting the TDC life of asphalt pavements under various loading and environmental conditions. Additionally, the study also provides some insights into the potential materials, anti-aging agents, and pavement structural layer combinations to minimize TDC. Future studies may integrate machine learning with mechanical modeling to enhance practicality. For instance, combining finite element results with historical inspection data could train neural networks for rapid TDC prediction.


