Abstract
In this study, NiCuZn ferrites were prepared via a solid-phase method at a reduced sintering temperature of 925 °C. A composite additive system was developed by incorporating Bi2O3-MgO-Li2CO3-SiO2 (BMLS) glass with varying amounts of either CaTiO3 or BaTiO3, aiming to modify the magnetic performance and power loss behavior of the ferrites. The effects of BMLS-CaTiO3 (Group A) and BMLS–BaTiO3 (Group B) on the crystalline structure, density, electrical resistivity, microstructure, magnetic properties, as well as power loss were systematically investigated, and the underlying mechanisms were thoroughly discussed. Magnetic characterization revealed that the addition of BMLS-CaTiO3/BaTiO3 decreased the saturation magnetization (Ms) and permeability, primarily due to the magnetic dilution, as well as a reduction in density and grain size. However, the intrinsic coercivity increased, which can be attributed to the pinning of magnetic domain walls by the glass phase located at the grain boundaries and the reduction in crystallite size. The resistivity increased first and then decreased with the increasing content of CaTiO3/BaTiO3. When x = 0.1, samples in Group A and Group B reached the maximum values of 473.16 MΩ·m and 453.12 MΩ·m, respectively. Nonetheless, with an additive content of 0.05 wt%, samples in Group A and Group B still exhibited comparatively high Ms values of 53.93 emu/g and 54.65 emu/g, as well as high permeability values of 636.95 and 651.55, respectively. Meanwhile, power loss measurements indicated a notable reduction in total power loss across various frequencies and magnetic induction levels for both groups, with losses decreasing by more than 35%. Further analysis attributed these changes to enhanced grain uniformity, improved densification, and increased resistivity resulting from the incorporation of BMLS-CaTiO3/BaTiO3.
1. Introduction
In recent decades, NiCuZn ferrite has garnered a lot of interest in both academia and industry because of its numerous significant advantages, including high magnetic permeability, high frequency, low power loss, a simple preparation method, and so forth. NiCuZn ferrite has become a fundamental material in the field of electronic information [,,,]. Electronic devices are advancing rapidly with trends toward greater integration, miniaturization, and multifunctionality. In this context, low-temperature co-fired ceramic (LTCC) technology has emerged as a key enabling method to meet these objectives [,,,]. A fundamental requirement of LTCC processing is the co-firing of ferrite materials alongside silver electrodes, which necessitates that the sintering temperature remains below the melting point of silver (961 °C). However, conventional NiCuZn ferrite is unsuitable for LTCC applications due to its high sintering temperature, which exceeds 1400 °C [,,,]. Meanwhile, low sintering temperatures can also adversely affect ferrite performance through reduced homogeneity and compactness, increasing porosity and inadequate grain growth, which can lead to a dramatic decrease in the magnetic properties of NiCuZn ferrites [,]. Therefore, obtaining low-temperature sintered magnetic materials with favorable magnetic properties has been a focus of research over the past two decades.
Previous studies have demonstrated that incorporating low melting point oxides as agents can effectively reduce the sintering temperature of NiCuZn ferrites. Additives such as Bi2O3, V2O5, Co2O3, Nb2O5, and La2O5 facilitate the formation of a liquid phase during sintering, which significantly enhances atomic diffusion and promotes the development of a dense microstructure in the ferrite material [,,,,,]. For instance, Ji et al. investigated the influence of Bi2O3 on the electromagnetic properties of NiCuZn ferrites sintered at 925 °C. Their results indicated that the addition of 0.3 wt% Bi2O3 promotes grain growth and leads to a change in electromagnetic performance []. Shen et al. investigated the influence of Co2O3–Bi2O3 on the microstructure and electromagnetic properties of NiCuZn ferrites sintered at 925 °C. Their results demonstrated that the samples possessed outstanding magnetic performance []. Similarly, Huo et al. introduced a composite additive of La2O3–Bi2O3 into NiCuZn ferrites, and found that specimens sintered at 900 °C showed superior magnetic properties along with reduced power loss [].
The power loss characteristic of NiCuZn ferrites represents a critical performance parameter, garnering considerable academic and industrial interest in light of the advancing miniaturization and integration of modern electronic components. NiCuZn ferrites with a low power loss can dramatically reduce energy loss and enhance the electronic device efficiency [,,,,]. Related studies showed a strong correlation between the power loss and resistivity []. High resistivity could make a contribution to decreasing the eddy current loss, thereby reducing the total power loss [,,]. It is possible to increase the resistivity of NiCuZn ferrites by adding high resistivity and high melting point additives []. During the process of sintering NiCuZn ferrites, these high resistivity and high melting point additives could be enriched in the grain boundary and thus increase the resistivity [,,].
According to the principles of glass formation, the Bi2O3-MgO-Li2CO3-SiO2 (BMLS) glass system exhibits a low softening temperature, making it a potential sintering aid for reducing the sintering temperature [,]. Meanwhile, CaTiO3 and BaTiO3 are perovskite-type compounds known for their high electrical resistivity and high melting points, which are desirable for suppressing power loss in NiCuZn ferrites. Figure 1 gives the crystal structure diagram of CaTiO3 and BaTiO3, which belong to the cubic crystal system and are composed of titanium/oxygen octahedra and barium/calcium/oxygen dodecahedra. Currently, limited studies have been reported on the combined effects of BMLS glass with either CaTiO3 or BaTiO3 as composite additives on the magnetic properties and power loss behavior of NiCuZn ferrites. Moreover, the underlying mechanism responsible for reducing power loss remains insufficiently explored.
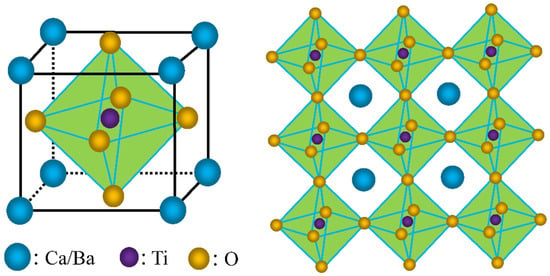
Figure 1.
Crystal structure of CaTiO3 and BaTiO3.
In this study, BMLS glass was initially synthesized and then incorporated with CaTiO3 or BaTiO3 to form composite additives aimed at modulating the magnetic performance and power loss properties of NiCuZn ferrites. Some studies have reported that the Ms of NiCuZn ferrites ranges from 40 to 78 emu/g, while the intrinsic coercivity falls within 8–32 Oe [,,]. In this work, compared with some reported samples, the addition of 3 wt% BMLS resulted in an increase in Ms and a decrease in intrinsic coercivity. This change is attributed to the liquid phase formed by BMLS during sintering, which facilitates densification through enhanced ion dissolution and mass transport [,]. Therefore, the content of BMLS glass was fixed at 3.0 wt%. The concentrations of CaTiO3 or BaTiO3 were varied at 0.02 wt%, 0.05 wt%, 0.08 wt%, 0.10 wt%, and 0.15 wt%. Ni0.22Cu0.18Zn0.6Fe1.98O4 ferrites were prepared via the solid-state reaction method. The impacts of the BMLS–CaTiO3/BaTiO3 composites on the crystal structure, bulk density, electrical resistivity, microstructure, magnetic properties, and power loss characteristics of the ferrites were systematically investigated. Additionally, the relevant mechanisms were discussed in detail.
2. Materials and Methods
2.1. Materials
High-purity raw materials, including NiO, CuO, ZnO, Bi2O3, MgO, Li2CO3, SiO2 (all ≥99.9%), Fe2O3, CaTiO3, BaTiO3 (all ≥99.5%), and polyvinyl acetate (analytical reagent grade), were sourced from Sinopharm Chemical Reagent Co., Ltd. (Shanghai, China) and used in the experiments. Table 1 gives the typical properties of CaTiO3 and BaTiO3.

Table 1.
Typical properties of CaTiO3 and BaTiO3.
2.2. Fabrication of BMLS Glass
BMLS glass was synthesized using Bi2O3, MgO, Li2CO3, and SiO2 as raw materials in a specific mass ratio. After precise weighing and thorough mixing, the mixture was melted at 1500 °C for 4 h. It was then cooled naturally to room temperature. The resulting solid was pulverized and homogenized using a ball mill (Hunan Focucy Experimental Instrument Co., LTD, Changsha, China). Finally, the powdered material was annealed at 80 °C for 2 h to obtain the final BMLS glass product.
2.3. Fabrication of NiCuZn with Added BMLS-CaTiO3/BaTiO3 Composites
The composites with a formula of (97 − x) wt% NiCuZnFe1.98O4 − 3 wt% BMLS glass − x wt% MTiO3 (M = Ca or Ba) were synthesized via a solid-state reaction route. Initially, the raw materials were weighed and mixed with deionized water using a ball mill operated at 250 rpm for 24 h. The resulting mixture was dried and subsequently calcined at 800 °C for 3 h. Then, 3.0 wt% BMLS along with different amounts of CaTiO3 or BaTiO3 (0.00 wt%, 0.02 wt%, 0.05 wt%, 0.08 wt%, 0.10 wt%, and 0.15 wt%) were added to the calcined powder, followed by another 24 h milling step at 250 rpm. After drying, the powder was granulated using 10 wt% polyvinyl acetate (PVA) as a binder and then pressed into toroidal shapes under a pressure of 8 MPa. Finally, the samples were sintered at 925 °C for 3 h to obtain the NiCuZn ferrites containing BMLS-CaTiO3/BaTiO3. The prepared samples were categorized into two groups: Group A corresponded to BMLS-CaTiO3, and Group B to BMLS-BaTiO3.
2.4. Characterization
An X-ray diffractor XRD (Miniflex 600, Rigaku Corporation, Tokyo, Japan) with a copper tube (Kα, λ = 1.54 Å) was employed to identify the crystalline phase of the as-prepared NiCuZn samples. A scanning electron microscope SEM (FEI Quanta 400FEG, Thermo Fisher Scientific Inc., Waltham, MA, USA) operating at an accelerating voltage of 10 kV was employed to obtain the microstructure of the samples. An energy dispersive X-ray spectroscopy (EDS, Bruker, Bruker Corporation, Billerica, MA, USA) was employed to examine the chemical compositions of as-prepared NiCuZn ferrites under 10 kv accelerating voltage with 7.5 nm beam current. Based on Archimedes method, the bulk density of samples was measured in distilled water. A TH2683A (ChangZhou TongHui Electronic Co., Ltd, Changzhou, China) resistivity tester was used to measure the electrical resistivity of the specimens. The quality factor (Q-factor) and complex magnetic permeability were characterized using an Agilent E4991B RF (Keysight Technologies Inc., Santa Rosa, CA, USA) impedance analyzer. Magnetic hysteresis loops, intrinsic coercivity (Hc), and saturation magnetization (Ms) were acquired via a vibrating sample magnetometer (VSM, Lake Shore Cryotronics, Ltd, Westerville, OH, USA). The power loss (Pcv) of the ferrite samples was measured with an Iwatsu B-H analyzer SY8232 (Iwatsu Electric Co., Ltd., Tokyo, Japan).
3. Results and Discussion
Figure 2 presents the XRD patterns of two series of NiCuZn samples containing 3.0 wt% BMLS combined with x wt% CaTiO3/BaTiO3 (where x = 0.00, 0.02, 0.05, 0.08, 0.10, and 0.15). As the concentrations of CaTiO3/BaTiO3 increase from 0.00 wt% to 0.15 wt%, both groups A and B maintain similar XRD profiles without significant changes. Diffraction peaks associated with the (220), (331), (222), (400), (422), (511), and (440) planes match well with the reference pattern JCPDS-52-278. The XRD pattern of the samples confirms the formation of a single-phase cubic spinel structure, with no detectable secondary phases, which is also consistent with previous studies [,]. Meanwhile, as listed in Table 2, the lattice constant (a) was obtained by using the Rietveld method, exhibiting a decrease with increasing Ca/BaTiO3 content for both groups. This observed lattice contraction can be rationalized by two primary mechanisms: (i) the incorporation of smaller cations into the spinel lattice, potentially substituting for larger Fe3+ ions; and (ii) the introduction of compressive lattice strain due to the presence of the secondary Ca/BaTiO3 and glass phases at the grain boundaries, which hinders lattice expansion [,]. Furthermore, the micro-strain (ε) and crystallite size (t) were estimated using the software program FullProf. As the additive content increases, the strain (ε) gradually increases, while the crystallite size (t) demonstrates a reduction with higher additive content. These trends indicate that the incorporation of CaTiO3 or BaTiO3 additives induces compressive lattice strain, likely due to ionic substitutions or the introduction of stress fields within the ferrite structure, leading to lattice contraction. The progressive decline in crystallite size suggests that the additives inhibit grain growth, possibly through segregation at grain boundaries or by altering nucleation dynamics [,].
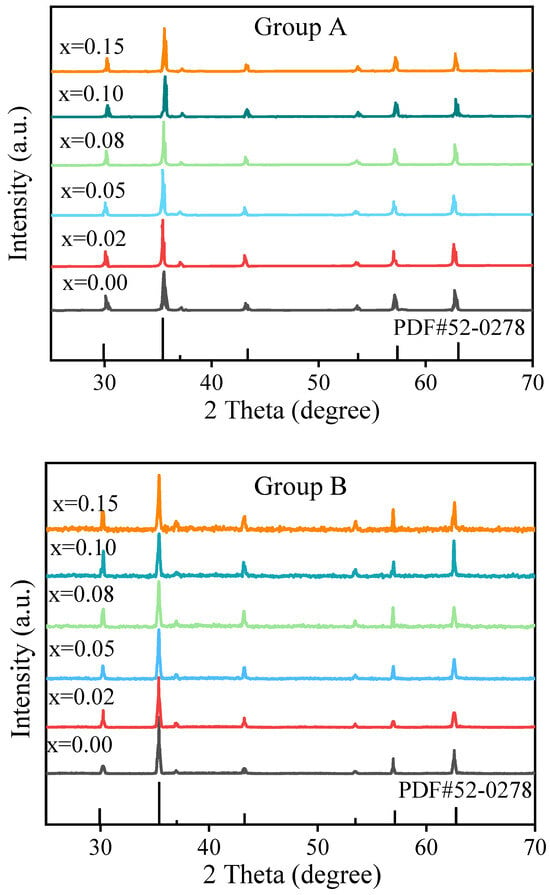
Figure 2.
XRD patterns of NiCuZn ferrites with composite additives. The composition follows the formula: (97 − x) wt% NiCuZnFe1.98O4 − 3 wt% BMLS glass − x wt% MTiO3 (M = Ca or Ba). All samples exhibit a single-phase cubic spinel structure, and no secondary phases are detected with varying x.

Table 2.
Variation of lattice constant, strain (ε), and crystallite size (t) of the NiCuZn ferrites with BMLS-Ca/BaTiO3.
Figure 3 and Figure 4 depict the SEM images of the NiCuZn sample surfaces with added 3.0 wt% BMLS and different contents of CaTiO3/BaTiO3, respectively. Figure 3 and Figure 4 show that the addition of CaTiO3 or BaTiO3 resulted in similar changes in the grain size homogeneity and densification degree in the sintered NiCuZn ferrites. When the content of CaTiO3 or BaTiO3 increased from 0.02 wt% to 0.15 wt%, the grain size and densification degree of NiCuZn samples in group A and group B gradually decreased, and the grain size homogeneity initially improved and then deteriorated. CaTiO3 and BaTiO3 both have a relatively high melting point (over 1500 °C), which is much higher than the sintering temperature of 925 °C in this work. As a result, these high melting point additives were difficult to melt and existed in solid form during the sintering process, hindering material diffusion and grain growth. This resulted in a gradual reduction in the grain size of the NiCuZn samples, which is also consistent with the results shown in Table 2 [,,].
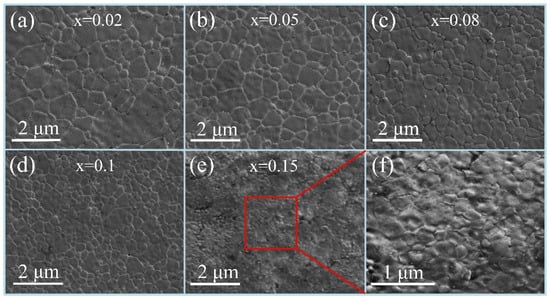
Figure 3.
SEM images of NiCuZn ferrites with 3.0 wt% BMLS and varying amounts of CaTiO3 (x wt%). The composition parameter x represents the weight fraction of CaTiO3 in the composite additive system. The images show the evolution of grain size and uniformity as x increases: (a) x = 0.02, (b) x = 0.05, (c) x = 0.08, (d) x = 0.10, (e) x = 0.15. (f) is a local magnification of (e).
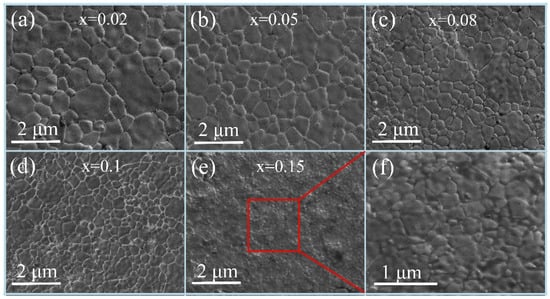
Figure 4.
SEM images of NiCuZn ferrites with 3.0 wt% BMLS and varying amounts of BaTiO3 (x wt%). The composition parameter x represents the weight fraction of BaTiO3 in the composite additive system. The images show the evolution of grain size and uniformity as x increases: (a) x = 0.02, (b) x = 0.05, (c) x = 0.08, (d) x = 0.10, (e) x = 0.15. (f) is a local magnification of (e).
Specifically, when x = 0.02, Figure 3a and Figure 4a showed that both large-sized and small-sized grains were simultaneously present in NiCuZn ferrite. The reason may be attributed to the relatively low content of CaTiO3 or BaTiO3, which exhibited a limited effect of crystal growth inhibition on grain growth. At a content of 0.05 wt% CaTiO3 or BaTiO3 (Figure 3b and Figure 4b), although the grain size decreased slightly, the grain size homogeneity was significantly improved compared to that in Figure 3a and Figure 4a, which indicated that the appropriate content of CaTiO3 or BaTiO3 was 0.05 wt%. When x = 0.08, 0.10, and 0.15, it can be observed that as the content of CaTiO3 or BaTiO3 further increased, the grain size and densification degree of the NiCuZn samples decreased rapidly. In particular, when x = 0.15, it was almost impossible to distinguish the grain morphology from Figure 3e and Figure 4e. The SEM images in Figure 3f and Figure 4f were locally enlarged images of Figure 3e and Figure 4e, respectively. From the local enlarged images, it could be seen that the grain size of the NiCuZn samples in group A and group B both became very small, and the grain boundaries also became very blurred. This is mainly due to the excessive addition of CaTiO3 or BaTiO3, which utilizes the effect of crystal growth inhibition to make the diffusion of the liquid-phase material difficult during the sintering process, resulting in the formation of small-sized grains, blurred grain boundaries, and decreased densification degree []. The microstructure characterization indicates that the addition of CaTiO3 or BaTiO3 significantly changes the grain size, homogeneity, and densification degree of the NiCuZn ferrites. When the content of CaTiO3 or BaTiO3 is 0.05 wt%, the NiCuZn samples in group A and group B both obtained relatively uniform grain size and dense microstructure.
Here, a more detailed discussion on the interaction between the BMLS glass and the CaTiO3/BaTiO3 phases during sintering is warranted to elucidate the microstructural evolution. Based on the XRD results (Figure 2), which show no evidence of secondary crystalline phases beyond the spinel structures, it is inferred that the interaction is likely dominated by physical processes. Referring to the previous studies [,,], the low softening point of the BMLS glass contributes to the formation of a liquid phase at the sintering temperature. This liquid phase is expected to wet the surfaces of both the NiCuZn ferrite and the CaTiO3/BaTiO3 particles, and can effectively dissolve and transport ions, facilitating densification through liquid-phase sintering. However, due to the high melting point, CaTiO3/BaTiO3 particles are effectively pinned by the glassy phase at the grain boundaries. This creates a pinning effect that powerfully inhibits the growth of the ferrite grains, resulting in the significantly reduced grain size with the increasing CaTiO3/BaTiO3 contents as shown in the SEM images (Figure 3 and Figure 4).
Figure 5 further presents the EDS surface distribution images of the typical elements, including Ni, Cu, Zn, Fe, Bi, Ca, and Ba in the NiCuZn samples with added 3.0 wt% BMLS and 0.05 wt% CaTiO3 or BaTiO3. It can be seen that all characteristic elements were evenly distributed in the measured area. Ca and Ba elements appeared in the as-prepared NiCuZn samples in Group A and Group B, respectively, indicating that the additive was effectively composited into the NiCuZn ferrites, which played a significant role in the modification of the microstructure and magnetic properties.
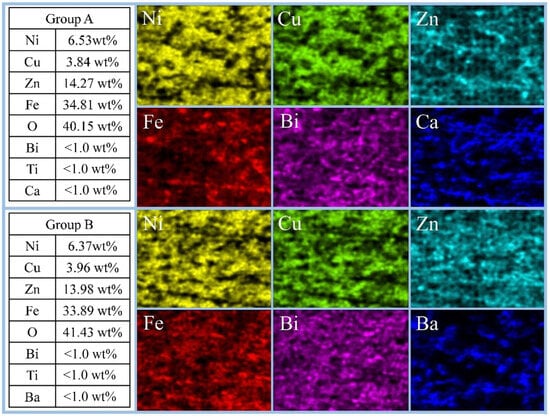
Figure 5.
EDS elemental mapping of NiCuZn ferrites with the composite additive at x = 0.05 wt%. The distribution of characteristic elements (Ni, Cu, Zn, Fe, and Bi) and the respective additive elements (Ca for Group A, Ba for Group B) confirms their homogeneous distribution within the ferrite matrix, indicating effective compositing.
Figure 6 displays the variation in the bulk density of NiCuZn ferrites. Both Group A and Group B samples exhibited a similar declining trend in bulk density as the concentration of either CaTiO3 or BaTiO3 was increased from 0.00 wt% to 0.15 wt%. The decrease occurred gradually at lower additive amounts; for instance, when x increased from 0.00 to 0.05, the density reduction was modest, with a reduction of 0.66% and 0.48% for Group A and Group B, respectively, relative to the NiCuZn with added BMLS samples. A more rapid reduction occurred around x = 0.08, where densities fell to approximately 5.09 g/cm3. By x = 0.15, the bulk densities in both groups reached their minimum values.
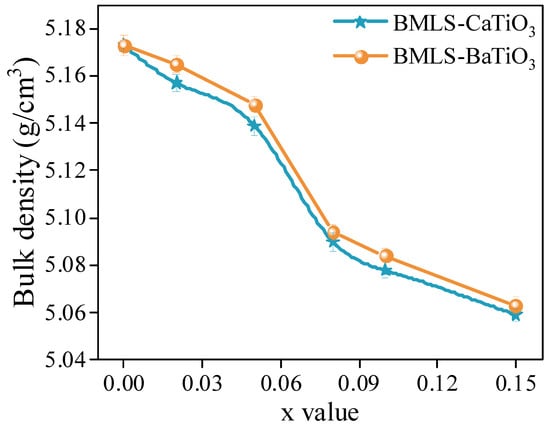
Figure 6.
Variation in the bulk density of NiCuZn ferrites as a function of the MTiO3 content (x wt%). The composition follows the formula: (97 − x) wt% NiCuZnFe1.98O4 − 3 wt% BMLS glass − x wt% MTiO3 (M = Ca or Ba). A general decreasing trend in density is observed with increasing x for both Groups A and B.
Generally, the bulk density of NiCuZn ferrites is closely related to their sintered densification behavior and final grain size. The small grain size and low densification degree indicate that NiCuZn ferrite has a low bulk density [,]. The SEM images of the microstructure displayed in Figure 3 and Figure 4 revealed that as the content of CaTiO3 or BaTiO3 increased, the effect of crystal growth inhibition became more pronounced, resulting in a gradual reduction in grain size and densification of the NiCuZn ferrite. In particular, when x = 0.08 and 0.15, the grain size of the NiCuZn samples decreased sharply. Therefore, corresponding to the results in Figure 6, the bulk density of the NiCuZn sample in group A and group B both showed a rapid decrease when x = 0.08 and 0.15. Moreover, it was also found that the bulk density of NiCuZn containing BMLS-CaTiO3 was lower than that of NiCuZn containing BMLS-BaTiO3 when the additive content was the same. This may be attributed to the density difference between CaTiO3 and BaTiO3. Since CaTiO3 has a lower density (4.1 g/cm3) than BaTiO3 (6.08 g/cm3), when the additive content was the same, CaTiO3 could occupy larger spatial positions and exhibited a more significant effect of crystal growth inhibition, resulting in more grain boundaries formed and smaller grains generated than BaTiO3, whereby the degree of densification decreased sharply. As a consequence, the NiCuZn sample with added BMLS-CaTiO3 had a lower bulk density than the NiCuZn sample with added BMLS-BaTiO3 at the same additive content. Furthermore, a synergistic effect on the microstructure is evident when correlating the bulk density, lattice strain, and grain size. The decline in density, coupled with the increasing microstrain and decreasing grain size, consistently points towards the role of Ca/BaTiO3 additives in inhibiting densification and grain growth through a pinning mechanism, ultimately resulting in smaller grain sizes and higher porosity in the structure.
Figure 7 illustrates the variation in resistivity of NiCuZn samples. Notably, the resistivity exhibited a non-monotonic behavior, initially rising and subsequently declining as the concentration of either CaTiO3 or BaTiO3 was increased. When x = 0.10, the NiCuZn samples in group A and group B obtained the maximum values, respectively. In general, a grain boundary has a much higher resistivity than a microcrystal. Thus, the resistivity of NiCuZn ferrite is primarily determined by the grain boundary [,,]. The results in Figure 3 and Figure 4 indicated that the grain size of the NiCuZn samples gradually decreased as the additive content increased, indicating an obvious increase in the number of grain boundaries, thereby significantly improving the resistivity of the NiCuZn samples. Meanwhile, due to the relatively high melting point and high resistivity, CaTiO3 or BaTiO3 could be enriched at the grain boundary during the sintering process, which could further increase the resistivity of the NiCuZn samples [,,,]. Therefore, the resistivity of the NiCuZn samples showed an increasing variation trend with the increasing additive content. However, when the content of additives reached 0.15 wt%, excessive addition of CaTiO3 or BaTiO3 not only reduced the grain size, but also increased the porosity of the NiCuZn ferrites, which could significantly decrease the densification degree and the number of grain boundaries []. Therefore, a reduction in the resistivity was observed when x = 0.15. In addition, it was also found that NiCuZn containing BMLS-CaTiO3 exhibited a higher resistivity than NiCuZn containing BMLS-BaTiO3 when the x value was the same. This finding may be related to the fact that CaTiO3 contributed to a more significant effect of crystal growth inhibition to increase the number of grain boundaries and reduce the grain size (analyzed and confirmed by Figure 3, Figure 4, and Figure 6), thereby greatly improving the resistivity.
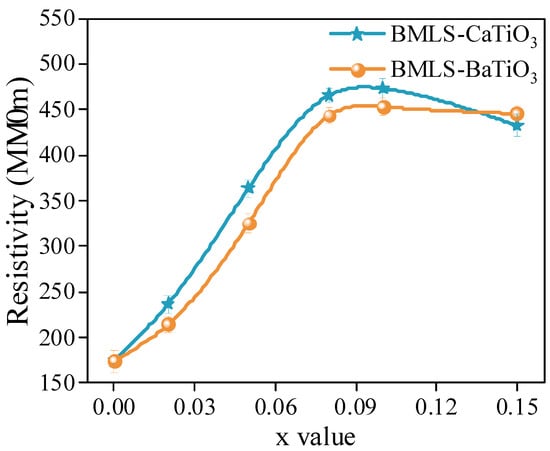
Figure 7.
Dependence of the electrical resistivity of NiCuZn ferrites on the MTiO3 content (x wt%). The resistivity exhibits a non-monotonic behavior, initially increasing and then decreasing, with a maximum value achieved at x = 0.10 wt% for both groups.
Figure 8 displays the initial magnetization curves and the variation trends of saturation magnetization (Ms) and intrinsic coercivity (Hc) for NiCuZn samples with added BMLS-CaTiO3/BaTiO3. As shown in Figure 8a,c, all samples exhibit typical ferrimagnetic hysteresis behavior under an applied magnetic field. Both figures indicate that the incorporation of either CaTiO3 or BaTiO3 significantly influences the saturation magnetization of the NiCuZn ferrites. The corresponding values of Ms and Hc for samples in groups A and B are quantitatively provided in Figure 8b,d, respectively. It can be seen that with the content of CaTiO3 or BaTiO3 increased, the Ms of the NiCuZn samples in two groups both decreased at first, then increased slightly, and finally decreased rapidly again. However, the Hc of the two kinds of NiCuZn samples exhibited the exact opposite variation trend. When x = 0.05, the Ms of NiCuZn samples in group A and Group B reached the values of 53.93 emu/g and 54.65 emu/g, respectively, which were reduced by 5.88% and 4.62% as compared with the Ms value when x = 0.00. At the same time, the Hc of the NiCuZn samples in two groups also exhibited a relatively low value of 34.4 Oe, and 33.7 Oe, respectively.
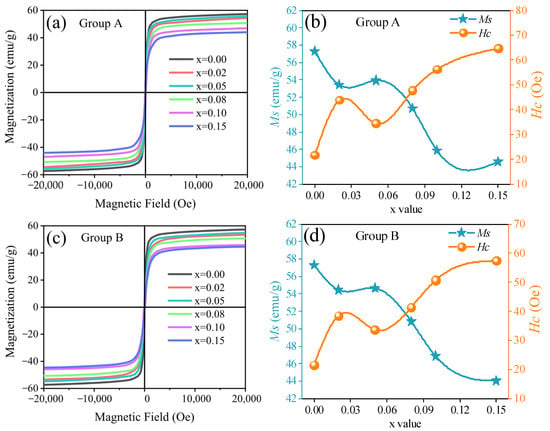
Figure 8.
Magnetic properties of NiCuZn ferrites with added BMLS-CaTiO3/BaTiO3. (a,c) initial magnetization curves measured at room temperature. (b,d) Variation in saturation magnetization (Ms, in emu/g) and intrinsic coercivity (Hc, in Oe) as a function of the MTiO3 content (x wt%).
It has been established that the Ms and Hc are closely linked to the composition, density, and uniformity of grain size [,]. As evidenced by the XRD patterns in Figure 2 and the EDS results in Figure 5, the primary phase composition of the NiCuZn samples remained consistent. Therefore, the variations in Ms and Hc were mainly influenced by differences in density and grain size distribution. Generally, NiCuZn ferrites possessing high density and homogeneous grain morphology demonstrate superior magnetic performance, characterized by high Ms and low Hc [,]. However, as shown in Figure 3, Figure 4 and Figure 6, the incorporation of CaTiO3 or BaTiO3 led to a reduction in both grain size and density of the NiCuZn ferrites. Consequently, as the value of x increased from 0.00 to 0.15, Ms displayed a declining trend, while Hc progressively increased. However, when further comparing the Ms and Hc between x = 0.02 and x = 0.05, it was found that 0.05 wt% CaTiO3 or BaTiO3 samples exhibited increased magnetic properties than 0.02 wt% CaTiO3 or BaTiO3 samples. The microstructure of the NiCuZn samples is shown in Figure 3b and Figure 4b and demonstrates that although the grain size was slightly reduced as compared to that shown in Figure 3a and Figure 4a, the uniformity of the grain size was greatly enhanced when x = 0.05. Here, when x = 0.05, the positive influence induced by the enhanced grain size uniformity made a greater impact on the Ms and Hc than the negative influence induced by the reduced density. As a consequence, NiCuZn samples containing 0.05 wt% CaTiO3 or BaTiO3 exhibited a higher Ms and a lower Hc than NiCuZn samples containing 0.02 wt% CaTiO3 or BaTiO3. When x exceeded 0.05, the Ms decreased rapidly and Hc increased sharply, which may be attributed to that the excessive addition of CaTiO3 or BaTiO3 resulted in a rapid deterioration of the grain size uniformity and density. Furthermore, the evolution of Hc and Ms should also be interpreted in light of the crystallite size revealed by Rietveld refinement (Table 2) and the effective fraction of magnetic material in the composite. The continuous decrease in crystallite size (t) with increasing x contributes significantly to the observed increase in Hc. According to the single-domain particle model, finer crystallites enhance the pinning of magnetic domain walls, thereby increasing the Hc []. Meanwhile, the incorporation of non-magnetic CaTiO3 and BaTiO3 phases introduces a magnetic dilution effect, which directly reduces the overall saturation magnetization (Ms) of the composite. Therefore, the general declining trend of Ms is attributed not only to the reduced density and grain size but also to this inherent dilution caused by the composite additives.
Figure 9 gives the complex permeability spectra, including the real part of permeability (μ′) and imaginary part of permeability (μ″) of the NiCuZn samples in group A and group B. It was evident that the initial permeability of the NiCuZn samples in the two groups both decreased with the increasing content of CaTiO3 or BaTiO3. When x = 0.05, although the μ′ was reduced by the addition of CaTiO3 or BaTiO3, the NiCuZn samples in two groups still exhibited relatively high initial permeability of 636.95 and 651.55, respectively. When x increased from 0.05 to 0.15, the μ′ decreased rapidly with the increasing content of CaTiO3 or BaTiO3.
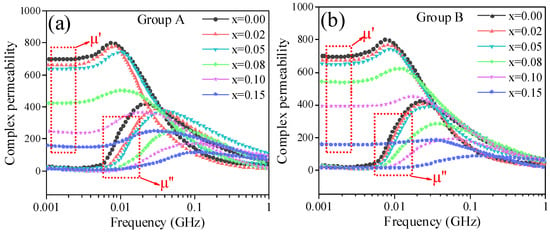
Figure 9.
Frequency dependence of the complex permeability (real part μ′ and imaginary part μ″) for NiCuZn ferrites with varying MTiO3 content (x wt%). (a) NiCuZn ferrites with added BMLS-CaTiO3 and (b) NiCuZn ferrites with added BMLS-BaTiO3.The initial permeability (μ′ at low frequency) decreases progressively as x increases from 0.00 to 0.15 wt%.
The complex permeability of ferrites is predominantly governed by two magnetization mechanisms: domain wall motion and domain spin rotation. However, in polycrystalline ferrites with fine grain size, the contribution from domain wall motion can be neglected [,,]. As evidenced in Figure 3 and Figure 4, the grain size of all NiCuZn samples was below the single-domain critical size of 3 μm []. Consequently, the complex permeability of these samples was mainly attributable to spin rotation, which can be described by the following Equation (1) [].
where Ms, Hd, and HA respectively denote the ferrite’s saturation magnetization, demagnetization field, and magnetocrystalline anisotropic field. As shown in Figure 3, Figure 4, Figure 5, Figure 6, Figure 7 and Figure 8, when x increased from 0.00 to 0.05, Ms and density exhibit a slight decreasing tendency, and the uniformity of the grain size was greatly enhanced. Therefore, when x = 0.05, the NiCuZn samples in two groups still exhibited relatively high initial permeability of 636.95 and 651.55, respectively. When x exceeded 0.05, all the NiCuZn samples exhibited a rapid decrease in permeability, which may be attributed to the excessive addition of CaTiO3 or BaTiO3, resulting in a rapid deterioration of the grain size uniformity and densification. When added excessively, the diffusion of these non-magnetic CaTiO3 or BaTiO3 in NiCuZn ferrite could significantly reduce the magnetism and decrease the grain size uniformity and densification, thereby resulting in a reduction in the magnetic permeability [,,].
Figure 10 shows the variation in the Q factor of NiCuZn ferrites with added BMLS-CaTiO3/BaTiO3. Previous studies have indicated that a dense microstructure contributes to a high Q factor in ferrites [,]. Accordingly, the Q factor and density (Figure 6) followed a similar trend: both decreased gradually as x increased from 0.00 to 0.05. With a further increase in x from 0.05 to 0.15, the Q factor decreases sharply, which can be attributed to the pronounced decrease in density and densification.
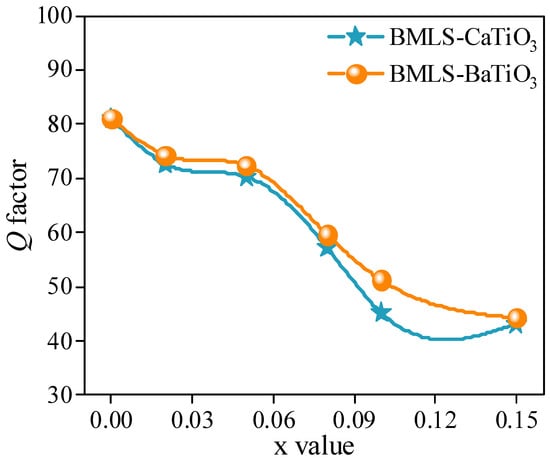
Figure 10.
Q factor) of NiCuZn ferrites as a function of frequency, showing the effect of different MTiO3 contents (x wt%). The Q factor generally decreases with increasing x.
Figure 11 illustrates the power loss behavior of NiCuZn samples containing BMLS-CaTiO3/BaTiO3 under various magnetic induction levels and frequencies. As the x increased from 0.00 to 0.15, all samples showed a consistent trend in power loss: an initial decrease followed by a sharp rise. Despite the slight reduction in complex permeability caused by CaTiO3/BaTiO3 incorporation (as indicated in Figure 9), the power loss properties were markedly enhanced across all frequencies and induction conditions. Notably, at x = 0.05, the samples achieved the minimum Pcv (total power loss) values, reflecting a reduction of more than 35.00% compared to the sample (x = 0.00). In general, the total power loss can be expressed by Equation (2), where Ph, Pe, and Pr denote hysteresis loss, eddy current loss, and residual loss, respectively [,].
Pcv = Ph + Pe + Pr
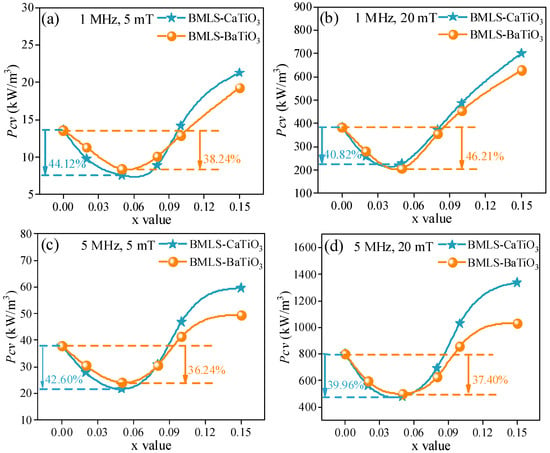
Figure 11.
Pcv of NiCuZn ferrites under different (a,c) magnetic induction levels and (b,d) frequencies. The power loss for both Groups A and B first decreases, reaching a minimum at x = 0.05 wt%, and then increases with further increase in MTiO3 content (x).
According to the previous studies, the Pr (residual loss) was greatly affected by the Fe2+ content [,,,]. However, in this work, CaTiO3 and BaTiO3 both have a high melting point (over 1500 °C), which was much higher than the sintering temperature of 925 °C. These high melting point additives were difficult to melt and would not undergo chemical reactions throughout the process of sintering. The addition of CaTiO3 or BaTiO3 will not significantly change the Fe2+ content, and the Pr will not show an obvious change []. As a consequence, the Pcv was mainly determined by the Ph (hysteresis loss) and Pe (eddy current loss). The related studies showed that the Pe is inversely proportional to the resistivity and Ph is proportional to 1/μi3 [,,,,,]. When x increased from 0.00 to 0.05, the resistivity of the NiCuZn samples displayed in Figure 7 was increased, and the complex permeability of the NiCuZn samples displayed in Figure 9 was slightly decreased, but all the samples still had a relatively high complex permeability (over 600). Thus, with the content of CaTiO3 or BaTiO3 increased from 0.00 wt% to 0.05 wt%, the decreased Pe made a more significant impact on the total power loss than the increased Ph. Therefore, the Pcv value was decreased with the x value increasing from 0.00 to 0.05, and reached the lowest value when x = 0.05. When x exceeded 0.05, the Ph was significantly increased because of the rapid reduction in complex permeability. As a consequence, although the resistivity still increased slowly, the Pcv was increased when x increased from 0.08 to 0.15.
In addition, when further comparing the effect on the power loss between CaTiO3 and BaTiO3, it can be found that NiCuZn samples containing BMLS-CaTiO3 exhibited a low power loss when the x value was between 0.00 and 0.05, whereas NiCuZn samples containing BMLS-BaTiO3 exhibited a low power loss when the x value exceeded 0.08. The complex permeability of NiCuZn samples under two compositing modes exhibited a relatively high value when the x value was between 0.00 and 0.05. Therefore, the difference in power loss of the samples was mainly determined by the Pe. As shown in Figure 7, NiCuZn samples with added BMLS-CaTiO3 exhibited a higher resistivity than NiCuZn samples with added BMLS-BaTiO3. Thus, NiCuZn samples containing BMLS-CaTiO3 obtained a lower Pe, and exhibited a relatively low Pcv value accordingly when x was between 0.00 and 0.05. When x exceeded 0.08, Figure 9 showed that the addition of CaTiO3 resulted in a faster decrease in the complex permeability than BaTiO3, contributing to a significant increase in Ph. Therefore, when x exceeded 0.08, NiCuZn samples containing BMLS-BaTiO3 exhibited a relatively low power loss.
4. Conclusions
In this study, to achieve NiCuZn ferrites with excellent magnetic performance and low power loss, composite additives comprising BMLS-CaTiO3 and BMLS-BaTiO3 were introduced to modify the properties of the ferrites sintered at a low temperature of 925 °C. The effects of BMLS-CaTiO3 (Group A) and BMLS-BaTiO3 (Group B) on the phase composition, density, resistivity, microstructure, magnetic properties, and power loss of NiCuZn ferrites were systematically investigated, and the underlying mechanisms were thoroughly discussed. The main findings are as follows:
- (1)
- NiCuZn ferrites incorporating BMLS-CaTiO3/BaTiO3 as composite additives were successfully prepared at a low sintering temperature of 925 °C, and all samples exhibited a pure spinel phase structure.
- (2)
- The microstructure evolution with the CaTiO3/BaTiO3 content (x) was systematically revealed. As x increased from 0.00 to 0.15 wt%, the average grain size exhibited a continuous reduction. Notably, the grain size uniformity initially improved, reaching an optimum at x = 0.05 wt%, before deteriorating at higher concentrations (x ≥ 0.08 wt%) due to excessive inhibition of grain growth.
- (3)
- As the content of CaTiO3 or BaTiO3 increased, the density, complex permeability, and Q factor consistently decreased. The resistivity, however, showed a non-monotonic dependence on x, reaching a maximum at x = 0.10 wt%. This trend is attributed to two competing effects: the initial increase is due to the increased number of high-resistivity grain boundaries and the segregation of insulating CaTiO3/BaTiO3 phases, which impede electron transport. The subsequent decrease at x = 0.15 wt% is likely caused by the excessive porosity and degraded densification, which can create defective paths and outweigh the benefits of grain refinement.
- (4)
- With increasing CaTiO3/BaTiO3 content, Ms and permeability followed a general declining trend, while the Hc exhibited a continuous increase. The sample at x = 0.05 wt% represents an optimal compromise within this trend (Ms > 53.9 emu/g, permeability > 636), where the positive effect of enhanced grain uniformity partially counteracts the negative impacts of magnetic dilution, crystallite size reduction, and density decrease.
- (5)
- As the content of CaTiO3 or BaTiO3 increased, the total power loss of the samples first decreased and then increased. The lowest power loss was achieved at x = 0.05, with a reduction exceeding 35.00% across various magnetic induction levels and frequencies. This reason is mainly due to increased resistivity, which significantly lowers eddy current loss. However, when x exceeds 0.05, the sharp decrease in complex permeability contributes to a substantial increase in hysteresis loss, ultimately raising the total power loss despite the continued increase in resistivity.
- (6)
- This study demonstrates that the microstructure and electromagnetic properties of low-temperature-sintered NiCuZn ferrites can be effectively tailored by the BMLS-Ca/BaTiO3 composite additives. The evolution of these parameters with x offers a clear guideline for material selection based on application needs: compositions with x ≤ 0.05 wt% are optimal for applications requiring high permeability and low power loss (e.g., high-efficiency inductors), whereas compositions with higher x values (e.g., 0.10 wt%), which exhibit peak resistivity, might be better suited for RF and microwave device applications.
Author Contributions
Conceptualization, L.C., Z.C., L.W., C.C. F.C. and Y.X.; investigation, Z.C. and X.G.; data curation, L.C., C.C. and F.C. and Y.X.; writing—original draft preparation, L.C., Z.C. and C.C.; writing—review and editing, L.W., Z.C. and X.G.; supervision, L.W., Z.C. and X.G.; funding acquisition, C.C., Z.C. and X.G. All authors have read and agreed to the published version of the manuscript.
Funding
This study is supported by the State Key Laboratory of Advanced Power Transmission Technology (Grant No. GEIRI-SKL-2023-003).
Institutional Review Board Statement
Not applicable.
Informed Consent Statement
Not applicable.
Data Availability Statement
The original contributions presented in the study are included in the article, further inquiries can be directed to the corresponding authors.
Conflicts of Interest
Chuan Chen, Lei Cui, Fang yuan Chang, Yan Xiao and Lining Wu hereby disclose their conflict of interests as outlined by the MDPl guidelines. They are currently employed by State Key Laboratory of Advanced Power Transmission Technology, China Electric Power Research Institute Co., Ltd and were employed by State Key Laboratory of Advanced Power Transmission Technology, China Electric Power Research Institute Co., Ltd while contributing to this manuscript. Their contribution to this work and manuscript were made independently without any requirement, guidance or input by their employer. They received no financial compensation from any source for the contributions they made to this scientific work and manuscript.
References
- Almessiere, M.A.; Slimani, Y.; Trukhanov, A.V.; Korkmaz, A.D.; Guner, S.; Akhtar, S.; Shirsath, S.E.; Baykal, A.; Ercan, I. Effect of Nd-Y co-substitution on structural, magnetic, optical and microwave properties of NiCuZn nanospinel ferrites. J. Mater. Res. Technol. 2020, 9, 11278–11290. [Google Scholar] [CrossRef]
- Su, H.; Zhang, H.; Tang, X.; Xiang, X. High-permeability and high-Curie temperature NiCuZn ferrite. J. Magn. Magn. Mater. 2004, 283, 157–163. [Google Scholar] [CrossRef]
- Zhao, Q.; Zhang, H.; Li, J.; Xu, F.; Liao, Y.; Liu, C.; Su, H. Low-temperature sintering synthesis and electromagnetic properties of NiCuZn/BaTiO3 composite materials. J. Alloys Compd. 2019, 788, 44–49. [Google Scholar] [CrossRef]
- Su, H.; Zhang, H.; Tang, X.; Jing, Y.; Zhong, Z. Dielectric and magnetic properties of low-temperature fired NiCuZn–BaTiO3 composites. J. Magn. Magn. Mater. 2009, 321, 2763–2766. [Google Scholar] [CrossRef]
- Almessiere, M.A.; Slimani, Y.; Attia, H.; Sheikh, S.I.M.; Sadaqat, A.; Vakhitov, M.G.; Klygach, D.S.; Sertkol, M.; Baykal, A.; Trukhanov, A.V. Alterations in the magnetic and electrodynamic properties of hard-soft Sr0.5Ba0.5Eu0.01Fe12O19/NixCuyZnwFe2O4 nanocomposites. J. Mater. Res. Technol. 2021, 15, 1416–1429. [Google Scholar] [CrossRef]
- Wang, X.; Zhang, H.; Shi, L.; Li, J.; Jin, L.; Cheng, L.; Jia, L.; Zhang, D.; Liao, Y. Synthesis and magnetic properties of low-temperature sintered, LMZBS glass-doped dense NiCuZn ferrites. Ceram. Int. 2022, 48, 19011–19016. [Google Scholar] [CrossRef]
- Cao, Z.F.; Jiang, Y.; Tang, Y.Y.; Wu, L.N.; Luo, R.; Wei, B.; Wang, T. Probing the influence of V2O5 and SBZKN composite additives on the magnetic characteristics and power loss of low-temperature sintered NiCuZn ferrites. J. Alloys Compd. 2024, 988, 174184. [Google Scholar] [CrossRef]
- Praveena, K.; Sadhana, K.; Liu, H.; Maramu, N.; Himanandini, G. Improved microwave absorption properties of TiO2 and Ni0.53Cu0.12Zn0.35Fe2O4 nanocomposites potential for microwave devices. J. Alloys Compd. 2016, 681, 499–507. [Google Scholar] [CrossRef]
- Harzali, H.; Saida, F.; Marzouki, A.; Megriche, A.; Baillon, F.; Espitalier, F.; Mgaidi, A. Structural and magnetic properties of nano-sized NiCuZn ferrites synthesized by co-precipitation method with ultrasound irradiation. J. Magn. Magn. Mater. 2016, 419, 50–56. [Google Scholar] [CrossRef]
- Yang, Y.; Li, J.; Zhang, H.W.; Wang, G.; Gan, G.W.; Rao, Y.H. Effects of Bi2O3-MnO2 additives on tunable microstructure and magnetic properties of low temperature co-fired NiCuZn ferrite ceramics. J. Mater. Sci. Mater. Electron. 2020, 31, 12325–12332. [Google Scholar] [CrossRef]
- Ji, X.; Shen, C.; Zhao, Y.; Zheng, H.; Wu, Q.; Zhang, Q.; Zheng, L.; Zheng, P.; Zhang, Y. Enhanced electromagnetic properties of low-temperature sintered NiCuZn ferrites by doping with Bi2O3. Ceram. Int. 2022, 48, 20315–20323. [Google Scholar] [CrossRef]
- Wang, X.; Zhang, D.; Wang, G.; Jin, L.; Li, J.; Liao, Y.; Zhang, H.; Wang, S. Synthesis of V2O5-Doped and low-sintered NiCuZn ferrite with uniform grains and enhanced magnetic properties. Ceram. Int. 2020, 46, 10652–10657. [Google Scholar] [CrossRef]
- Shen, C.; Zhao, Y.; Ji, X.; Dong, S.; Zheng, H.; Hu, J.; Zheng, L. Microstructure and electromagnetic properties of low-temperature sintered NiCuZn ferrite by co-doped Bi2O3 and Co2O3. J. Mater. Sci. Mater. Electron. 2023, 34, 154. [Google Scholar] [CrossRef]
- Li, Q.; Wang, J.; Yao, H. Soft magnetic, gyromagnetic, and microstructural properties of BBSZ-Nb2O5 doped NiCuZn ferrites for LTCC applications. Ceram. Int. 2022, 48, 8653–8660. [Google Scholar] [CrossRef]
- Huo, X.; Xu, L.; Zhang, Y.; Liang, J.; Jing, Y.; Su, H. Microstructure, magnetic, and power loss characteristics of low-sintered NiCuZn ferrites with La2O3-Bi2O3 additives. J. Am. Ceram. Soc. 2023, 106, 7523–7532. [Google Scholar] [CrossRef]
- Luo, Q.; Su, H.; Tang, X.; Xu, Z.; Li, Y.; Jing, Y. Effects of Bi2O3 addition on power loss characteristics of low-temperature-fired NiCuZn ferrites. Ceram. Int. 2018, 44, 16005–16009. [Google Scholar] [CrossRef]
- Zhang, Y.; Tang, X.; Wu, X.; Chen, J.; Jing, Y.; Su, H. Effect of Bi2O3 and Co2O3 co-doping on power loss characteristics of low-temperature-fired NiCuZn ferrites. J. Magn. Magn. Mater. 2022, 555, 169368. [Google Scholar] [CrossRef]
- Yang, Y.; Li, J.; Zhang, H.; Li, J.; Xu, F.; Wang, G.; Gao, F.; Su, H. Nb5+ ion substitution assisted the magnetic and gyromagnetic properties of NiCuZn ferrite for high frequency LTCC devices. Ceram. Int. 2022, 48, 12490–12496. [Google Scholar] [CrossRef]
- Wang, Y.; Yang, C.; Kong, Q.; Wu, X.; Zhang, Z. Investigation on the micro-structure and magnetic properties of LMZBS-Bi2O3 doped low-temperature sintered NiCuZn ferrites. Mater. Res. Express 2023, 10, 046101. [Google Scholar] [CrossRef]
- Yue, Z.; Zhou, J.; Li, L.; Gui, Z. Effects of MnO2 on the electromagnetic properties of NiCuZn ferrites prepared by sol-gel auto-combustion. J. Magn. Magn. Mater. 2001, 233, 224–229. [Google Scholar] [CrossRef]
- Fan, X.; Bai, G.; Zhang, Z.; Chen, Q.; Jin, J.; Xu, J.; Zhang, X.; Yan, M. Synergistic effect of V2O5 and Bi2O3 on the grain boundary structure of high-frequency NiCuZn ferrite ceramics. J. Adv. Ceram. 2022, 11, 912–921. [Google Scholar] [CrossRef]
- Yan, M.; Yi, S.; Fan, X.; Zhang, Z.; Jin, J.; Bai, G. High-frequency MnZn soft magnetic ferrite by engineering grain boundaries with multiple-ion doping. J. Mater. Sci. Technol. 2021, 79, 165–170. [Google Scholar] [CrossRef]
- Patil, A.D.; Patange, S.M.; Dighe, P.M.; Shaikh, S.F.; Rana, A.u.H.S.; Pandit, B.; Jadhav, S.S. Tuning the structural, optical and magnetic properties of NiCuZn (Ni0.4Cu0.3Zn0.3Fe2O4) spinel ferrites by Nb2O5 additive. Ceram. Int. 2022, 48, 27039–27050. [Google Scholar] [CrossRef]
- Wu, D.M.; Liu, X.P.; Gao, P.Z.; He, L.T.; Li, J.W. Effects of Ni2+ concentration on the composition, structure, magnetic properties, and DC-bias superposition characteristics of NiCuZn ferrites. Ceram. Int. 2022, 48, 11228–11237. [Google Scholar] [CrossRef]
- Peng, R.; Zhao, Q.; Li, Y.X.; Li, J.; Zhang, H.W. Magnetic and dielectric properties of low-temperature sintered NiCuZn/CaTiO3 composite dual-performance materials. J. Alloys Compd. 2022, 910, 164906. [Google Scholar] [CrossRef]
- Znidarsic, A.; Drofenik, M. High-resistivity grain boundaries in CaO-doped MnZn ferrites for high-frequency power application. J. Am. Ceram. Soc. 1999, 82, 359–365. [Google Scholar] [CrossRef]
- Liao, Y.; Xu, F.; Zhang, D.; Zhou, T.; Wang, Q.; Wang, X.; Jia, L.; Li, J.; Su, H.; Zhong, Z.; et al. Low temperature firing of Li0.43Zn0.27Ti0.13Fe2.17O4 ferrites with enhanced magnetic properties. J. Am. Ceram. Soc. 2015, 98, 2556–2560. [Google Scholar] [CrossRef]
- Ouyang, C.; Xiao, S.; Zhu, J.; Wang, H. Effects of solid-state reaction temperature on the activation energy and DC-bias superposition of NiCuZn ferrites based on master sintering curve. Adv. Appl. Ceram. 2016, 115, 396–402. [Google Scholar] [CrossRef]
- Shaikh, B.; Toksha, B.; Shirsath, S.; Chatterjee, A.; Tonde, S.; Chishty, S. Microstructure, magnetic, and dielectric interplay in NiCuZn ferrite with rare earth doping for magneto-dielectric applications. J. Magn. Magn. Mater. 2021, 537, 168229. [Google Scholar] [CrossRef]
- Ji, X.; Chen, T.; Shen, C.; Zhao, Y.; Zhou, K.; Sun, M.; Yu, Y.; Fan, L.; Zheng, H.; Wu, Q.; et al. Magnetic and dielectric properties of NiCuZn ferrite with optimized Cu content and sintered by a two-step process. J. Alloys Compd. 2022, 898, 162906. [Google Scholar] [CrossRef]
- Van Der Zaag, P.J.; Van Der Valk, P.J.; Rekveldt, M.T. A domain size effect in the magnetic hysteresis of NiZn-ferrites. Appl. Phys. Lett. 1996, 69, 2927–2929. [Google Scholar] [CrossRef]
- Yang, Y.; Zhang, H.; Li, J.; Rao, Y.; Wang, G.; Gan, G. Bi3+ doping adjusted microstructure, magnetic, and dielectric properties of nickel zinc ferrite ceramics for high frequency LTCC antennas. Ceram. Int. 2020, 46, 25697–25704. [Google Scholar] [CrossRef]
- Nasrin, S.; Khan, S.; Matin, M.; Khan, M.; Hossain, A.K.M.A.; Rahaman, M.M. Synthesis and deciphering the effects of sintering temperature on structural, elastic, dielectric, electric and magnetic properties of magnetic Ni0.25Cu0.13Zn0.62Fe2O4 ceramics. J. Mater. Sci. 2019, 54, 10722–10741. [Google Scholar] [CrossRef]
- Murbe, J.; Topfer, J. Ni-Cu-Zn Ferrites for low temperature firing: II. Effects of powder morphology and Bi2O3 addition on microstructure and permeability. J. Electroceram. 2006, 16, 199–205. [Google Scholar] [CrossRef]
- Akter, S.; Rahaman, M.D.; Khan, M.N.I.; Hossain, A.K.M.A. Synthesis, structural, morphological, electrical and magnetic properties of (1-x) [Ni0.35Cu0.15Zn0.50Mn0.05Fe1.95O4] + (x) [Rice husk ash] composites. Mater. Res. Bull. 2019, 112, 182–193. [Google Scholar] [CrossRef]
- Xu, F.; Zhang, D.; Wang, G.; Zhang, H.; Yang, Y.; Liao, Y.; Jin, L.; Rao, Y.; Li, J.; Xie, F.; et al. Densification and magnetic properties of NiCuZn low-sintering temperature ferrites with Bi2O3-Nb2O5 composite additives. J. Alloys Compd. 2019, 776, 954–959. [Google Scholar] [CrossRef]
- Su, H.; Luo, Q.; Jing, Y.; Li, Y.; Zhang, H.; Tang, X. Effects of calcination temperature and flux doping on the microstructure and magnetic properties of low-temperature-fired NiCuZn ferrites. J. Magn. Magn. Mater. 2018, 469, 419–427. [Google Scholar] [CrossRef]
- Schmidt, T.; Seifert, D.; Topfer, J. Phase formation and saturation magnetization of La-Zn-substituted M-type strontium ferrites. J. Magn. Magn. Mater. 2020, 508, 166887. [Google Scholar] [CrossRef]
- Teo, M.L.S.; Kong, L.B.; Li, Z.W.; Lin, G.Q.; Gan, Y.B. Development of magneto-dielectric materials based on Li-ferrite ceramics: I. Densification behavior and microstructure development. J. Alloys Compd. 2008, 459, 567–575. [Google Scholar] [CrossRef]
- Su, H.; Zhang, H.; Tang, X.; Jing, Y. Influence of microstructure on permeability dispersion and power loss of NiZn ferrite. J. Appl. Phys. 2008, 103, 093903. [Google Scholar] [CrossRef]
Disclaimer/Publisher’s Note: The statements, opinions and data contained in all publications are solely those of the individual author(s) and contributor(s) and not of MDPI and/or the editor(s). MDPI and/or the editor(s) disclaim responsibility for any injury to people or property resulting from any ideas, methods, instructions or products referred to in the content. |
© 2025 by the authors. Licensee MDPI, Basel, Switzerland. This article is an open access article distributed under the terms and conditions of the Creative Commons Attribution (CC BY) license (https://creativecommons.org/licenses/by/4.0/).