When assessing an existing bridge, a straightforward methodology involves the direct evaluation of comfort through experimental assessments. Groups of pedestrians can traverse the bridge along predefined paths at varying velocities. Given the diversity of pedestrian perceptions, it is essential to carefully select the pedestrian typology. The paths should be designed to encompass the most challenging conditions.
Each pedestrian, including those at rest, will provide their judgment on discomfort, which depends, among other factors, on pedestrian velocity. Discomfort tends to increase as velocity decreases. By monitoring the bridge decks using accelerometers, a relationship can be established between comfort levels and induced acceleration, denoted as , over time .
Simultaneously, alongside experimental tests, numerical studies can be conducted to predict pedestrian-induced acceleration. Typically, these studies are performed for designing new bridges or developing specific systems (e.g., tuned mass dampers) to mitigate acceleration as necessary. It is noteworthy that Eurocode [
14] explicitly acknowledges the inherent uncertainties in the data used for calculations, stating, ‘the results are subjected to very high uncertainty’. When comfort criteria are not adequately met, provisions may need to be made for post-completion installation of dampers in the structure. Within this framework, critical aspects, discussed in the following, regard pedestrian- and train-induced actions and comfort levels definition.
2.1. Pedestrian- and Train-Induced Actions
Bachman and his co-authors emerge as significant contributors in the investigation of vibration issues within structures. Their notable contributions, as documented in [
17,
18], are compiled in [
25]. The spectrum of pedestrian activities, encompassing walking, jogging, and running, can be systematically categorized, and their resulting effects can be quantified through mathematical representations such as Fourier series. The classification depends on the velocity type of motion, frequency (
), velocity (
), and stride length (
) can be fitted with reference to
Table 1.
The force evolution in the time can be approximated through harmonic series, as expressed in Equation (1), where (1)
—the pedestrian weight (assumed to be equal for each harmonic); (2)
—the phase angle of the n-th harmonic; (3)
—the dynamic load factor (
); and (4)
—the step frequency that for horizontal (lateral) action can be assumed to be half of the vertical frequency, as indicated in (SÉTRA [
13]). The values of these parameters (
,
) have been proposed in the past, relying on experimental results. Suggested values, for both vertical and lateral directions, are detailed in
Table 2, encompassing both walking and running activities.
It is worth noting that concerning running, the single foot action can be more accurately approximated by the half-sine expression [
13], presented in Equation (2), where
; t—time;
;
—step period
;
—contact time factor;
—face time; and
—dynamic impact factor (
[
20,
25]. Typical values of
, ,
and
are reported in
Table 2.
The velocity and the resulting induced forces depend on pedestrian density, as detailed in [
26]. In the instance of a low-density pedestrian stream (less than 0.6 [person/m
2]), each pedestrian retains their individual velocity and step frequency. With escalating density, velocity diminishes, leading pedestrians to synchronize with each other. Notably, as they sense the vibrations of the bridge, they laterally move in resonance with the bridge itself.
Single pedestrian models can be adopted to simulate groups of walkers and runners. These models can be tuned differently in terms of time and space. Additionally, considering a continuous flow of N synchronized pedestrians, the following conditions apply: (1) they travel contemporarily with a constant velocity () along the deck with a length of , and (2) the value of is equal to , where represents the flow (number of persons per second) and is defined as , representing the time needed by pedestrians to traverse the entire length (). In the case where pedestrians are not synchronized, an equivalent number of pedestrians () can be defined to evaluate the equivalent action resulting from a phase shift.
In SÉTRA [
13], Backman and the half-sine function are adopted, and two expressions are proposed to evaluate N
EQ in the case of a very dense crowd (Equation (3)) and a sparse and dense crowd (Equation (4)), introducing dependence on the structural critical damping (ξ). These expressions, derived from 500 experimental tests, represent the 95% characteristic value. It is worth noting that the number of pedestrians can be evaluated as reported in Equation (5), where A is the deck area, and
is the number of pedestrians per unit surface. The values for
can be assumed as spare (
), dense (
), and very dense (
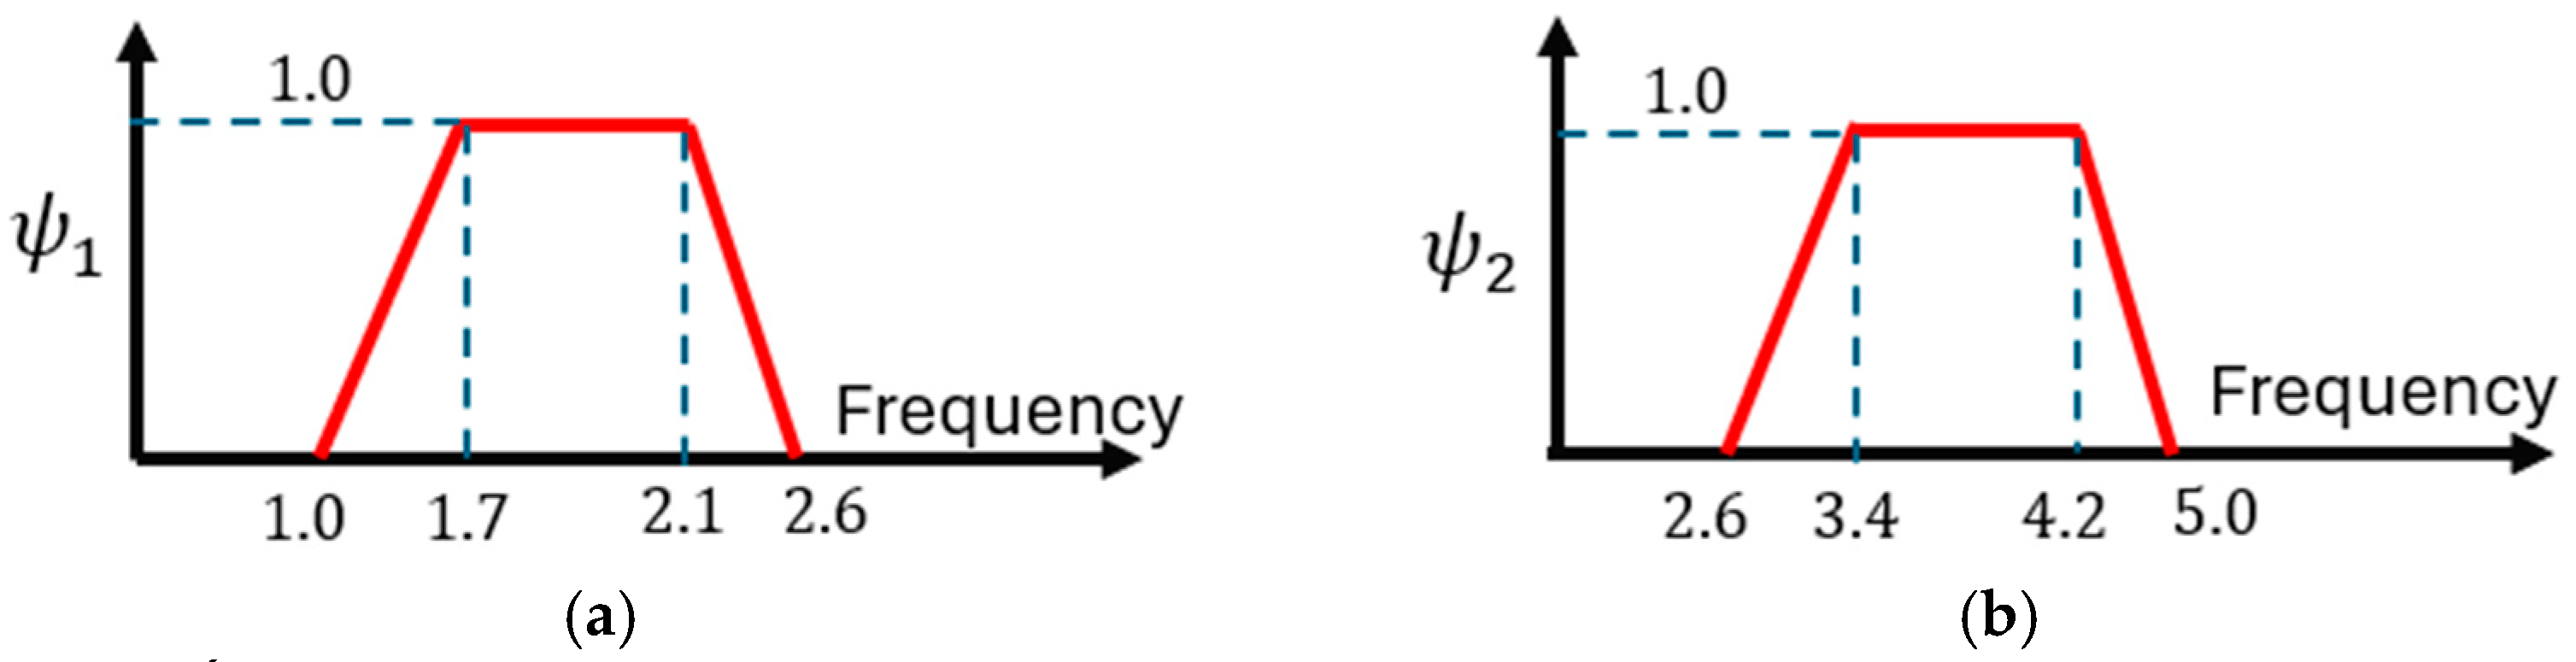
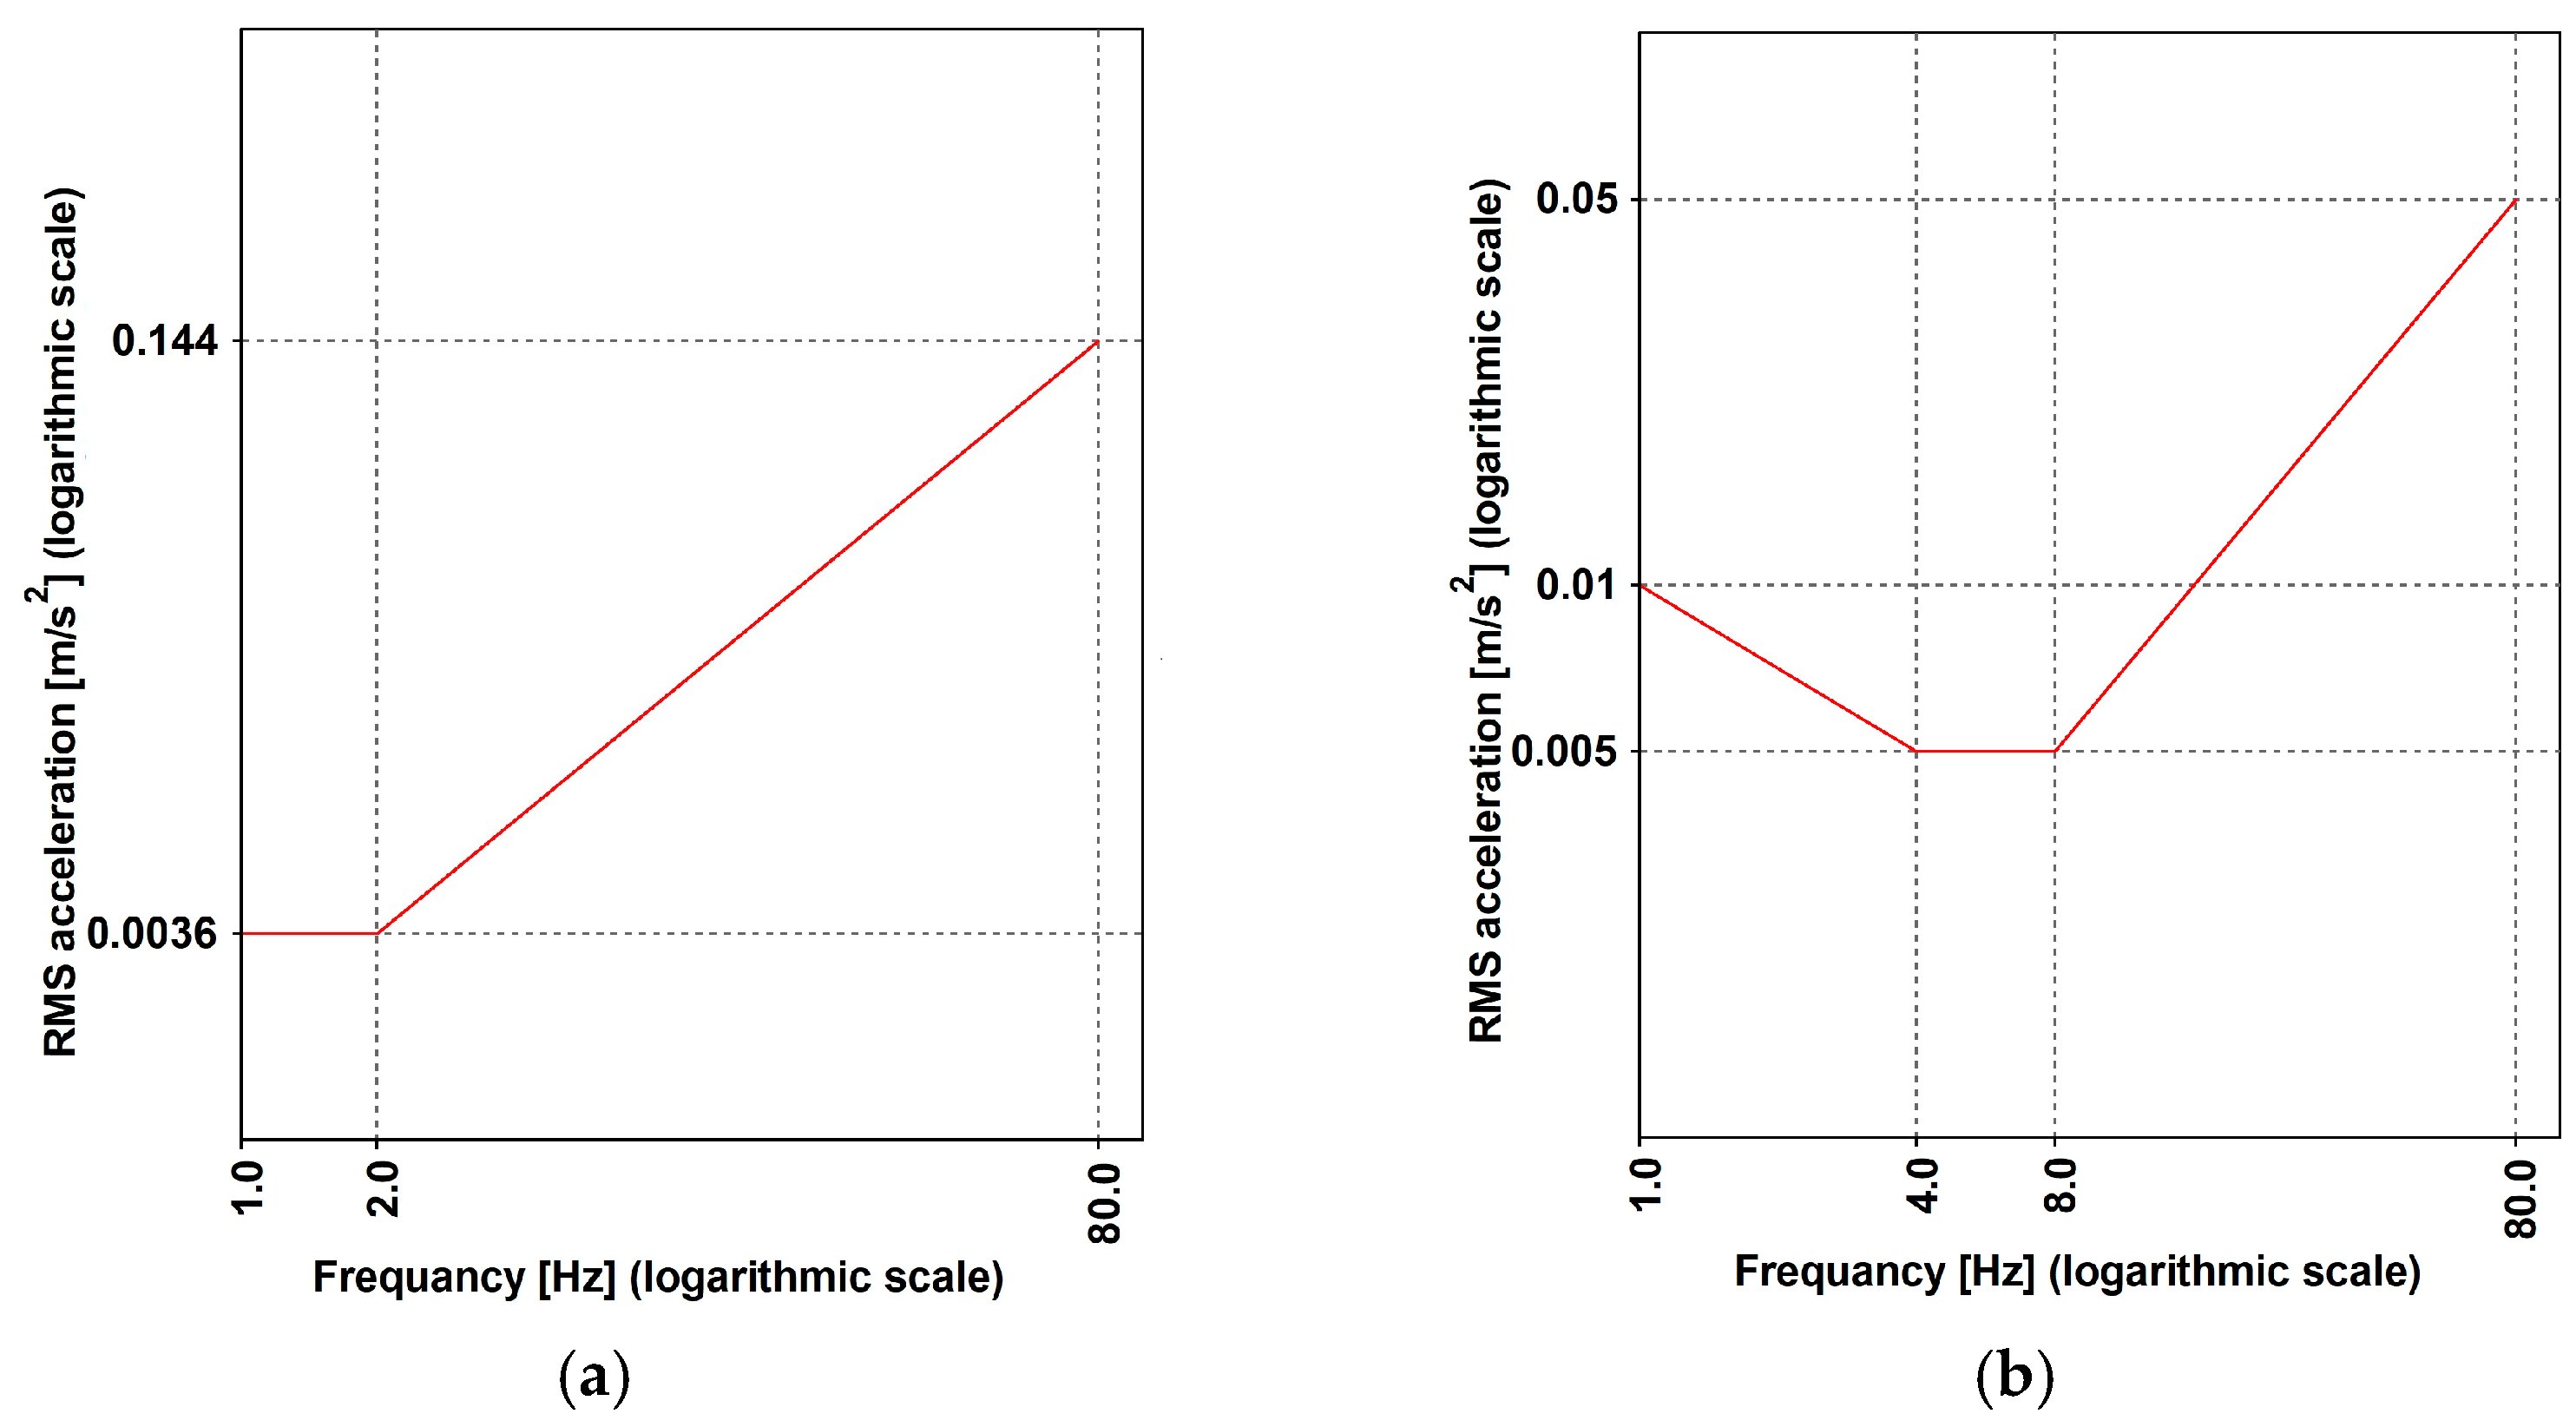
). The resulting expression is reported in Equation (6), where
is the frequency dependent function reported in
Figure 1a. Further on, the second harmonic of the crowd needs to be considered in case of class I and II urban footbridges for which a very dense or dense condition is expected, respectively, and (1) a lower acting force needs to be considered, as reported in Equation (7), adopting (2) the function
reported in
Figure 1b.
The British Standard [
16] is noteworthy among the codes incorporating models for pedestrian groups. Actions are represented by Equation (1), albeit with distinctions: the phase angle is omitted, only one harmonic is considered, and a factor is introduced to encompass unsynchronized combinations. For walking and running either in normal or crowded conditions, two expressions are given, as reported in Equations (8) and (9), that depend on a set of parameters that are as follows:
—amplitude of the pedestrian transmitted force;
—frequency of the force set to be equal to the most demanding bridge frequency;
—dependent on frequency (see
Figure 2) consider pedestrian sensitivity;
—total number of pedestrian with its value (see
Table 3) contingent on usage;
—reduction factor (see
Figure 3) to account for a lower number of pedestrian, in crowd condition, when the mode of interest include internal nodes; and
—reduction factor considering unsynchronized combinations of pedestrian actions, dependent on structural damping and structural span (
Figure 4).
To the best of the author’s knowledge, there is currently no dedicated literature addressing the quantification of pedestrian comfort during the passage of trains or vehicles in underpasses. The existing literature predominantly focuses on the impact of such factors on individuals within built environments. Notably, within the broader context of international standards, a comprehensive review is presented in [
30,
31,
32,
33,
34,
35,
36].
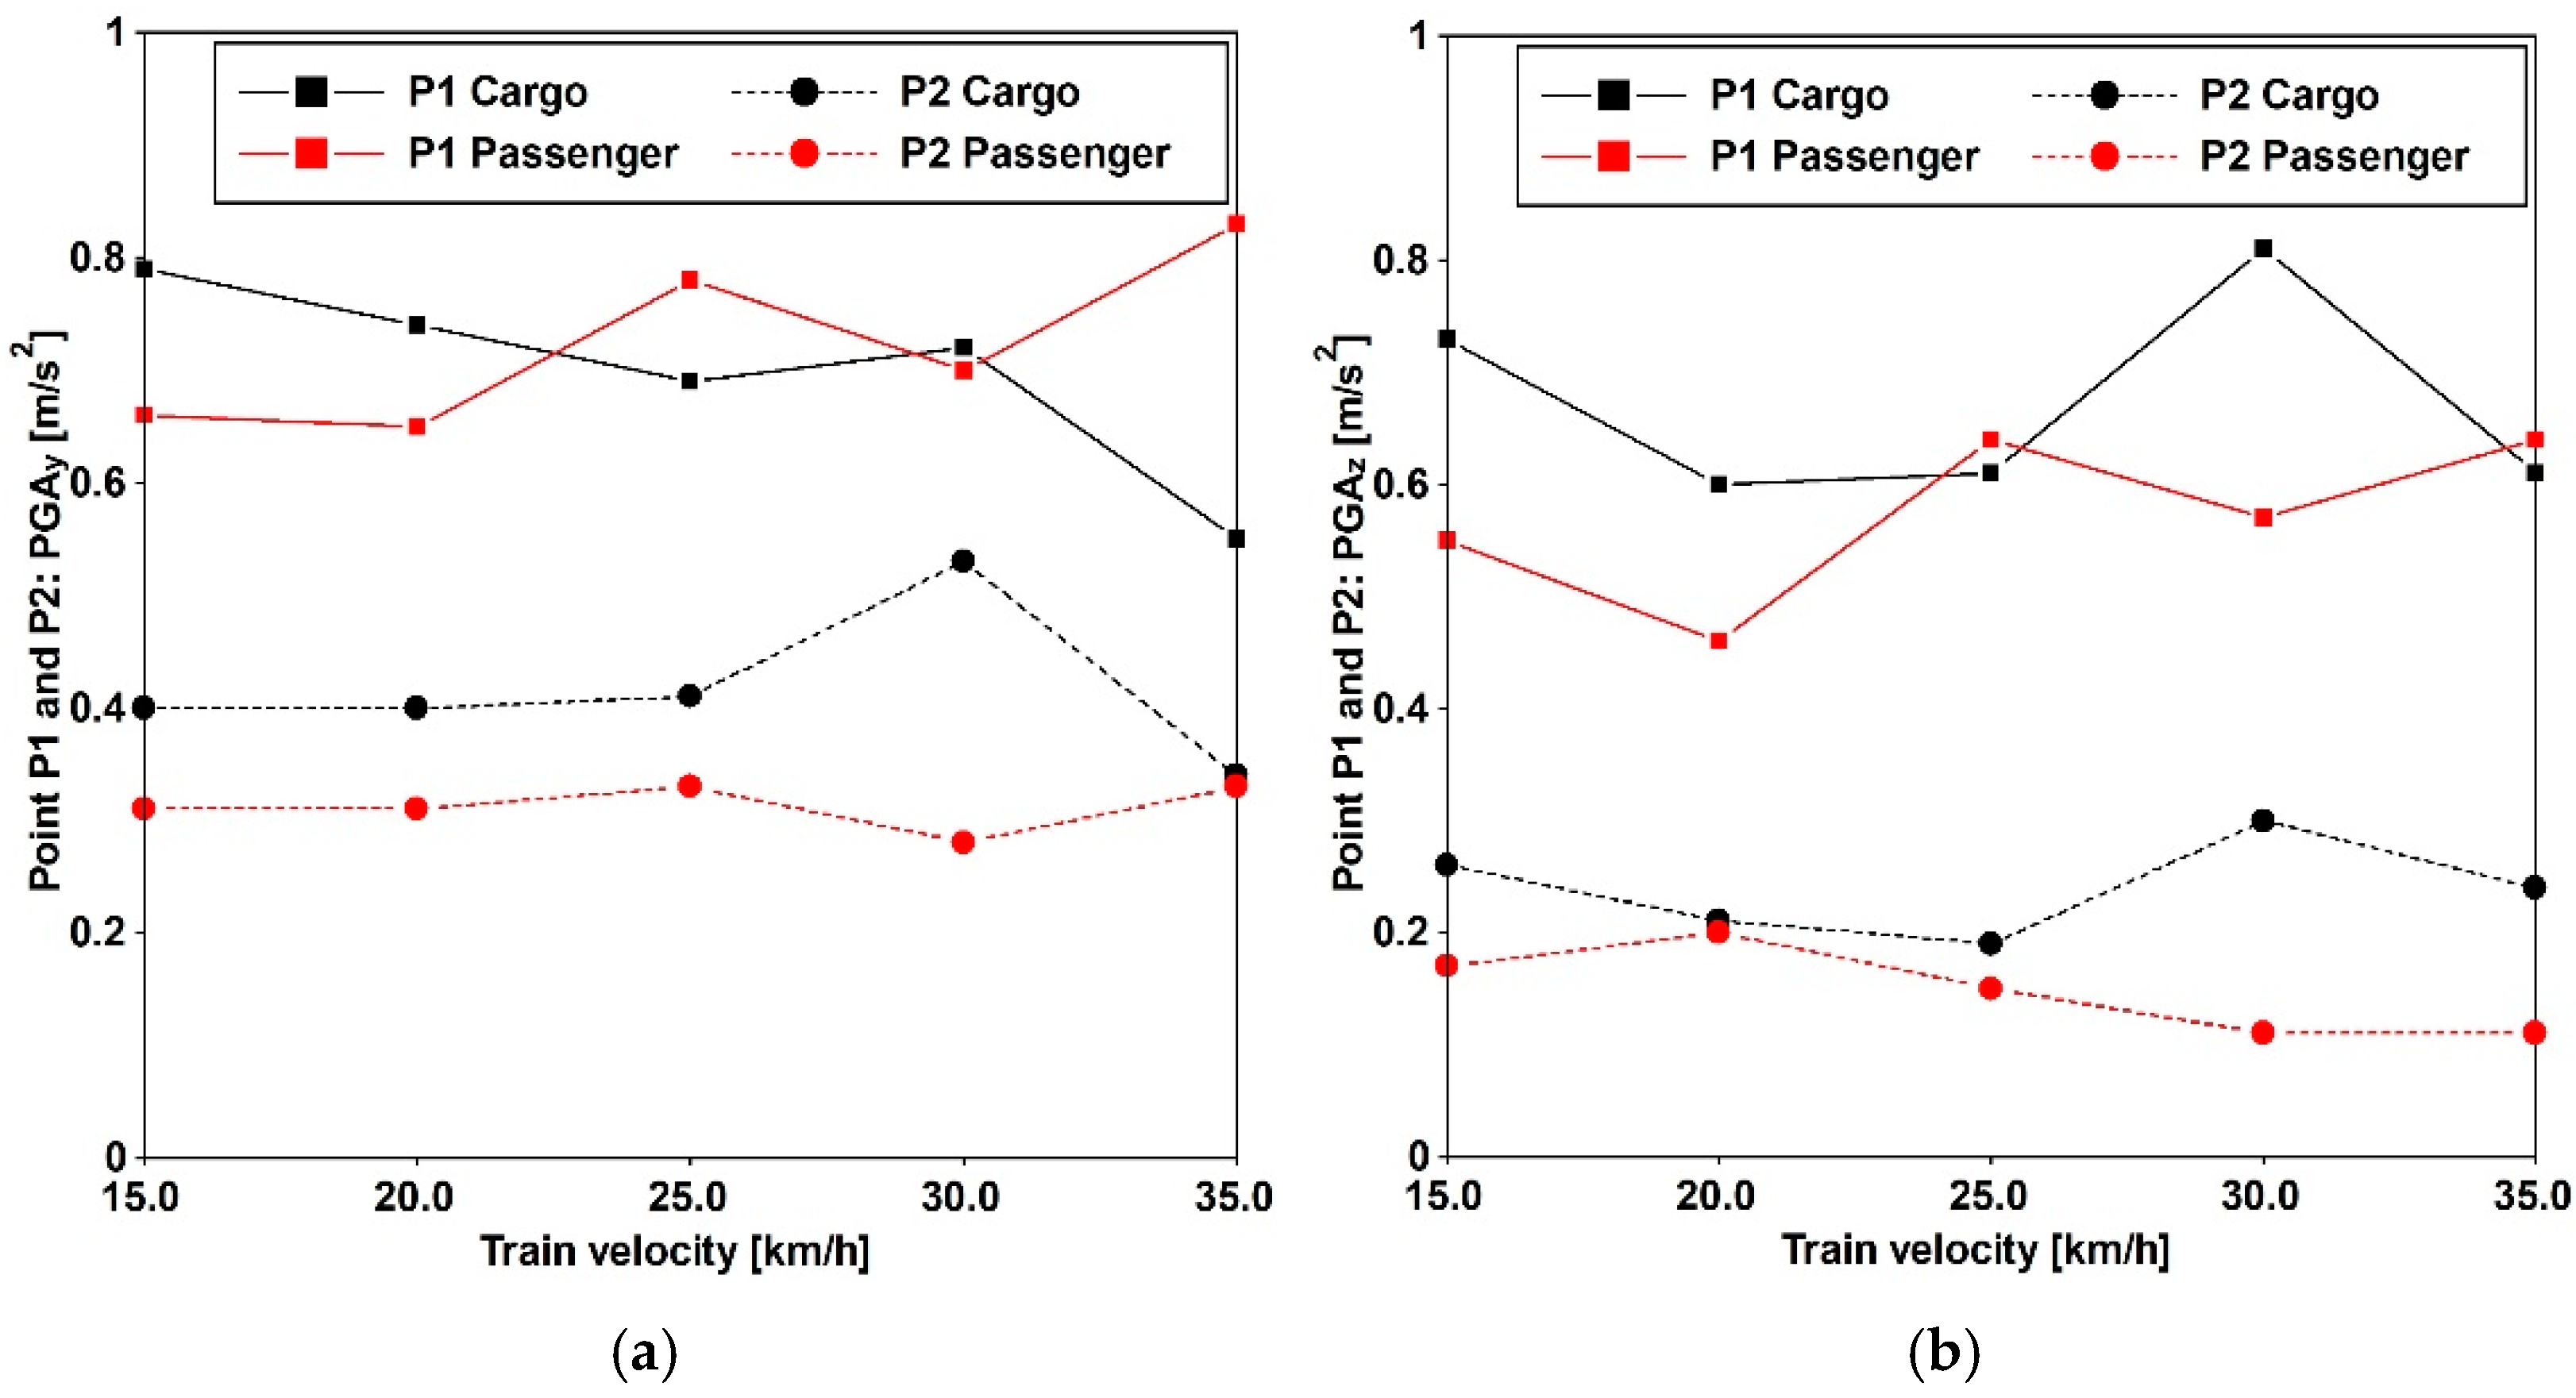
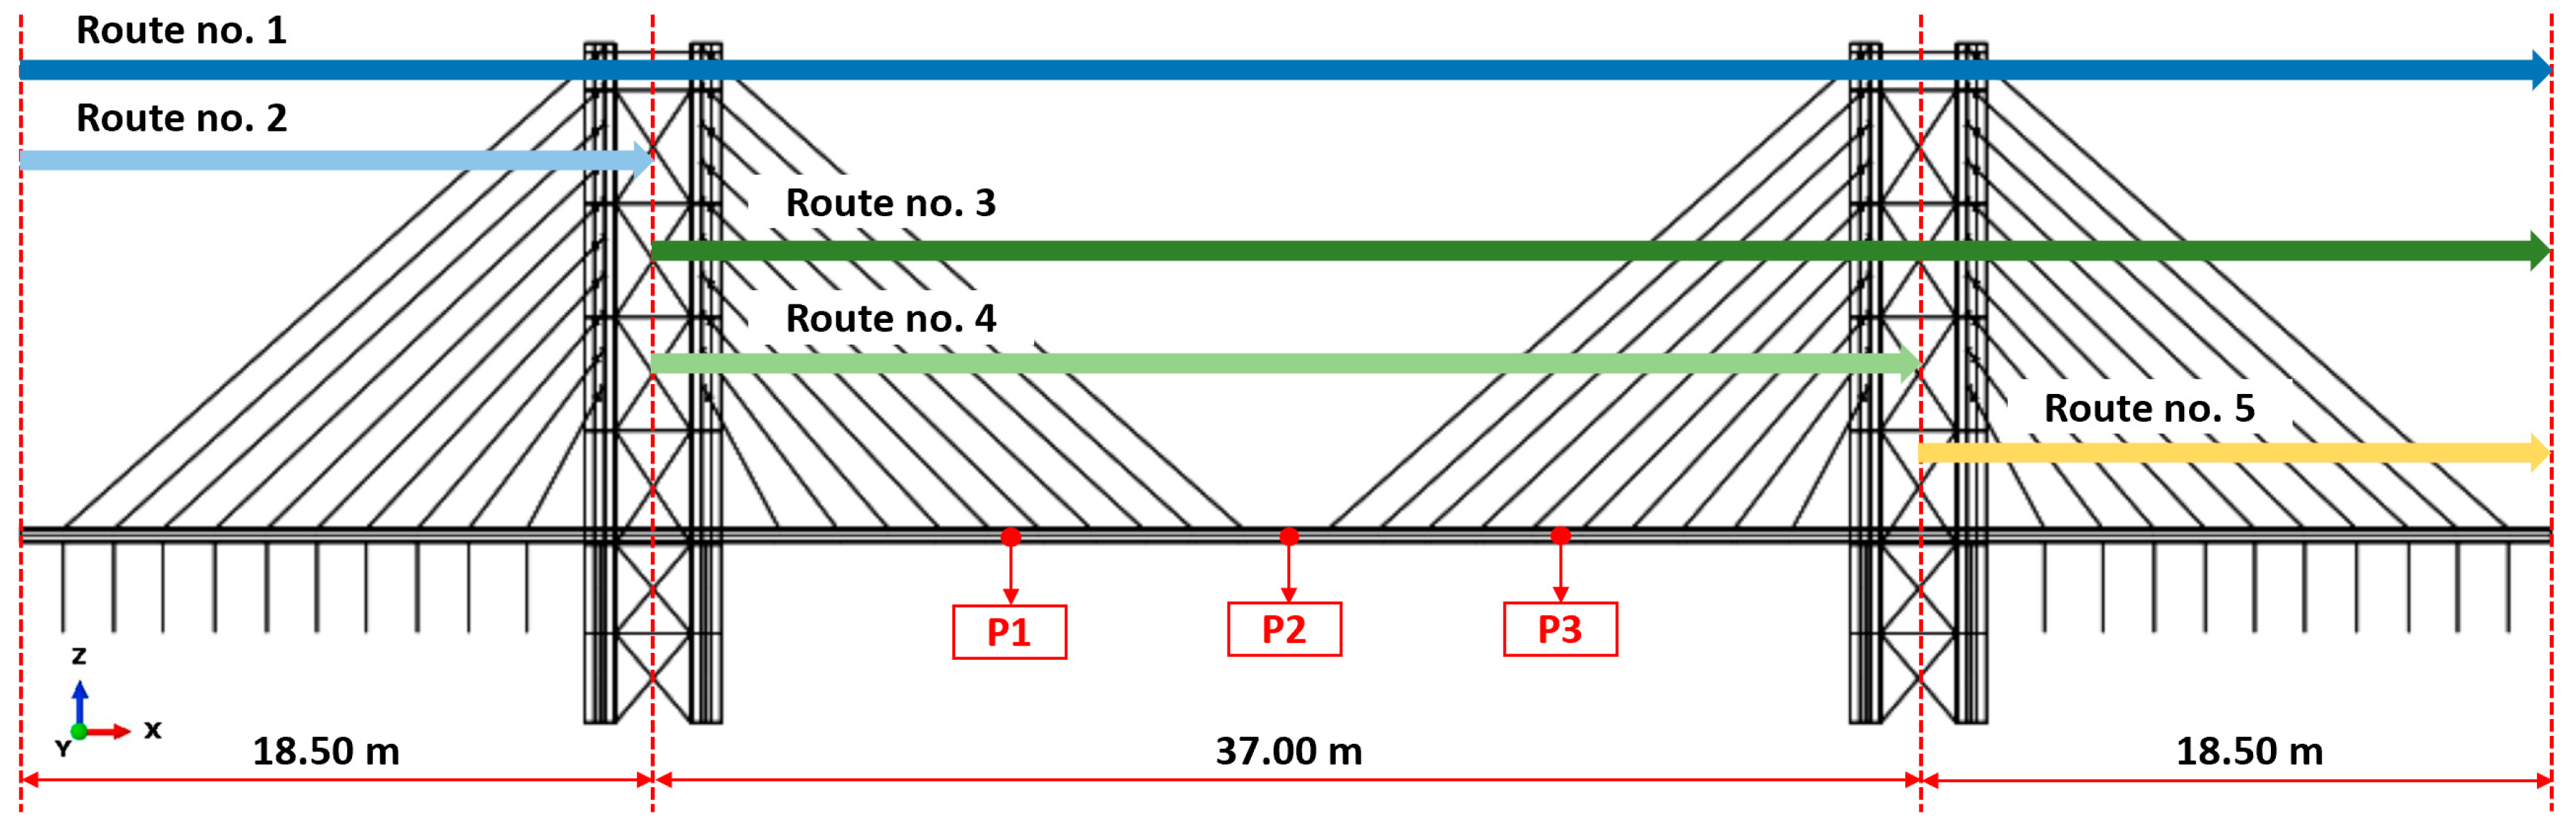
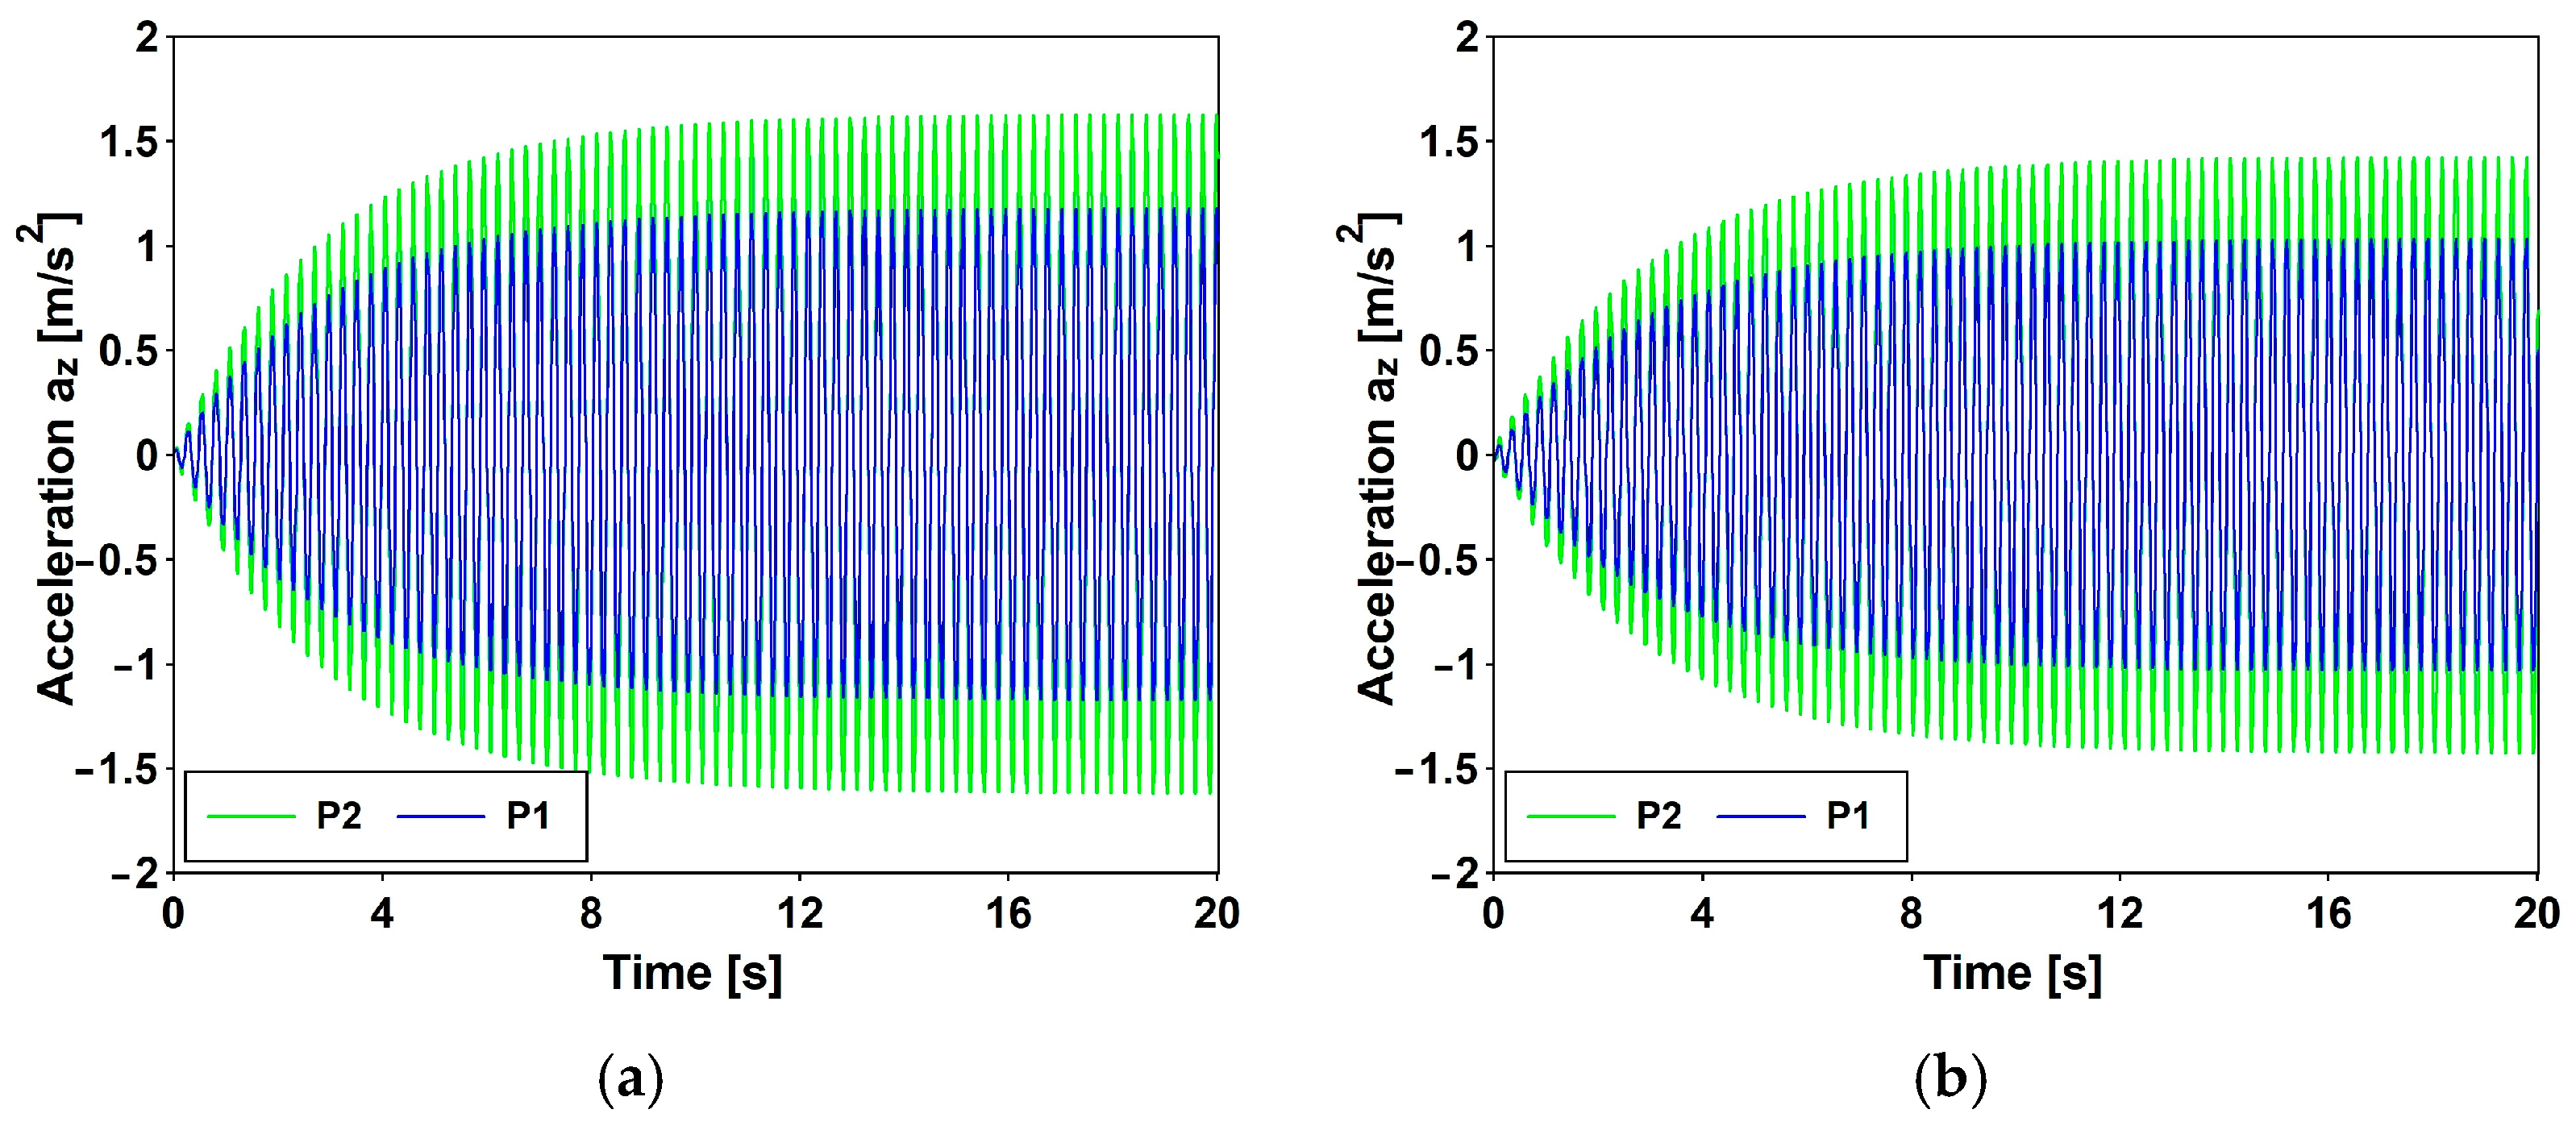
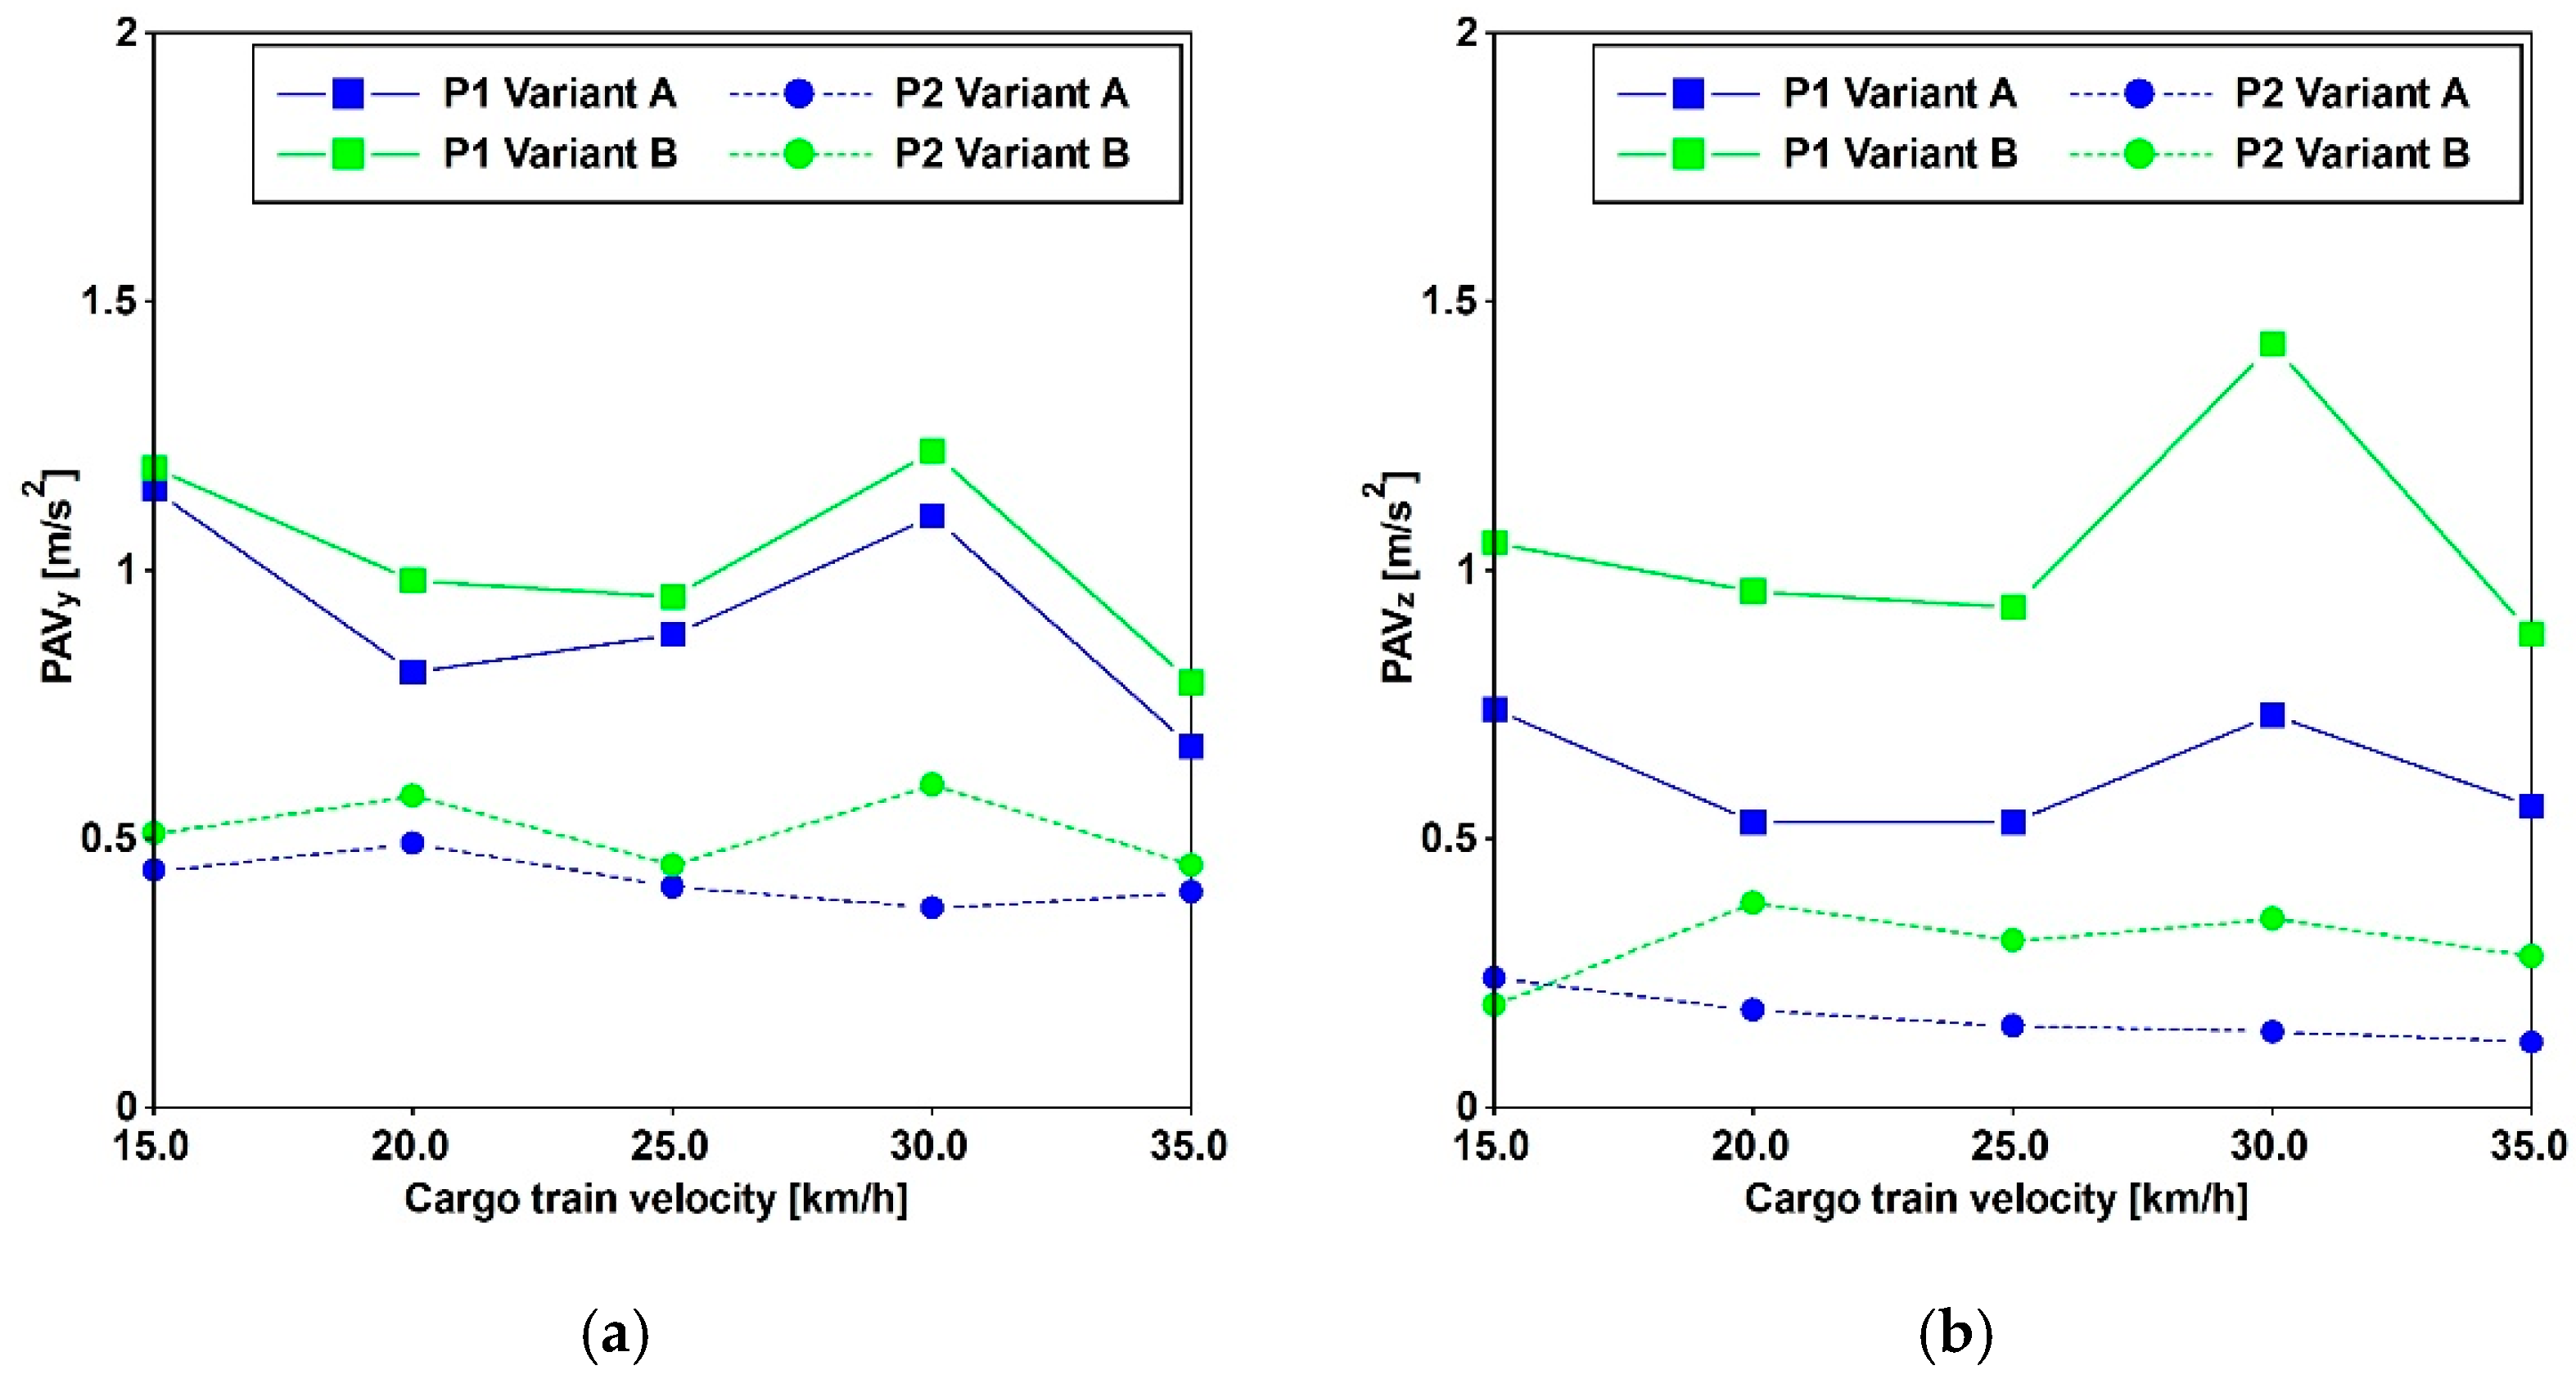
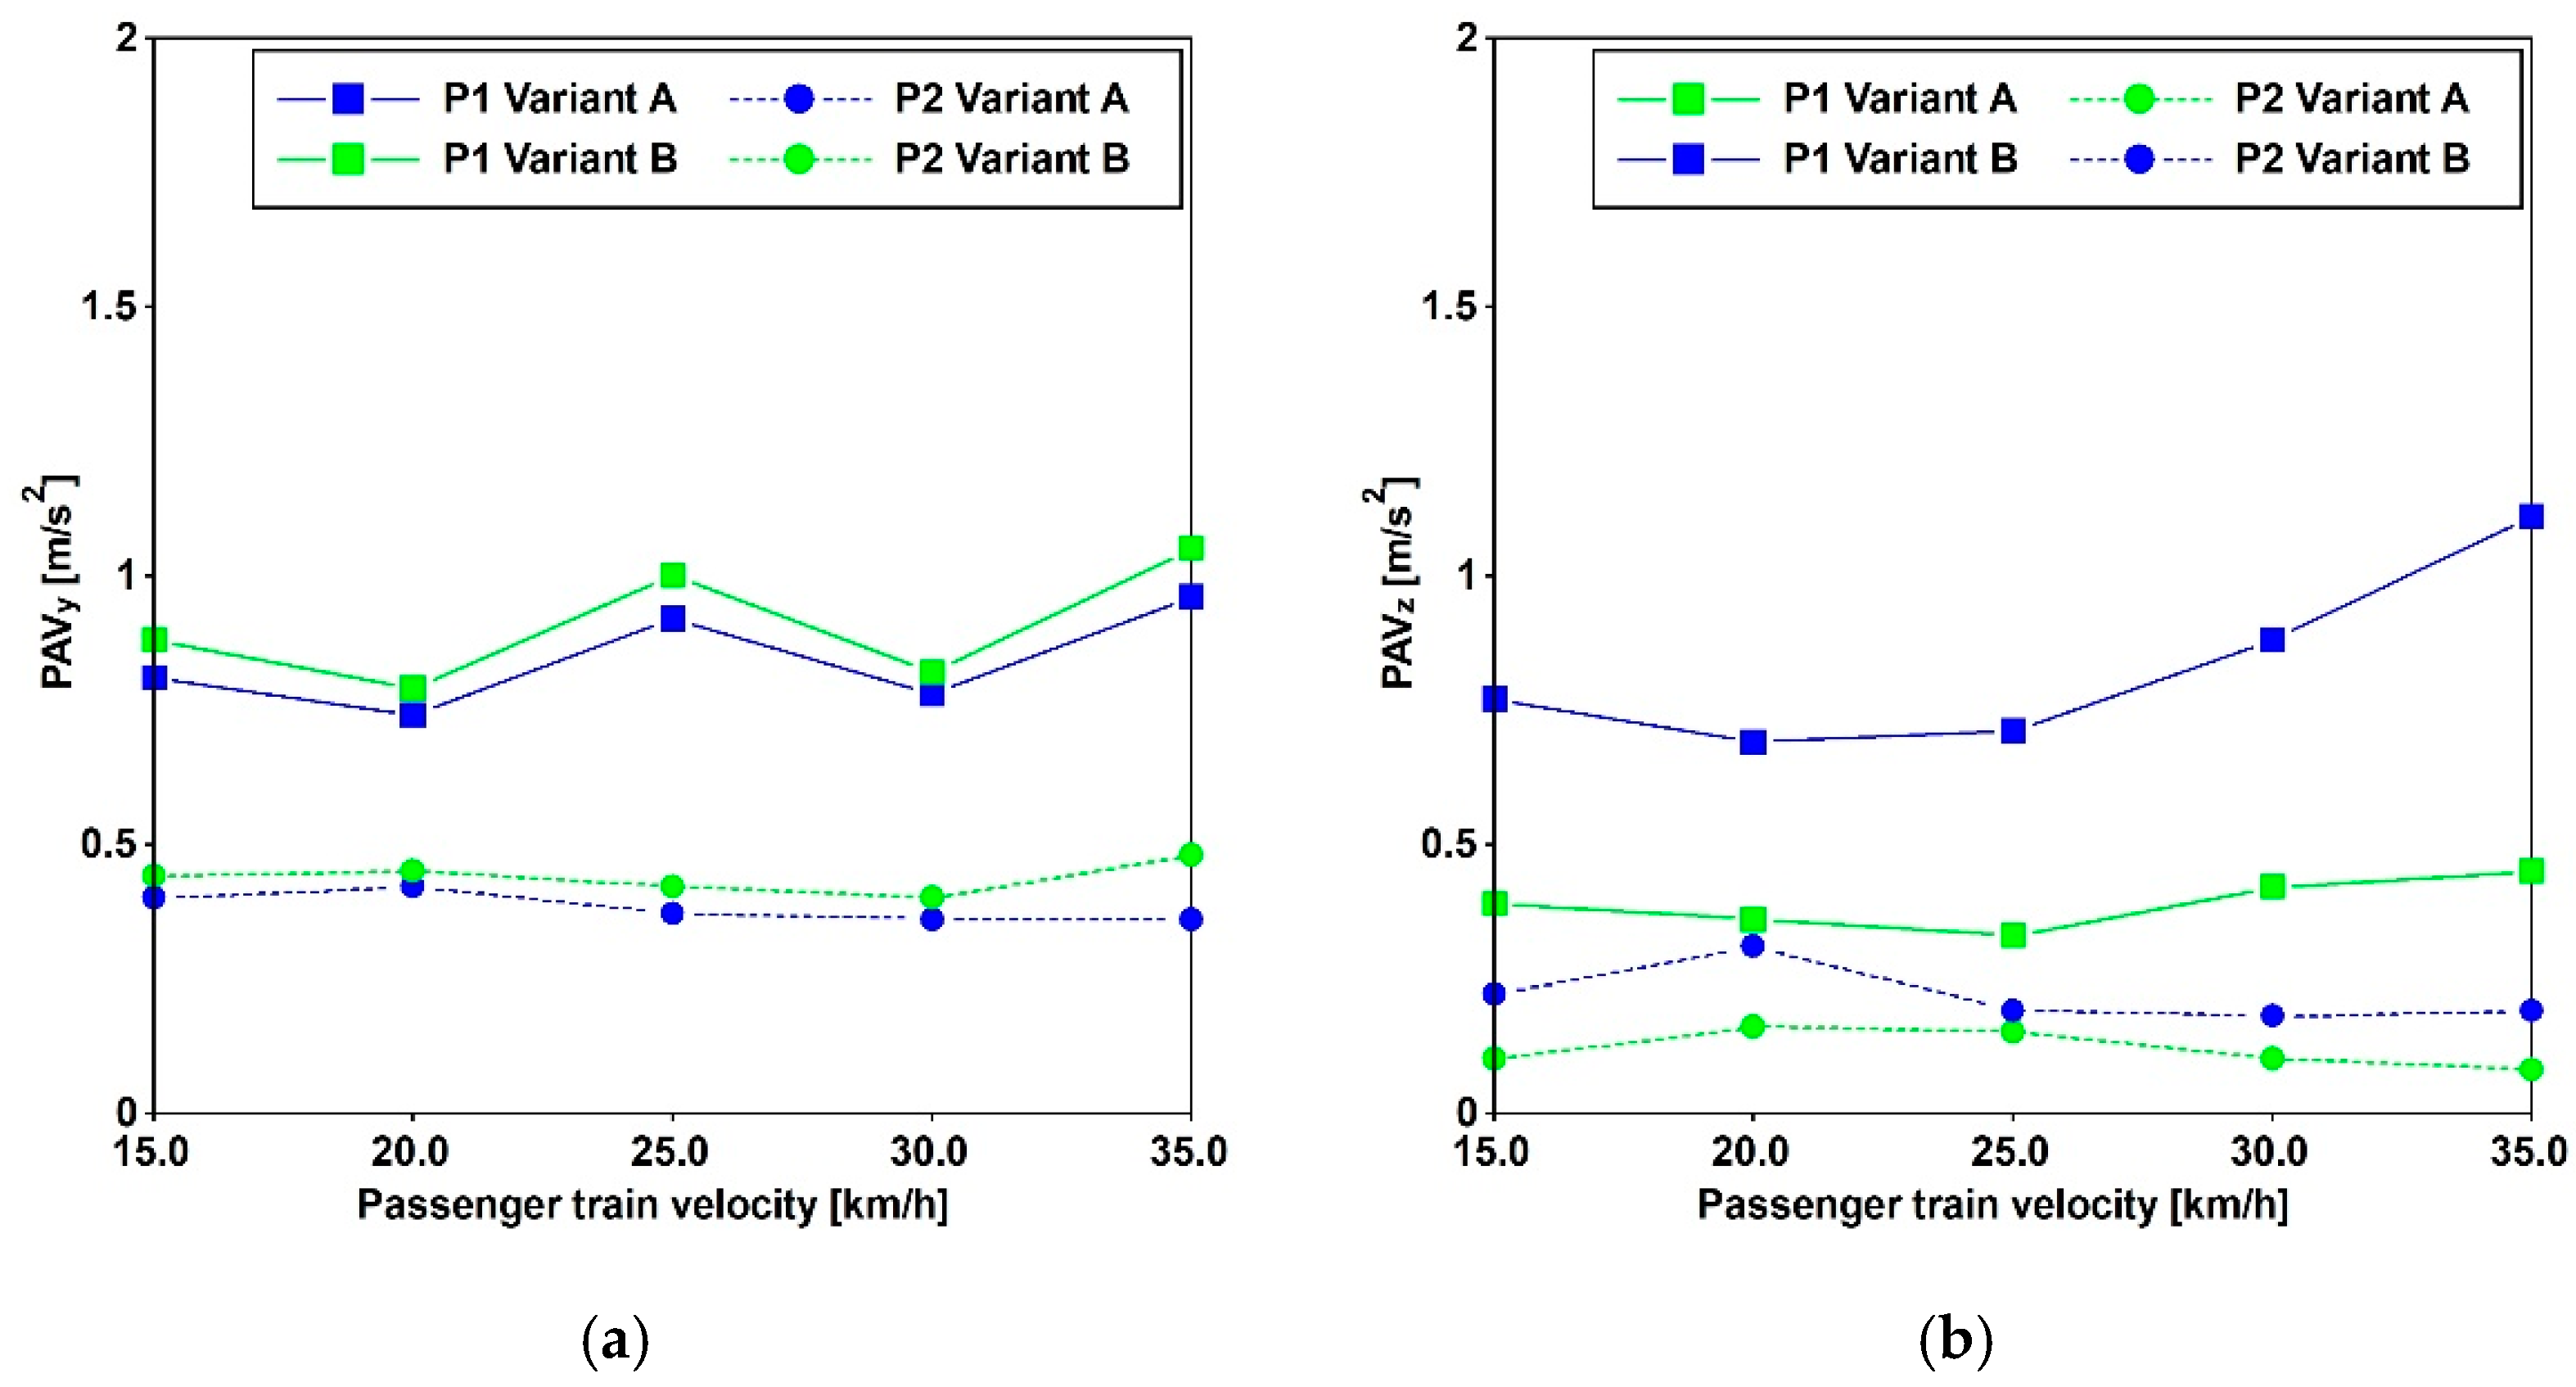
Additionally, the impact of both cargo and passenger trains operating at various velocities is detailed in [
29], utilizing data gathered at three specified positions differing in distance from the considered train position.
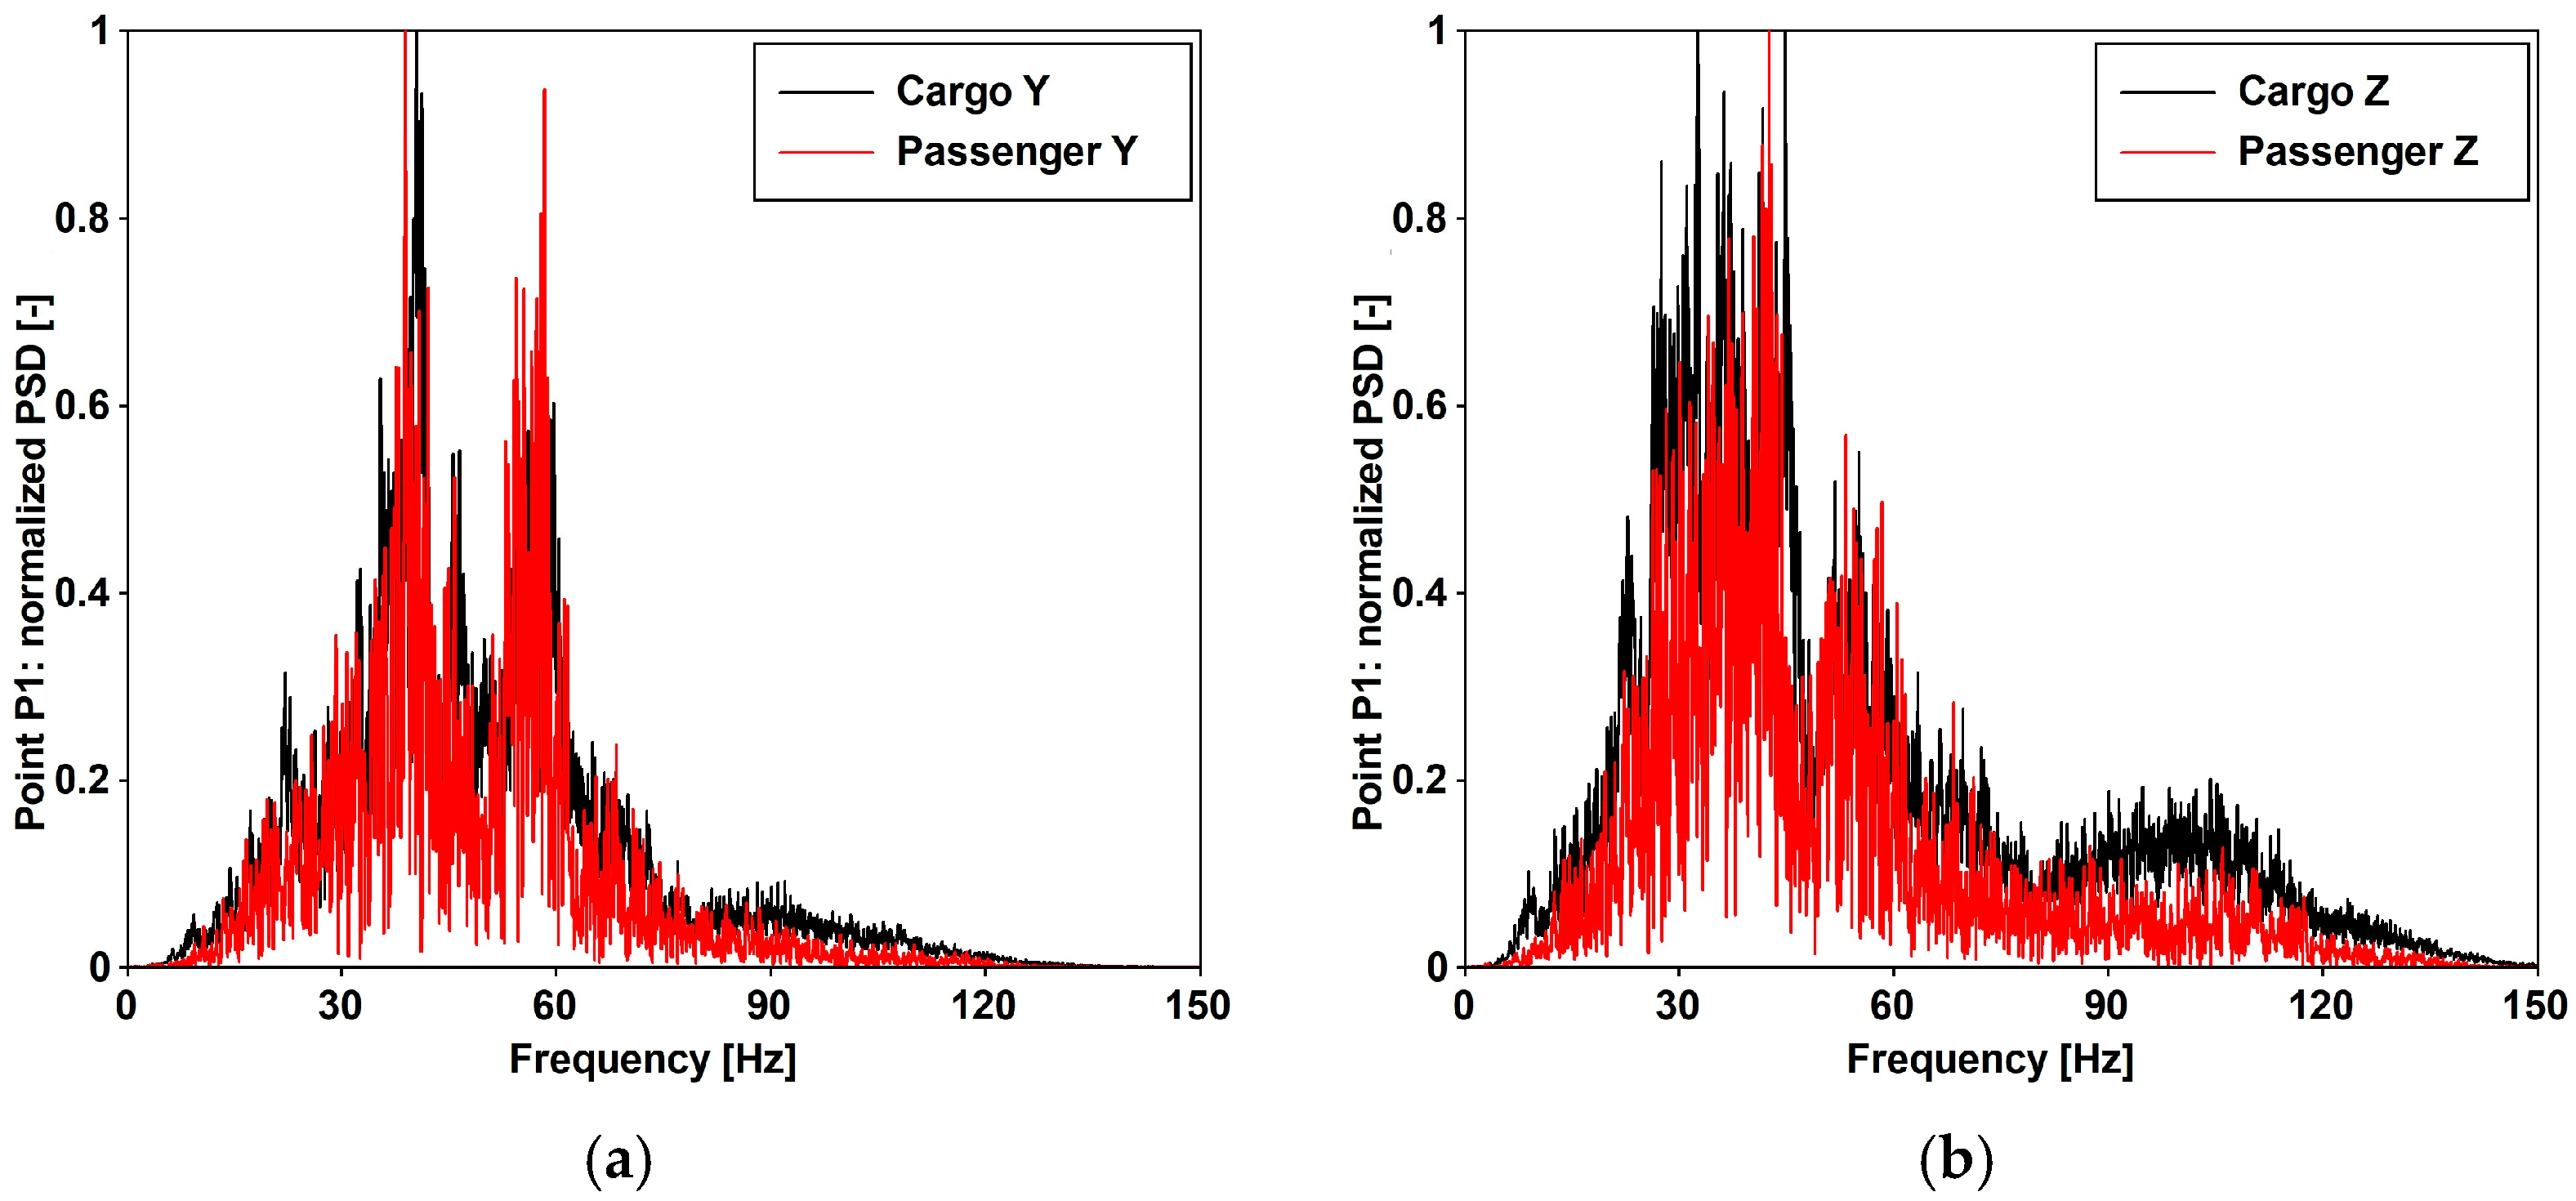
Figure 5 and
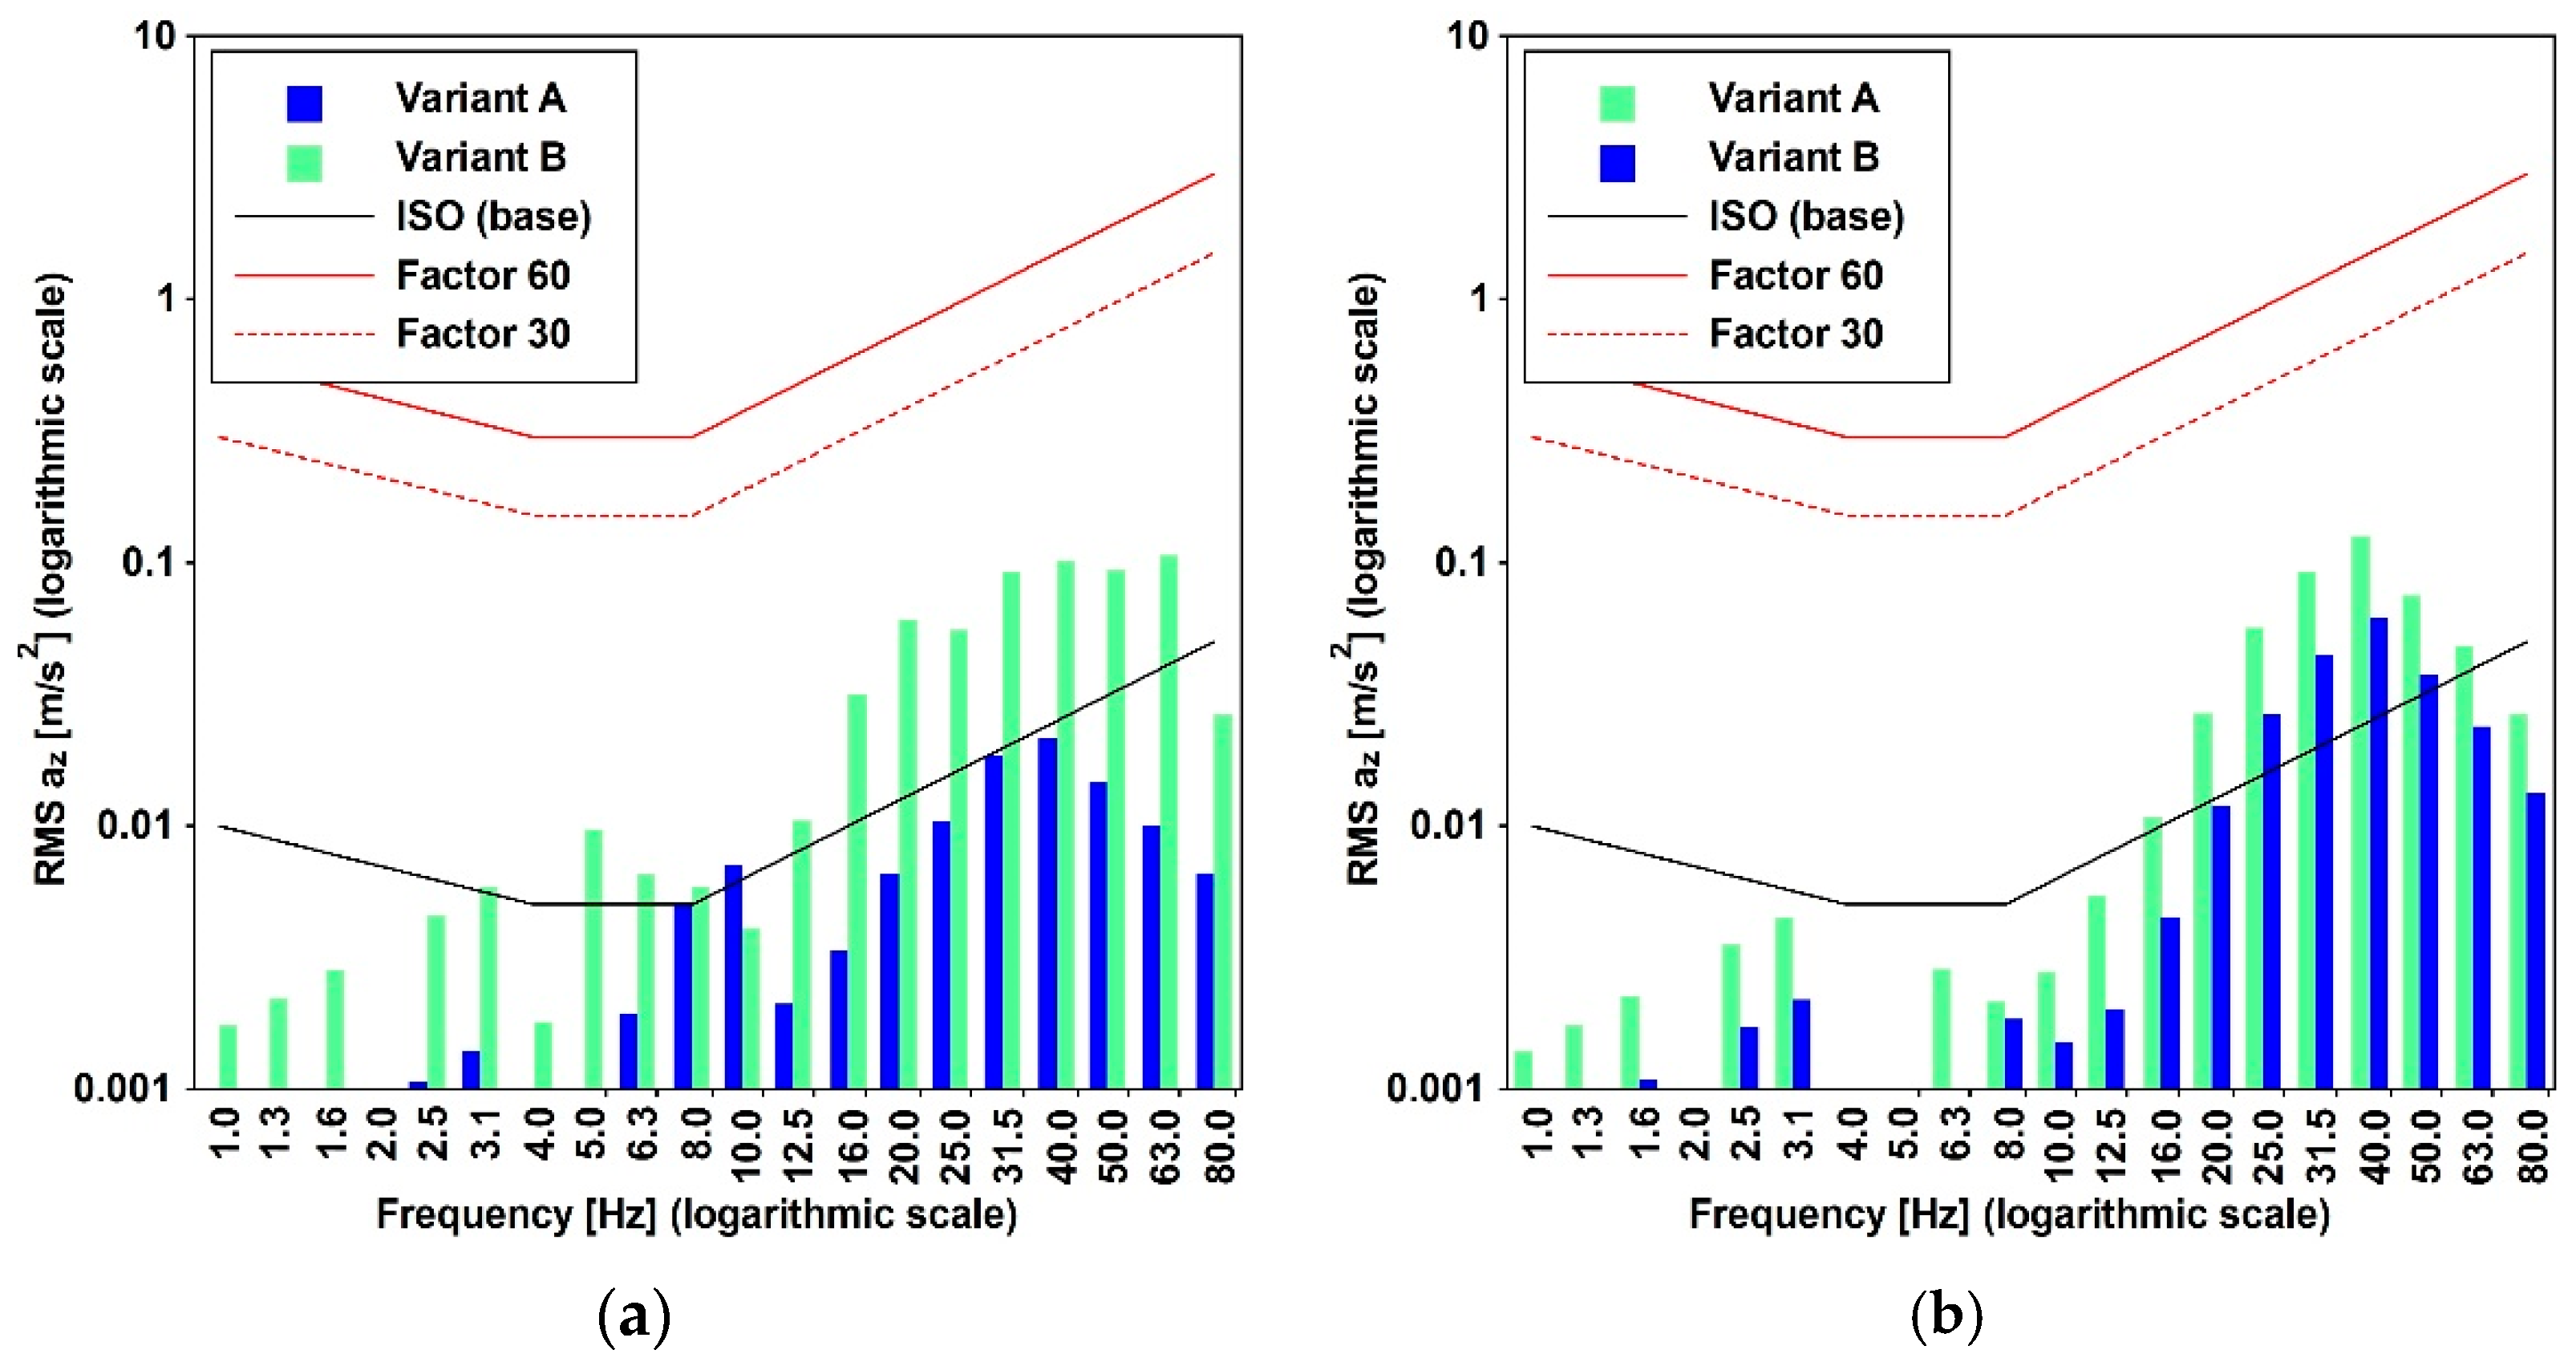
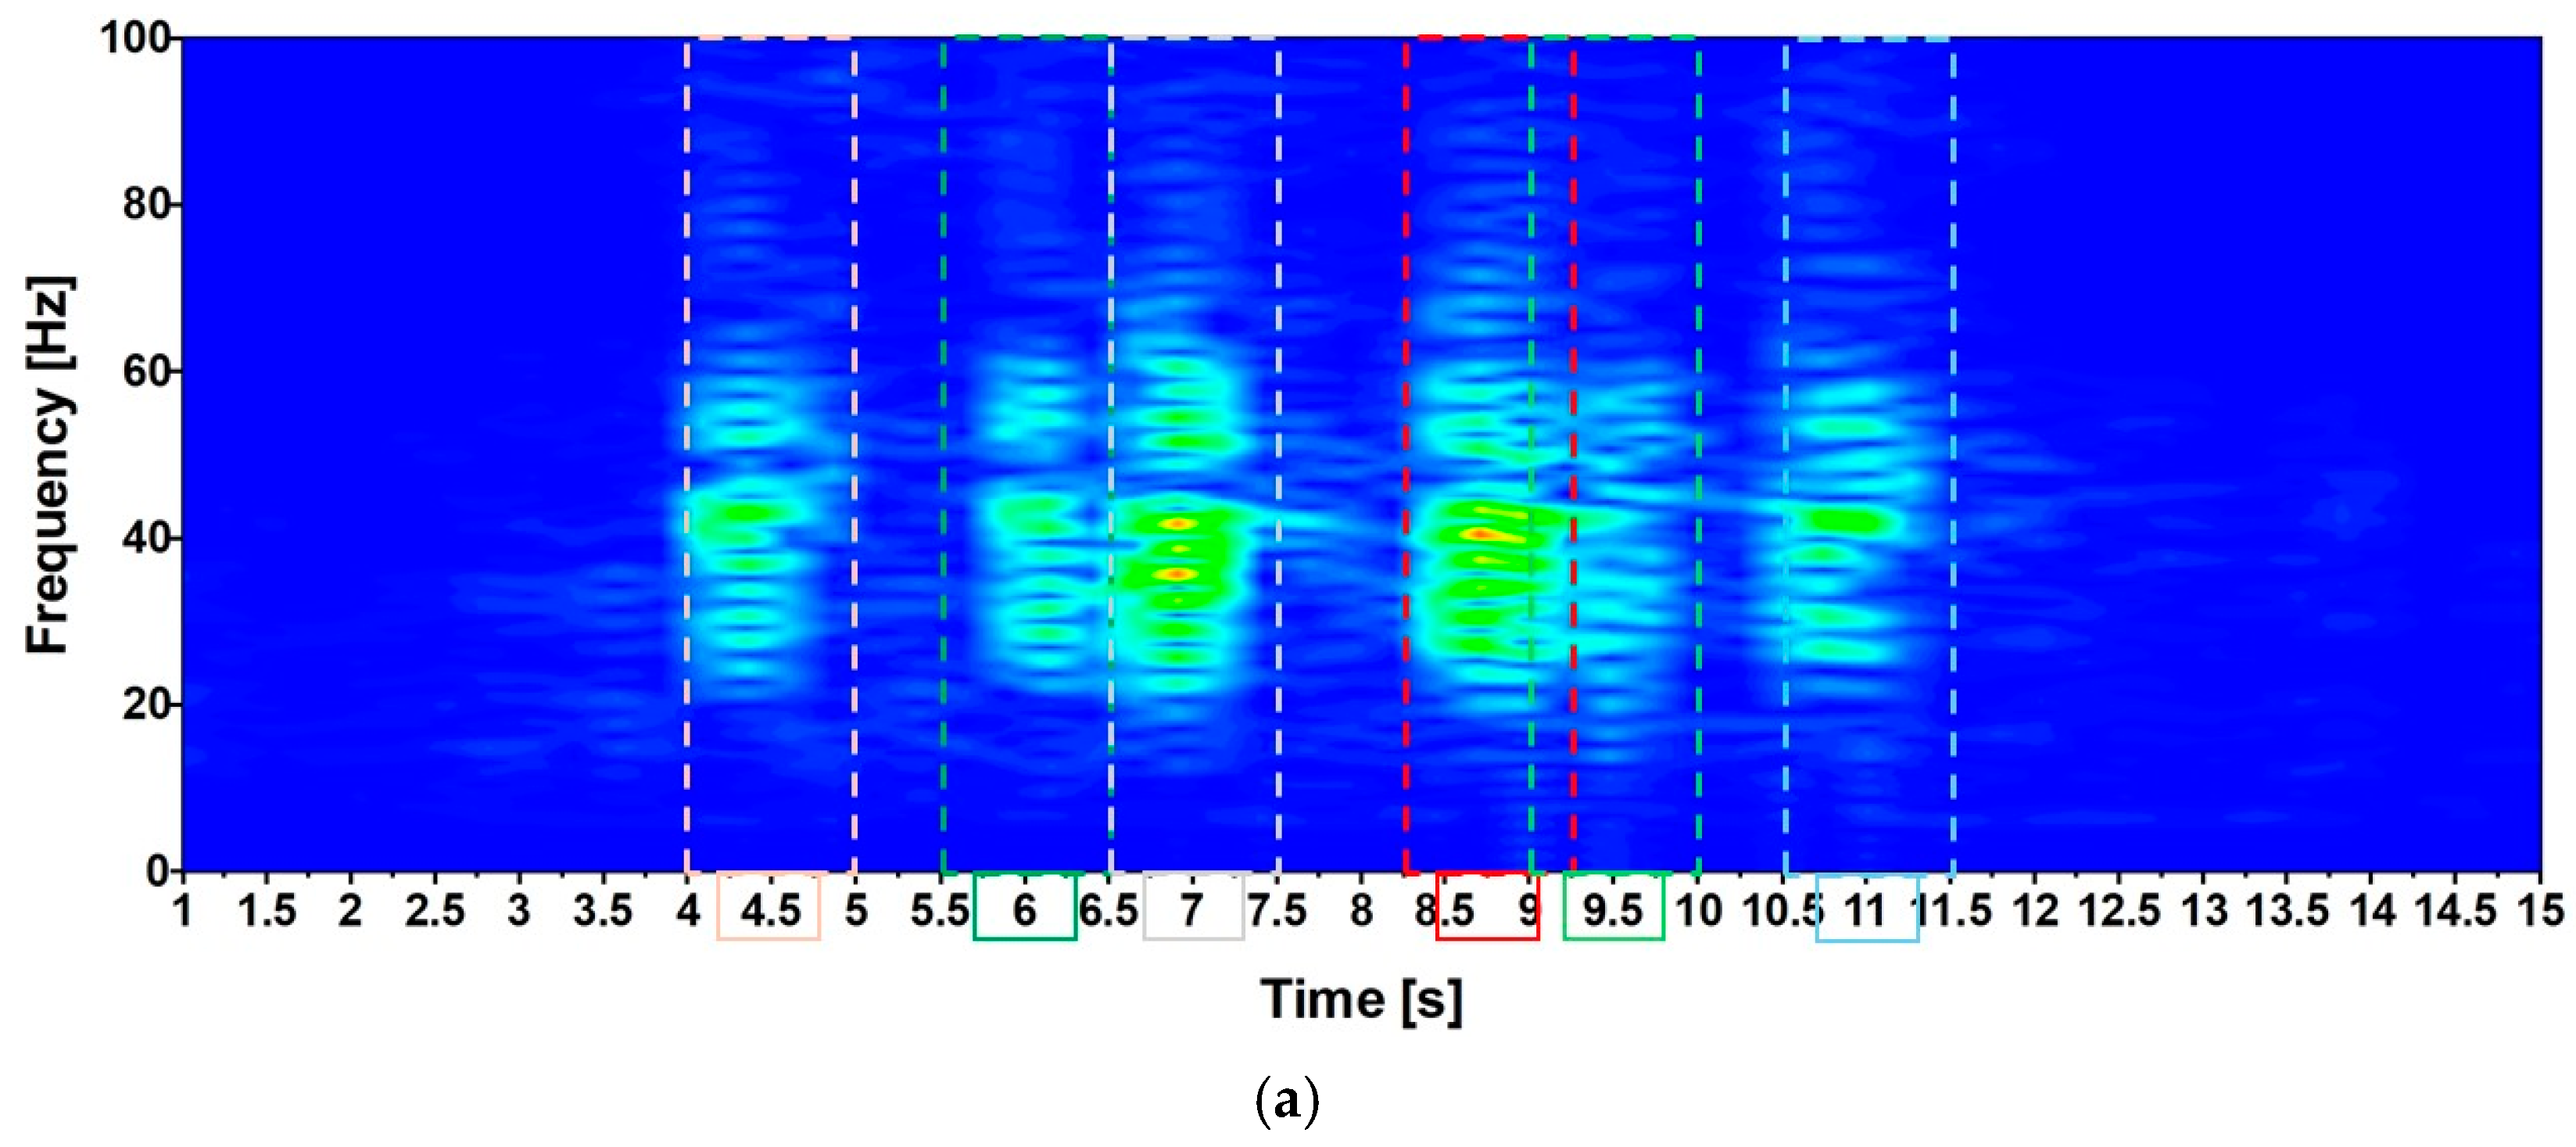
Table 4 provide the peak ground accelerations (PGAs) extracted from the acceleration time histories recorded at distances of 10 m (point P1) and 15 m (point P2). The frequency domain content of cargo and passenger trains traveling at a speed of 30 [km/h] is provided in
Figure 6.
2.2. Comfort Levels, Related Accelerations, and Design
SÉTRA [
13], Eurocode [
14], and the British Standard [
16] define the PAV threshold differently, considering it as a parameter crucial for ensuring an acceptable comfort level. It is important to acknowledge that these thresholds serve as reference values [
26], and adherence to them does not eliminate the possibility of resonance risk.
According to SÉTRA [
13], distinct ranges must be considered for PAV, as detailed in
Table 5. Further, the levels of resonance risk are defined based on a series of thresholds (refer to
Table 6).
According to Eurocode [
14], the acceptable values are as follows: (1)
for the vertical direction; (2) 0.2
for horizontal vibrations due to normal use and for exceptional crowd conditions. The British Standard [
16] establishes vertical lower and upper bound limits at
and
, respectively. It recommends evaluating the
according to Equation (10), where the value of
(exposure factor) can be equal to 1. Additionally, as outlined in
Table 7, the other factor depends on site usage (
), redundancy (
), and structure height (
).
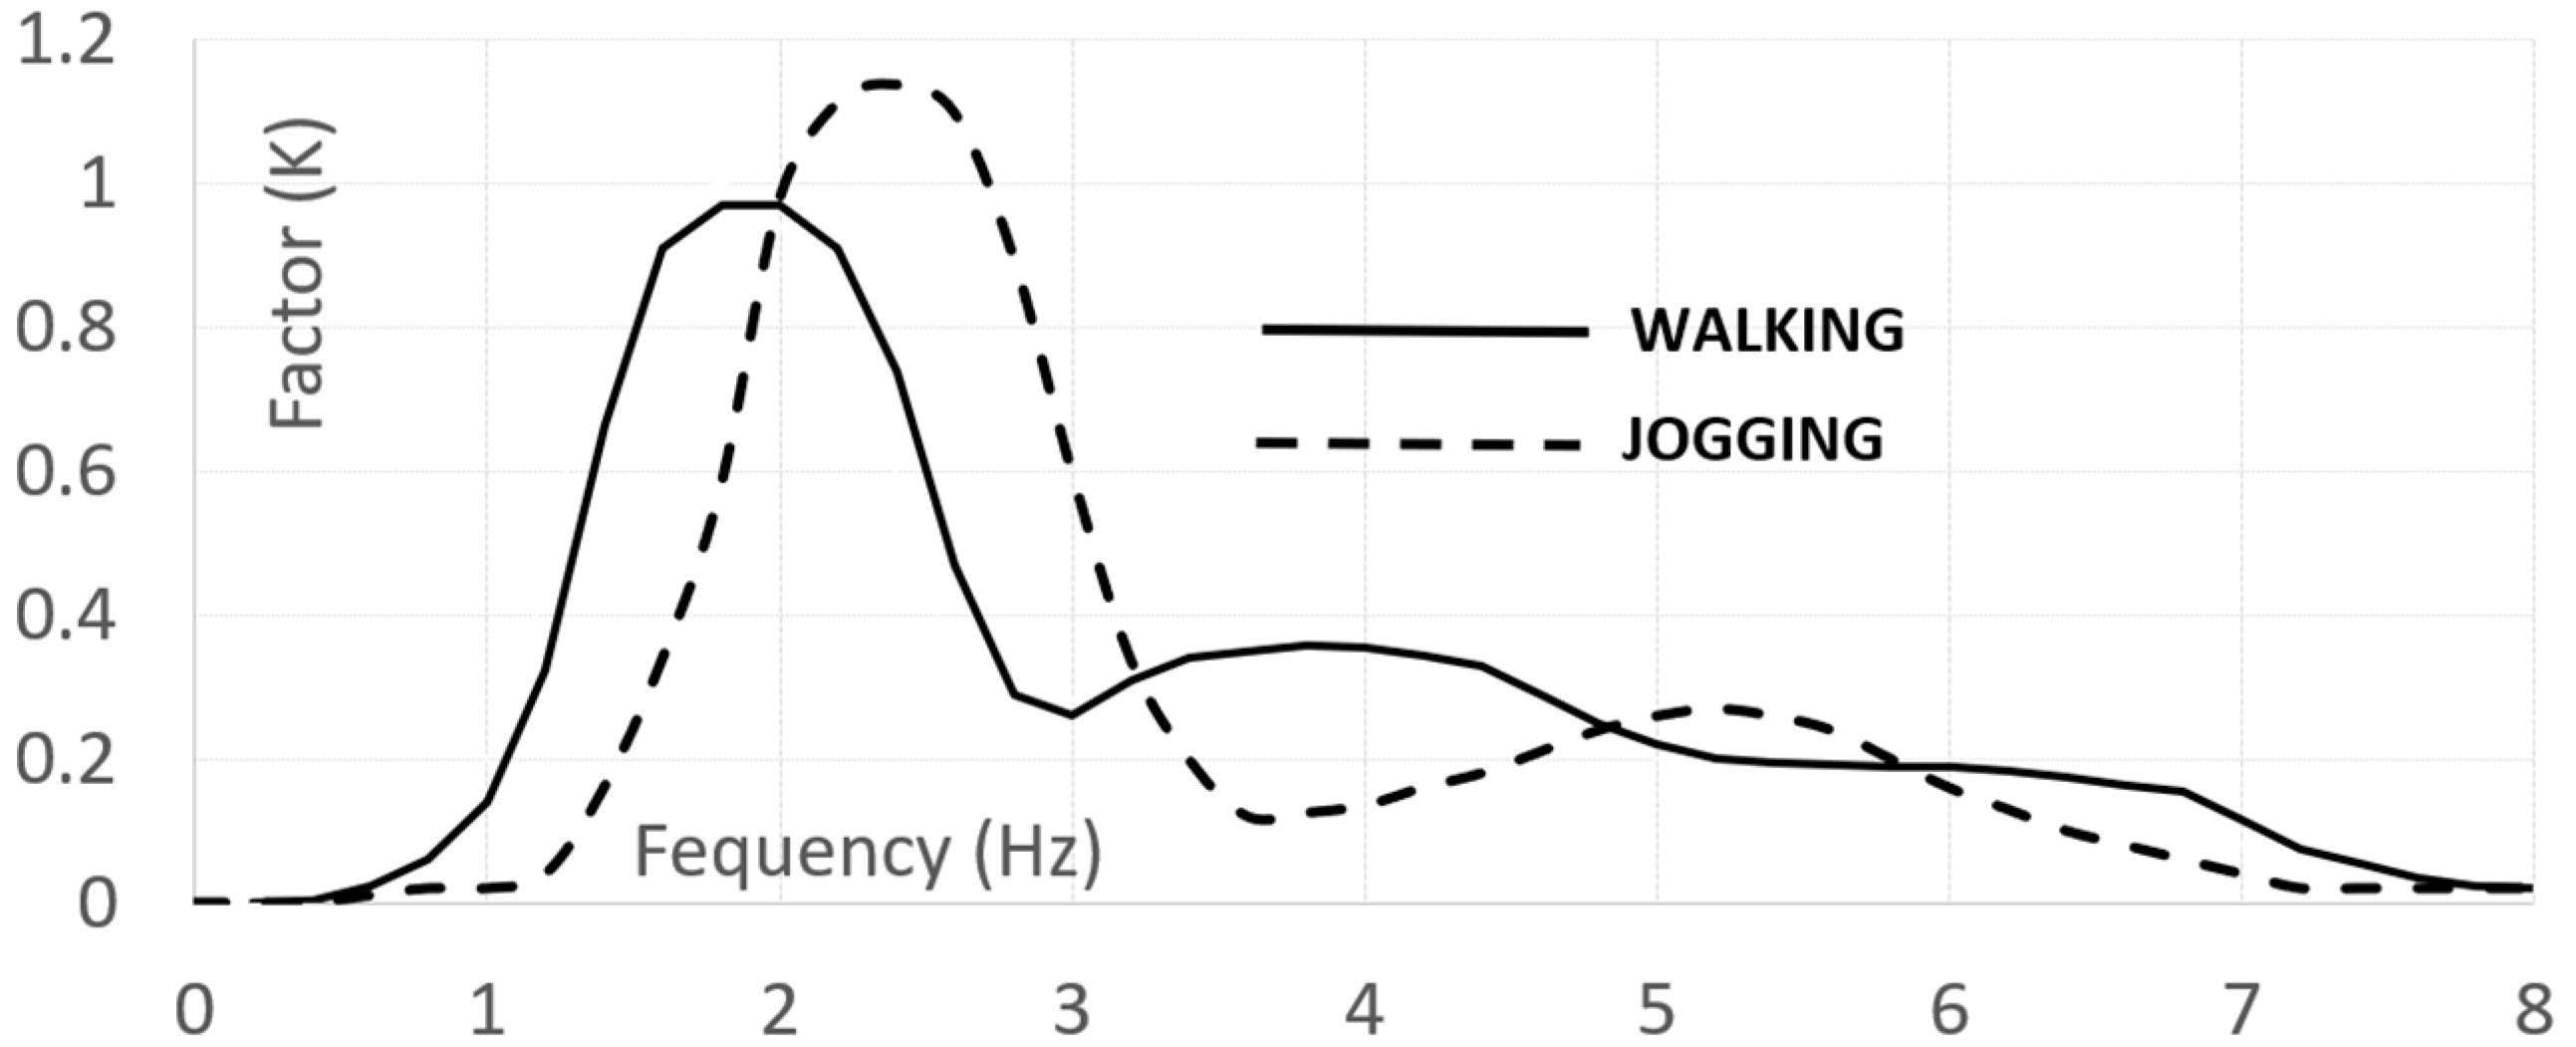
According to ISO [
15], the root mean square (RMS) is chosen, according to Equation (11), as parameter, assuming
. Thresholds are defined based on the frequency and acceleration direction, using a reference system local to the human body. The considered directions are horizontal and vertical, being further classified as side-to-side, back-to-chest, and foot-to-head. Pedestrian activity is classified as walking or standing depending on the velocity. The recommended normalized RMS values are reported in
Figure 7. These values need to be appropriately scaled using the factors reported in
Table 8.
The previous synthesis, referring to the frequency values reported in
Table 9, outlines that the Prato truss bridge and the U-shaped Blackpool bridge adhere to the Euro Codes [
17], which permit the omission of specific studies when vertical and horizontal frequencies surpass 5.0 and 2.5 [Hz], respectively. The Kolding structure is close to the recommended threshold. Furthermore, when considering the defined threshold in SÉTRA [
13], the risk of resonance is as follows: (1) Aberfeldy has a medium and maximum risk for vertical and horizontal frequencies, respectively; (2) Lleida has a low risk; and (3) Wilcott has a maximum risk.


