
Optimization of Graphene Nanoplatelets Dispersion and Its Performance in Cement Mortars


 ,
, 
Abstract
1. Introduction
2. Materials and Methods
2.1. Raw Materials
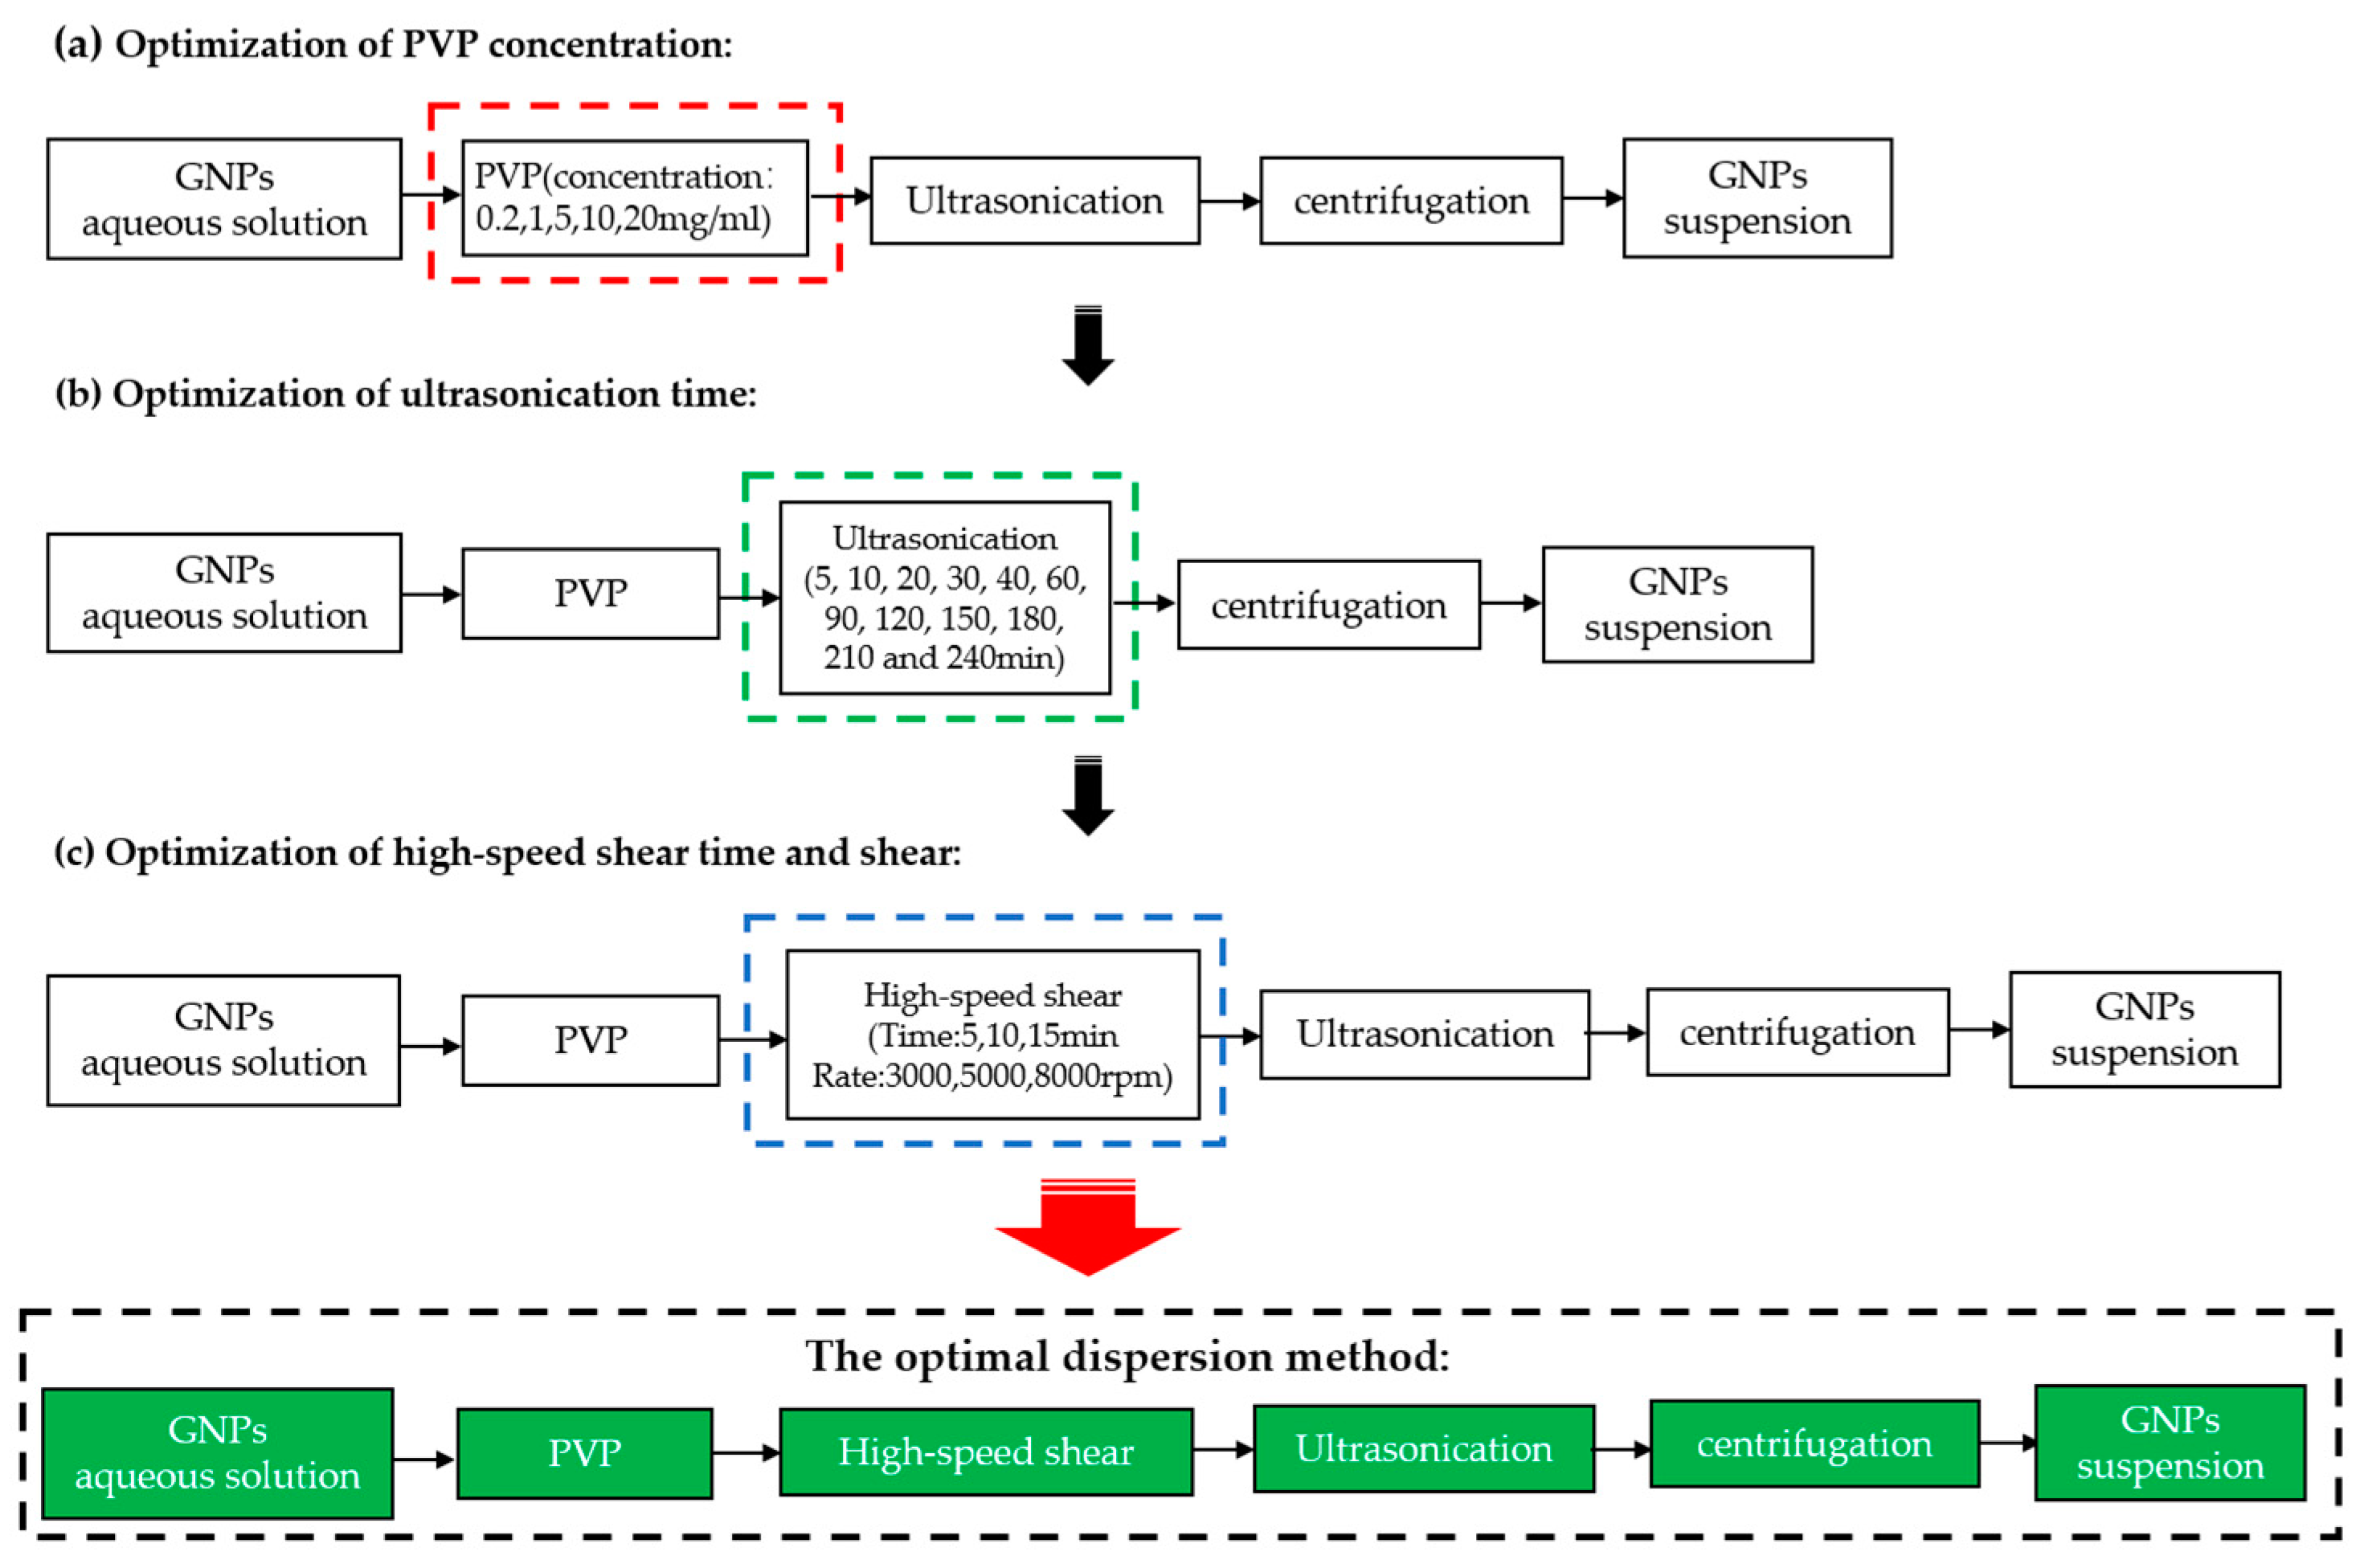
2.2. Optimization of Dispersion Parameters
- (a)
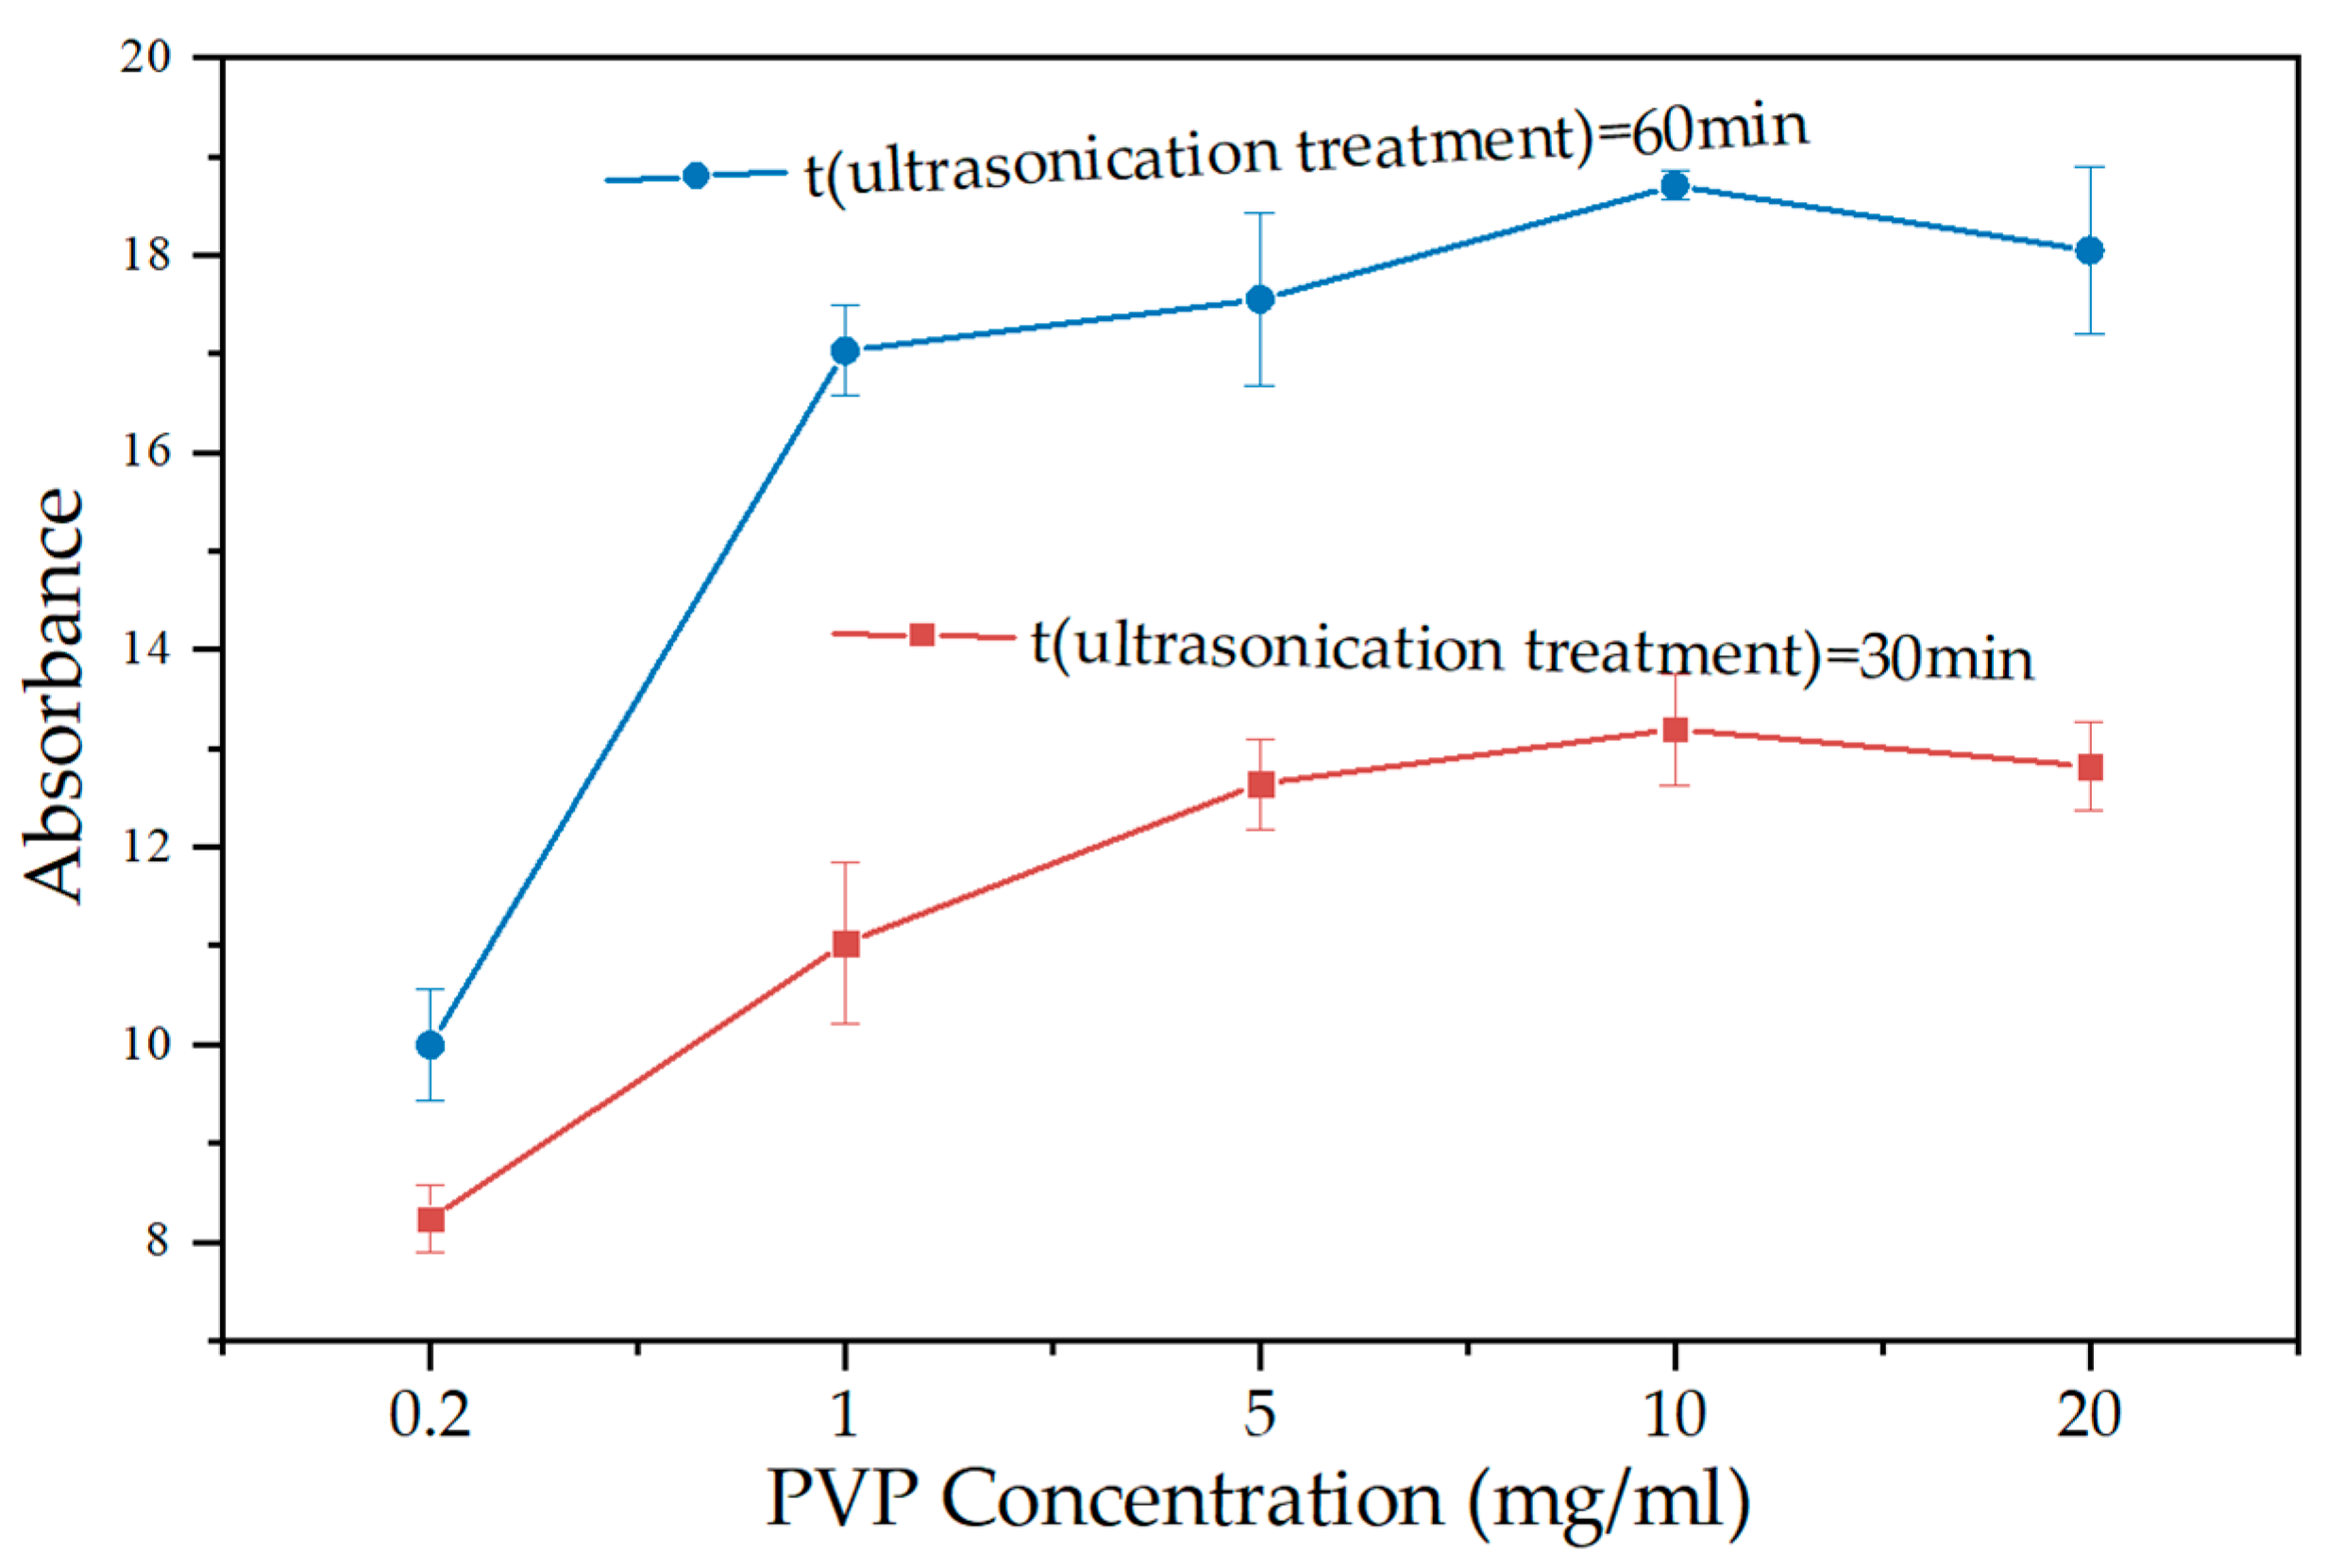
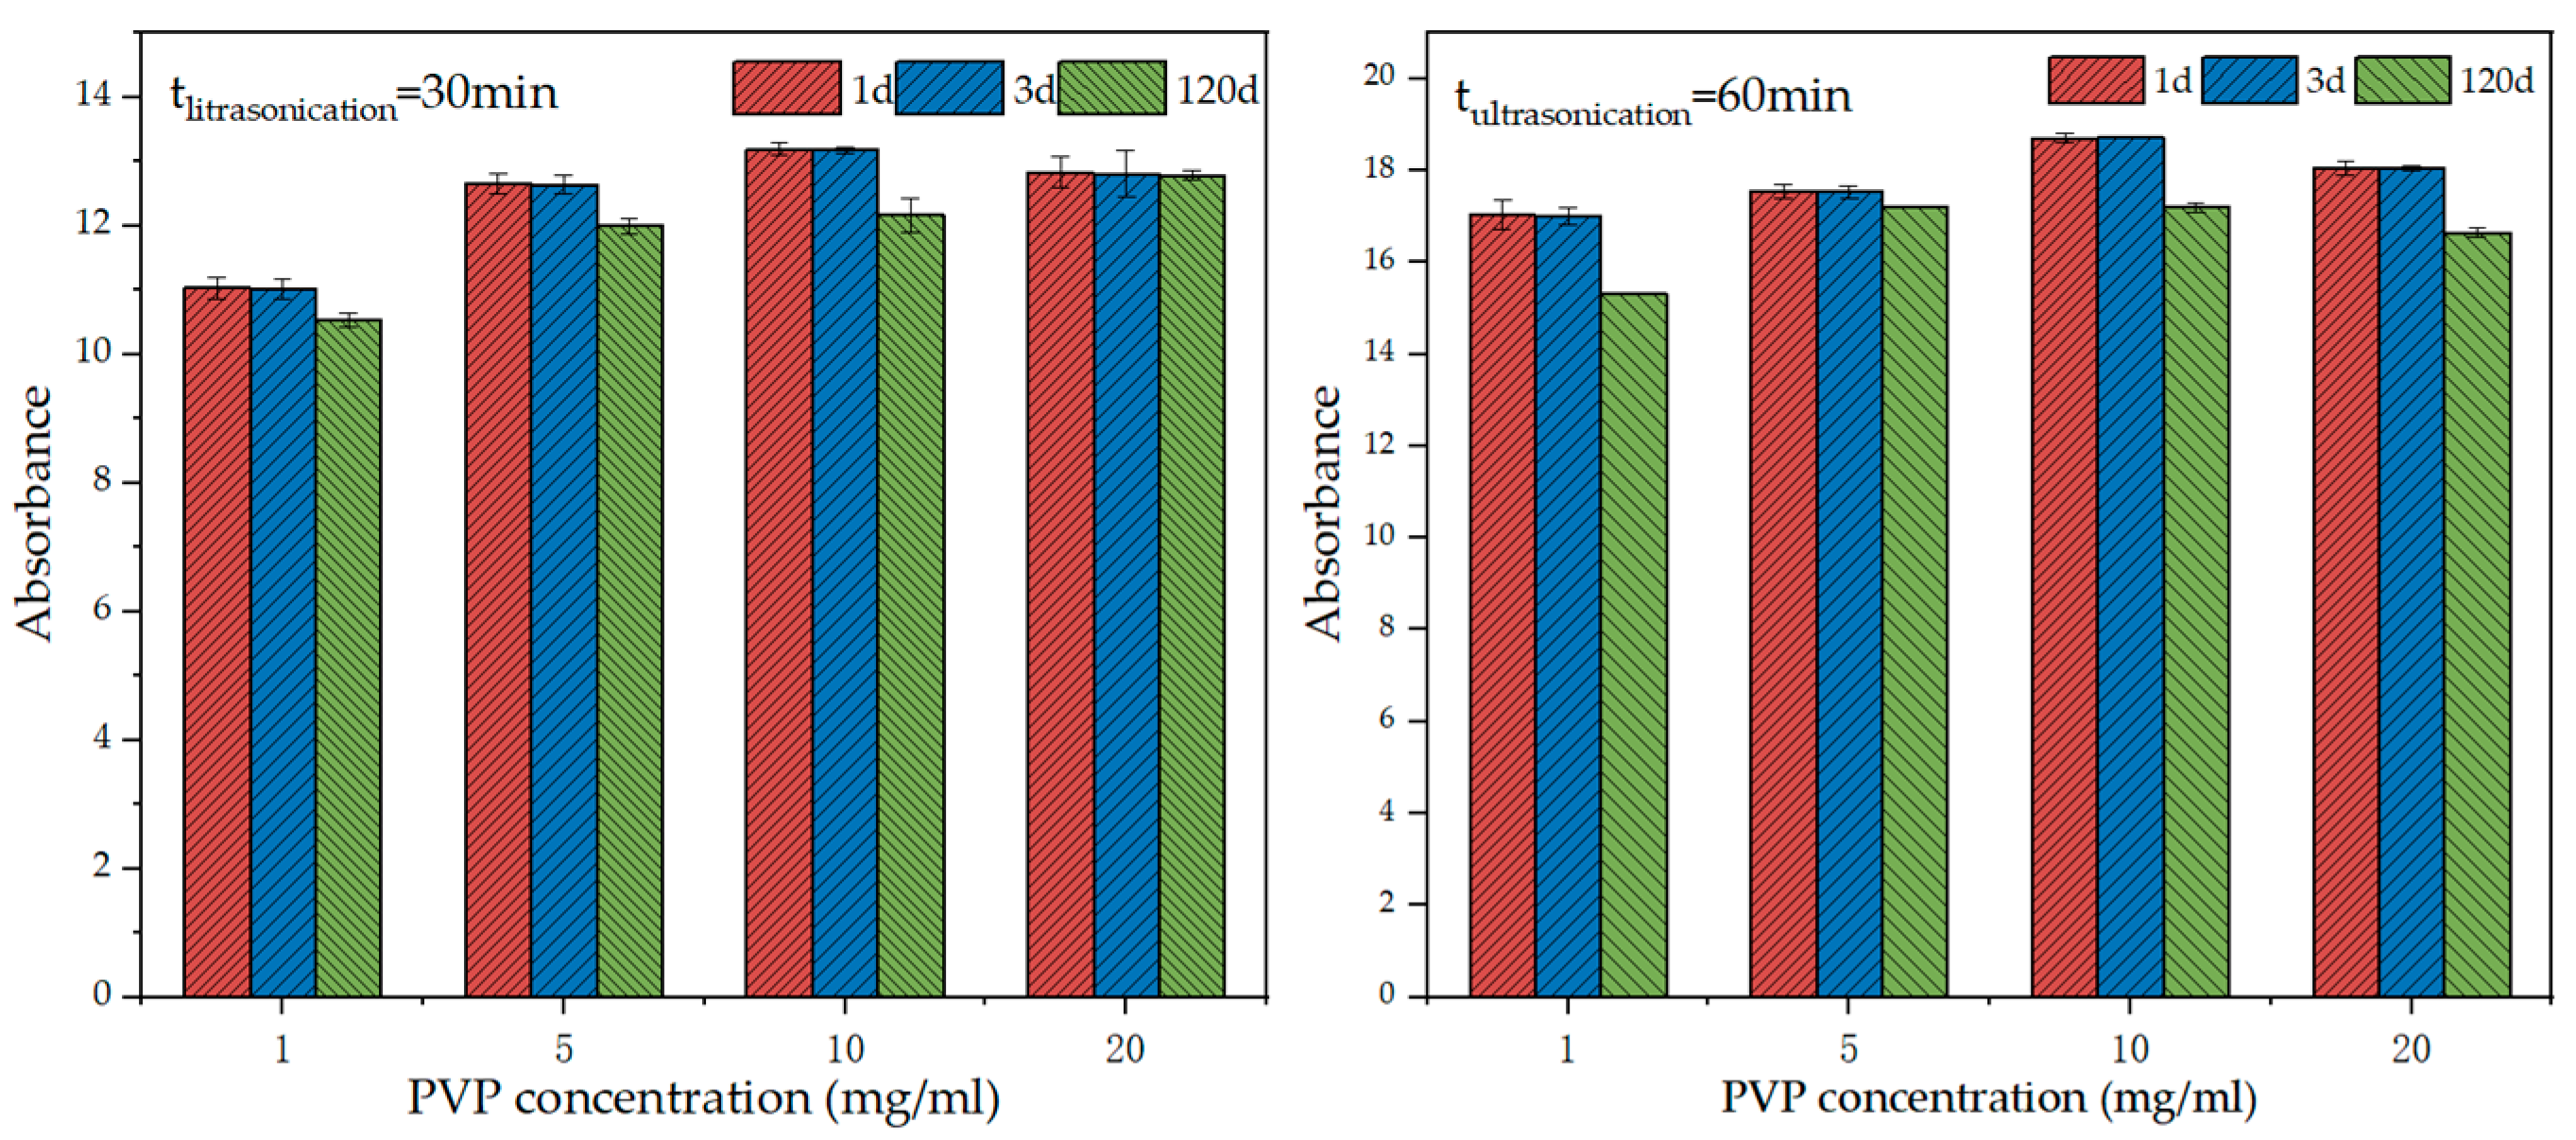
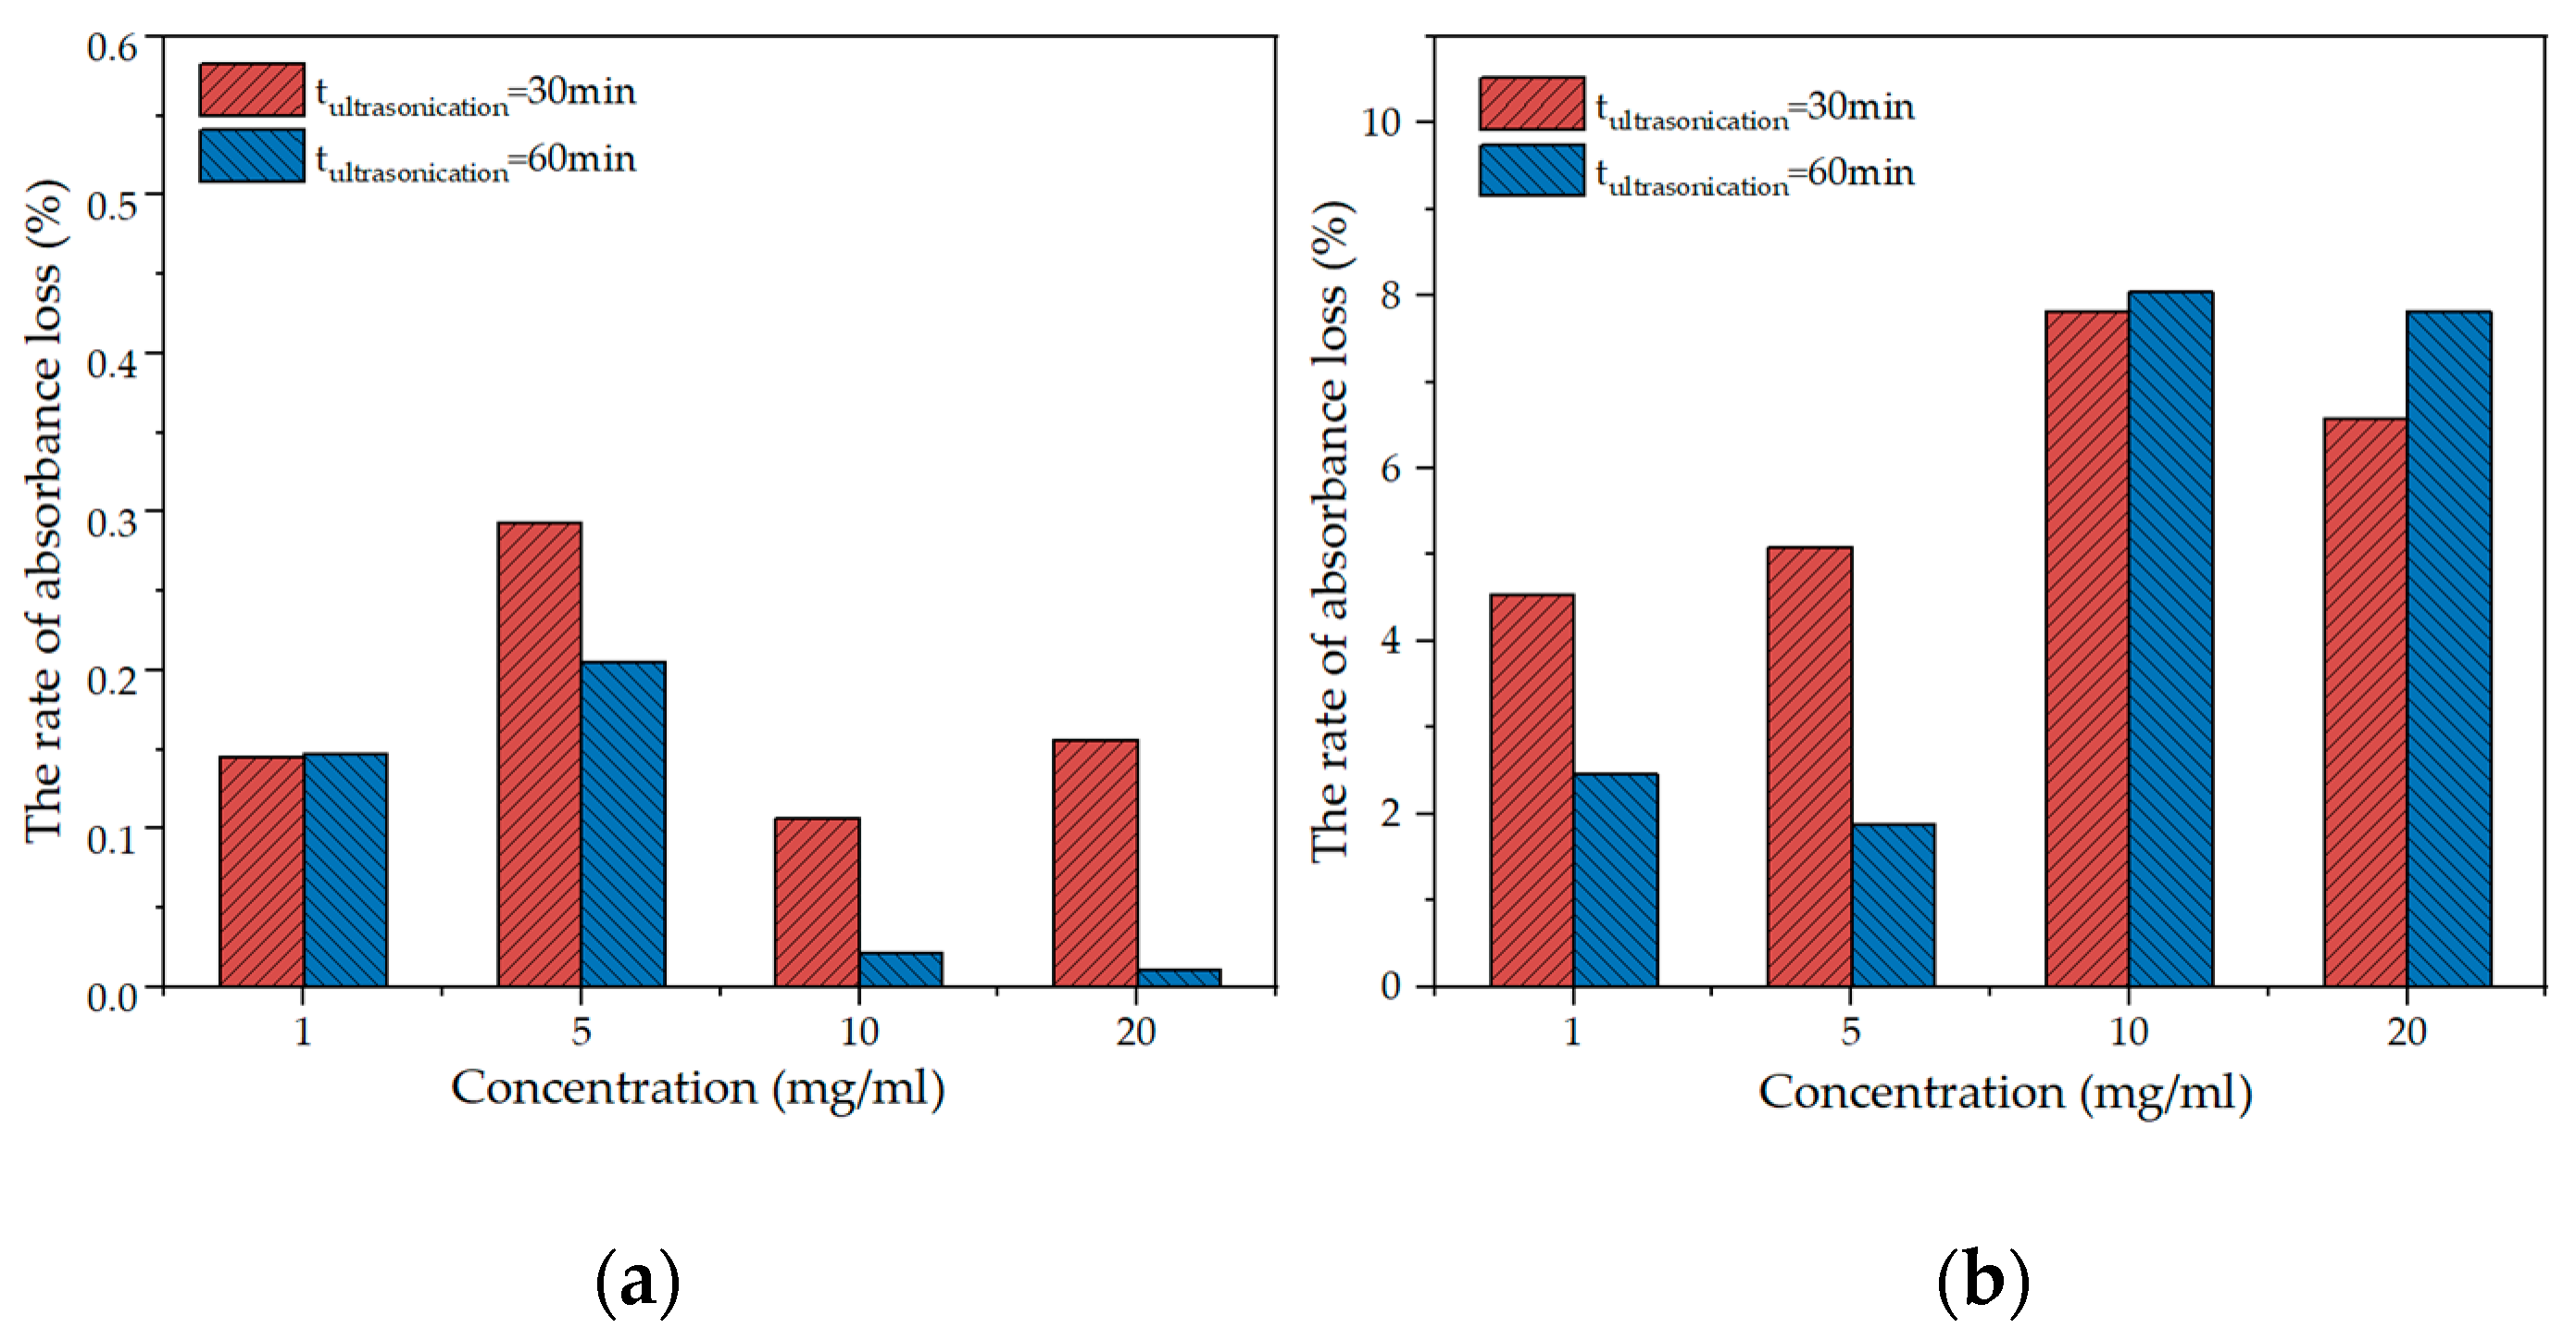
- Optimization of PVP concentration: PVP of 0.02, 0.1, 0.5, 1, and 2% concentration (wt% of the GNPs) were mixed with GNPs (1 g) in 100 mL water and stirred evenly with a glass rod. For each PVP concentration, the number of prepared samples in one group is six. Three mixed GNPs suspensions were subjected to a 30 min ultrasonication, and the other three suspensions were ultrasonicated for 60 min at 650 W. Finally, the absorbance of GNPs suspension was measured after centrifugation at 8000 rpm for 15 min. In order to obtain a stable suspension as quickly as possible. Centrifugation is used to remove the slag in the GNPs suspension, and then take the upper layer solution to measure the absorbance. After the measurement, the solution was cured at a temperature of 20 ± 3 °C and humidity of 95 ± 5%. Then, the absorbance was tested again after curing for 1, 3, and 120 days and the dispersion stability was evaluated by calculating the rate of absorbance loss (R) at 3 and 120 days, respectively. The absorbance loss rate was calculated by Equation (1):where R is the rate of absorbance loss; Ab1d is the absorbance of GNPs suspension at 1d; Abt is the absorbance of GNPs suspension at 3 d or 120 d. The optimal PVP concentration was determined by the value of absorbance and the absorbance loss rate.
- (b)
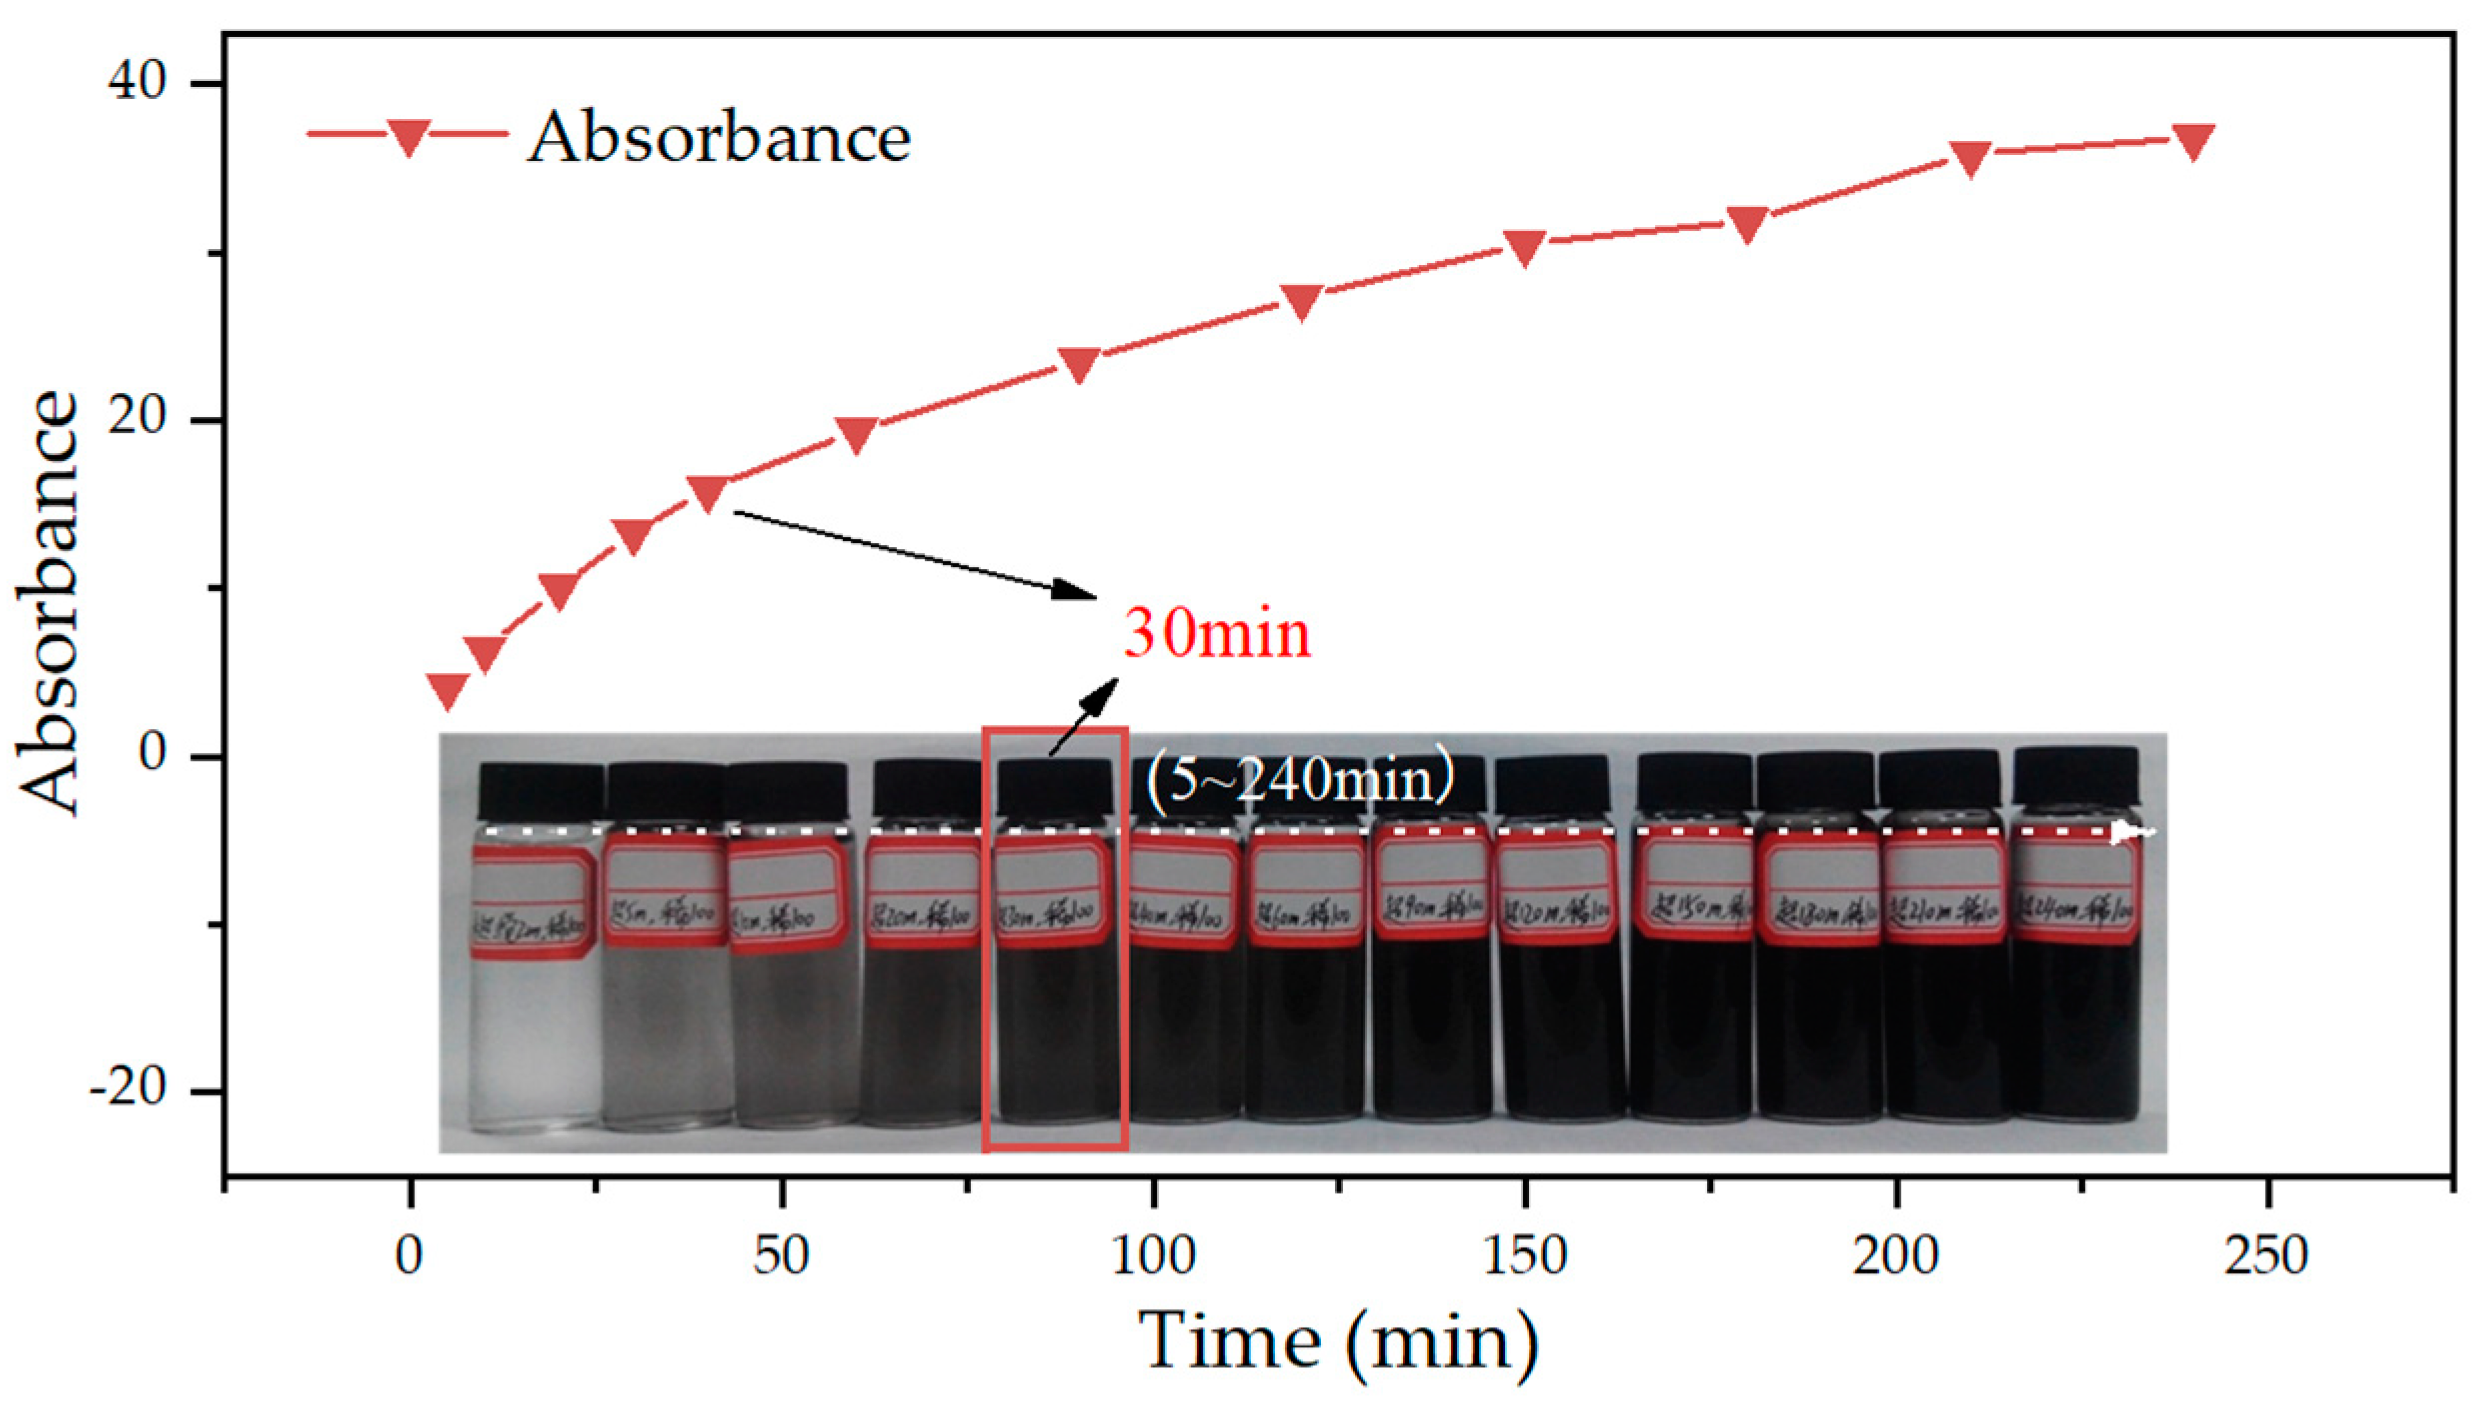
- Optimization of ultrasonication time: The GNPs suspension with optimal PVP concentration was used to optimize the ultrasonication time. The absorbance and the color of the GNPs suspension were evaluated on various ultrasonication time of 5, 10, 20, 30, 40, 60, 90, 120, 150, 180, 210, and 240 min. For each ultrasonication time, three mixed GNPs suspensions were tested. The optimal ultrasonication time was then determined.
- (c)
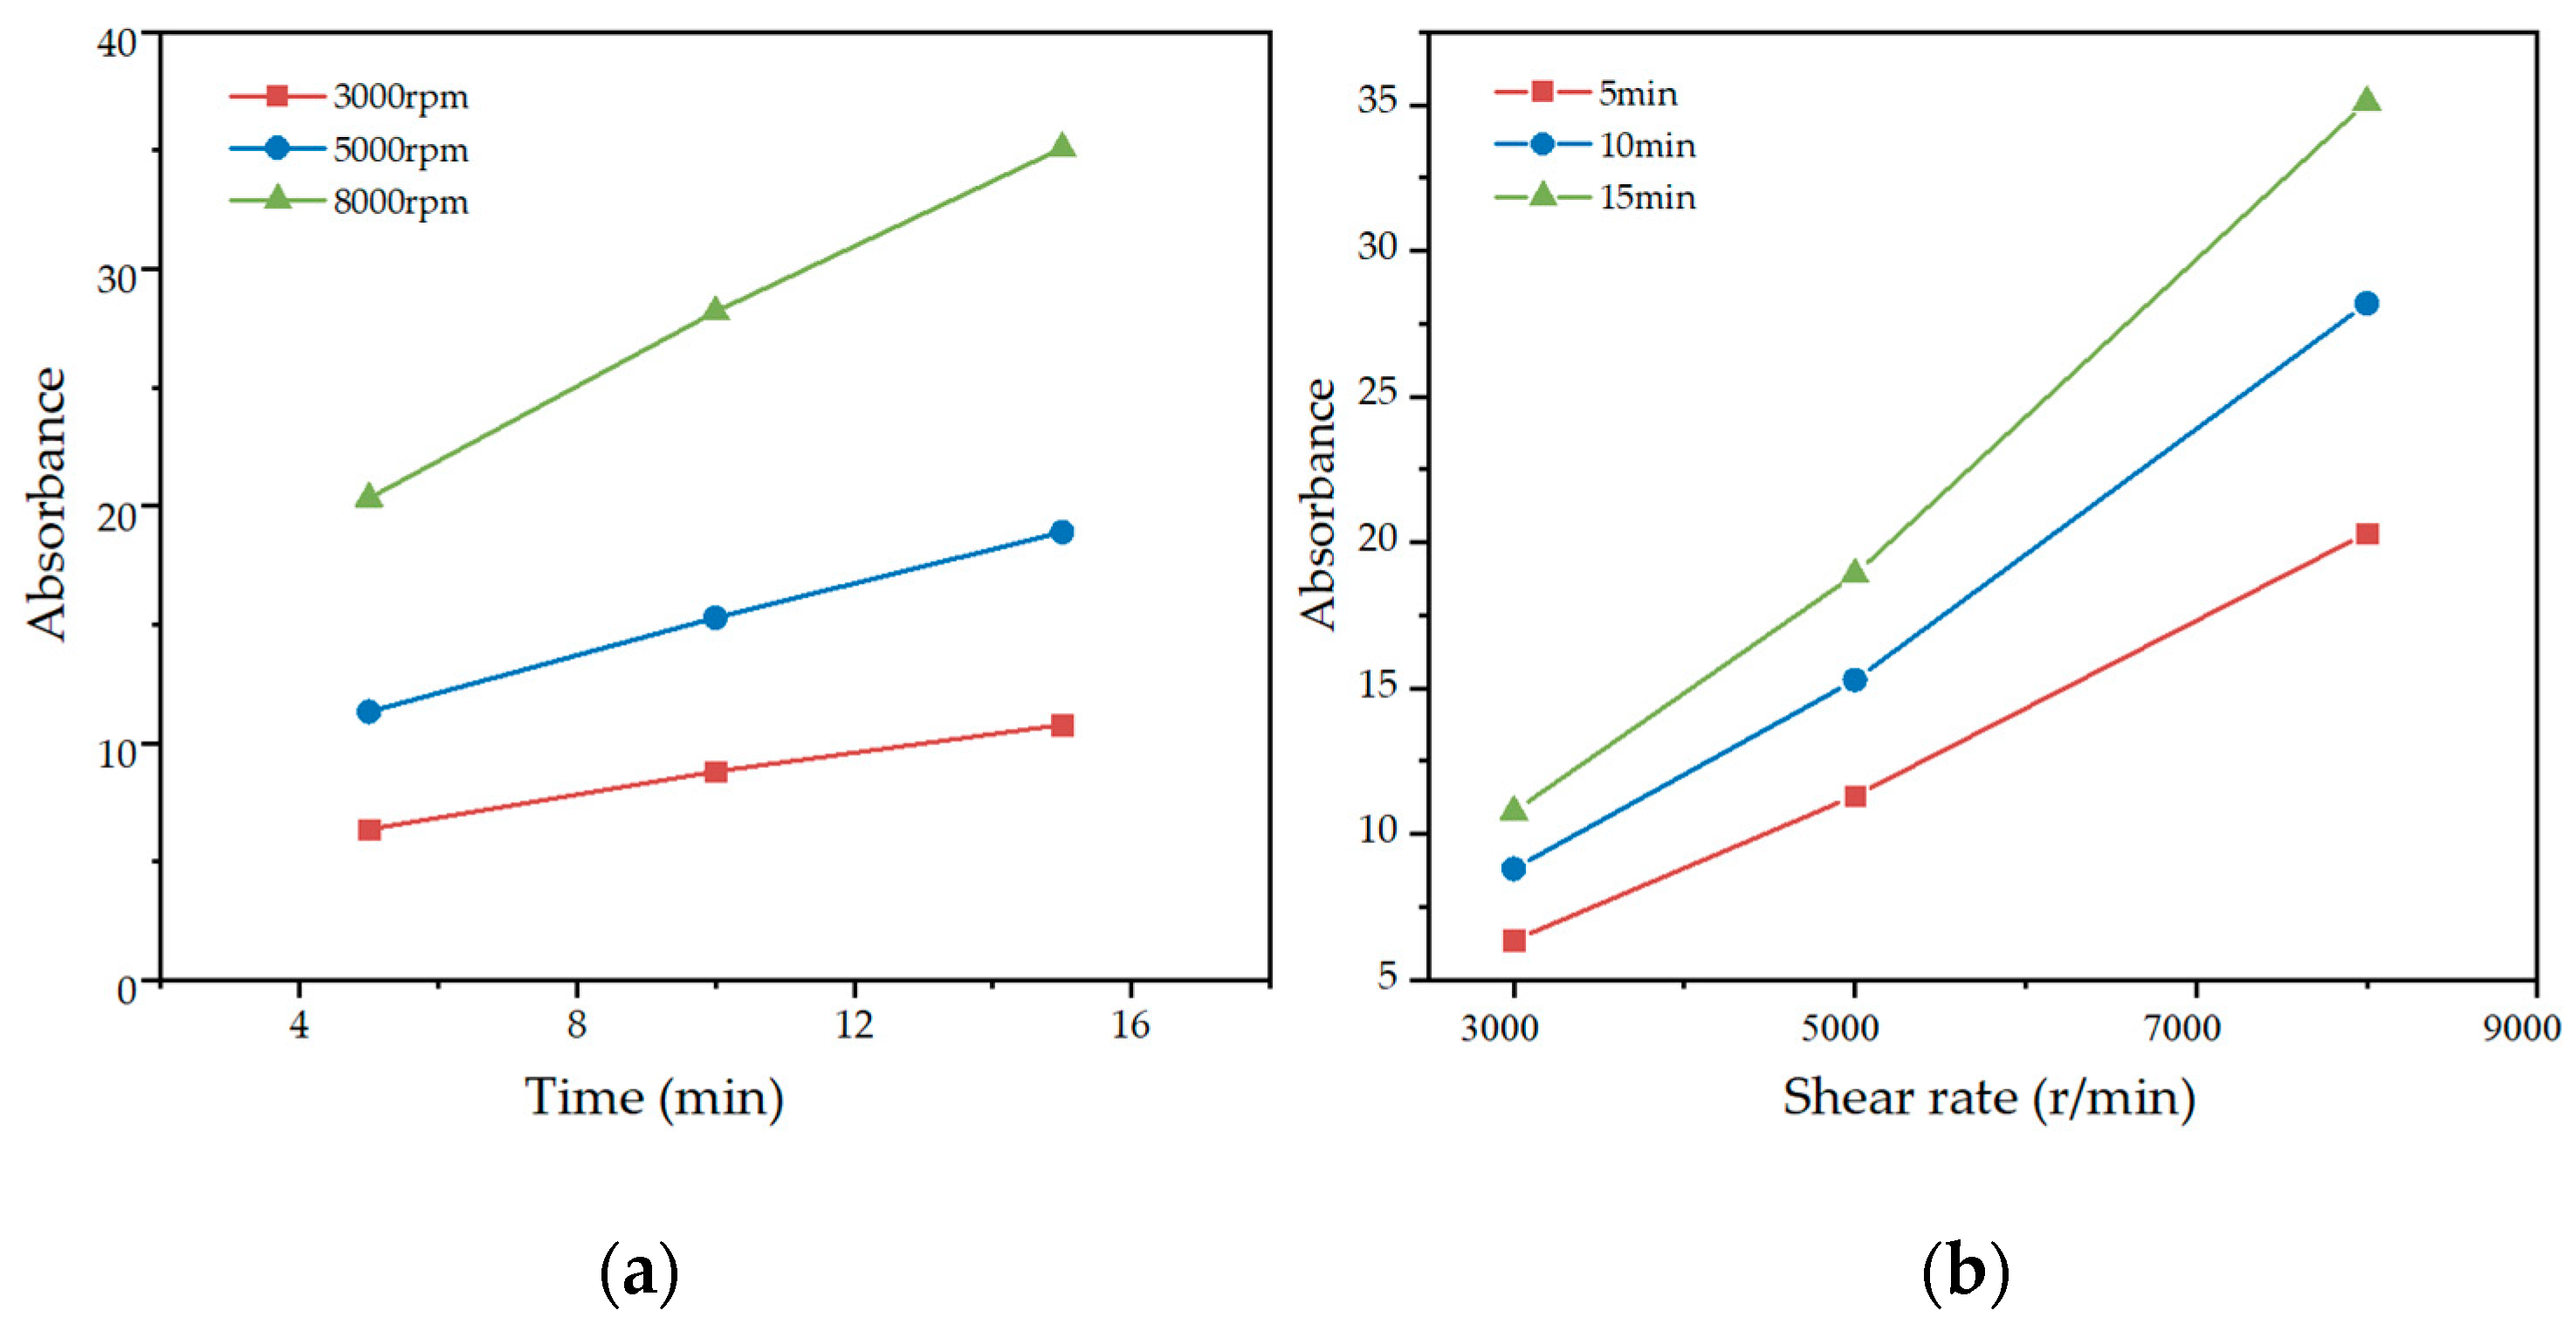
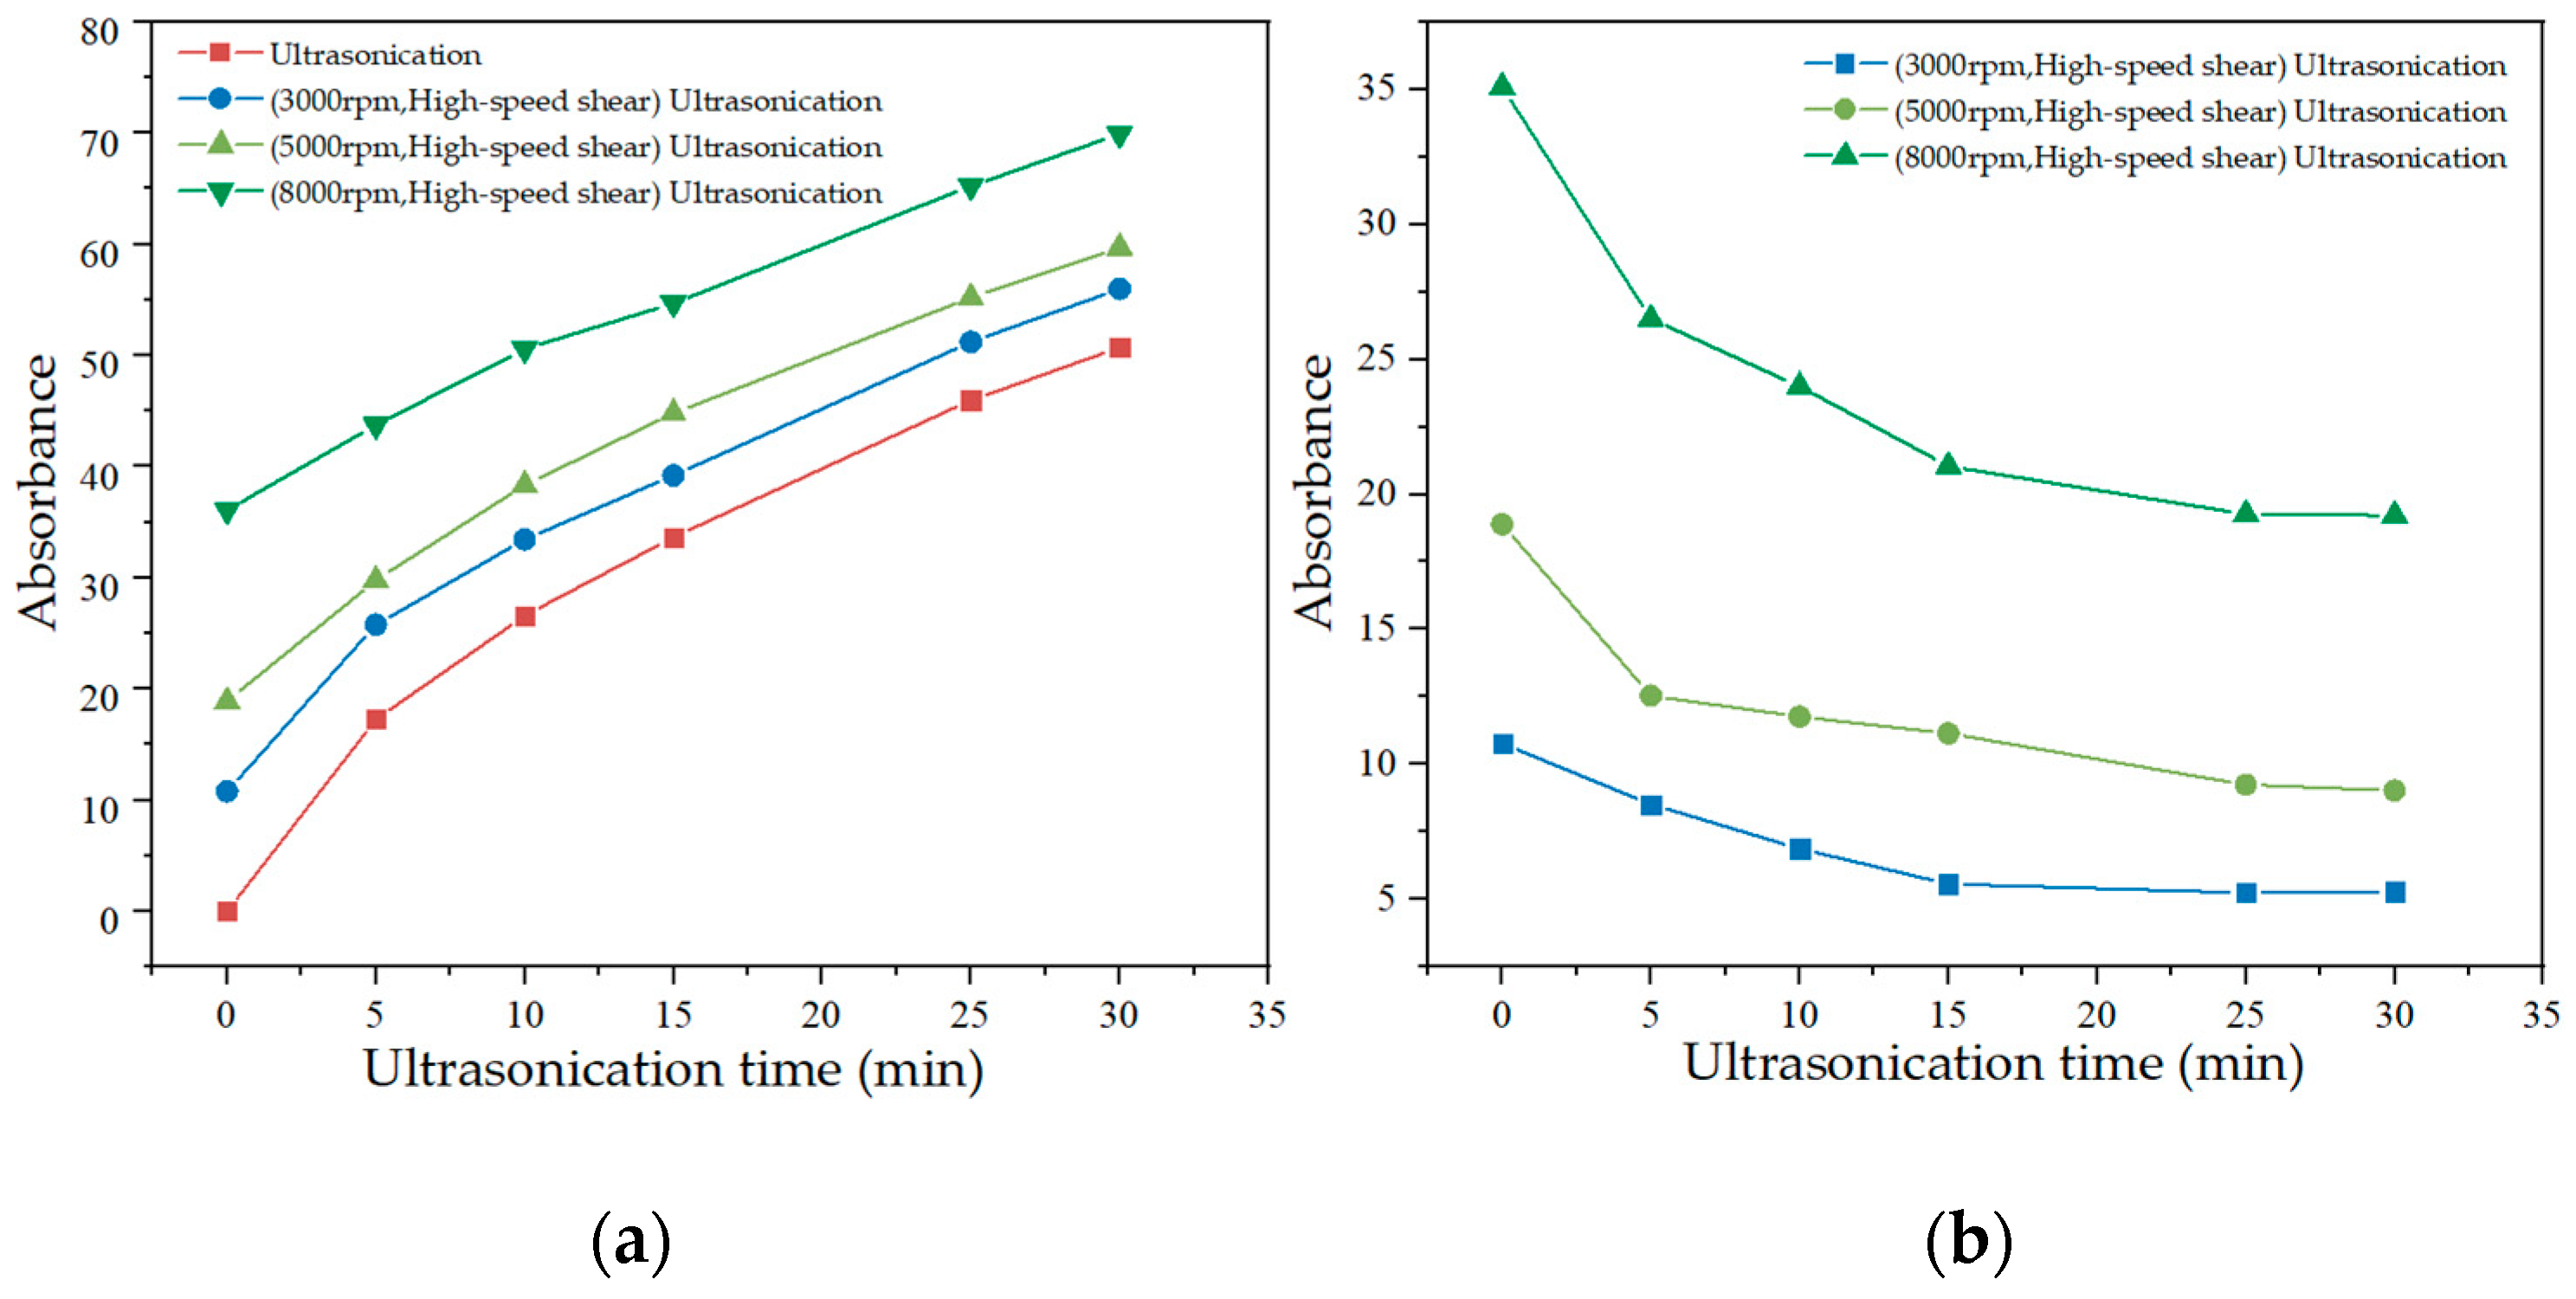
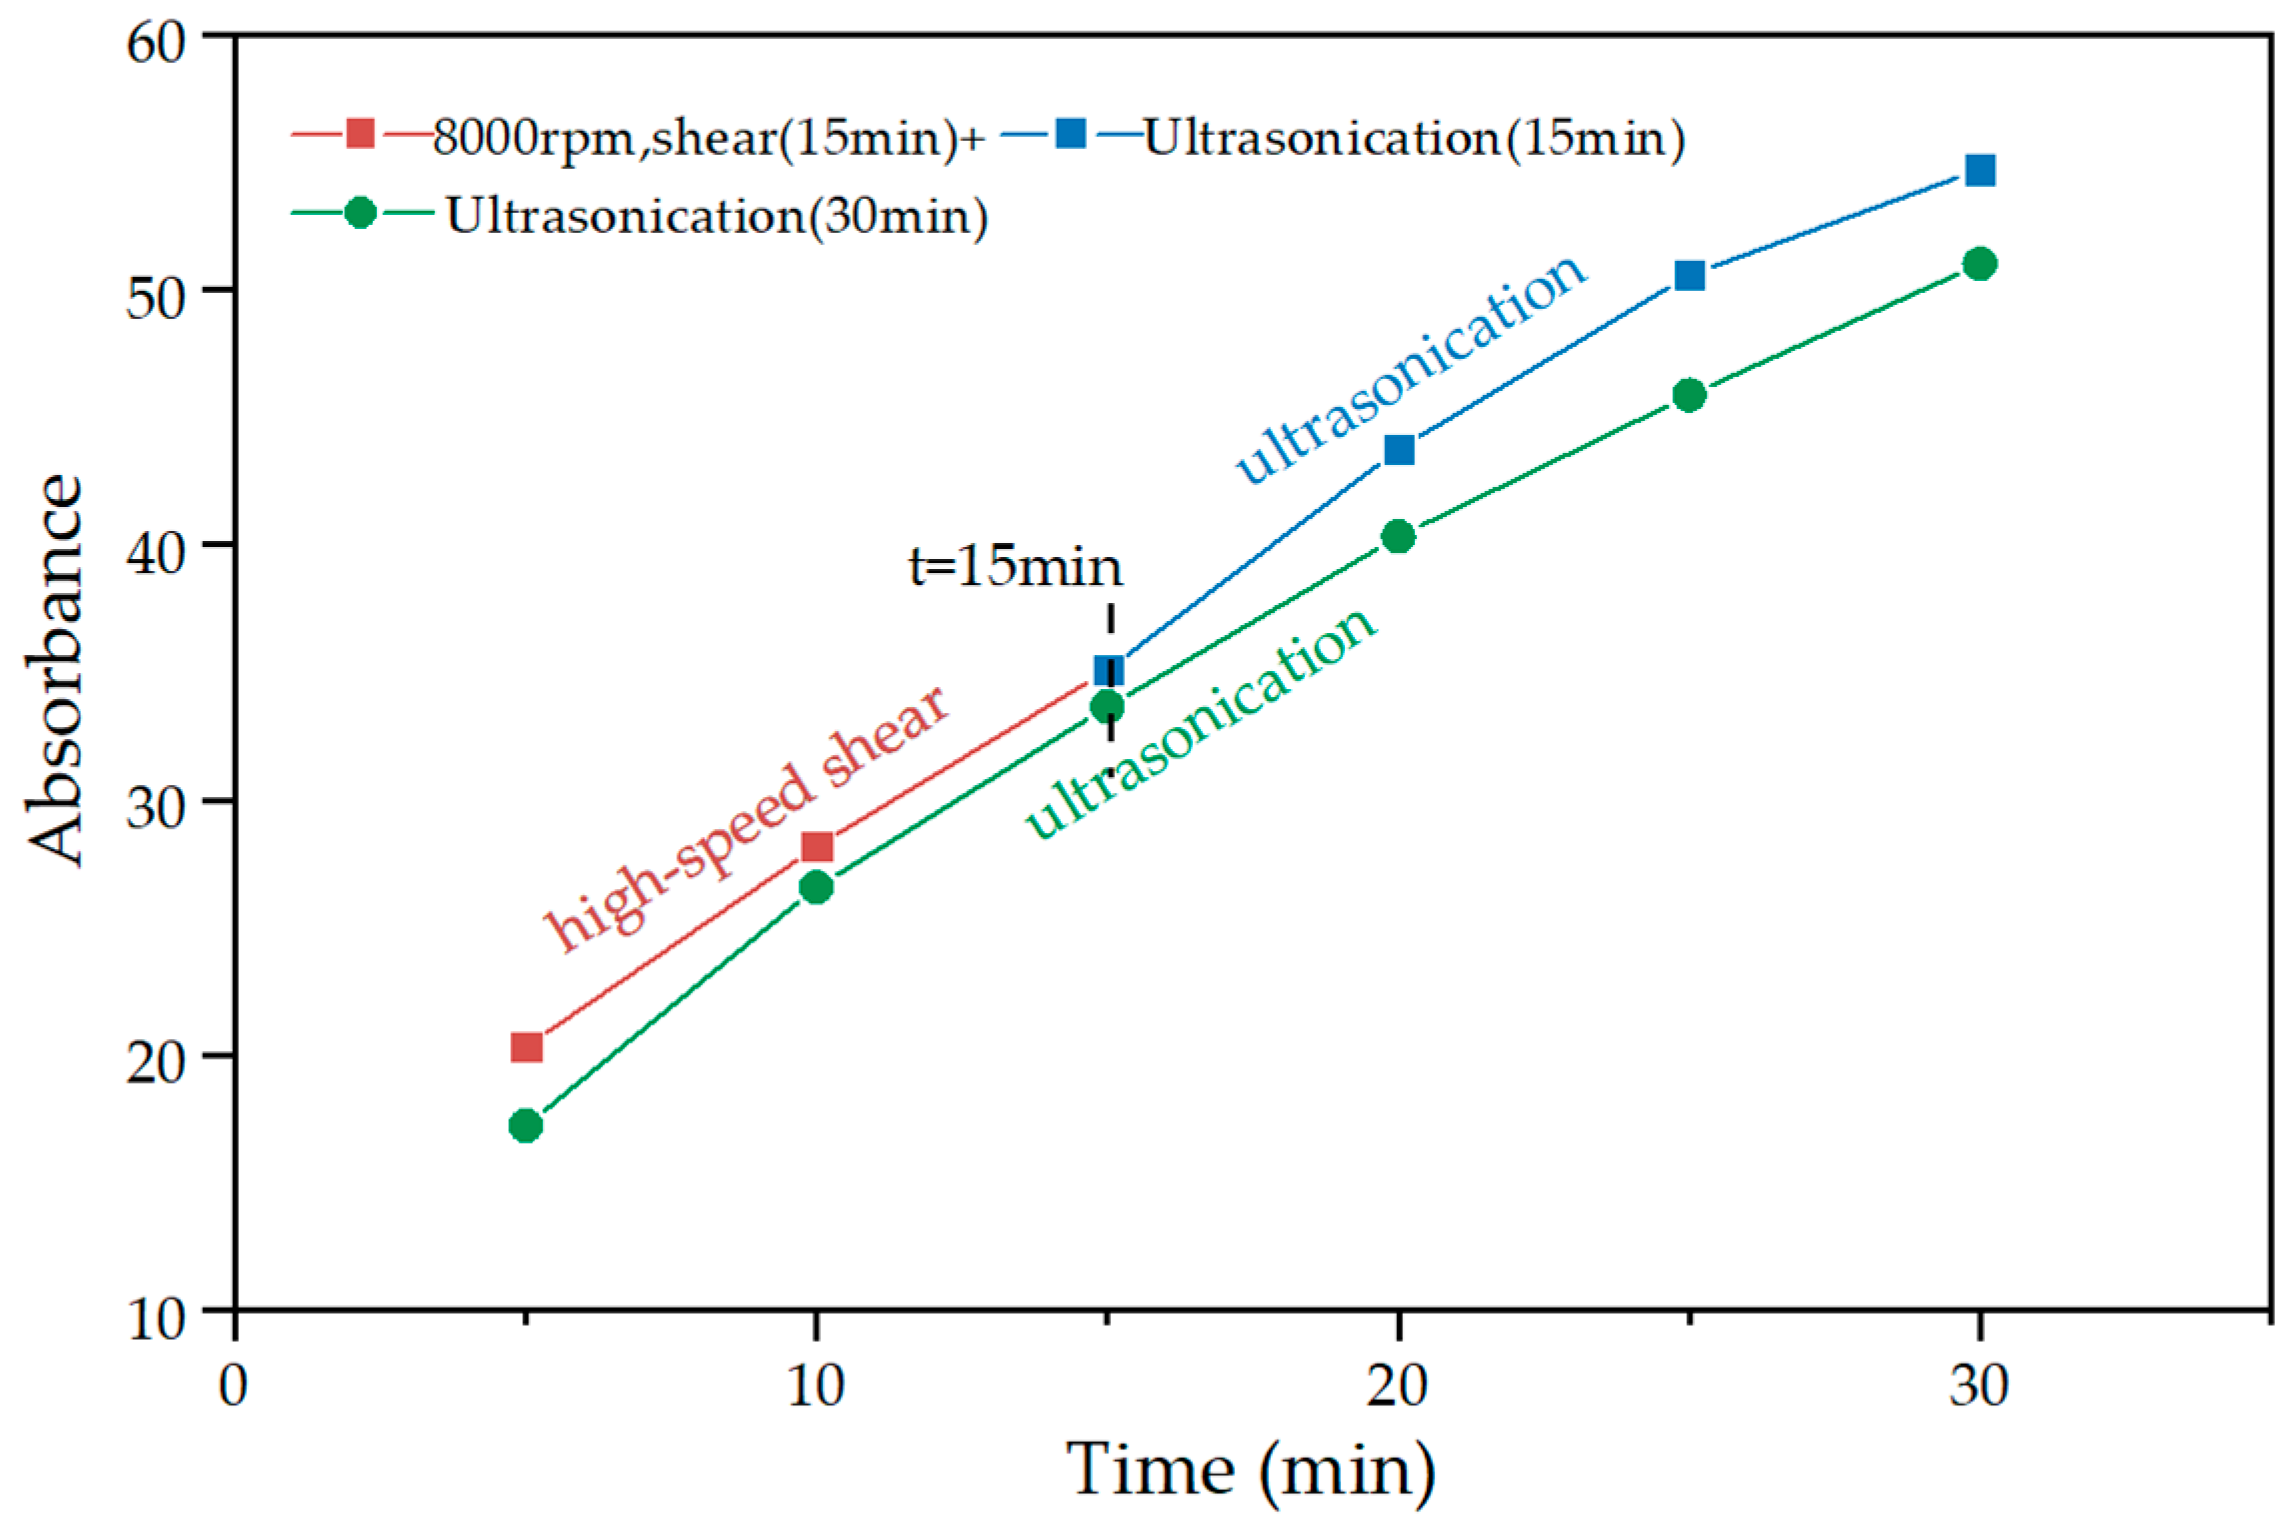
- Optimization of high-speed shear time and rate to replace partial ultrasonication: The GNPs suspension with optimal PVP concentration and ultrasonication time was used to optimize the high-speed shear time and shear. The shear time of 5, 10, and 15 min, and the shear rate of 3000, 5000, and 8000 rpm were selected as variables. For each high-speed shear time and rate, three mixed GNPs suspensions were tested. After similar procedures asin (b), the optimal high-speed shear time and rate were determined by the value of absorbance. It should be noted that since the introduction of the shear treatment might shift the optimal ultrasonication time towards smaller values, thus a proper adjustment to the ultrasonication time was needed according to the experimental results. Finally, according to the above three steps, the optimal dispersion method was determined.
2.3. Mix Proportion and Preparation of GNPs Cement Mortar
2.4. Testing Methods
2.4.1. Setting Time and Flowability
2.4.2. Mechanical Strength Test
2.4.3. Pressure-Sensitive Measurements
3. Results
3.1. Optimization of PVP Concentration
3.2. Optimization of Ultrasonication Time
3.3. Optimization of High-Speed Shear Time and Rate
3.4. Properties of GNPs Cement-Based Materials
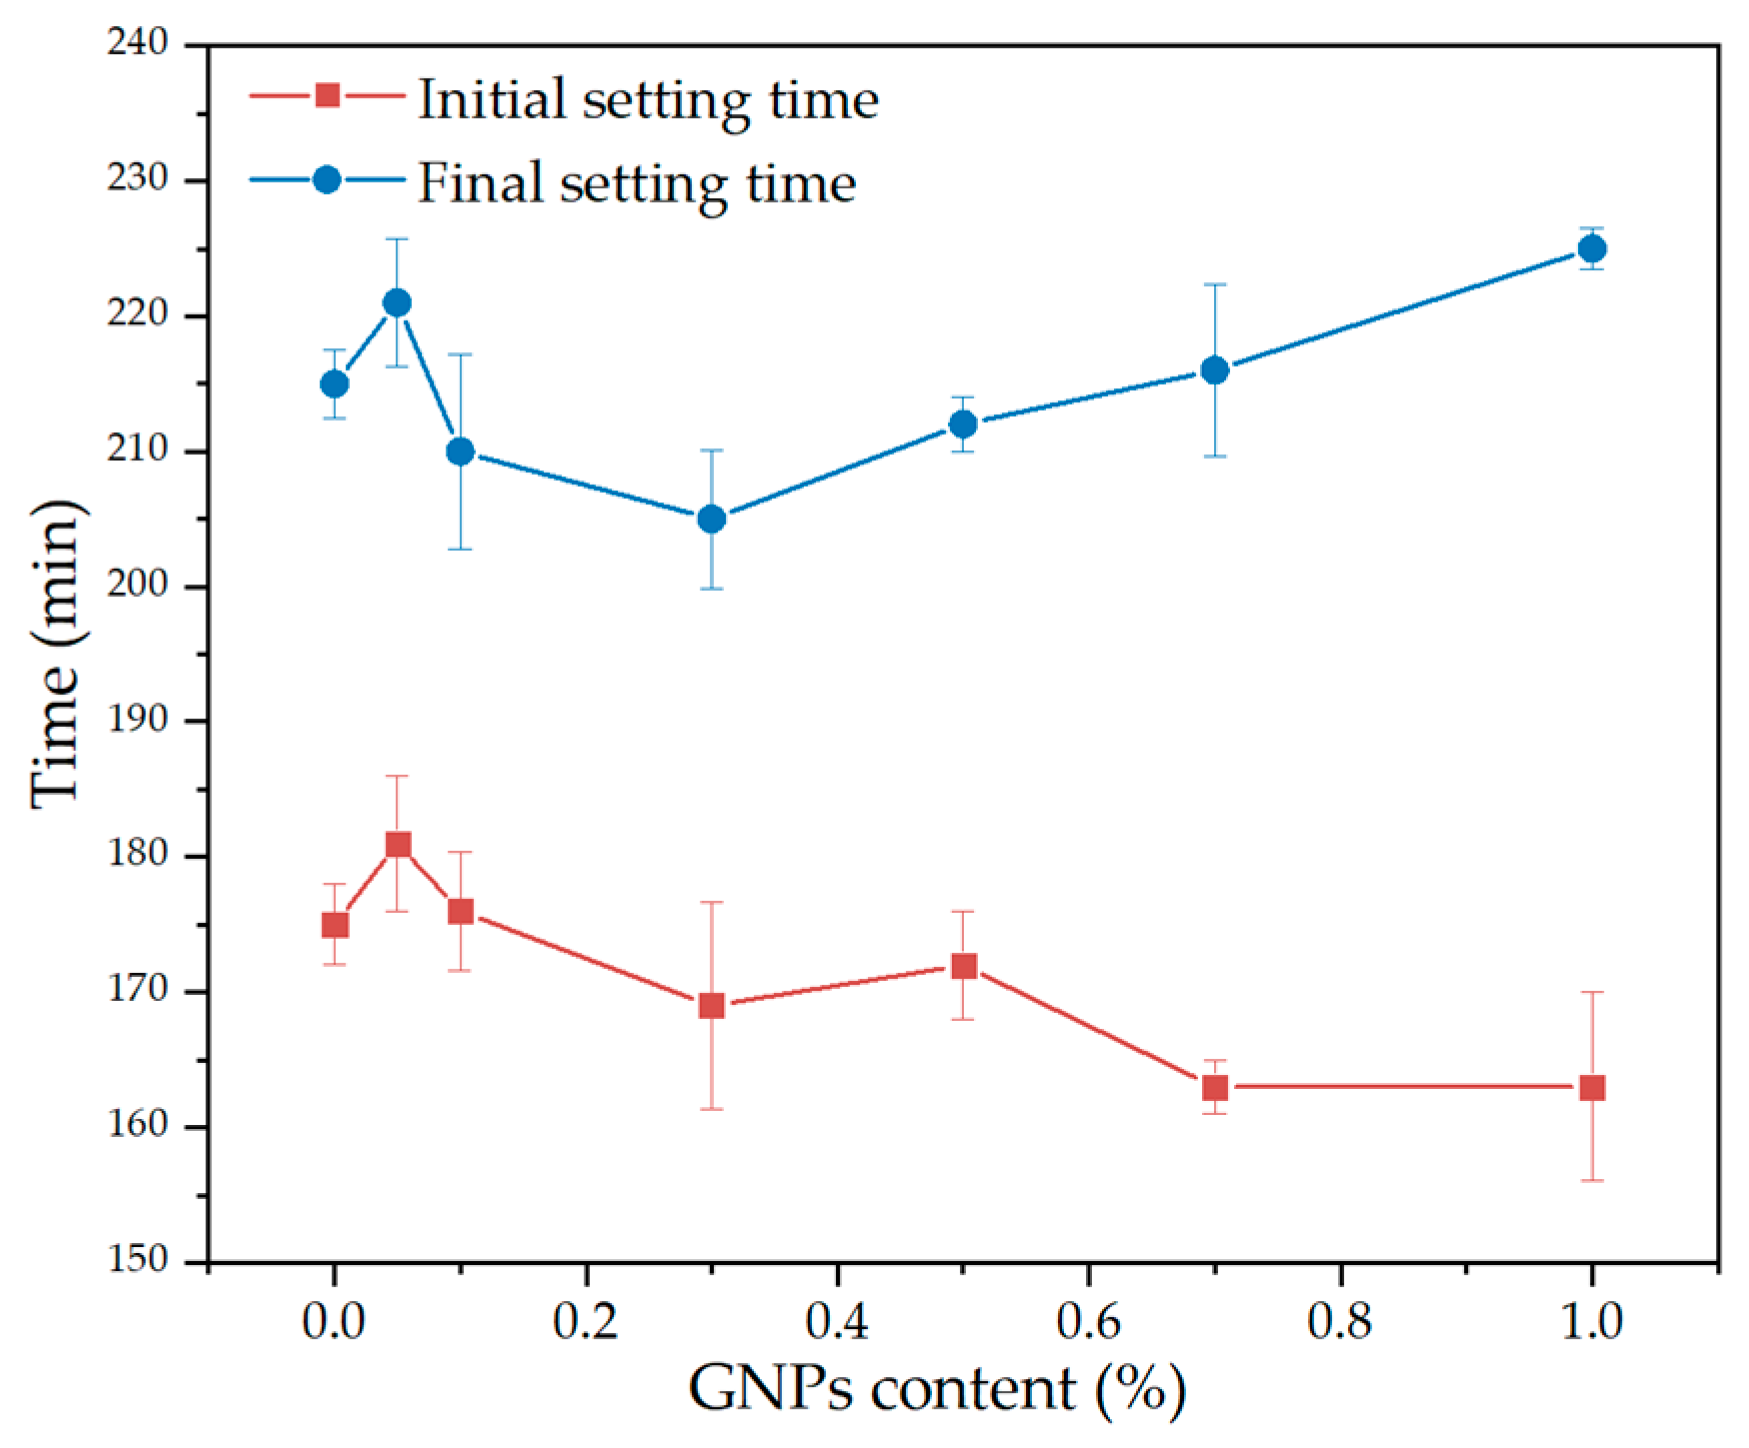
3.4.1. Setting Time
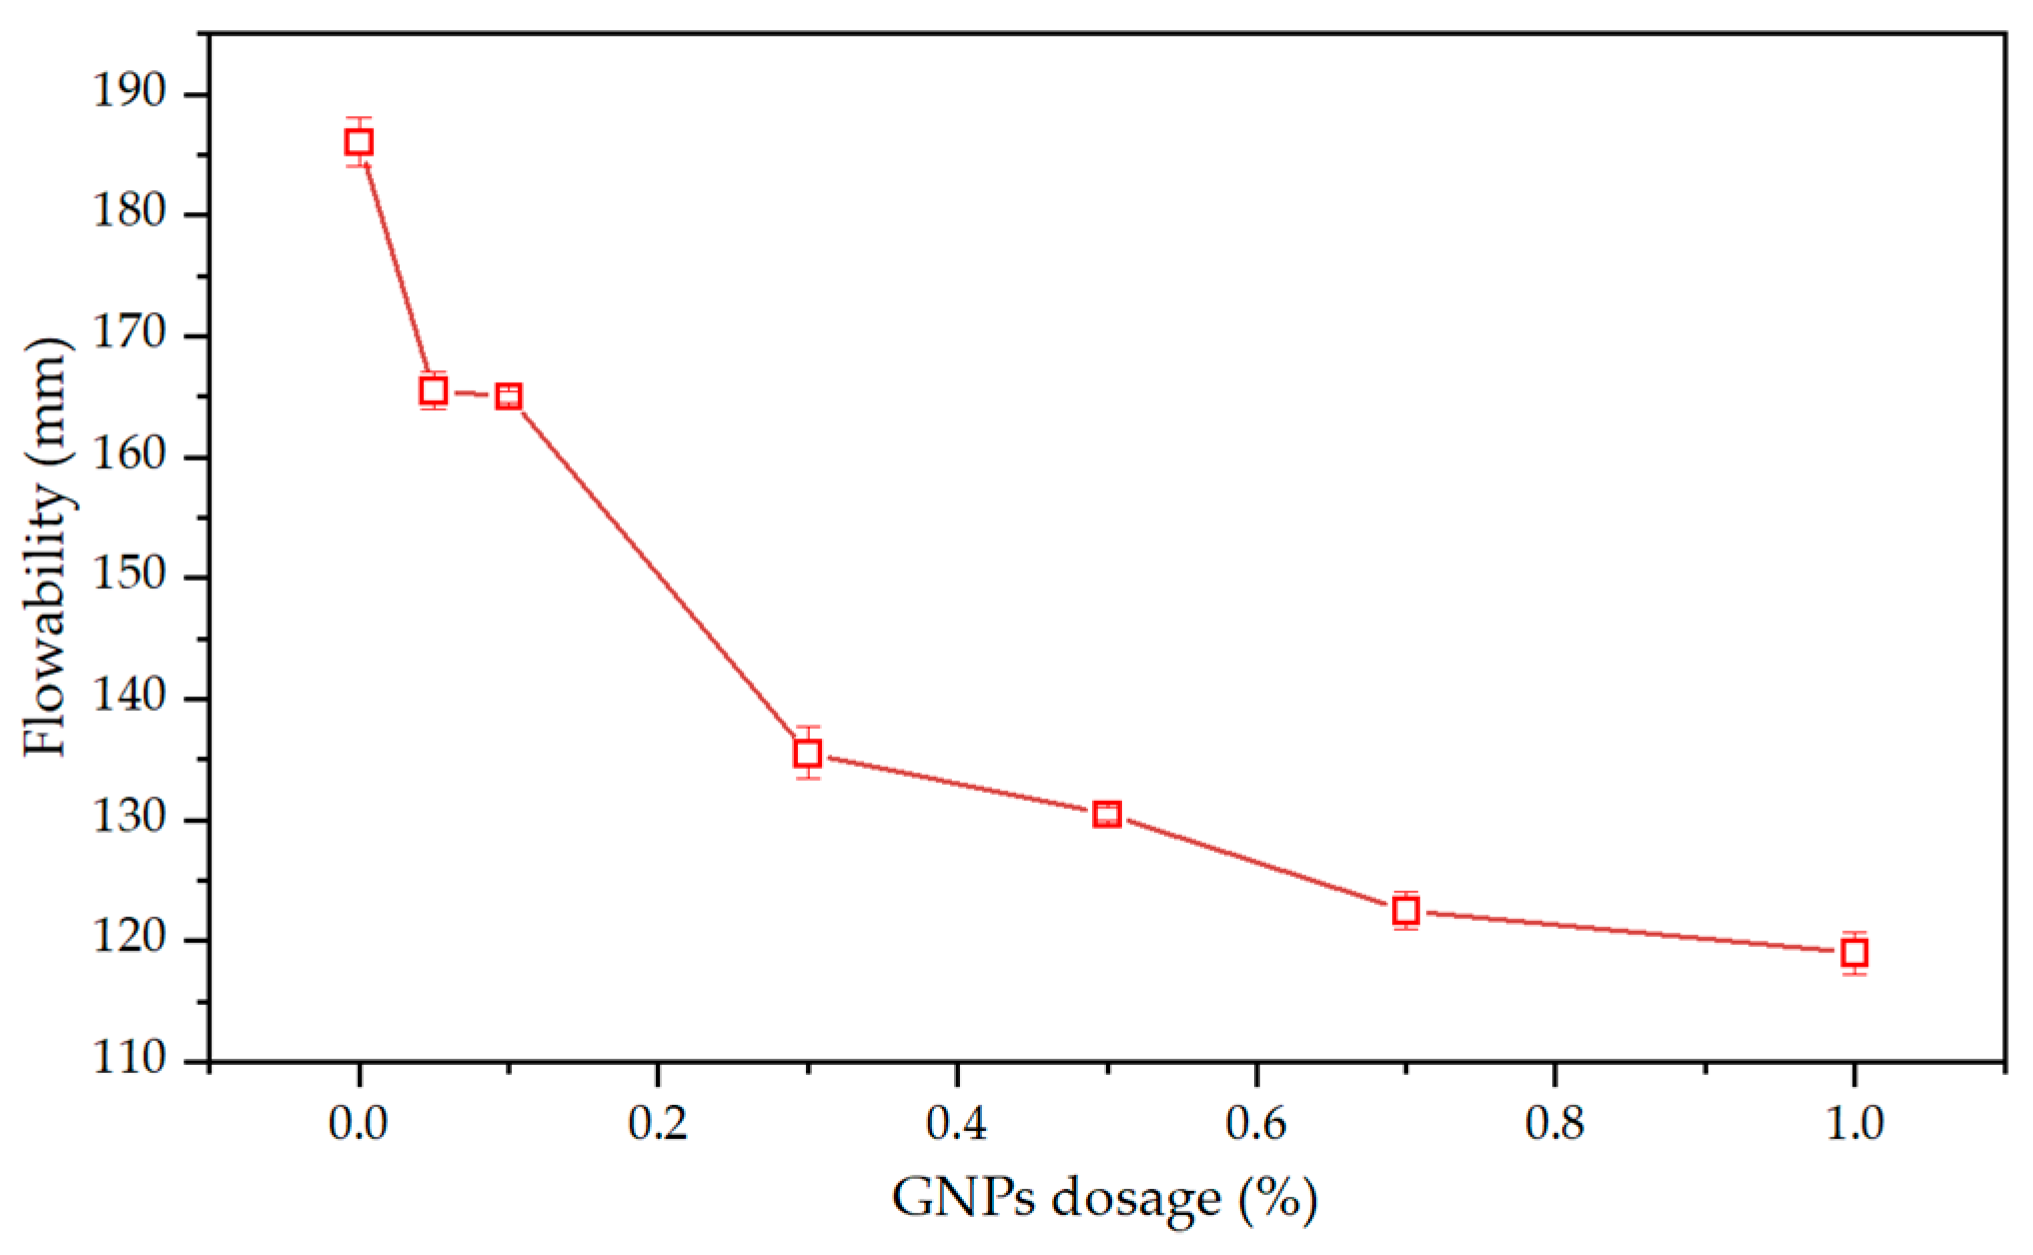
3.4.2. Flowability
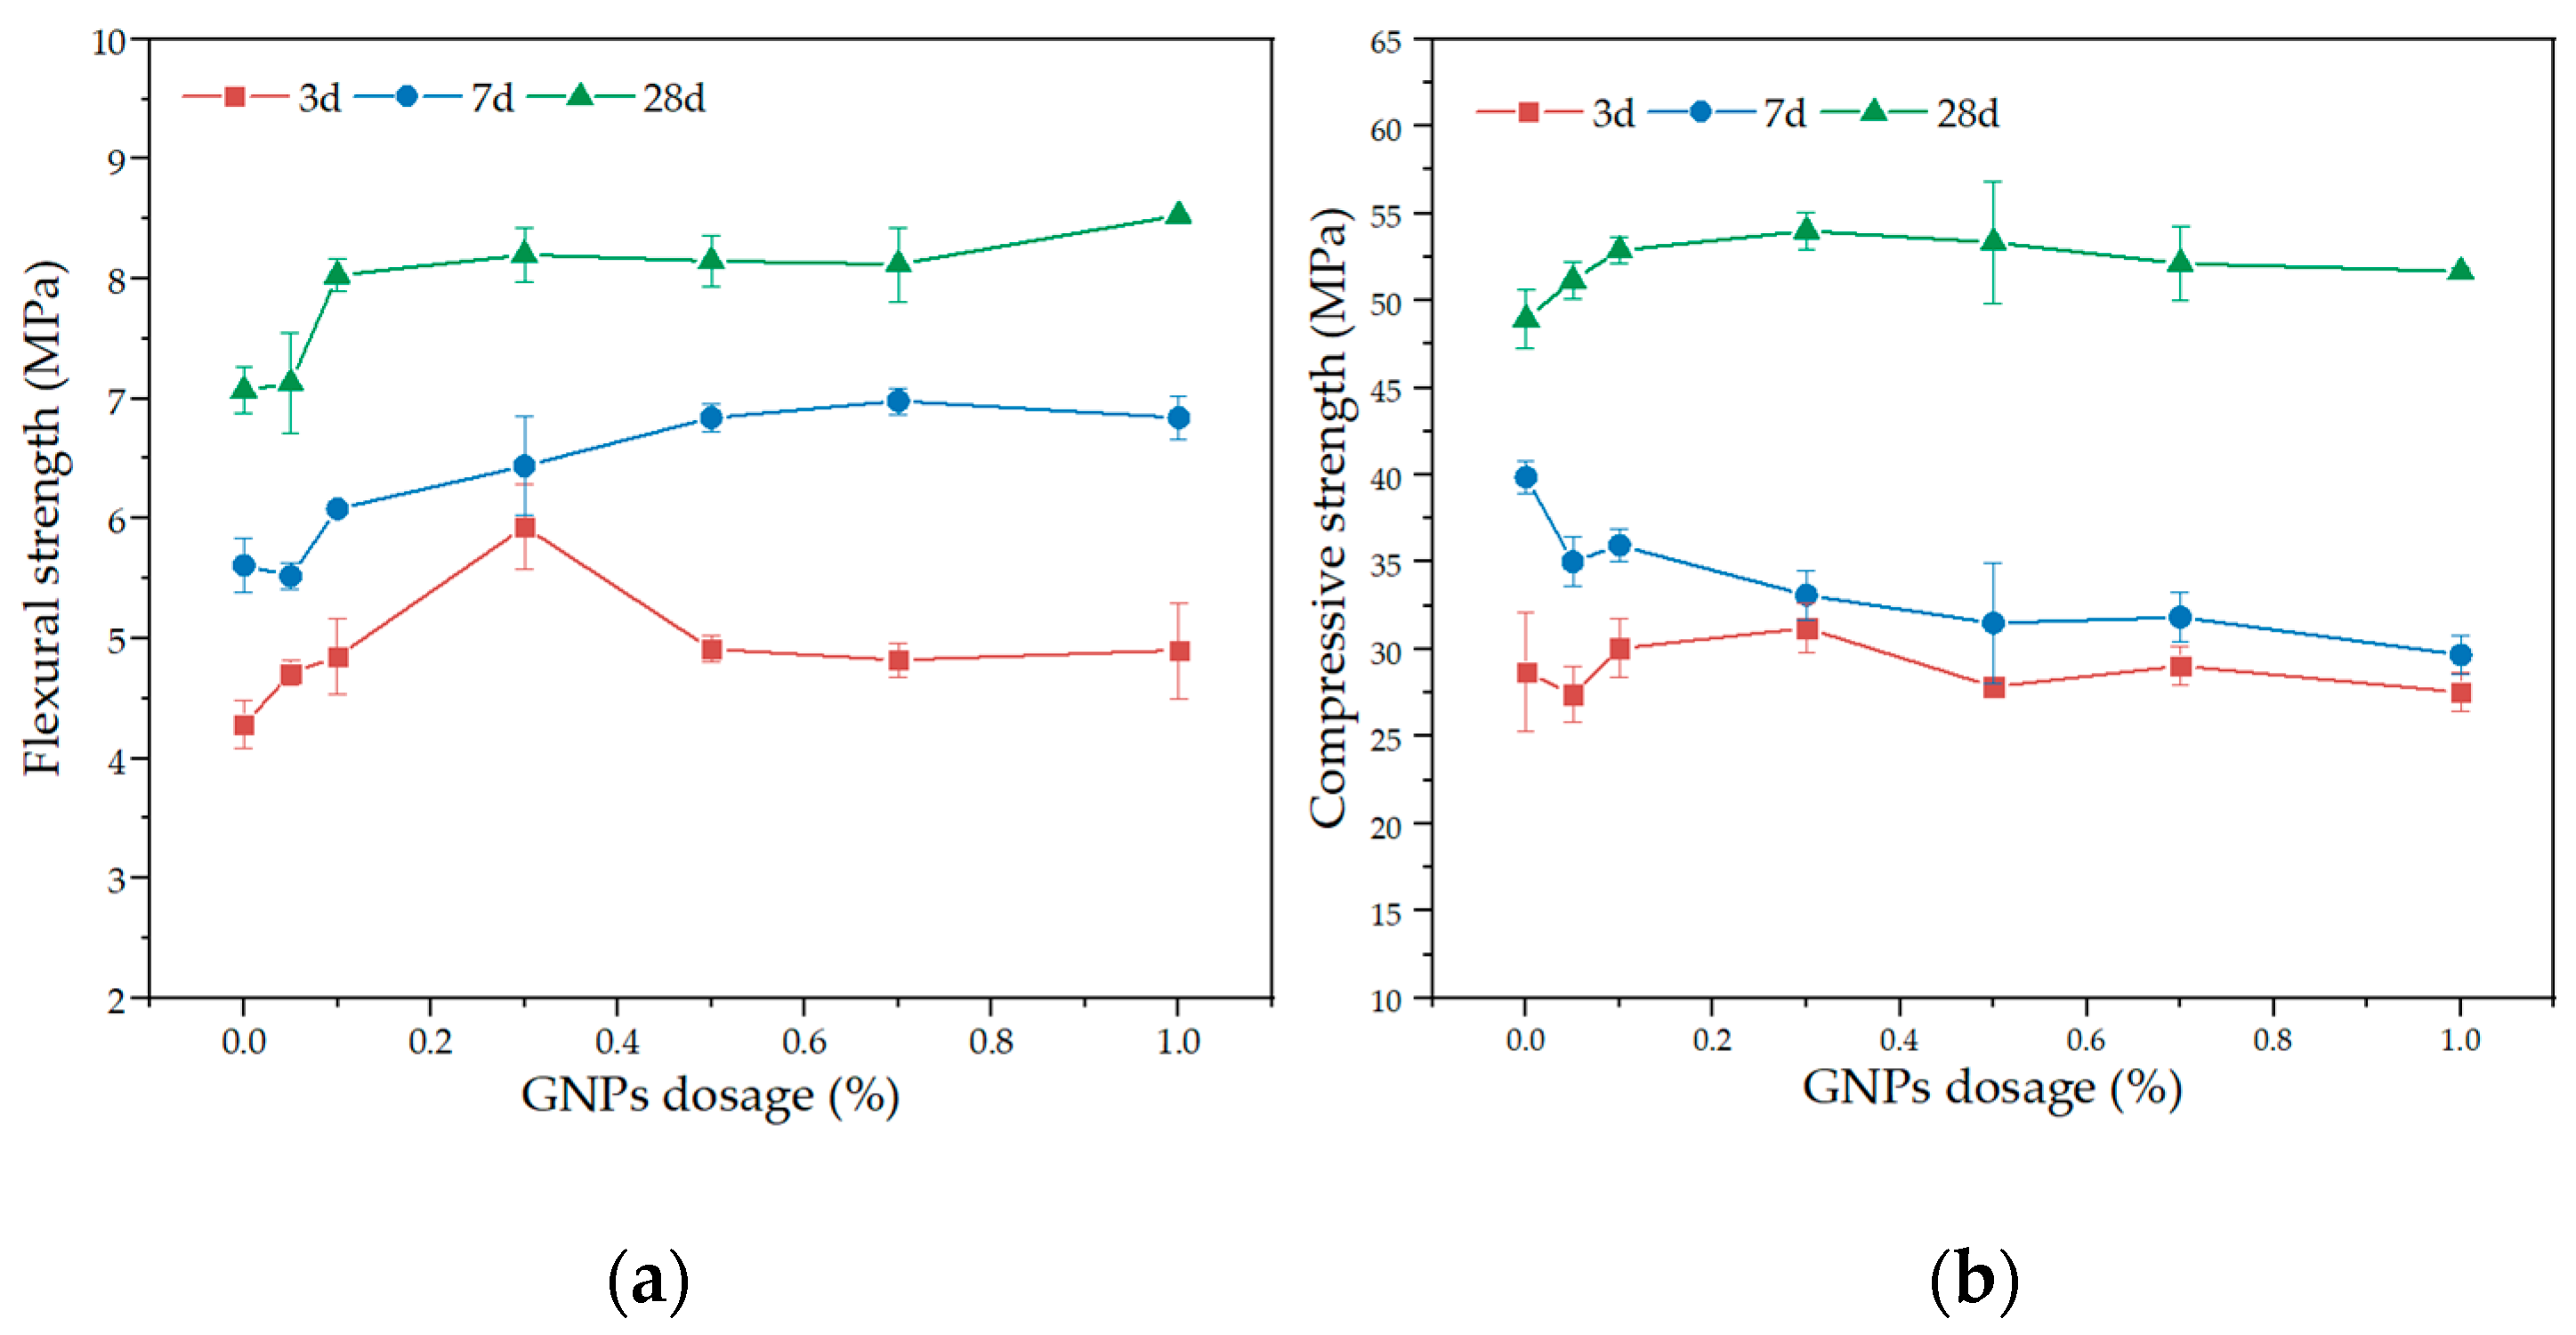
3.4.3. Flexural and Compressive Strength
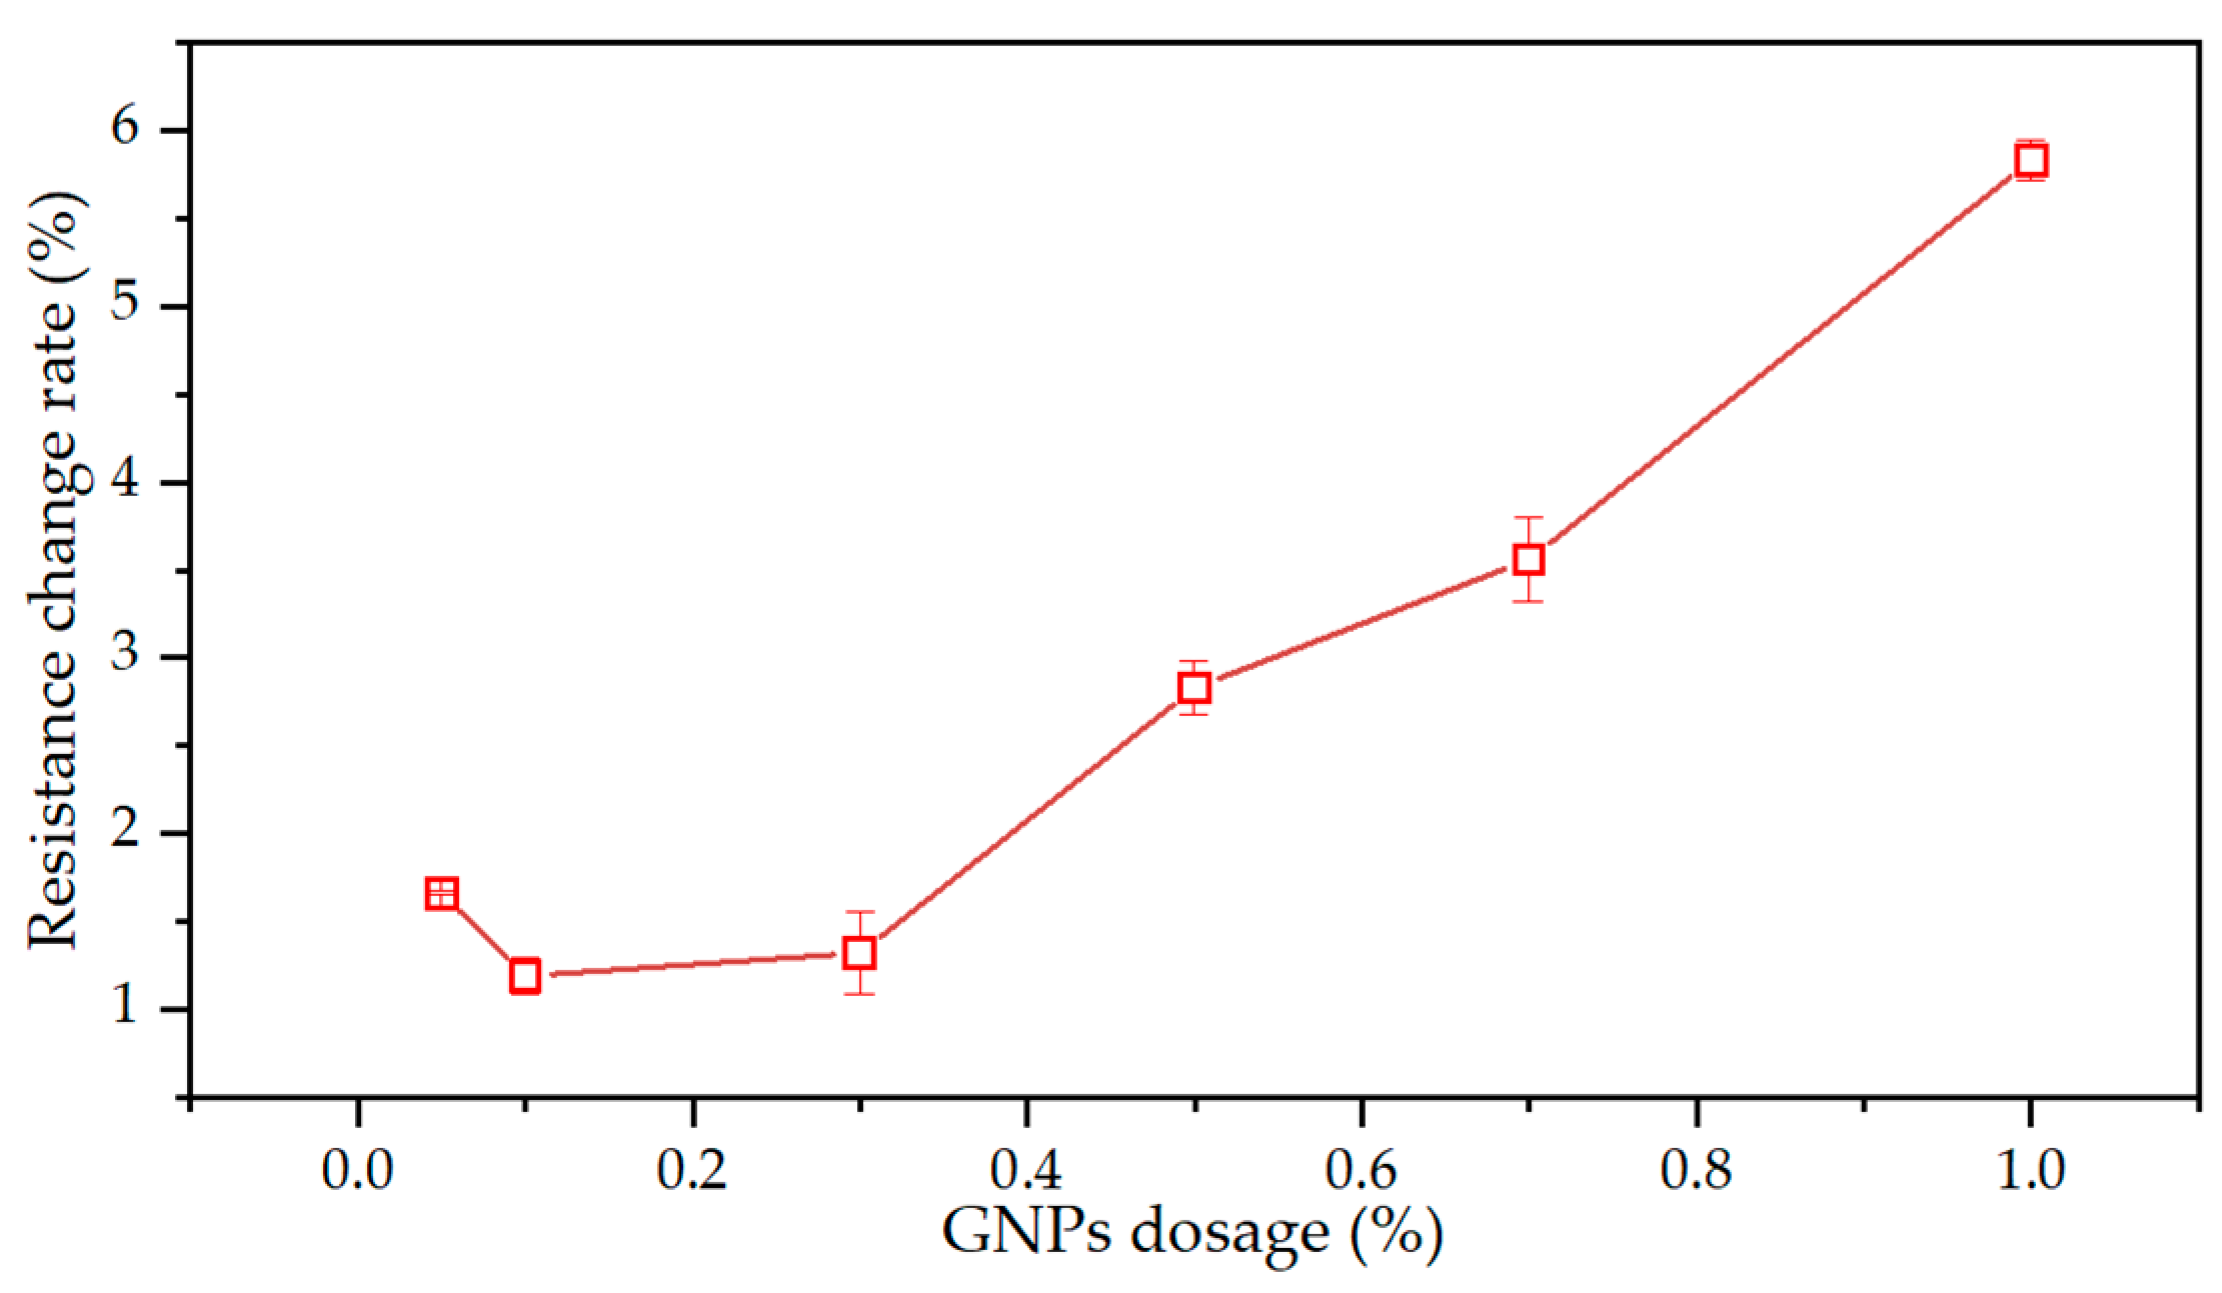
3.4.4. Pressure-Sensitive Properties
4. Conclusions
- (1)
- An optimal dispersion method for GNPs in cement-based materials was developed, i.e., 10 mg/mL PVP addition, 15 min high-speed shear time at 8000 rpm, 15 min ultrasonication time, and 15 min centrifugation at 4000 rpm.
- (2)
- The pressure-sensitive properties of cement mortar increased with GNPs dosage increasing. The cement mortar exhibited an optimal pressure sensitivity at 1% GNPs.
- (3)
- The presence of GNPs promoted the hydration process and shortened the initial setting time of cement mortar. However, when the dosage of GNPs was high (0.7 wt%, 1.0 wt%), it would increase the final setting time. The flowability of the cement mortar was reduced with the increment of GNPs dosage.
- (4)
- The incorporation of GNPs in cement mortar could improve their flexural and compressive strength. Moreover, when the GNPs dosage in cement mortar was 1.0%, it had the best effect on the improvement of flexural strength and later compressive strength.
Author Contributions
Funding
Institutional Review Board Statement
Informed Consent Statement
Data Availability Statement
Acknowledgments
Conflicts of Interest
References
- Chung, D.D.L. Carbon materials for structural self-sensing, electromagnetic shielding and thermal interfacing. Carbon 2012, 50, 3342–3353. [Google Scholar] [CrossRef]
- Varadan, V.K.; Chen, P.-W.; Chung, D.D.L. Carbon-fiber-reinforced concrete smart structures capable of nondestructive flaw detection. In Smart Structures and Materials 1993: Smart Materials; SPIE: Bellingham, WA, USA, 1993; pp. 445–453. [Google Scholar]
- Luo, D.; Ismail, Z.; Ibrahim, Z. Added advantages in using a fiber Bragg grating sensor in the determination of early age setting time for cement pastes. Measurement 2013, 46, 4313–4320. [Google Scholar] [CrossRef]
- Ou, J.P. Some recent advances of intelligent health monitoring systems for civil infrastructures in mainland China. In Proceedings of the 1st International Conference on Structural Health Monitoring and Intelligent Infrastructure, Tokyo, Japan, 13–15 November 2003; pp. 131–144. [Google Scholar]
- Chen, P.W.; Chung, D.D.L. Concrete as a new strain stress sensor. Compos. Part B-Eng. 1996, 27, 11–23. [Google Scholar] [CrossRef]
- Liu, Q.; Gao, R.D.; Tam, V.W.Y.; Li, W.G.; Xiao, J.Z. Strain monitoring for a bending concrete beam by using piezoresistive cement-based sensors. Constr. Build. Mater. 2018, 167, 338–347. [Google Scholar] [CrossRef]
- Wen, S.H.; Chung, D.D.L. Cement-based controlled electrical resistivity materials. J. Electron. Mater. 2001, 30, 1448–1451. [Google Scholar] [CrossRef]
- Iijima, S. Helical Microtubules of Graphitic Carbon. Nature 1991, 354, 56–58. [Google Scholar] [CrossRef]
- Yan, X.; Cui, H.; Qin, Q.; Tang, W.; Zhou, X. Study on Utilization of Carboxyl Group Decorated Carbon Nanotubes and Carbonation Reaction for Improving Strengths and Microstructures of Cement Paste. Nanomaterials 2016, 6, 153. [Google Scholar] [CrossRef] [PubMed]
- Jeng-Maw, C.; Qijun, Z.; Chung, D.D.L. Electromagnetic interference shielding by carbon fibre reinforced cement. Composites 1989, 20, 379–381. [Google Scholar]
- Metaxa, Z.S.; Seo, J.-W.T.; Konsta-Gdoutos, M.S.; Hersam, M.C.; Shah, S.P. Highly concentrated carbon nanotube admixture for nano-fiber reinforced cementitious materials. Cem. Concr. Compos. 2012, 34, 612–617. [Google Scholar] [CrossRef]
- Le, J.L.; Du, H.J.; Pang, S.D. Use of 2D Graphene Nanoplatelets (GNP) in cement composites for structural health evaluation. Compos. Part B-Eng. 2014, 67, 555–563. [Google Scholar] [CrossRef]
- Yan, X.; Zheng, D.; Yang, H.; Cui, H.; Monasterio, M.; Lo, Y. Study of optimizing graphene oxide dispersion and properties of the resulting cement mortars. Constr. Build. Mater. 2020, 257, 119477. [Google Scholar] [CrossRef]
- Narlawar, S.S.; Gandhi, S. Fabrication of graphene nanoplatelets embedded “partition cartridge” for efficient separation of target-bound ssDNA during SELEX. Mater. Today Adv. 2021, 12, 100174. [Google Scholar] [CrossRef]
- Roberts, A.; Tripathi, P.P.; Gandhi, S. Graphene nanosheets as an electric mediator for ultrafast sensing of urokinase plasminogen activator receptor-A biomarker of cancer. Biosens. Bioelectron. 2019, 141, 111398. [Google Scholar] [CrossRef] [PubMed]
- Novoselov, K.S.; Geim, A.K.; Morozov, S.V.; Jiang, D.; Zhang, Y.; Dubonos, S.V.; Grigorieva, I.V.; Firsov, A.A. Electric field effect in atomically thin carbon films. Science 2004, 306, 666–669. [Google Scholar] [CrossRef] [PubMed]
- Dreyer, D.R.; Park, S.; Bielawski, C.W.; Ruoff, R.S. The chemistry of graphene oxide. Chem. Soc. Rev. 2010, 39, 228–240. [Google Scholar] [CrossRef] [PubMed]
- Shah, M.; Kolhe, P.; Roberts, A.; Shrikrishna, N.S.; Gandhi, S. Ultrasensitive immunosensing of Penicillin G in food samples using reduced graphene oxide (rGO) decorated electrode surface. Colloids Surf. B Biointerfaces 2022, 219, 112812. [Google Scholar] [CrossRef] [PubMed]
- Sun, S.; Han, B.; Jiang, S.; Yu, X.; Wang, Y.; Li, H.; Ou, J. Nano graphite platelets-enabled piezoresistive cementitious composites for structural health monitoring. Constr. Build. Mater. 2017, 136, 314–328. [Google Scholar] [CrossRef]
- Xu, J.M.; Zhang, D. Pressure-sensitive properties of emulsion modified graphene nanoplatelets/cement composites. Cem. Concr. Compos. 2017, 84, 74–82. [Google Scholar] [CrossRef]
- Lotya, M.; King, P.J.; Khan, U.; De, S.; Coleman, J.N. High-Concentration, Surfactant-Stabilized Graphene Dispersions. ACS Nano 2010, 4, 3155–3162. [Google Scholar] [CrossRef] [PubMed]
- Strano, M.S.; Moore, V.C.; Miller, M.K.; Allen, M.J.; Haroz, E.H.; Kittrell, C.; Hauge, R.H.; Smalley, R.E. The role of surfactant adsorption during ultrasonication in the dispersion of single-walled carbon nanotubes. J. Nanosci. Nanotechnol. 2003, 3, 81–86. [Google Scholar] [CrossRef]
- Paton, K.R.; Varrla, E.; Backes, C.; Smith, R.J.; Khan, U.; O′Neill, A.; Boland, C.; Lotya, M.; Istrate, O.M.; King, P.; et al. Scalable production of large quantities of defect-free few-layer graphene by shear exfoliation in liquids. Nat. Mater. 2014, 13, 624–630. [Google Scholar] [CrossRef] [PubMed]
- Dimov, D.; Amit, I.; Gorrie, O.; Barnes, M.D.; Townsend, N.J.; Neves, A.I.S.; Withers, F.; Russo, S.; Craciun, M.F. Ultrahigh Performance Nanoengineered Graphene-Concrete Composites for Multifunctional Applications. Adv. Funct. Mater. 2018, 28, 1705183. [Google Scholar] [CrossRef]
- Qiao, L.; Du, K. Scalable production of high-quality carbon nanotube dispersion in aqueous solution using cellulose as dispersant by a freezing/thawing process. J. Colloid Interface Sci. 2022, 623, 1200–1209. [Google Scholar] [CrossRef]
- Szleifer, I.; Yerushalmi-Rozen, R. Polymers and carbon nanotubes—Dimensionality, interactions and nanotechnology. Polymer 2005, 46, 7803–7818. [Google Scholar] [CrossRef]
- Liew, K.M.; Kai, M.F.; Zhang, L.W. Mechanical and damping properties of CNT-reinforced cementitious composites. Compos. Struct. 2017, 160, 81–88. [Google Scholar] [CrossRef]
- Wajid, A.S.; Das, S.; Irin, F.; Ahmed, H.S.T.; Shelburne, J.L.; Parviz, D.; Fullerton, R.J.; Jankowski, A.F.; Hedden, R.C.; Green, M.J. Polymer-stabilized graphene dispersions at high concentrations in organic solvents for composite production. Carbon 2012, 50, 526–534. [Google Scholar] [CrossRef]
- Khan, U.; O’Neill, A.; Lotya, M.; De, S.; Coleman, J.N. High-concentration solvent exfoliation of graphene. Small 2010, 6, 864–871. [Google Scholar] [CrossRef] [PubMed]
- Wei, W.; Lu, W.; Yang, Q.H. High-concentration graphene aqueous suspension and a membrane self-assembled at the liquid-air interface. New Carbon Mater. 2011, 26, 36–40. [Google Scholar] [CrossRef]
- Shah, S.P.; Konsta-Gdoutos, M.S.; Metaxa, Z.S. Advanced Cement Based Nanocomposites. In Proceedings of the Symposium on Recent Advances in Mechanics, Acad Athens, Athens, Greece, 17–19 September 2009; Acad Athens: Athens, Greece, 2011; pp. 313–327. [Google Scholar]
- Lu, S.N.; Xie, N.; Feng, L.C.; Zhong, J. Applications of Nanostructured Carbon Materials in Constructions: The State of the Art. J. Nanomater. 2015, 2015, 6. [Google Scholar] [CrossRef]
- Xia, Z.Y.; Pezzini, S.; Treossi, E.; Giambastiani, G.; Corticelli, F.; Morandi, V.; Zanelli, A.; Bellani, V.; Palermo, V. The Exfoliation of Graphene in Liquids by Electrochemical, Chemical, and Sonication-Assisted Techniques: A Nanoscale Study. Adv. Funct. Mater. 2013, 23, 4684–4693. [Google Scholar] [CrossRef]
- Ciesielski, A.; Samori, P. Graphene via sonication assisted liquid-phase exfoliation. Chem. Soc. Rev. 2014, 43, 381–398. [Google Scholar] [CrossRef] [PubMed]
- Hu, C.; Zhou, X. Preparation of Graphene by High Speed Shearing-assisted Oxidization-Reduction Method. Mater. Rev. 2015, 29, 29. [Google Scholar]
- GB 175-2017; Common Portland Cement. China Building Materials Academy: Beijing, China, 2017; p. 12.
- GB/T 50146-2014; Technical Code for Application of Fly Ash Concrete. Ministry of Water Resources of the People’s Republic of China: Beijing, China, 2014; p. 51.
- Sun, Z.; Nicolosi, V.; Rickard, D.; Bergin, S.D.; Aherne, D.; Coleman, J.N. Quantitative evaluation of surfactant-stabilized single-walled carbon nanotubes: Dispersion quality and its correlation with zeta potential. J. Phys. Chem. C 2008, 112, 10692–10699. [Google Scholar] [CrossRef]
- Experimental Study on the Thermal Start-Up Performance of the Graphene/Water Nanofluid-Enhanced Solar Gravity Heat Pipe. Nanomaterials 2018, 8, 72. [CrossRef] [PubMed]
- Aferni, A.E.L.; Guettari, M.; Tajouri, T.; Rahdar, A. The confinement of PVP in AOT microemulsions: Effect of water content and PVP concentration regime on electrical percolation phenomenon. J. Mol. Liq. 2020, 318, 114012. [Google Scholar] [CrossRef]
- Alexander, K.; Sheshrao Gajghate, S.; Shankar Katarkar, A.; Majumder, A.; Bhaumik, S. Role of nanomaterials and surfactants for the preparation of graphene nanofluid: A review. Mater. Today Proc. 2020, 44, 1136–1143. [Google Scholar] [CrossRef]
- REN, J.; Wang, C.; Yin, Y. Study liquid phase exfoliate is opropanol graphene ink and it’s stability. New Chem. Mater. 2017, 45, 154–156. [Google Scholar]
- Qin, W.; Guodong, Q.; Dafu, Z.; Yue, W.; Haiyu, Z. Influence of the molecular structure of a polycarboxylate superplasticiser on the dispersion of graphene oxide in cement pore solutions and cement-based composites. Constr. Build. Mater. 2021, 272, 121969. [Google Scholar] [CrossRef]
- Li, X.; Wang, L.; Liu, Y.; Li, W.; Dong, B.; Duan, W.H. Dispersion of graphene oxide agglomerates in cement paste and its effects on electrical resistivity and flexural strength. Cem. Concr. Compos. 2018, 92, 145–154. [Google Scholar] [CrossRef]
- Ghosal, M.; Chakraborty, A.K. Engineering the properties of nanomaterials for its use in cement concrete. Mater. Today Proc. 2021, 46, 7502–7506. [Google Scholar] [CrossRef]
- Shin, H.J.; Kim, K.K.; Benayad, A.; Yoon, S.M.; Park, H.K.; Jung, I.S.; Jin, M.H.; Jeong, H.K.; Kim, J.M.; Choi, J.Y.; et al. Efficient reduction of graphite oxide by sodium borohydride and its effect on electrical conductance. Adv. Funct. Mater. 2009, 19, 1987–1992. [Google Scholar] [CrossRef]
- Wang, Q.; Wang, J.; Lu, C.X.; Liu, B.W.; Zhang, K.; Li, C.Z. Influence of graphene oxide additions on the microstructure and mechanical strength of cement. New Carbon Mater. 2015, 30, 349–356. [Google Scholar] [CrossRef]
- Wang, B.M.; Deng, S. Effect and mechanism of graphene nanoplatelets on hydration reaction, mechanical properties and microstructure of cement composites. Constr. Build. Mater. 2019, 228, 116720. [Google Scholar]
- Gong, K.; Pan, Z.; Korayem, A.H.; Qiu, L.; Li, D.; Collins, F.; Wang, C.M.; Duan, W.H. Reinforcing Effects of Graphene Oxide on Portland Cement Paste. J. Mater. Civ. Eng. 2015, 27, A4014010. [Google Scholar] [CrossRef]
- Liu, J.; Fu, J.; Yang, Y.; Gu, C. Study on dispersion, mechanical and microstructure properties of cement paste incorporating graphene sheets. Constr. Build. Mater. 2019, 199, 1–11. [Google Scholar] [CrossRef]
- Cao, M.-l.; Zhang, H.-x.; Zhang, C. Effect of graphene on mechanical properties of cement mortars. J. Cent. South Univ. 2016, 23, 919–925. [Google Scholar] [CrossRef]
- Saafi, M.; Tang, L.; Fung, J.; Rahman, M.; Liggat, J. Enhanced properties of graphene/fly ash geopolymeric composite cement. Cem. Concr. Res. 2015, 67, 292–299. [Google Scholar] [CrossRef]
- Li, X.Y.; Liu, Y.M.; Li, W.G.; Li, C.Y.; Sanjayan, J.G.; Duan, W.H.; Li, Z.J. Effects of graphene oxide agglomerates on workability, hydration, microstructure and compressive strength of cement paste. Constr. Build. Mater. 2017, 145, 402–410. [Google Scholar] [CrossRef]
- Dalla, P.T.; Tragazikis, I.K.; Trakakis, G.; Galiotis, C.; Dassios, K.G.; Matikas, T.E. Multifunctional Cement Mortars Enhanced with Graphene Nanoplatelets and Carbon Nanotubes. Sensors 2021, 21, 933. [Google Scholar] [CrossRef] [PubMed]
- Al-Dahawi, A.; Sarwary, M.H.; Ozturk, O.; Yildirim, G.; Akin, A.; Sahmaran, M.; Lachemi, M. Electrical percolation threshold of cementitious composites possessing self-sensing functionality incorporating different carbon-based materials. Smart Mater. Struct. 2016, 25, 105005. [Google Scholar] [CrossRef]


| Components | SiO2 | Al2O3 | Fe2O3 | CaO | Mgo | SO3 |
|---|---|---|---|---|---|---|
| Cement | 21.96 | 4.73 | 3.68 | 65.3 | 2.59 | 0.30 |
| Fly ash | 52.2 | 20.81 | 9.35 | 10.86 | 0.60 | 1.06 |
| Type | Specific Surface Area (m2/g) | Thickness (nm) | Mean Diameter (μm) | Bulk Density (g/cm3) |
|---|---|---|---|---|
| GNPs | 150 | 6–8 | 15 | 0.07 |
| K-Value | PH | N-Vinyl-2-Pyrrolidinpne | Water | Nitrogen Content | Formic Acid | Ignition Residue |
|---|---|---|---|---|---|---|
| 27.0~32.4 | 3.0~5.0 | ≤0.001% | ≤5.0% | 11.5~12.8% | ≤0.5% | ≤0.1% |
| Mix | GNPs (wt% of cement) | W/C | GNPs (kg/m3) | Cement (kg/m3) | Fly Ash (kg/m3) | Quartz Sand (kg/m3) | Water (kg/m3) | Thickener (kg/m3) | Superplasticizer (kg/m3) |
|---|---|---|---|---|---|---|---|---|---|
| Ref. | 0 | 0.264 | 0 | 570.0 | 684.0 | 455.0 | 150.5 | 0.57 | 2.0 |
| M-005 | 0.05 | 0.264 | 0.28 | 570.0 | 684.0 | 455.0 | 150.5 | 0.57 | 2.0 |
| M-010 | 0.1 | 0.264 | 0.57 | 570.0 | 684.0 | 455.0 | 150.5 | 0.57 | 2.0 |
| M-030 | 0.3 | 0.264 | 1.71 | 570.0 | 684.0 | 455.0 | 150.5 | 0.57 | 2.0 |
| M-050 | 0.5 | 0.264 | 2.85 | 570.0 | 684.0 | 455.0 | 150.5 | 0.57 | 2.0 |
| M-070 | 0.7 | 0.264 | 3.99 | 570.0 | 684.0 | 455.0 | 150.5 | 0.57 | 2.0 |
| M-100 | 1.0 | 0.264 | 5.70 | 570.0 | 684.0 | 455.0 | 150.5 | 0.57 | 2.0 |
Publisher’s Note: MDPI stays neutral with regard to jurisdictional claims in published maps and institutional affiliations. |
© 2022 by the authors. Licensee MDPI, Basel, Switzerland. This article is an open access article distributed under the terms and conditions of the Creative Commons Attribution (CC BY) license (https://creativecommons.org/licenses/by/4.0/).
Share and Cite
Zhou, Y.; Wang, Y.; Gao, T.; Ling, Y.; Jiang, N.; Tawfek, A.M.; Yuan, H. Optimization of Graphene Nanoplatelets Dispersion and Its Performance in Cement Mortars. Materials 2022, 15, 7308. https://doi.org/10.3390/ma15207308
Zhou Y, Wang Y, Gao T, Ling Y, Jiang N, Tawfek AM, Yuan H. Optimization of Graphene Nanoplatelets Dispersion and Its Performance in Cement Mortars. Materials. 2022; 15(20):7308. https://doi.org/10.3390/ma15207308
Chicago/Turabian StyleZhou, Yong, Yuliang Wang, Tianming Gao, Yifeng Ling, Nengdong Jiang, Abdullah M. Tawfek, and Huaqiang Yuan. 2022. "Optimization of Graphene Nanoplatelets Dispersion and Its Performance in Cement Mortars" Materials 15, no. 20: 7308. https://doi.org/10.3390/ma15207308
APA StyleZhou, Y., Wang, Y., Gao, T., Ling, Y., Jiang, N., Tawfek, A. M., & Yuan, H. (2022). Optimization of Graphene Nanoplatelets Dispersion and Its Performance in Cement Mortars. Materials, 15(20), 7308. https://doi.org/10.3390/ma15207308