Abstract
The aim of this research was the preparation and characterization of hybrid prepreg tapes from glass multifilament roving (circular cross-section). The fiber, roving, and tape strength distribution was characterized by exploratory data analysis tools (especially quantile-quantile plot) and modeled by the three parameters’ Weibull distribution. For estimation of Weibull model parameters, the noniterative technique based on the so-called Weibull moments was used. It was shown that the prepared hybrid prepreg tapes prepared by controlled mechanical spreading technology developed by the authors improved mechanical tensile properties and can be used for the preparation of composites of complicated forms by robotic winding.
1. Introduction
Globally, thermoset resins are the most commonly used composite materials with applications as matrix and glass fibers as cheap reinforcing agents [1,2,3,4,5,6,7,8,9]. The reinforcement bears the stresses [10,11] and the matrix ensures the cohesion of the composite and distributes and damps the impacts or stresses to protect the composite from the environment [12,13,14,15,16]. The design of composites depends on the choice of fibers’ orientation and stacking sequence as well [17]. Both the materials and manufacturing process influence the quality of the produced composites [18]. Advanced composites are commonly manufactured from prepreg materials where the reinforcing fibers are assembled in unidirectional tape form (Roving or tow) or as a woven fabric and then pre-impregnated with a resin [19,20,21,22,23]. Standard multifilaments can be simply replaced by spread tow tape (STT) with a rectangular cross-section (constant thickness), which evenly distributes the tensile stress. Their width is three times the diameter of the original circular multifilament (see Figure 1).
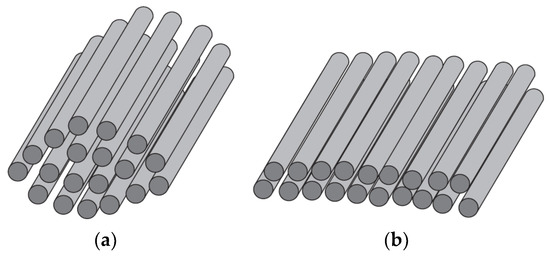
Figure 1.
Geometry of (a) roving and (b) tape.
The individual filaments are much more closely arranged and straighter. They behave like a bunch of identical long parallel threads. This leads to better utilization of the strength of individual filaments and a reduction in the thickness (by 20–30%) and, hence, the density of the composites [20,21]. Prepregs tapes are being increasingly used in high-performance applications in the composites’ industry and also in other sectors. The application for the creation of composites with complicated shapes by robotized winding is relatively novel (see Figure 2).
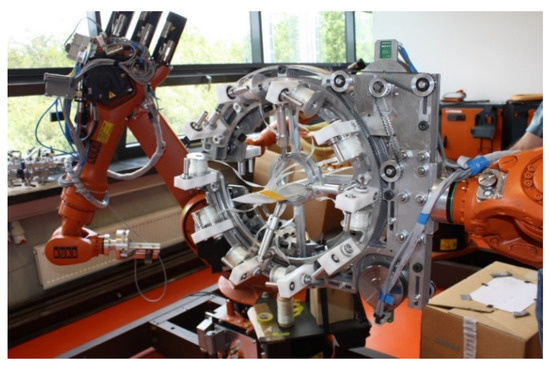
Figure 2.
Robotized winding by using hybrid tapes (developed at TUL).
The main aim of this study was to describe a simple technology of preparation of hybrid straight tape (rectangular cross-section) from a glass fiber multifilament (nearly circular cross-section) and the epoxy matrix by a prototype device for controlled mechanical spreading and straightening. We prepared the new hybrid tape suitable for robotic winding and described the properties of the material. We used industrially prepared roving available from different producers and showed how to change a cross-sectional shape and straightness to obtain better material. The device for the creation of the tape was proposed and checked in our lab. Therefore, the results presented are novel. The glass fiber multifilament roving from a Slovak supplier was used. The simple, idealized model of the spreading process based on the limited honeycomb arrangement of fibers in the roving cross-section is described. Tensile properties of individual fibers, roving, and tape were comprehensively analyzed, and the prediction of strength distribution was carried out by using advanced statistical tools.
2. Experimental
2.1. Materials Used
A glass multifilament roving StarRow 1200 from a Slovak supplier, Johns Manville Slovakia, a.s., Trnava, Slovakia was selected as reinforcement. The typical properties of these filaments provided by the supplier are given in Table 1.

Table 1.
Typical Properties of Johns Maneville Co. Glass Rendering SL (Slovakia).
The hybrid tape was prepared by the controlled spreading technology in the Technical University of Liberec. The hybrid tape specifications are given in Table 2.
Table 2.
Specifications of selected materials containing glass.
The glass fibers are made of aluminosilicate E-glass in accordance with ASTM D 578. Mechanically spread SLT rovings were coated with a CHS-EPOXY 200 V 55 epoxy resin dispersion with a catalyst and pre-cured at 80 °C for 24 h.
2.2. Preparation of Tapes
Spread-tow technology is based on the geometric rearrangement of fibrous tow into a thinner, flatter, and more oriented rectangular tape with increased load-carrying efficiencies (see Figure 3) [20].
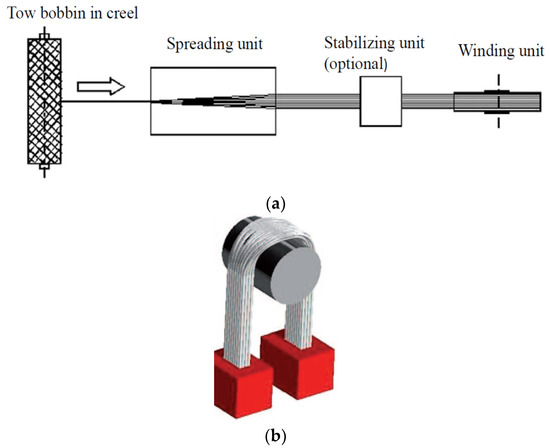
Figure 3.
(a) Typical spreading system; (b) principle of mechanical spreading [18].
Preparation of SLT was carried out in a pilot plant spreading unit built by Večerník s.r.o. company, Pěnčín, Czech Republic. Further development of this unit was carried out at the Faculty of Textile Engineering (see Figure 4). The principle is passive mechanical spreading around a rotating circular bar in a spreading unit (see Figure 3a,b). The unit also includes an element that will provide a constant strain of roving [24]. The overall path of roving before the wrap of the prepreg takes about 15 m.
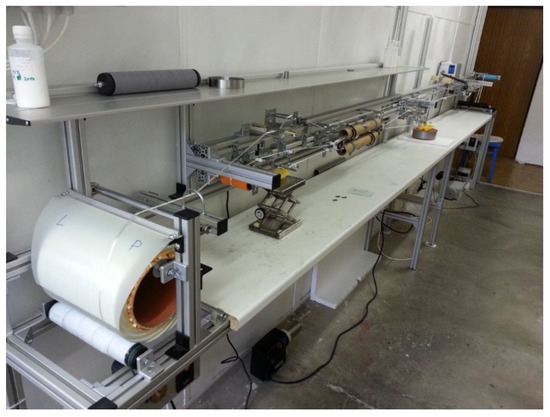
Figure 4.
Semi-operating device for preparing a prepreg (© Global Science Press) [20].
In the first part, roving passes through the smooth steel rod system to ensure an even separation of the individual fibers.
The matrix phase in the hybrid SLT is made from a mixture of acrylate polymers and epoxy-silane, which are suitable for epoxy resin [13]. To ensure a sufficient epoxy matrix content, three epoxy dispersion-based coating stations were used in the line. At each of the stations, the impregnated roving was dried at elevated temperatures (80–120 °C). In terms of penetration into the fibrous structure, the first deposit is the most important. Further deposits are mainly due to the layers being interconnected with each other in the formation of the composite. After the last coating of the epoxy dispersion with the catalyst, cross-winding was performed on a paper roll.
2.3. Characterization and Test Methods
Scanning electron microscopy (SEM) was used to determine the microscopic characteristics of the roving and prepreg glass filament tapes. Images were performed on Sigma (Zeiss, Jena, Germany) equipment. The tensile properties were measured by a 1000 N (Instron instrument) head with pneumatic jaws and rubber, a clamping length of 200 mm, a jaw velocity of 50 mm/min, i.e., a strain rate of 0.25/min, a tape thickness of 0.16 mm (differences without epoxy), and a width of 4 mm. The tensile properties of fibers were measured in a Vibrodyn 400 instrument. For the prediction of strength distribution, the noniterative method of Weibull moments was selected.
3. Spreading Process
Wilson [25] studied the mechanical mode of spreading fibrous bundles, which could be extended to predict the mechanically induced spreading of E-glass fiber bundles [26].
The cross-section geometry of spread roving composed of circular fibers can be predicted from idealized structural arrangements. The simple, idealized spreading process assumes a limited honeycomb arrangement of fibers in the roving cross-section. In the so-called close honeycomb structures, the filaments are arranged in hexagonal concentric layers (see Figure 5).
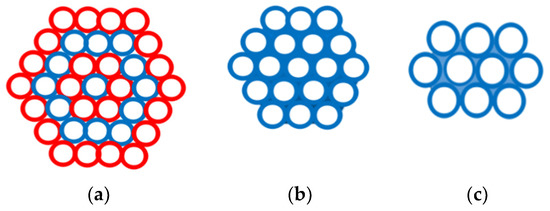
Figure 5.
Honeycomb structure [27]. (a) 1 + 6+12 + 18 + …m (i). (b) Close honeycomb. (c) Open honeycomb. Limit packing density hm .
In the first concentric layer of this structure there is only one filament, in the second layer there are six filaments, and in the ith layer, where i = 2, 3, etc., the number of filaments (m) can be determined from the Equation m (i) = 6 (i − 1). The structure containing l layers is composed of a total of n = 3l2 − 3l + 1 filaments. The number of layers ln in a close honeycomb structure is related to the total number of filaments n [27].
The circle diameter Dn is the same area as the area circumscribed to the close honeycomb structure composed from filaments with diameter d [27].
Roving with the fineness T [tex] composed from individual filaments with fineness T [tex] has a total number of filaments of nT = T/t. If nT = n, the tow can ideally follow a full-close honeycomb structure. The fineness of roving T is the product of the cross-section area of filaments S and glass density ρ. The diameter DT [mm] of ideal circular roving is then expressed in the form:
Here, the packing density for a compact honeycomb structure is µ = µlim = 0.907 and for real filaments is µ about 0.7. For tow with fineness 1200 tex and glass density ρ = 2580, kg m−3 is then for a compact honeycomb DT = 0.808 mm and for real multifilaments DT = 0.9198 mm. During flattening the most optimal arrangement according to the compact honeycomb structure is maintained (see Figure 6).
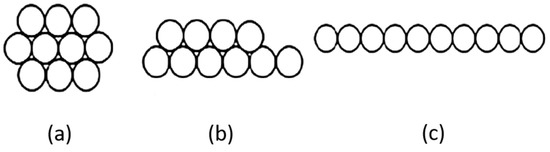
Figure 6.
Idealized spreading process (a) a = 4d, b = 3d (b) a = 6d, b = 2d (c) a = 10d, b = d [27].
The width of the multifilament a and thickness b are varied depending upon the number of layers. Relative width α, relative thickness β, and relative flatness γ (γ ≥ 1) are defined as .
There are two types of geometrical assumptions of spreading leading to the prediction of the relation between relative width and relative thickness.
- A.
- Assumption of the constant area during spreading in combination with Kemp racetrack cross-section of tape leads to the relation [28]:
- B.
- Assumption of constant perimeter during spreading in combination with Kemp racetrack cross-section of tape leads to the relation [29]:
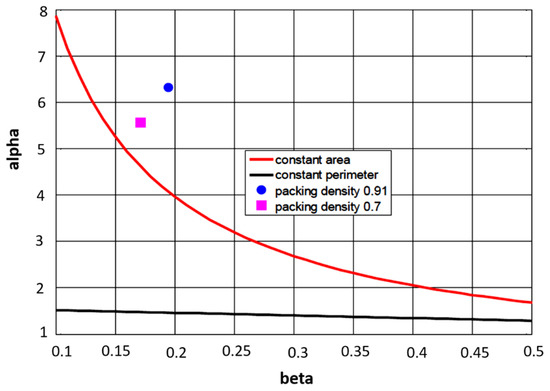
Figure 7.
Dependence of tape width on thickness under different assumptions.
Let us have a tow (SL) of fineness 1200 tex composed from 2376 filaments with a close honeycomb structure. From Equation (1), the total number of layers is 29 including the central one. In the outer 29th layer, there are 107 filaments. The diameter of tow for a honeycomb is DT = 0.808 mm and for real multifilaments it is DT = 0.9198 mm. For filament fineness of 0.505 tex, the corresponding diameter is 0.0159 mm. The spread tow (SLT) has the same shape characteristics as tow SL. The corresponding relative width and thickness for both packing densities are given in Table 3.
Table 3.
Idealized geometry of SLT.
Based on the assumption of the constant area during spreading, for β = 0.196 and 0.172, the calculated width is αc from Equation (4) for different packing densities through DT. It is visible that for µ = 0.7, the values of α and αc are closer (see also points in Figure 7).
4. Results and Discussion
4.1. Hybrid Tape Geometry
SEM was used to determine the microscopic characteristics of the glass filament prepreg tapes. It can be observed from Figure 8 that prepreg tapes are approximately rectangular in cross-section and are slightly undulating. The roving is slightly wavy; the straps are straight.
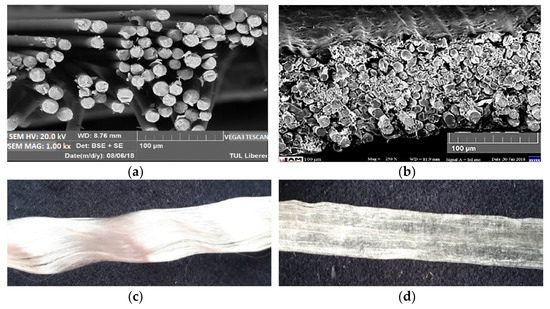
Figure 8.
Material SL and SLT (a) glass filaments cross-section, (b) prepreg tape cross-section, (c) longitudinal view of roving, (d) longitudinal view of prepreg tape.
Individual filaments in SL materials were obtained by direct separation from roving.
4.2. Fiber Strength Distribution
The main goal of modeling and statistical analysis was to specify the strength distribution and estimate the relevant parameters based on experimental strengths. The fibers separated manually from SL materials were tested on a tensile testing machine under standard conditions. Tensile loads were measured at a clamping length of 10 mm at an elongation rate of 10 mm/min. The load data were converted to break stress (strength, MPa). Then, 120 measurements were used for analysis and parameter estimation. The histogram of the experimental distribution of fiber strength is shown in Figure 9. The red curve is a pdf of the normal distribution with parameters’ sample mean and variance calculated from data by standard procedure (see Table 4) [29]. The histogram is showing a nearly symmetric distribution.
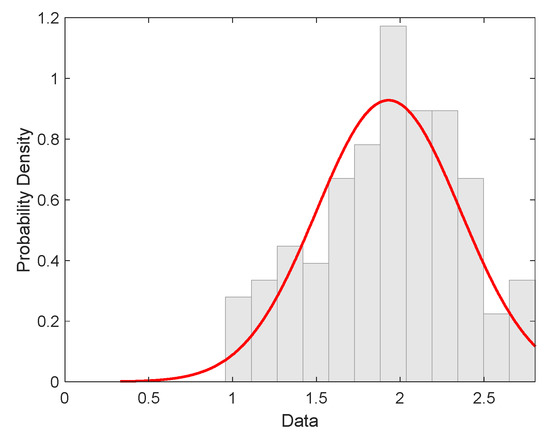
Figure 9.
Histogram characterized by experimental distribution of filament strength (red curve is the probability density of normal distribution).
Table 4.
Basic statistical properties of fiber strength.
Basic statistical characteristics of the strength of individual fibers are given in Table 4.
The quantile-quantile graph, which compares quantiles of experimental distribution (estimated simply by ordered experimental stress values arranged in ascending manner i.e., ) with quantiles of selected theoretical distribution (here normal distribution), is used for checking the quality of the approximation of experimental distribution by the selected theoretical one. In the case when the experimental distribution is well approximated by the theoretical one, the Q-Q graph should be in the form of a straight line. For rigorous testing, there exist many characteristics. Therefore, a simpler correlation coefficient was used. The quantile-quantile (Q-Q) graph for assessing normality [29] (see Figure 10) shows slight systematic differences from the assumption of data normality near the lower and upper tails.
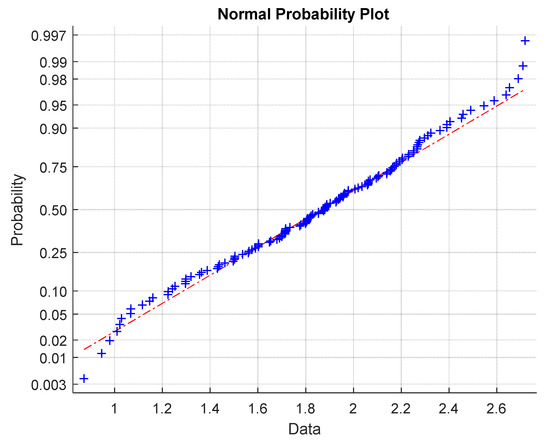
Figure 10.
Q-Q graphs for data normality verification (red line is the ideal shape for normal distribution).
4.3. Roving Strength Distribution
Roving was tested on a tensile tester under standard conditions. Breaking loads were measured at a clamping length of 200 mm. The load data were converted to the breaking stress (strength). Then, 120 measurements were used for analysis and parameter estimation. The basic statistical characteristics of strength are given in Table 5.
Table 5.
Roving strength characteristics and parameters of the Weibull distribution.
Three parameters’ Weibull distribution was used as a model to analyze the strength distribution of roving and hybrid tape [23]. Parameters (A, B, C) of the Weibull distribution were estimated from experimental strengths by special moments. The three parameters are denoted as C > 0, the shape parameter responsible for the skew of the distribution; B > 0, the scale parameter; and, finally, A > 0, the shift parameter, which is also a lower bound). The distribution function of three parameters’ Weibull distribution is given by:
For the estimation of the parameters of Equation (6), plenty of different methods are used (see [29,30,31,32]). They are iterative and their solution for a non-zero threshold A is not in all cases successful. The non-iterative method based on the so-called Weibull moments mr defined by relations
is more reliable. In Equation (7), symbol means the ith order statistics, i.e., the ith smallest value of the breaking strength in the sample. Order statistics can be simply obtained by sorting experimental data in ascending order; for example, i = 0 is formally . This technique can be used for the rough estimation of strength distribution parameters. Shape parameter C can be estimated from relation [24].
For the estimation of the threshold (lower limiting strength), A is valid as
and we can estimate the scale parameter B in the form
where Γ(x) is Gamma function. These equations were here used for parameters A, B, and C estimation.
The Histogram of the experimental tow strength distribution of filaments is shown in Figure 11.
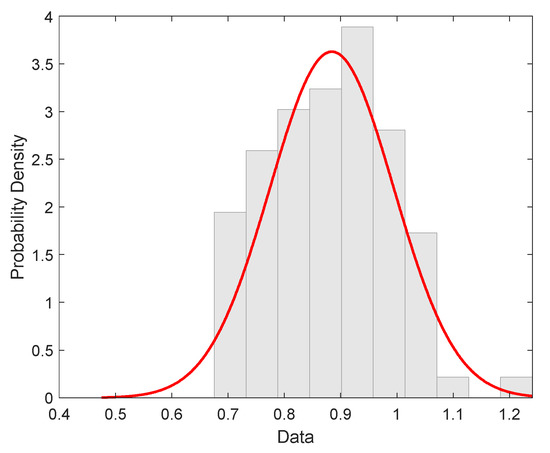
Figure 11.
Experimental distribution of roving strength (red curve is the probability density of normal distribution).
Q-Q graphs to verify normal distribution (see Figure 12) showed slight differences in the end region from the assumption of data normality.
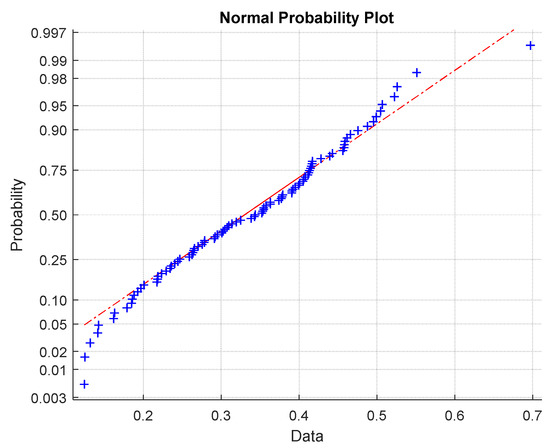
Figure 12.
Q-Q graph for data normality verification (red line is an ideal shape for normal distribution).
4.4. Hybrid Tapes Strength Distribution
The Hybrid Tapes were tested on a tensile tester under standard conditions. The breaking loads were measured at a clamping length of 200 mm. The load data were converted to the breaking stress (strength). A total of 25 measurements of SLT were made (simulating a real sample size in practice). The Basic statistical characteristics of the tape are given in Table 6.
Table 6.
Tape strength characteristics and Weibull distribution parameters.
The average strength of SLT must be higher than SL, indicating the validity of the mixing rules (the strength in the composite exceeds the strength of the strongest component). The experimental distribution of strength is shown in Figure 13.
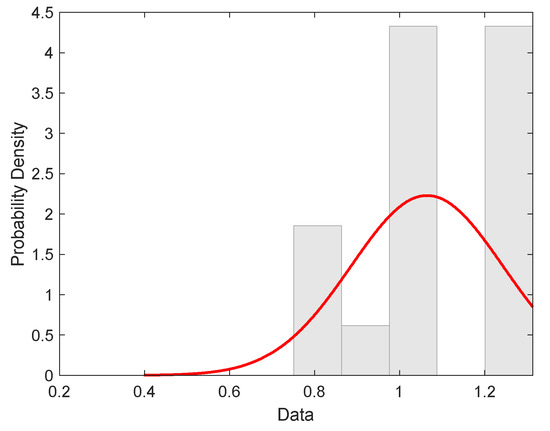
Figure 13.
Experimental distribution of tape strength (red curve is the probability density of normal distribution).
Due to the small number of SLT samples, the constant non-parametric probability density function estimation based on the histogram was not very useful. The Q-Q graph for normal distribution (see Figure 14) showed differences in the tail regions from the assumption of normality. The assumption that the glass filaments break firstly (have lower breaking elongation than matrix phase) enabled us to predict tape strength from a simple mixture rule:
where Em is the matrix modulus, vf is the volume fractions of the fiber, and εB is the breaking strain of the fiber bundle, which is related to the bundle strength σB = Ef εB, where the tensile modulus of the bundle is identical to that of the fiber.
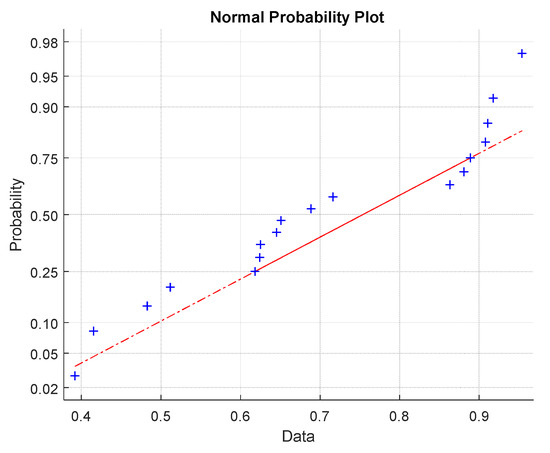
Figure 14.
Q-Q graph for data normality verification (red line is the ideal shape for normal distribution).
The tape strength σT is the sum of contribution of the fibrous phase σTf and the matrix phase σTM, given as:
The contributions of the fiber (vf = 0.642) and matrix phases to the hybrid tape strength calculated from the simple rule of mixture are given in Table 7.
Table 7.
Components of hybrid tape strength.
Due to the approximative normality of roving strength σB, the tape strength is σT, as well as being approximately normally distributed, and for mean tape strength it is valid [16].
Corresponding standard deviation ST has the form:
where and SB are the mean fiber bundle strength and its standard deviation. These relations are showing the prediction of tape strength basic statistical characteristics from characteristics of roving and matrix. Table 8 shows the calculated mean tape strength and corresponding standard deviations from parameters of roving and filament strengths (calculated from Equations (15) and (16)).
Table 8.
Predicted basic statistical characteristics of tape.
In comparison with experimental results (see Table 6), the agreement of mean values was visibly moderate, but the predicated standard deviations were highly underestimated. The reason is probably a higher error component due to experimental errors (uncertainty). The mean and variance of Weibull distribution are related to parameters A, B, and C by relations
In the case of no validity of mixture rule, it is possible to adopt the hypothesis that filaments can be broken in matrix phase repeatedly into smaller parts until their lengths will be over the critical length lc [30]
where rf is the fiber radius and is the yielding shear strength of the matrix adjacent to the interface or that of the fiber–matrix interface, whichever is less. This modification is crucial so that the effect of fiber–matrix interaction can be included. The mean and standard deviation ST of tape strength can be, therefore, simply calculated by replacing bundle strength and standard deviation by and i.e., by modification of parameter B due to different lengths (replacing lf by the critical length lc) [31,32].
5. Conclusions
The proposed device for spreading can be used for the preparation of hybrid tapes with enhanced mechanical properties. It is apparent from the SEM images that the glass fibers in the active hybrid SLT tapes were evenly spaced along with the tape and evenly surrounded by the epoxy resin to form the required rectangular cross-section. The quality of the interface looked good. The fiber strength distribution can be successfully predicted by the Weibull distribution. The tensile strength distribution of rovings can also be described using the Weibull distribution. For predictive purposes, the strength characteristics (mean and standard deviation) can be calculated from the parameters (A, B, C) of the Weibull distribution. It was found that the SLT hybrid tape developed has improved mechanical tensile properties (see Table 7) useful for example robotic winding.
Author Contributions
Conceptualization, J.M. and M.V.; methodology, M.V.; software, D.K. (Dana Kremenakova); validation, M.V., J.M. and A.S.; formal analysis, D.K. (Dana Kremenakova); investigation, M.V.; resources, M.V. and D.K. (Daniel Karthik); data curation, M.V.; writing—original draft preparation, M.V.; writing—review and editing, J.M.; visualization, A.S. and D.K. (Daniel Karthik); supervision, J.M.; project administration, M.P.; funding acquisition, M.P. All authors have read and agreed to the published version of the manuscript.
Funding
The APC was funded by the Ministry of Education, Youth and Sports of the Czech Republic and the European Union (European Structural and Investment Funds—Operational Programme Research, Development, and Education) in the frames of the project “Modular platform for autonomous chassis of specialized electric vehicles for freight and equipment transportation”, Reg. No. CZ.02.1.01/0.0/0.0/16_025/0007293.
Acknowledgments
This work was supported by the Ministry of Education, Youth and Sports of the Czech Republic and the European Union (European Structural and Investment Funds—Operational Programme Research, Development, and Education) in the frames of the project “Modular platform for autonomous chassis of specialized electric vehicles for freight and equipment transportation”, Reg. No. CZ.02.1.01/0.0/0.0/16_025/0007293.
Conflicts of Interest
The authors declare no conflict of interest.
References
- Ngo, T.D. (Ed.) Introduction to Composite Materials. In Composite and Nanocomposite Materials—From Knowledge to Industrial Applications; IntechOpen: London, UK, 2020. [Google Scholar] [CrossRef]
- Sathishkumar, T.P.; Satheeshkumar, S.; Naveen, J. Glass fiber-reinforced polymer composites—A review. J. Reinf. Plast. Compos. 2014, 33, 1258–1275. [Google Scholar] [CrossRef]
- Nunes, J.P.; Van Hattum, F.W.J.; Bernardo, C.A.; Silva, J.F.; Marques, A.T. Advances in Thermoplastic Matrix Towpregs Processing. J. Thermoplast. Compos. Mater. 2004, 17, 523–544. [Google Scholar] [CrossRef]
- Global Advanced Polymer Composites Market is Expected to Reach USD 16.83 Billion by 2025: Fior Markets, GlobeNewswire News Room, 20 February 2020. Available online: http://www.globenewswire.com/news-release/2020/02/20/1988157/0/en/Global-Advanced-Polymer-Composites-Market-is-Expected-to-Reach-USD-16-83-Billion-by-2025-Fior-Markets.html (accessed on 11 February 2021).
- A Review of the Global Composites Market and Turkish Composites Market. Available online: https://www.reinforcer.com/en/category/detail/A-Review-of-the-Global-Composites-Market-and-Turkish-Composites-Market/61/350/0 (accessed on 11 February 2021).
- Thomason, J.; Jenkins, P.; Yang, L. Glass Fibre Strength—A Review with Relation to Composite Recycling. Fibers 2016, 4, 18. [Google Scholar] [CrossRef]
- Bauer, R.S.; Stewart, S.L.; Stenzenberger, H.D. Composite Materials, Thermoset Polymer-Matrix; Wiley: Hoboken, NJ, USA, 2000. [Google Scholar] [CrossRef]
- Thomason, J.; Yang, L.; Meier, R. The properties of glass fibres after conditioning at composite recycling temperatures. Compos. Part A Appl. Sci. Manuf. 2014, 61, 201–208. [Google Scholar] [CrossRef]
- Hu, N. (Ed.) Composites and their properties. In BoD–Books on Demand; IntechOpen: Rijeka, Croatia, 2012. [Google Scholar]
- Mesquita, F.; Bucknell, S.; Leray, Y.; Lomov, S.V.; Swolfs, Y. Single carbon and glass fibre properties characterised using large data sets obtained through automated single fibre tensile testing. Compos. Part A Appl. Sci. Manuf. 2021, 145, 106389. [Google Scholar] [CrossRef]
- Mei, M.; He, Y.; Yang, X.; Wei, K.; Qu, Z.; Fang, D. Shear deformation characteristics and defect evolution of the biaxial ±45° and 0/90° glass non-crimp fabrics. Compos. Sci. Technol. 2020, 193, 108137, ISSN 0266-3538. [Google Scholar] [CrossRef]
- Artemenko, S.E. Polymer Composite Materials Made from Carbon, Basalt, and Glass Fibres. Structure and Properties. Fibre Chem. 2003, 35, 226–229. [Google Scholar] [CrossRef]
- Venkataraman, M.; Militký, J.; Mishra, R.; Kremenakova, D.; Petru, M. Tensile Properties of Glass Roving and Hybrid Tapes. IOP Conf. Ser. Mater. Sci. Eng. 2019, 553, 012055. [Google Scholar] [CrossRef]
- Kovacevic, S.; Brnada, S.; Dobnik-Dubrovski, P. Analysis of the Mechanical Properties of Woven Fabrics from Glass and Basalt Yarns. Fibres Text. East. Eur. 2015, 23, 83–91. [Google Scholar] [CrossRef][Green Version]
- Summerscales, J.; Short, D. Carbon fibre and glass fibre hybrid reinforced plastics. Composites 1978, 9, 157–166. [Google Scholar] [CrossRef]
- Biron, M. Chapter 6—Thermoplastic Composites. In Thermoplastics and Thermoplastic Composites, 3rd ed.; Biron, M., Ed.; William Andrew Publishing: Norwich, NY, USA, 2018; pp. 821–882. [Google Scholar] [CrossRef]
- Swolfs, Y.; Verpoest, I.; Gorbatikh, L. Recent advances in fibre-hybrid composites: Materials selection, opportunities and applications. Int. Mater. Rev. 2019, 64, 181–215. [Google Scholar] [CrossRef]
- Binetruy, C. Composites Manufacturing Overview of Current Advances and Challenges for the Future. In Proceedings of the the ECCM 16—16th European Conference on Composite Materials, Seville, Spain, 22–26 June 2014. [Google Scholar]
- Maddaloni, G.; Parcesepe, E.; Franco, A.; Bonati, A.; Occhiuzzi, A.; Pecce, M.R. Experimental characterization of tensile strength of steel and fibre rovings also under environmental conditioning. Compos. Part B Eng. 2021, 217, 108895. [Google Scholar] [CrossRef]
- Venkataraman, M.; Militky, J.; Pulicek, R.; Novotna, J. Sophisticated Glass Tapes for Fabrication of Composites. J. Fiber Bioeng. Inform. 2019, 12, 35–42. [Google Scholar] [CrossRef]
- El-Dessouky, H.M.; Lawrence, C.; Mcgrail, T.; Broughton, B. Ultra-Light Weight Thermoplastic Composites: Tow-Spreading Technology. In Proceedings of the ECCM15—15th European Conference on Composite Materials, Venice, Italy, 24–28 June 2012. [Google Scholar]
- Molyneux, M.; Murray, P.; Murray, B.P. Prepreg, tape and fabric technology for advanced composites. Composites 1983, 14, 87–91. [Google Scholar] [CrossRef]
- Haincová, E.; Hájková, P.; Kohout, J. Prepregs for Temperature Resistant Composites. Materials 2019, 12, 4012. [Google Scholar] [CrossRef] [PubMed]
- Rinne, H. The Weibull Distribution. A Handbook; Chapman & Hall: Boca Raton, FL, USA, 2009. [Google Scholar]
- Wilson, S. Lateral spreading of fibre tows. J. Eng. Math. 1997, 32, 19–26. [Google Scholar] [CrossRef]
- Irfan, M.S.; Machavaram, V.R.; Mahendran, R.S.; Shotton-Gale, N.; Wait, C.F.; Paget, M.A.; Hudson, M.; Fernando, G.F. Lateral spreading of a fiber bundle via mechanical means. J. Compos. Mater. 2011, 46, 311–330. [Google Scholar] [CrossRef]
- Militký, J.; Venkataraman, M.; Baheti, V.; Novotná, J.; Pulicek, R.; Samková, A.; Karolína, V.; Pavel, S.; Dana, K.; Rajesh, M.; et al. Characterization and Strength Distribution of Fibrous Glass Tapes. In Recent Trends in Fibrous Material Science; Technical University of Liberec: Liberec, Czech Republic, 2019; pp. 9–52. [Google Scholar]
- Neckar, B. Yarn. Creation, Structure and Properties; SNTL: Prague, Czech Republic, 1990. (In Czech) [Google Scholar]
- Meloun, M.; Militky, J. Book-035 Statistical Data Analysis, A Practical Guide with 1250 Exercises and Answer Key on CD; Woodhead Publishing: New Delhi, India, 2011. [Google Scholar]
- Naresh, K.; Shankar, K.; Velmurugan, R. Reliability analysis of tensile strengths using Weibull distribution in glass/epoxy and carbon/epoxy composites. Compos. Part B Eng. 2018, 133, 129–144. [Google Scholar] [CrossRef]
- Monteiro, S.N.; Margem, F.M.; Braga, F.D.O.; da Luz, F.S.; Simonassi, N.T. Weibull analysis of the tensile strength dependence with fiber diameter of giant bamboo. J. Mater. Res. Technol. 2017, 6, 317–322. [Google Scholar] [CrossRef]
- Pan, N. A Detailed Examination of the Translation Efficiency of Fiber Strength into Composite Strength. J. Reinf. Plast. Compos. 1995, 14, 2–28. [Google Scholar] [CrossRef]
Publisher’s Note: MDPI stays neutral with regard to jurisdictional claims in published maps and institutional affiliations. |
© 2022 by the authors. Licensee MDPI, Basel, Switzerland. This article is an open access article distributed under the terms and conditions of the Creative Commons Attribution (CC BY) license (https://creativecommons.org/licenses/by/4.0/).