
Study on the Compression Effect of Clothing on the Physiological Response of the Athlete


 , ,
, ,
Abstract
:1. Introduction
2. Materials and Methods
2.1. The Test Persons
2.2. Materials
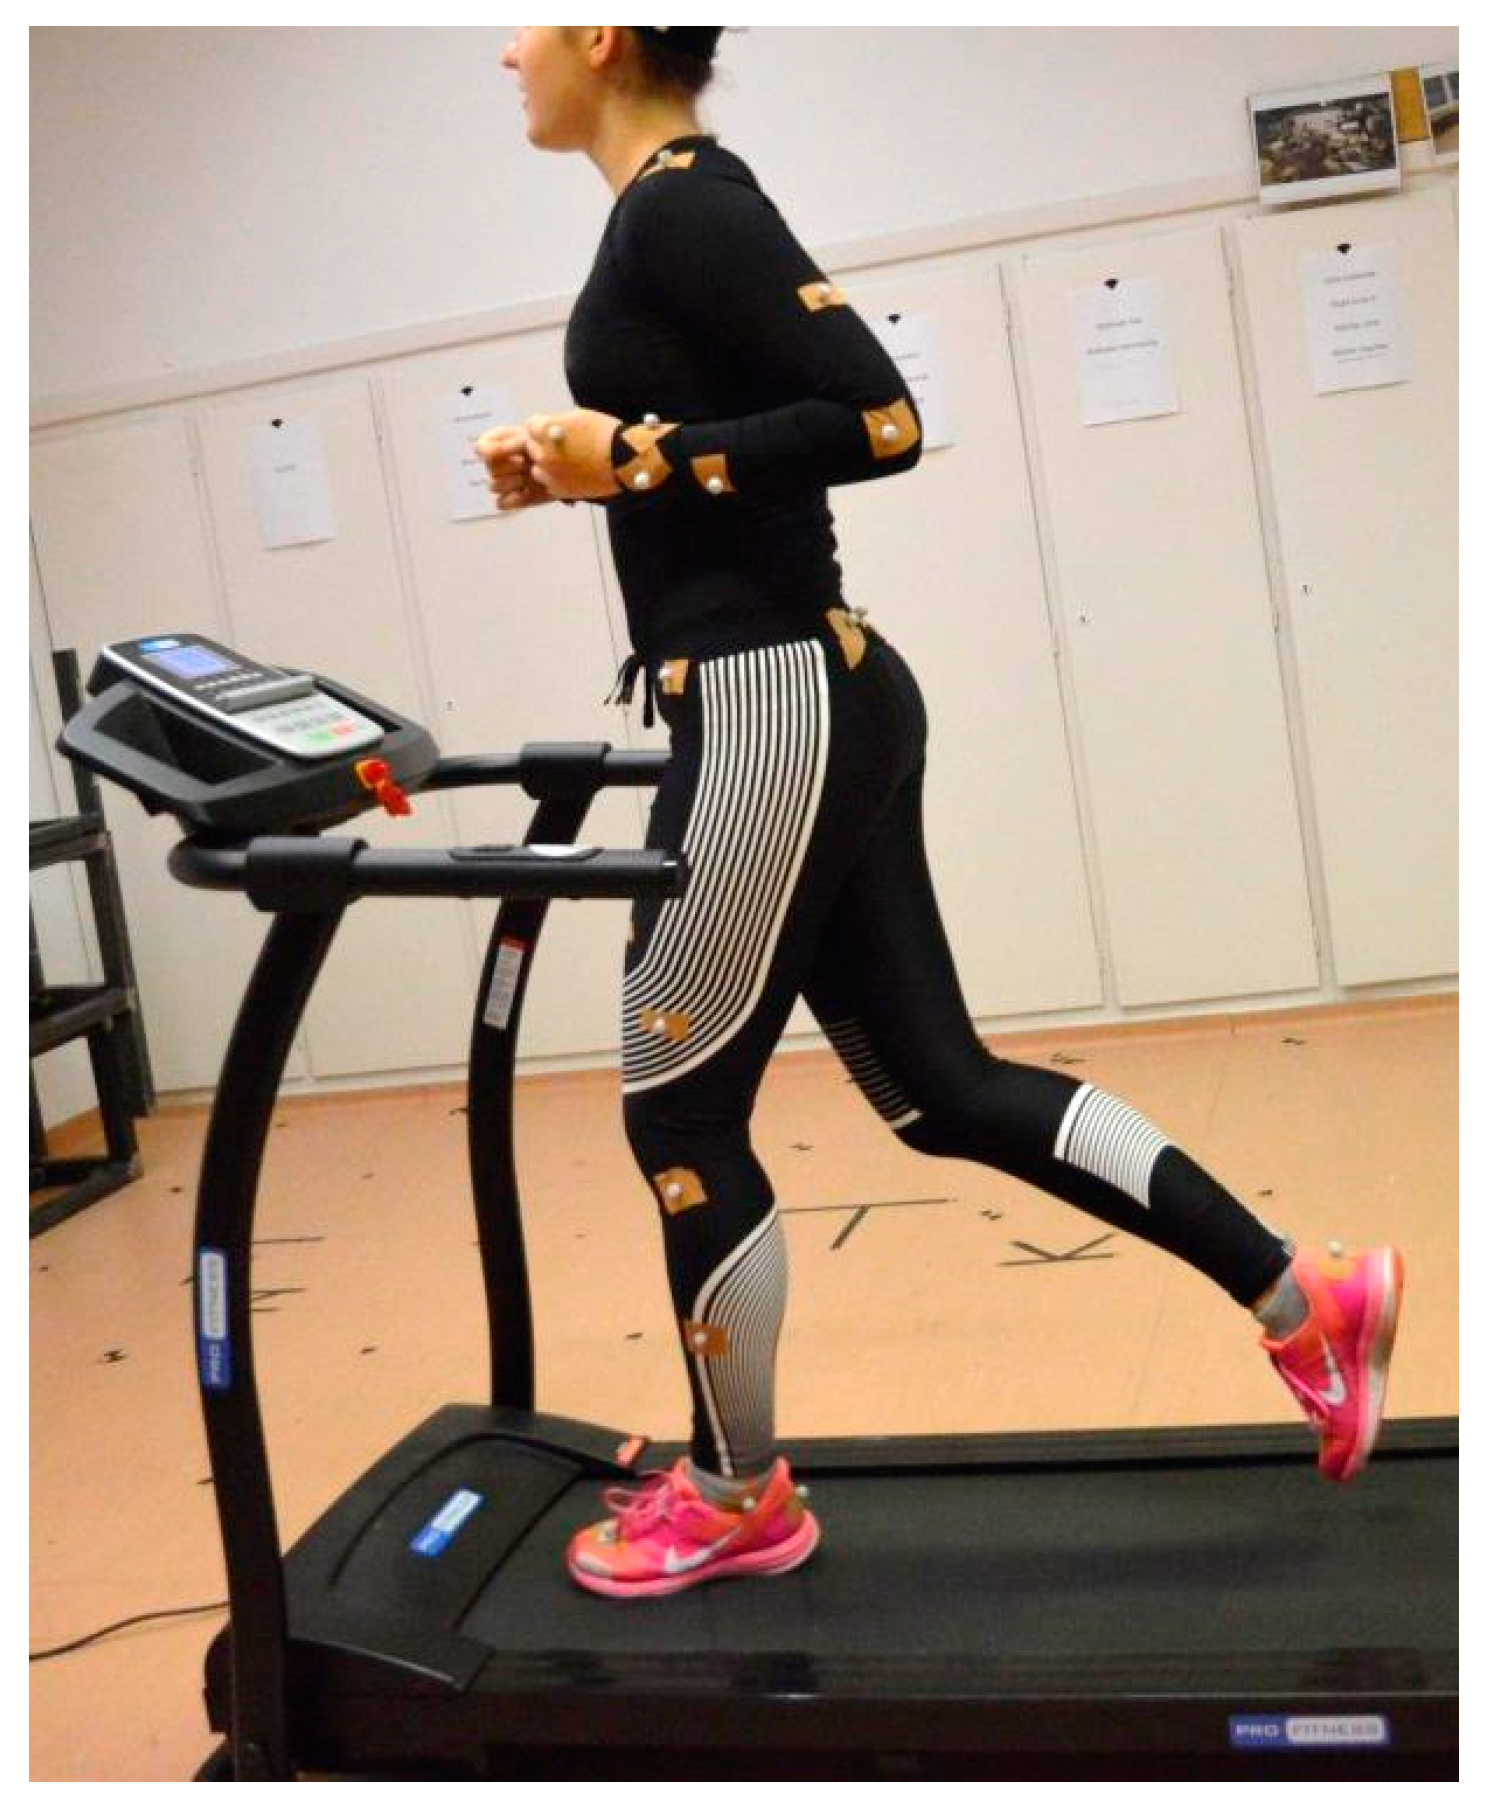
2.3. Test Protocol
- −
- 3 min: Load I (running speed of 4 km/h);
- −
- 3 min: Load II (running speed of 7 km/h);
- −
- 3 min: Load III (running speed of 8 km/h);
- −
- 3 min: Load IV (running speed of 10 km/h);
- −
- 3 min: Load V (running speed of 11 km/h).
- −
- The compression effect of sportswear on the body (measuring the pressure exerted by the sportswear on the body of the test person);
- −
- Body mass loss due to sweat;
- −
- Thermal imaging during running.
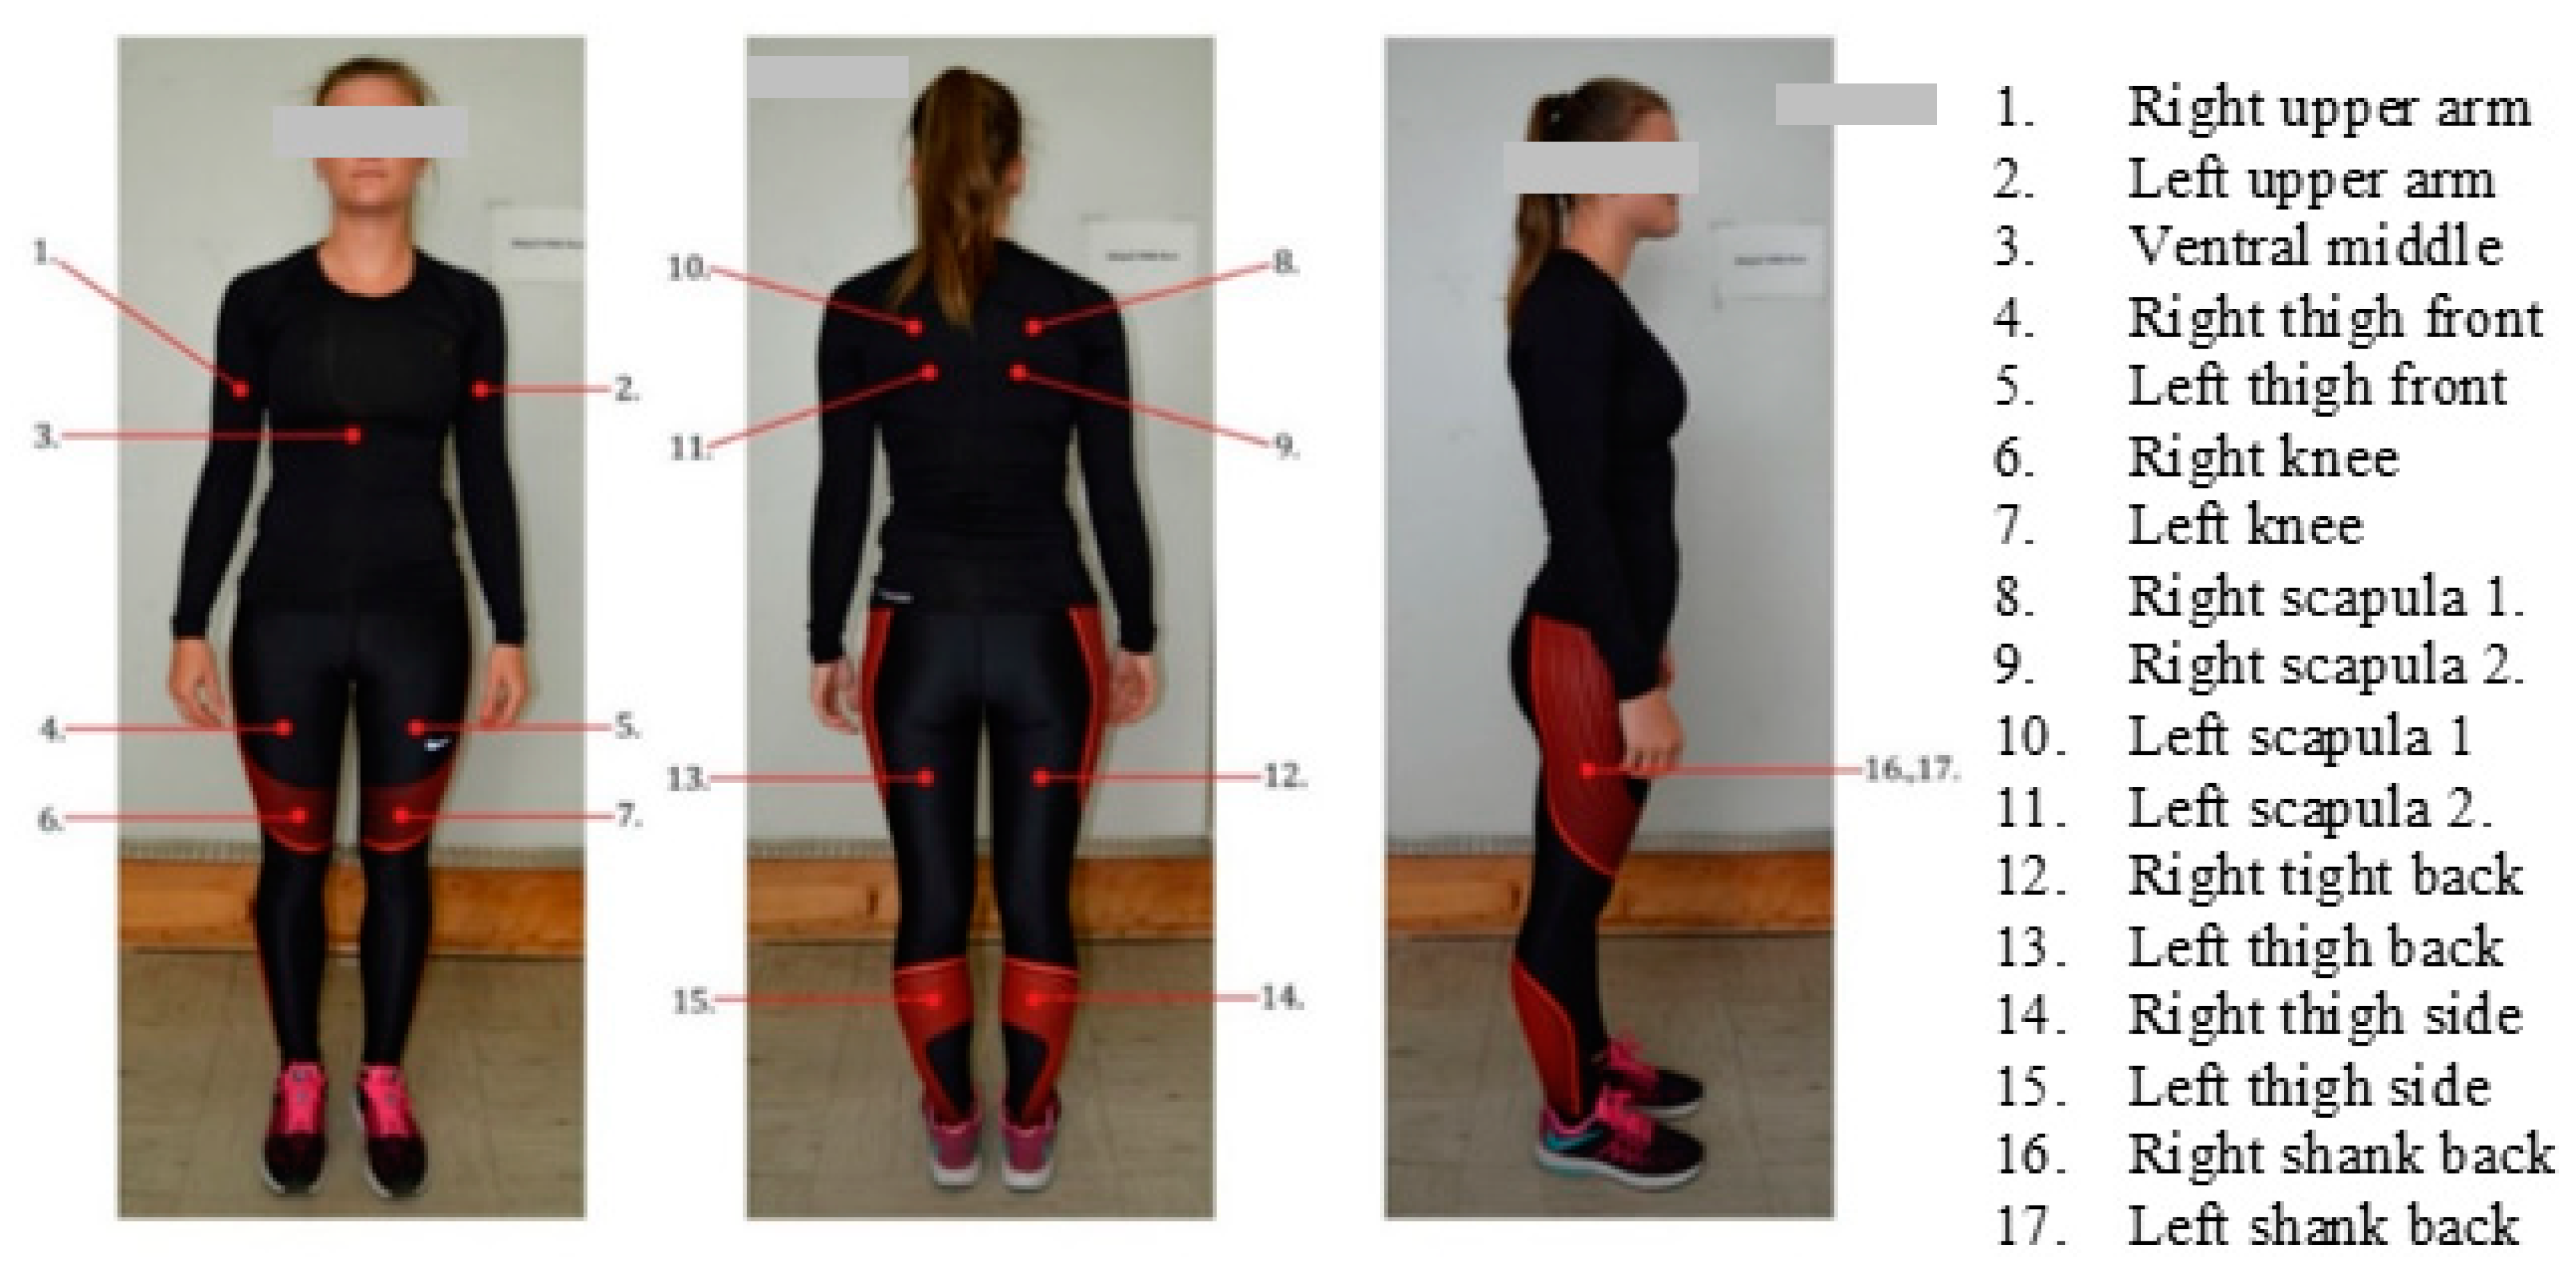
2.3.1. Determination of Pressure Distribution
2.3.2. Determination of Excreted and Absorbed Sweat
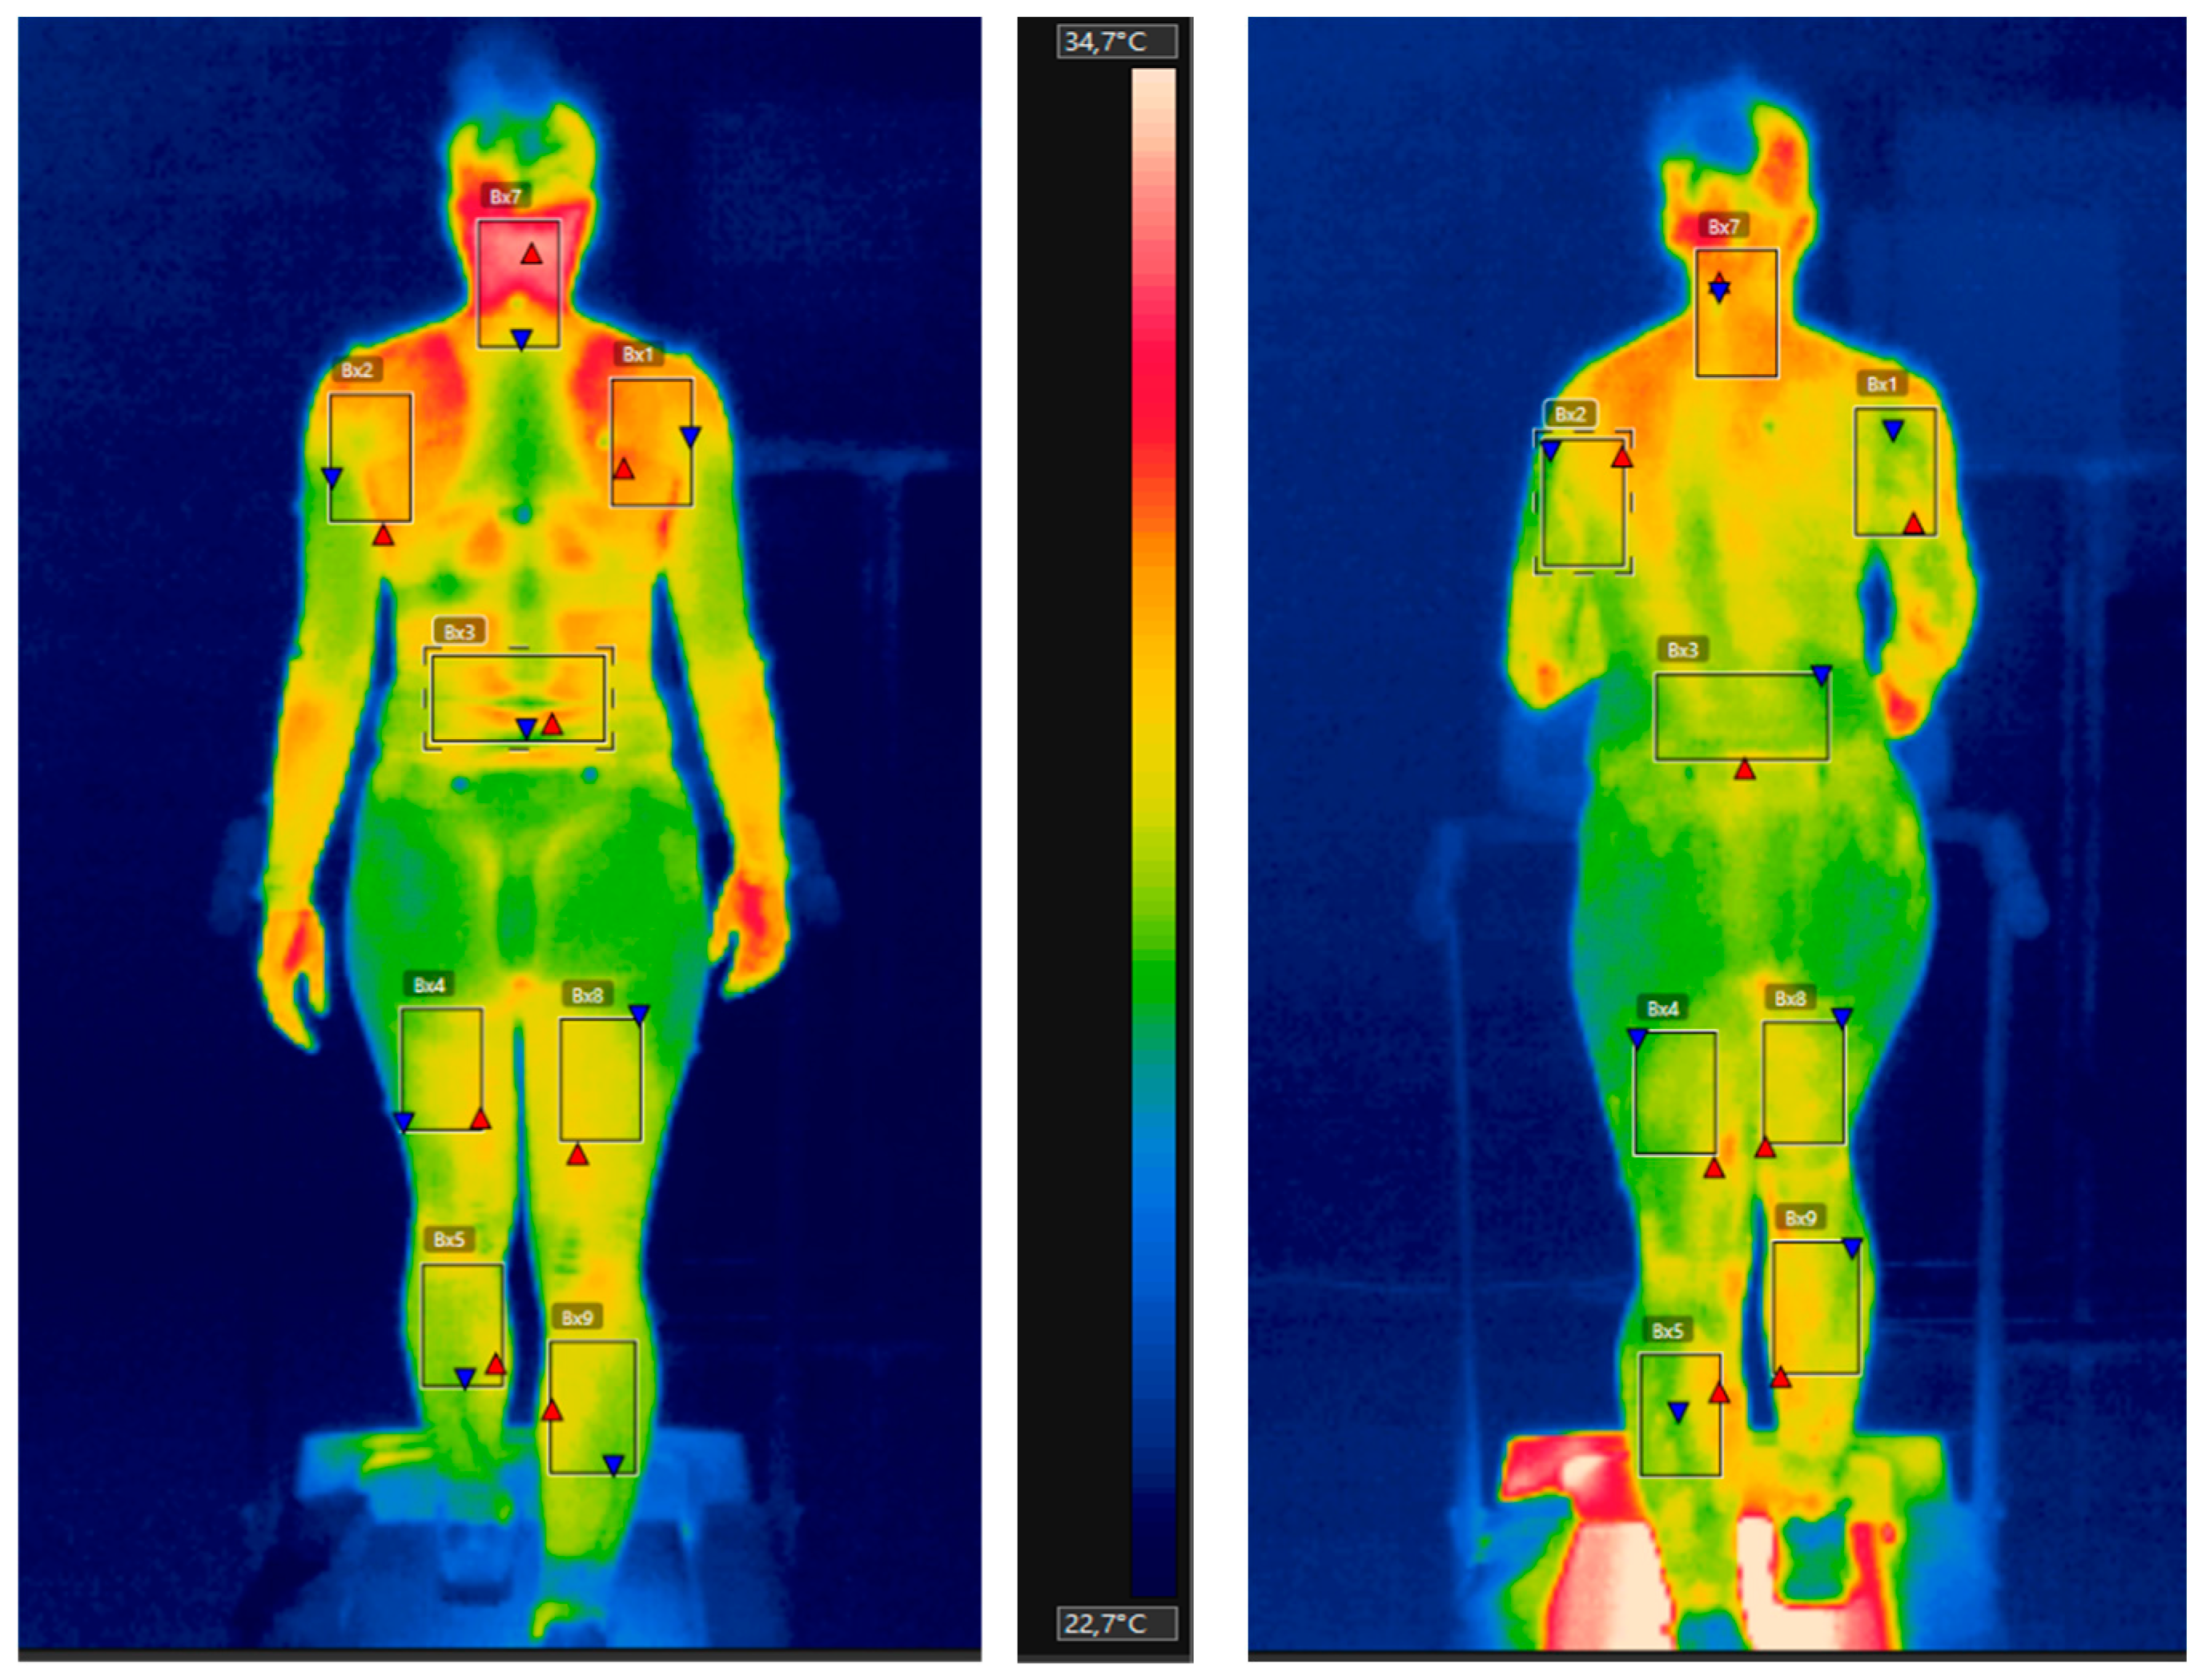
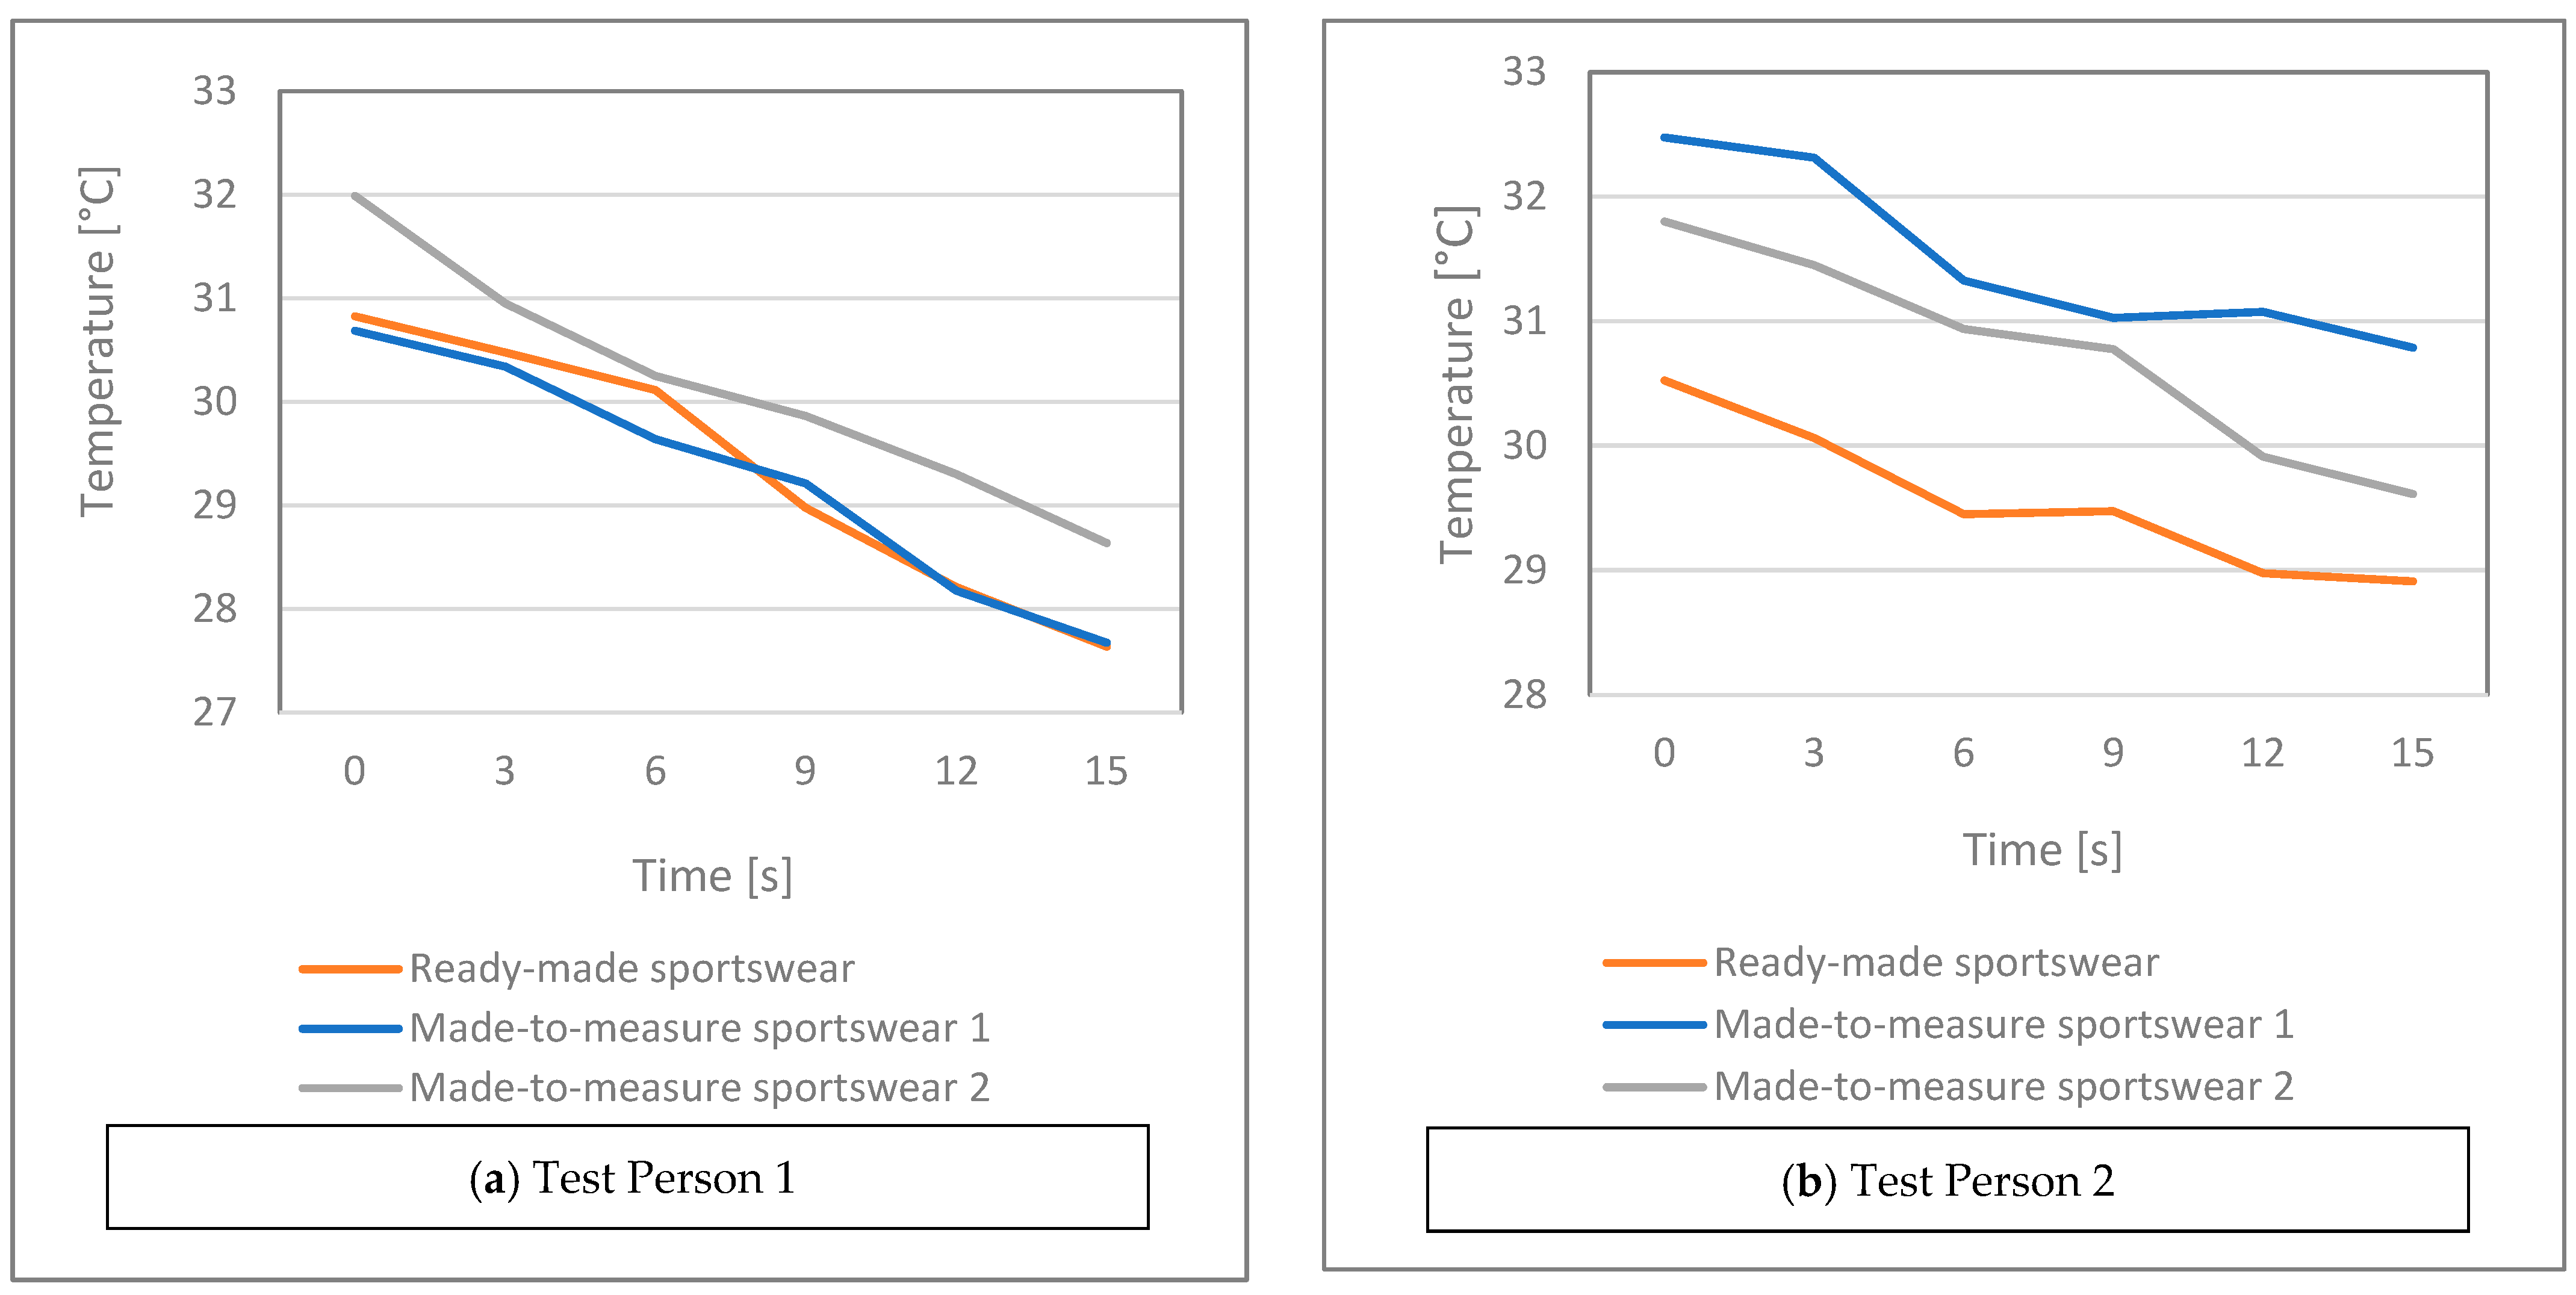
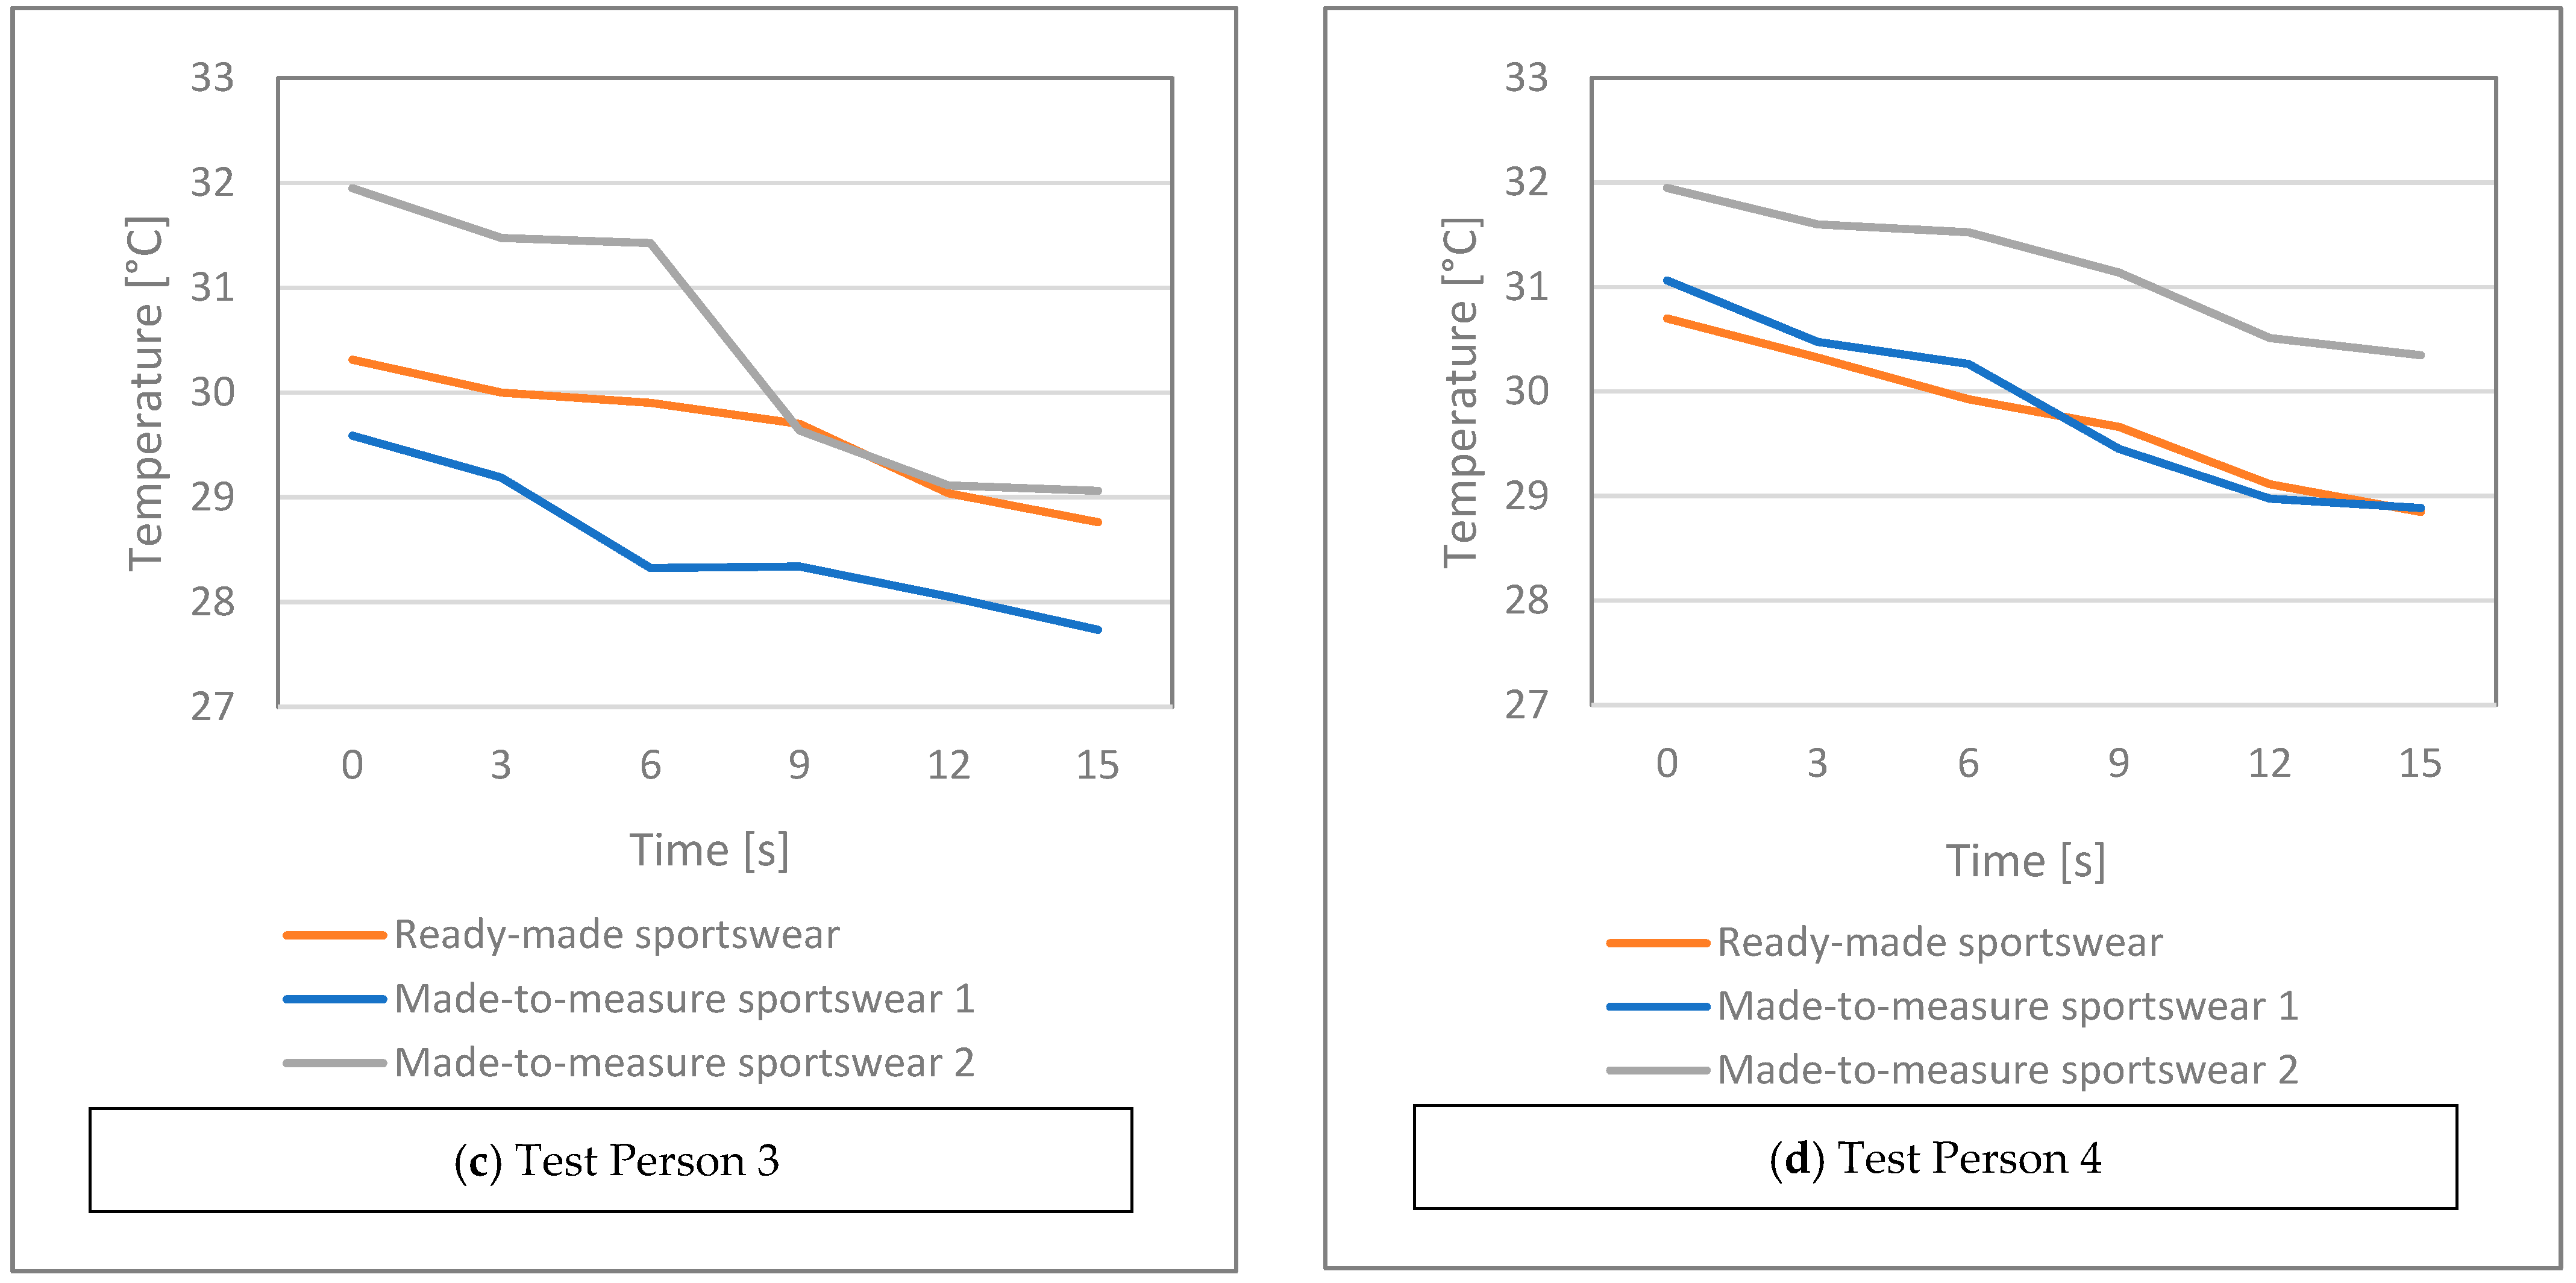
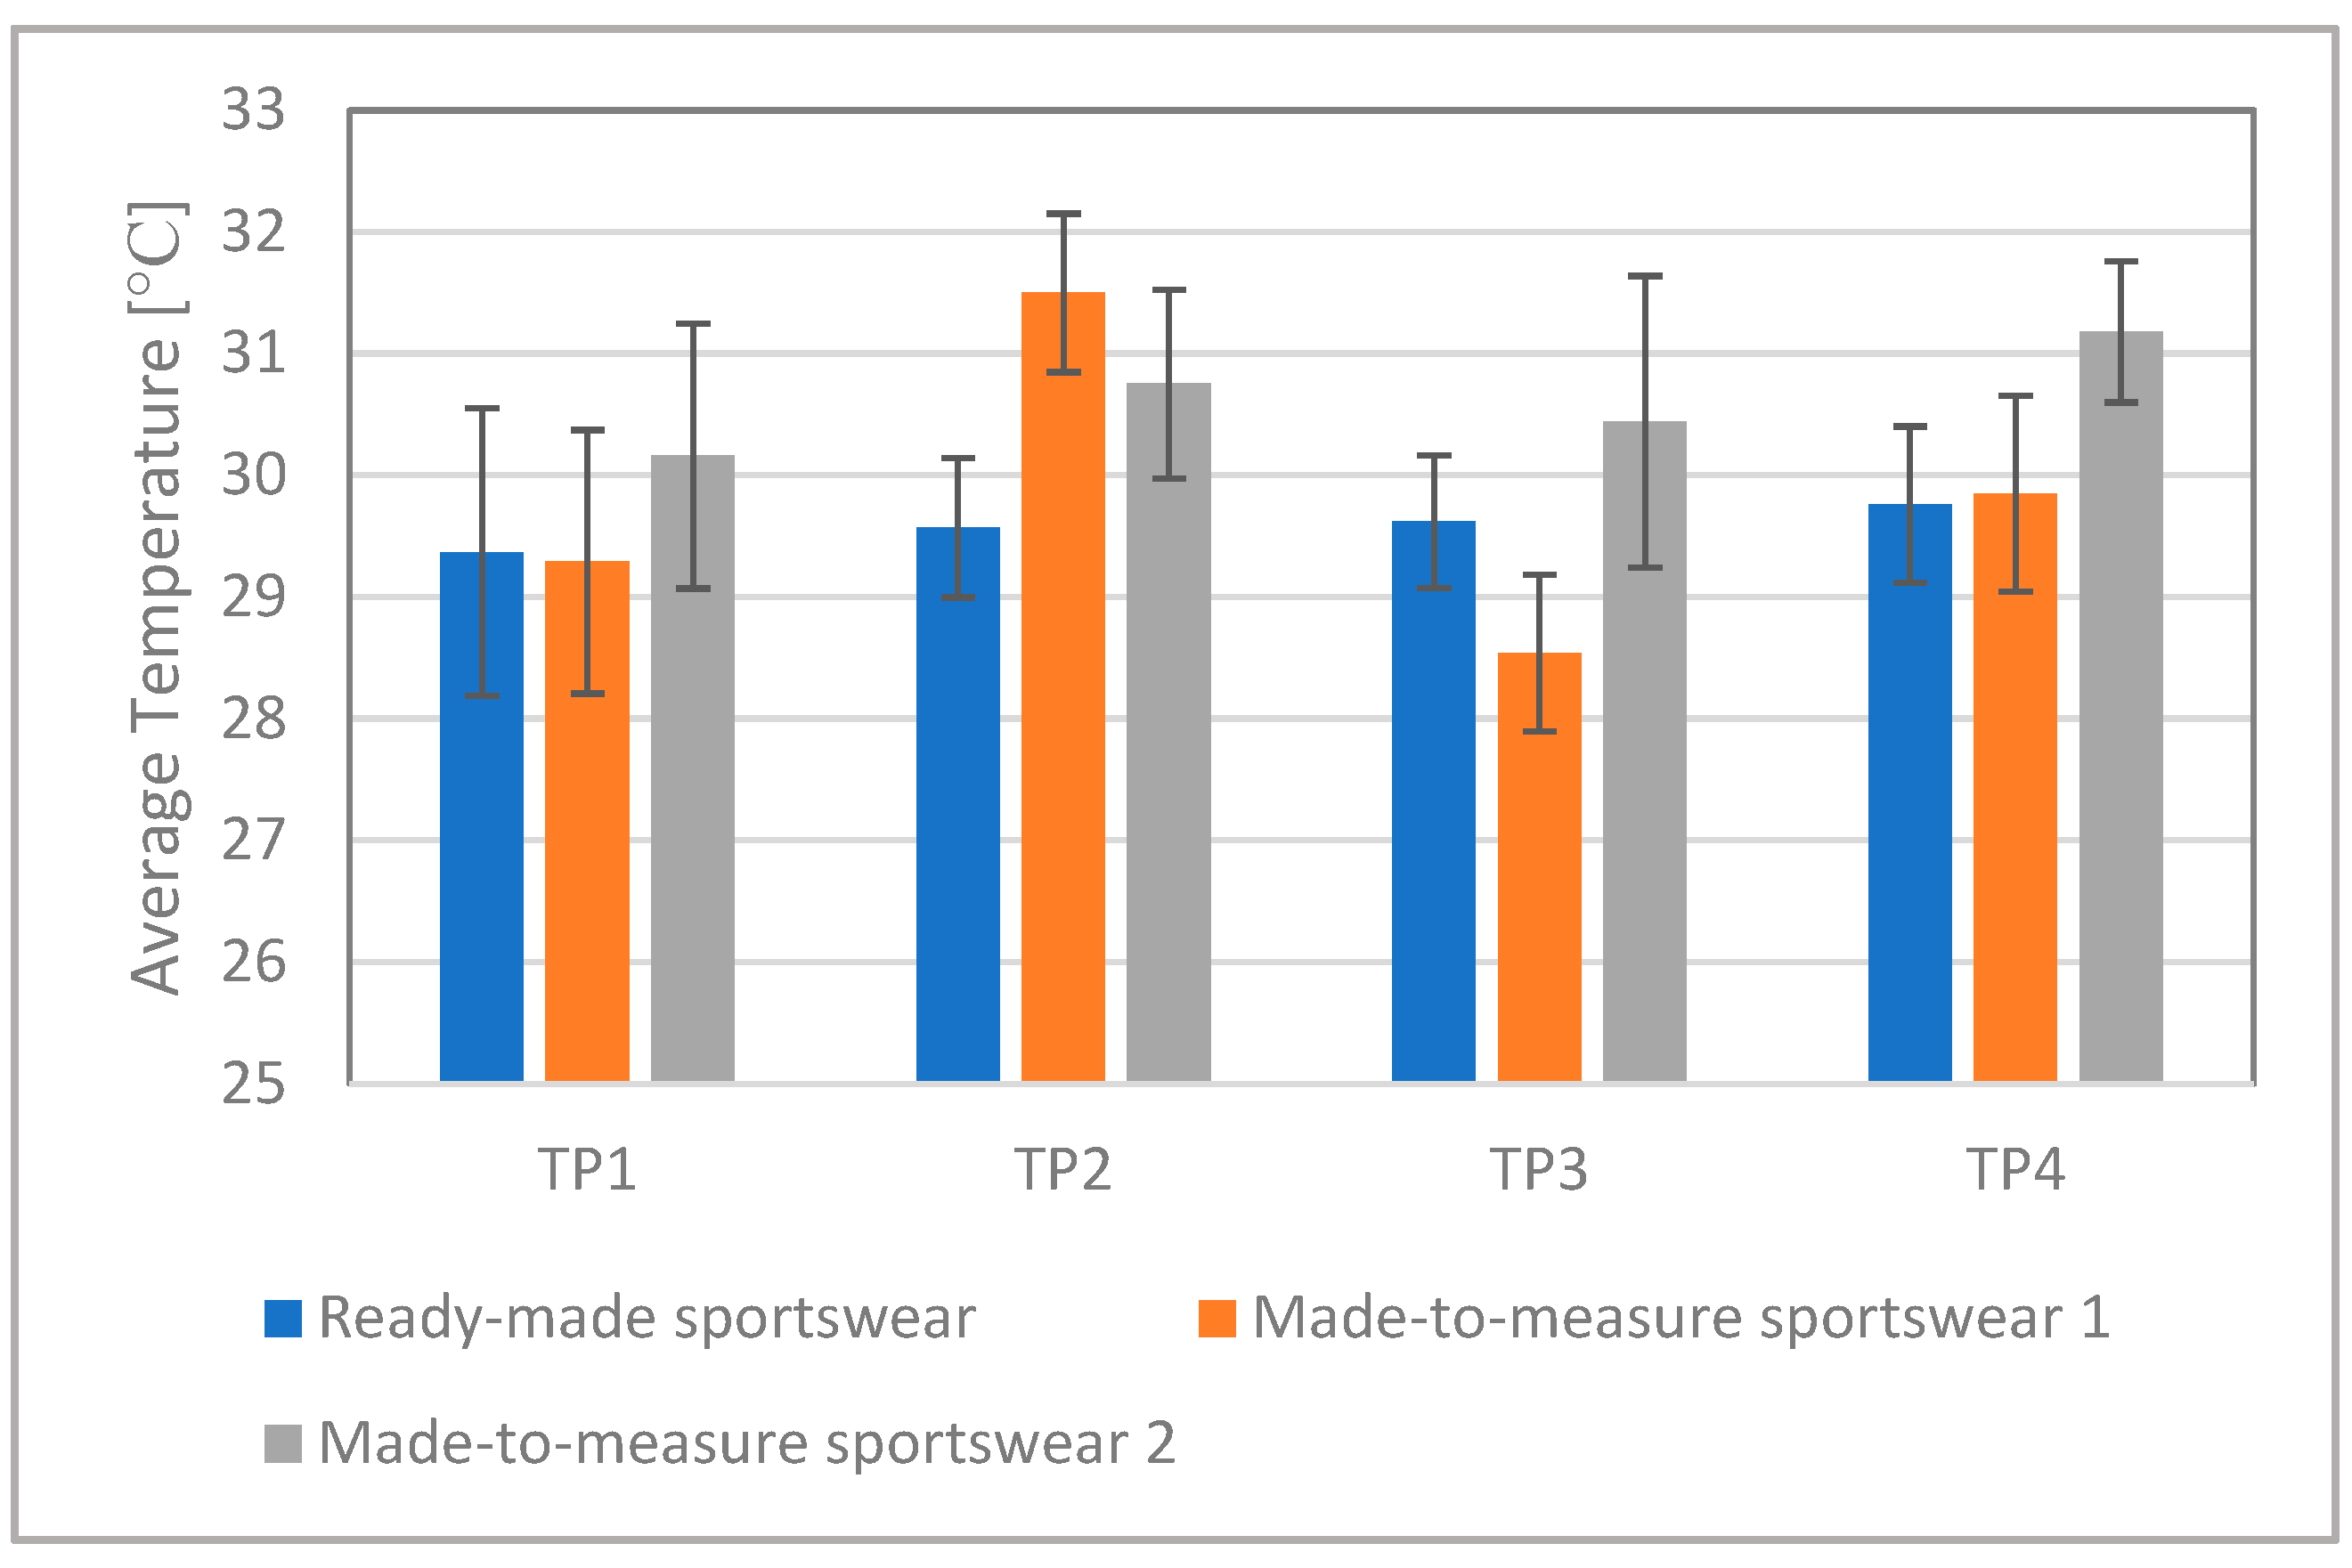
2.3.3. Thermal Imaging Analysis
3. Results and Discussion
4. Conclusions
Author Contributions
Funding
Institutional Review Board Statement
Informed Consent Statement
Data Availability Statement
Acknowledgments
Conflicts of Interest
Appendix A

| Person | TP1 | TP2 | ||||||
| Number of Points | Name of Points | Pressure (mmHg) | Name of Points | Pressure (mmHg) | ||||
| Ready-made | Made-to-Measure 1 | Made-to-Measure 2 | Ready-made | Made-to-Measure 1 | Made-to-Measure 2 | |||
| 1. | Right upper arm | 3 | 2 | 2 | Right upper arm | 2 | 2 | 3 |
| 2. | Left upper arm | 4 | 2 | 3 | Left upper arm | 2 | 2 | 4 |
| 3. | Ventral middle | 1 | 0 | 1 | Ventral middle | 2 | 1 | 2 |
| 4. | Right thigh front | 7 | 5 | 7 | Right thigh front | 4 | 5 | 7 |
| 5. | Left thigh front | 6 | 5 | 7 | Left thigh front | 4 | 4 | 6 |
| 6. | Right knee | 7 | 5 | 7 | Right knee | 5 | 6 | 6 |
| 7. | Left knee | 8 | 6 | 5 | Left knee | 5 | 5 | 7 |
| 8. | Right Scapula 1 | 2 | 1 | 3 | Right Scapula 1 | 3 | 2 | 3 |
| 9. | Right Scapula 2 | 5 | 2 | 5 | Right Scapula 2 | 3 | 3 | 4 |
| 10. | Left Scapula 1 | 3 | 0 | 3 | Left Scapula 1 | 2 | 1 | 4 |
| 11. | Left Scapula 2 | 6 | 5 | 7 | Left Scapula 2 | 4 | 2 | 5 |
| 12. | Right tight back | 14 | 11 | 6 | Right tight back | 5 | 5 | 7 |
| 13. | Left thigh back | 16 | 11 | 6 | Left thigh back | 6 | 4 | 8 |
| 14. | Right thigh side | 6 | 5 | 4 | Right thigh side | 5 | 4 | 5 |
| 15. | Left thigh side | 5 | 5 | 4 | Left thigh side | 4 | 3 | 5 |
| 16. | Right shank back | 18 | 5 | 9 | Right shank back | 16 | 9 | 13 |
| 17. | Left shank back | 17 | 4 | 9 | Left shank back | 14 | 8 | 13 |
| 18. | Right waist | 20 | 13 | 10 | Right waist | 14 | 8 | 12 |
| 19. | Left waist | 21 | 11 | 13 | Left waist | 13 | 9 | 10 |
| Average [mmHg]: | 8.89 | 5.16 | 5.84 | 5.95 | 4.37 | 6.53 | ||
| Stand. dev. [mmHg]: | 6.51 | 3.85 | 3.02 | 4.59 | 2.61 | 3.34 | ||
| Person | TP3 | TP4 | ||||||
| Number of Points | Name of Points | Pressure (mmHg) | Name of Points | Pressure (mmHg) | ||||
| Ready-made | Made-to-Measure 1 | Made-to-Measure 2 | Ready-made | Made-to-Measure 1 | Made-to-Measure 2 | |||
| 1. | Right upper arm | 4 | 2 | 2 | Right upper arm | 3 | 1 | 3 |
| 2. | Left upper arm | 4 | 2 | 4 | Left upper arm | 3 | 2 | 7 |
| 3. | Ventral middle | 2 | 2 | 2 | Ventral middle | 1 | 1 | 1 |
| 4. | Right thigh front | 5 | 5 | 6 | Right thigh front | 7 | 5 | 5 |
| 5. | Left thigh front | 6 | 6 | 6 | Left thigh front | 7 | 5 | 5 |
| 6. | Right knee | 7 | 5 | 8 | Right knee | 11 | 5 | 6 |
| 7. | Left knee | 7 | 5 | 9 | Left knee | 8 | 5 | 6 |
| 8. | Right Scapula 1 | 3 | 2 | 2 | Right Scapula 1 | 6 | 2 | 2 |
| 9. | Right Scapula 2 | 2 | 1 | 5 | Right Scapula 2 | 4 | 1 | 4 |
| 10. | Left Scapula 1 | 2 | 1 | 3 | Left Scapula 1 | 2 | 2 | 3 |
| 11. | Left Scapula 2 | 5 | 4 | 4 | Left Scapula 2 | 7 | 5 | 4 |
| 12. | Right tight back | 7 | 7 | 6 | Right tight back | 7 | 6 | 6 |
| 13. | Left thigh back | 10 | 9 | 7 | Left thigh back | 8 | 9 | 5 |
| 14. | Right thigh side | 4 | 2 | 5 | Right thigh side | 7 | 4 | 4 |
| 15. | Left thigh side | 3 | 2 | 5 | Left thigh side | 7 | 4 | 3 |
| 16. | Right shank back | 18 | 10 | 11 | Right shank back | 14 | 10 | 10 |
| 17. | Left shank back | 17 | 8 | 12 | Left shank back | 14 | 10 | 13 |
| 18. | Right waist | 15 | 7 | 13 | Right waist | 19 | 10 | 8 |
| 19. | Left waist | 18 | 9 | 11 | Left waist | 20 | 9 | 9 |
| Average [mmHg]: | 7.32 | 4.68 | 6.37 | 8.16 | 5.05 | 5.47 | ||
| Stand. dev. [mmHg]: | 5.56 | 2.98 | 3.45 | 5.30 | 3.21 | 2.95 | ||
References
- Shishoo, R. Textiles in Sports; The Textile Institute, Woodhead Publishing: Cambridge, UK, 2005. [Google Scholar]
- Shishoo, R. Textiles for Sportswear; The Textile Institute, Woodhead Publishing: Cambridge, UK, 2015. [Google Scholar]
- Hayes, S.G.; Venkatraman, P. Materials and Technology for Sportswear and Performance Apparel; CRC Press, Taylor & Francis Group: Boca Raton, FL, USA, 2016. [Google Scholar]
- Rödel, H.; Schenk, A.; Herzberg, C.; Krzywinski, S. Links between design, pattern development and fabric behaviours for clothes and technical textiles. Int. J. Cloth. Sci. Technol. 2001, 13, 217–227. [Google Scholar] [CrossRef]
- Venkatraman, P. Compression garments in sportswear: Case studies to explore the effect of body type, tactile sensation and seam position in garments. In Proceedings of the Indo-Czech International Conference on the Advancements in Speciality Textiles and their Applications in Material Engineering and Medical Sciences, Coimbatore, India, 29–30 April 2014; Kumaraguru College of Technology: Coimbatore, India, 2014; pp. 1–4. [Google Scholar] [CrossRef]
- Jariyapunya, N.; Musilová, B.; Geršak, J.; Baheti, S. The influence of stretch fabric mechanical properties on clothing pressure. Fibres Text. 2017, 24, 43–48. [Google Scholar]
- Kraemer, W.J.; Bush, J.A.; Newton, R.U.; Duncan, N.D.; Volek, J.S.; Denegar, C.R.; Canavan, P.; Johnston, J.; Putukian, M.; Sebastianelli, W.J. Influence of a Compression Garment on Repetitive Power Output Production Before and After Different Types of Muscle Fatigue. Res. Sports Med. 1998, 8, 163–184. [Google Scholar] [CrossRef]
- Doan, B.K.; Kwon, Y.-H.; Newton, R.U.; Shim, J.; Popper, J.E.; Rogers, R.; Bolt, L.; Robertson, M.; Kraemer, W.J. Evaluation of a Lower-Body Compression Garment. J. Sports Sci. 2003, 21, 601–610. [Google Scholar] [CrossRef]
- Ali, A.; Caine, M.P.; Snow, B.G. Graduated Compression Stockings: Physiological and Perceptual Responses During and After Exercise. J. Sports Sci. 2007, 25, 413–419. [Google Scholar] [CrossRef]
- Duffild, R.; Portus, M. Comparison of Three Types of Full-Body Compression Garments on Throwing and Repeat Sprint Performance in Cricket Players. Br. J. Sport Med. 2007, 41, 409–414. [Google Scholar] [CrossRef] [Green Version]
- Tanaka, S.; Midorikawa, T.; Tokura, H. Effects of pressure exerted on the skin by elastic cord on the core temperature, body weight loss and salivary secretion rate at 35 °C. Eur. J. Appl. Physiol. 2006, 96, 471–476. [Google Scholar] [CrossRef]
- Jin, Z.-M.; Yan, Y.-X.; Luo, X.-J.; Tao, J.-W. A Study on the Dynamic Pressure Comfort of Tight Seamless Sportswear. J. Fiber Bioeng. Inform. 2008, 1, 217–224. [Google Scholar] [CrossRef]
- MacRae, B.A.; Cotter, J.D.; Laing, R.M. Compression garments and exercise: Garment considerations, physiology and performance. Sports Med. 2011, 41, 815–843. [Google Scholar] [CrossRef]
- Ashayeri, E. An Investigation into Pressure Delivery by Sport Compression Garments and Their Physiological Comfort Properties. Master’s Thesis, RMIT University, Melbourne, Australia, 2012. Available online: https://researchbank.rmit.edu.au/eserv/rmit:161394/Ashayeri.pdf (accessed on 6 July 2018).
- Senthilkumar, M.; Kumar, L.A.; Anbumani, N. Design and Development of a Pressure Sensing Device for Analysing the Pressure Comfort of Elastic Garments. Fibres Text. East. Eur. 2012, 20, 64–69. Available online: http://www.fibtex.lodz.pl/article645.html (accessed on 20 November 2020).
- Beliard, S.; Chauveau, M.; Moscatiello, T.; Cros, F.; Ecarnot, F.; Becker, F. Compression Garments and Exercise: No Influence of Pressure Applied. J. Sports Sci. Med. 2015, 14, 75–83. Available online: https://www.ncbi.nlm.nih.gov/pmc/articles/PMC4306786/ (accessed on 20 November 2020).
- Umar, J.; Hussain, T.; Ali, Z.; Maqsood, M. Prediction Modeling of Compression Properties of a Knitted Sportswear Fabric Using Response Surface Method. Int. J. Mater. Metall. Eng. 2016, 10, 2019–2027. [Google Scholar] [CrossRef]
- Xiong, Y.; Tao, X. Compression Garments for Medical Therapy and Sports. Polymers 2018, 10, 663. [Google Scholar] [CrossRef] [Green Version]
- Cunnington, P.; Mansfield, A. English Costume for Sports and Outdoor Recreation—From the Sixteenth to the Nineteenth Centuries; Adam & Charles Black: London, UK, 1969. [Google Scholar]
- Tyler, M. The History of the Olympics; Marshall Cavendish: London, UK, 1975. [Google Scholar]
- Riordan, J.; Krüger, A. European Cultures in Sport; Intellect: Bristol, UK, 2003. [Google Scholar]
- Vadhera, N. Historical sketch of women’s participation in sports: An overview. Int. J. Yogic Hum. Mov. Sports Sci. 2018, 3, 417–422. Available online: http://www.theyogicjournal.com/pdf/2018/vol3issue2/PartG/3-2-70-822.pdf (accessed on 20 November 2020).
- Fanger, P.O. Thermal Comfort; Danish Technical Press: Copenhagen, Denmark, 1970. [Google Scholar]
- Mecheels, J. Körper—Klima—Kleidung; Schiele & Schön: Berlin, Germany, 1998. [Google Scholar]
- Tochihara, Y.; Ohnaka, T. Environmental Ergonomics—The Ergonomics of Human Comfort, Health, and Performance in the Thermal Environment; Elsevier: Amsterdam, The Netherlands, 2005. [Google Scholar]
- Magyar, Z. Possibilities of Application of Thermal Manikin in Thermal Comfort Tests. Ph.D. Thesis, Szent István University, Gödöllő, Hungary, 2011. [Google Scholar]
- Liu, Y.; Hu, H. Compression property and air permeability of weft-knitted spacer fabrics. J. Text. Inst. 2011, 102, 366–372. [Google Scholar] [CrossRef]
- Ramesh, B.V.; Ramakrishnan, G.; Subramanian, V.S.; Kantha, L. Analysis of Fabrics Structure on the Character of Wicking. J. Eng. Fibers Fabr. 2012, 7, 28–33. [Google Scholar] [CrossRef] [Green Version]
- Nagyné Szabó, O. Wear Comfort Improvement of Medical Aids Used for Spine Deformity Treatment. Ph.D. Thesis, University of West Hungary, Sopron, Hungary, 2014. Available online: http://doktori.nyme.hu/484/3/nagyne_szabo_orsolya_angoltezis.pdf (accessed on 20 November 2020).
- Fangueiro, R.; Filgueiras, A.; Soutinho, F.; Meidi, X. Wicking Behavior and Drying Capability of Functional Knitted Fabrics. Text. Res. J. 2010, 80, 1522–1530. [Google Scholar] [CrossRef] [Green Version]
- Chowdhury, P.; Samanta, K.K.; Basak, S. Recent Development in Textile for Sportswear Application. Int. J. Eng. Res. Technol. 2014, 3, 1905–1910. [Google Scholar]
- Stojanović, S.; Geršak, J. Textile materials intended for sportswear. Tekstil 2019, 68, 72–88. Available online: https://hrcak.srce.hr/250867 (accessed on 20 November 2020).
- Engel, F.; Stockinger, C.; Wall, A.; Sperlich, B. Effects of Compression Garments on Performance and Recovery in Endurance Athletes. In Compression Garments in Sports: Athletic Performance and Recovery, 1st ed.; Engel, F., Sperlich, B., Eds.; Springer: Cham, Switzerland, 2016; pp. 33–61. [Google Scholar] [CrossRef]
- Pérez-Soriano, P.; García-Roig, Á.; Sanchis-Sanchis, R.; Aparicio, I. Influence of compression sportswear on recovery and performance: A systematic review. J. Ind. Text. 2019, 48, 1505–1524. [Google Scholar] [CrossRef]
- Lovell, D.I.; Mason, D.G.; Delphinus, E.M.; McLellan, C.P. Do Compression Garments Enhance the Active Recovery Process after High-Intensity Running? J. Strength Cond. Res. 2011, 25, 3264–3268. [Google Scholar] [CrossRef]
- Pálya, Z.; Kiss, R.M. Biomechanical analysis of the effect of compression sportswear on running. Mater. Today-Proc. 2020, 32, 133–138. [Google Scholar] [CrossRef]


| Designation | Test Persons | |||
|---|---|---|---|---|
| TP1 | TP2 | TP3 | TP4 | |
| Age (years) | 23 | 23 | 18 | 24 |
| Body mass (kg) | 59.32 | 66.88 | 65.25 | 70.60 |
| Body height (cm) | 166 | 169 | 171 | 171 |
| Chest girth (cm) | 96 | 95 | 92 | 94 |
| Waist girth (cm) | 73 | 70 | 71 | 77 |
| Hip girth (cm) | 97 | 104 | 99 | 111 |
| Thigh girth (cm) | 55 | 58 | 57 | 64 |
| Lower leg/calf/girth (cm) | 35.5 | 39 | 38.5 | 40.5 |
| Inside leg length (cm) | 78 | 76.5 | 77 | 79 |
| Dress size upper | S | S | S | M |
| Dress size pants | S | M | M | M |
| Designation | Description | Composition of the Weft-Knitted Fabrics | |||
|---|---|---|---|---|---|
| Long-Sleeved T-Shirt | Pants | ||||
| Ready-made Sportswear | Ready-made sportswear | KF1 | 80% Polyester 20% Elastane | KF2 | 74% Polyester 26% Elastane |
| Made-to-measure Sportswear 1 | Made-to-measure sportswear with 1% body size reduced | KF3 | 74% Polyamide 26% Elastane | KF3 | 74% Polyamide 26% Elastane |
| Made-to-measure Sportswear 2 | Made-to-measure sportswear with 5% body size reduced | KF3 | 74% Polyamide 26% Elastane | KF3 | 74% Polyamide 26% Elastane |
| Code of Knitted Fabric | Mass (g/m2) | Thickness (mm) | Course Density (Piece/10 mm) | Wale Density (Piece/10 mm) | Air Permeability (L/m2·s) | Moisture Content (%) | Immersion Water Absorption (%) | Dry Heat Flow (W) | Thermal Resistance Rct (m·2K/W) | Force at 5% Elongation * (N/m) |
|---|---|---|---|---|---|---|---|---|---|---|
| KF1 | 194.1 ± 1.5 | 0.397 ± 0.005 | 30 | 22 | 388.6 ± 7.2 | 3.15 ± 0.27 | 69.0 ± 2.38 | 2.07 ± 0.09 | 0.0719 | 7.44 ± 0.14 |
| KF2 | 279.1 ± 5.3 | 0.497 ± 0.012 | 25 | 22 | 427.2 ± 25.9 | 1.35 ± 0.02 | 45.6 ± 0.85 | 2.01 ± 0.04 | 0.0636 | 10.36 ± 0.39 |
| KF3 | 206.2 ± 0.3 | 0.356 ± 0.003 | 28 | 24 | 133.0 ± 5.3 | 2.93 ± 0.15 | 82.2 ± 1.64 | 2.13 ± 0.12 | 0.0721 | 12.35 ± 0.21 |
| Examined Sportswear | Body Part | Average Pressure (mmHg) | |||
|---|---|---|---|---|---|
| TP 1 | TP 2 | TP 3 | TP 4 | ||
| Ready-made Sportswear | upper | 03.43 ±1.72 | 2.57 ± 0.79 | 3.14 ± 1.21 | 03.72 ± 2.14 |
| lower | 12.08 ±6.13 | 7.92 ± 4.76 | 9.75 ± 5.67 | 10.75 ± 4.86 | |
| Made-to-measure Sportswear 1 | upper | 1.72 ± 1.70 | 1.86 ± 0.69 | 2.00 ± 1.00 | 2.00 ± 1.41 |
| lower | 6.17 ± 3.27 | 5.83 ± 2.12 | 6.25 ± 2.60 | 6.83 ± 2.52 | |
| Made-to-measure Sportswear 2 | upper | 3.43 ± 1.99 | 3.57 ± 0.98 | 3.14 ± 1.21 | 3.43 ± 1.90 |
| lower | 7.25 ± 2.63 | 8.25 ± 2.99 | 8.25 ± 2.86 | 7.67 ± 2.84 | |
Publisher’s Note: MDPI stays neutral with regard to jurisdictional claims in published maps and institutional affiliations. |
© 2021 by the authors. Licensee MDPI, Basel, Switzerland. This article is an open access article distributed under the terms and conditions of the Creative Commons Attribution (CC BY) license (https://creativecommons.org/licenses/by/4.0/).
Share and Cite
Halász, M.; Geršak, J.; Bakonyi, P.; Oroszlány, G.; Koleszár, A.; Nagyné Szabó, O. Study on the Compression Effect of Clothing on the Physiological Response of the Athlete. Materials 2022, 15, 169. https://doi.org/10.3390/ma15010169
Halász M, Geršak J, Bakonyi P, Oroszlány G, Koleszár A, Nagyné Szabó O. Study on the Compression Effect of Clothing on the Physiological Response of the Athlete. Materials. 2022; 15(1):169. https://doi.org/10.3390/ma15010169
Chicago/Turabian StyleHalász, Marianna, Jelka Geršak, Péter Bakonyi, Gabriella Oroszlány, András Koleszár, and Orsolya Nagyné Szabó. 2022. "Study on the Compression Effect of Clothing on the Physiological Response of the Athlete" Materials 15, no. 1: 169. https://doi.org/10.3390/ma15010169
APA StyleHalász, M., Geršak, J., Bakonyi, P., Oroszlány, G., Koleszár, A., & Nagyné Szabó, O. (2022). Study on the Compression Effect of Clothing on the Physiological Response of the Athlete. Materials, 15(1), 169. https://doi.org/10.3390/ma15010169