Article

Effect of Clinker Binder and Aggregates on Autogenous Healing in Post-Crack Flexural Behavior of Concrete Members

1
Department of Civil and Environmental System Engineering, Sungkyunkwan University, 2066 Seobu-ro, Jangan-gu, Suwon-si 16419, Gyeonggi-do, Korea
2
Department of Civil and Environmental Engineering, Gachon University, 1342 Seongnamdae-ro, Sujeong-gu, Seongnam-si 13120, Gyeonggi-do, Korea
3
Construction Technology Research Center, Korea Conformity Laboratories, 199 Gasan digital 1-ro, Geumcheon-gu, Seoul 08503, Korea
4
Department of Energy Engineering, Konkuk University, 120 Neungdong-ro, Gwangjin-gu, Seoul 05029, Korea
*
Authors to whom correspondence should be addressed.
Materials 2020, 13(20), 4516; https://doi.org/10.3390/ma13204516
Submission received: 16 September 2020 / Revised: 2 October 2020 / Accepted: 9 October 2020 / Published: 12 October 2020
(This article belongs to the Special Issue Sustainable Construction Materials: From Paste to Concrete)

Abstract

:
Crack healing has been studied extensively to protect reinforced concrete structures from the ingress of harmful ions. Research examining the regain in the mechanical properties of self-healing composites has focused mostly on the computation of the healing ratio based on the measurement of the tensile and compressive strengths but with poor regard for the flexural performance. However, the regain in the flexural performance should also be investigated for design purposes. The present study performs flexural testing on reinforced concrete members using crushed clinker binder and aggregates as well as crystalline admixtures as healing agents. Healing ratios of 100% for crack widths smaller than 200 μm and 85% to 90% for crack widths of 250 μm were observed according to the admixing of clinker binder and aggregates. Water flow test showed that the members replacing binder by 100% of clinker achieved the best crack healing performance. The crack healing property of concrete improved to some extent the rebar yield load, the members’ ultimate load and energy absorption capacity and ductility index. The crack distribution density from the observed crack patterns confirmed the crack healing effect provided by clinker powder. The fine grain size of clinker made it possible to replace fine aggregates and longer healing time increased the crack healing effect.

1. Introduction

Reinforced concrete can deteriorate due to a variety of reasons among which the corrosion of reinforcing steel is a leading cause. Reinforced steel corrodes due to the ingress of harmful ions like chlorides and sulfates. Once steel starts to corrode, the resulting rust occupies a larger volume, which creates tensile stresses in concrete and eventually leads to cracking, delamination and spalling of concrete. In turn, such cracking of concrete accelerates the penetration of harmful ions that worsens the degradation of the reinforced concrete structure [1]. Implementing repair of concrete cracking in due time is thus fundamental in extending the lifespan of the structure. However, apart from being costly and labor-intensive, manual repair is often inaccessible in offshore and underground concrete structures, which are likely to experience aggravated degradation and a shortened lifespan.
The restless search for durability and resilience of concrete structures has led some researchers to focus on self-healing concrete composites with the built-in ability of repairing narrow cracks without human or external intervention [2,3,4,5]. Two major types of self-healing concretes have emerged: the autogenous type [4], which is achieved by autogenous healing materials such as mineral admixtures like ground-granulated blast-furnace slag (GGBFS), silica fume or fly ash, fibers and nanofillers [6,7,8,9,10,11,12]; and, the autonomous type [3], which is realized by unconventional engineered additions such as shape memory alloys, capsules, polymers or bacteria to seal the cracks [13,14,15,16,17,18,19,20,21,22,23,24]. Autogenous healing is an old and well-known phenomenon that originates naturally from the cementitious material like the hydration of clinker minerals or the carbonation of calcium hydroxide while autonomous healing requires a trigger to activate the process. Both types have been proven to restore the mechanical properties and durability of the concrete structure to some extent but are believed to be only capable of repairing cracks within a few hundreds of micrometers, meaning structural damage cannot be repaired. To date, the autonomous healing method has shown better performance in healing cracks than most of the autogenous healing methods which have been seen to heal cracks with widths narrower than 150 μm [5].
Most studies assessing the self-healing performance of concrete have focused on the recovery of durability through the evaluation of the crack filling ratio and the reduction of penetration [25,26]. The methods usually adopted are chloride permeability test, water permeability test, isothermal calorimetry, crack closing test, etc. [12,25]. However, as pointed out by Guo and Chidiac [27], self-healing of concrete is made up of two concurrent concepts: self-sealing of cracks, which requires plugging of openings for durability, and self-healing of cracks, which refers to recovery of mechanical properties for strength. Therefore, some studies also conducted tensile and compressive strength tests, flexural and ultrasonic pulse velocity tests, etc. to assess the recovery of mechanical properties. When it comes to flexure, studies on self-healing concrete focus mainly on crack repair rather than mechanical performance. It is also noteworthy that the regain in mechanical properties may become meaningless if the repaired crack is weaker than the concrete matrix, subsequent cracks may develop at the same location when the healing agent is exhausted [2,27].
Considering the lifespan of the concrete structure and to be free of the exhaustion of the healing agent, this study pays attention to the autogenous healing. A recent study showed that the autogenous healing could be enhanced using GGBFS and crystalline admixture rather than using fly ash [28]. The results of this work confirmed that concretes incorporating supplementary cementitious materials like GGBFS can develop superior self-healing properties owing to the significant amount of unhydrated particles present in its microstructures as well as improved mechanical and permeation properties when stressed by mechanical loads [29]. On the other hand, another study investigated the proper distribution of cement particle sizes providing a suitable amount of Ca(OH)2 and unhydrated cement to improve the self-healing ability of concrete [30]. Moreover, Berger [31] and Allahverdi [32] reported that the use of cement clinker aggregates significantly improves the concrete properties like the compressive strength, chloride penetration depth and water absorption. Besides, the phases present in the cement clinker binder are known to yield a strong solid with low porosity and offer protection to chloride ingress.
Accordingly, this study examines the autogenous healing of concrete containing clinker binder and aggregates as well as crystalline admixtures as healing agents. Crack healing effect is investigated through crack closing and water flow tests. In addition, even if the flexural behavior depends to a large extent on the steel reinforcement, bending tests are conducted on full-scale test members to investigate any eventual recovery in the flexural mechanical performance brought by the autogenous healing. For the tests, three different concrete mixes and four different loading and curing conditions were chosen as test variables. Cracking was induced by pre-loading the specimens at 28 days. The concrete mixes differ by the maximum particle size of the clinker powder replacing the binder and the aggregates. The curing conditions are air-dry curing for 28 days and additional water curing for 90 days. The loading conditions consider pre-loading and loading at 28 days, pre-loading at 28 days and loading at 28 + 90 days.

2. Experimental Methods

2.1. Material Test of Mortar

The first stage of the investigation started with material test on the mortar mixes to be used later in the fabrication of the concrete specimens. Table 1 presents the chemical composition of the raw materials. The grain size analysis of ground granulated blast-furnace slag (GGBFS) revealed grain sizes between 0.011 and 58.953 μm with an average of 10 μm (Figure 1). The grain distribution and chemical composition of GGBFS and clinker appeared to present no significant difference. Table 2 arranges the mix proportions of the 3 series of mortar considered in this study. Plain series is the control series with mortar made of ordinary Portland cement (OPC) and sand. Series 2.5 and 0.85 correspond to mortars with clinker binder and aggregates in which clinker was crushed to have particle sizes of 2.5 mm and 0.85 mm for replacing sand and cement, respectively. A water-to-binder ratio of 0.4 was used in all the mixes.
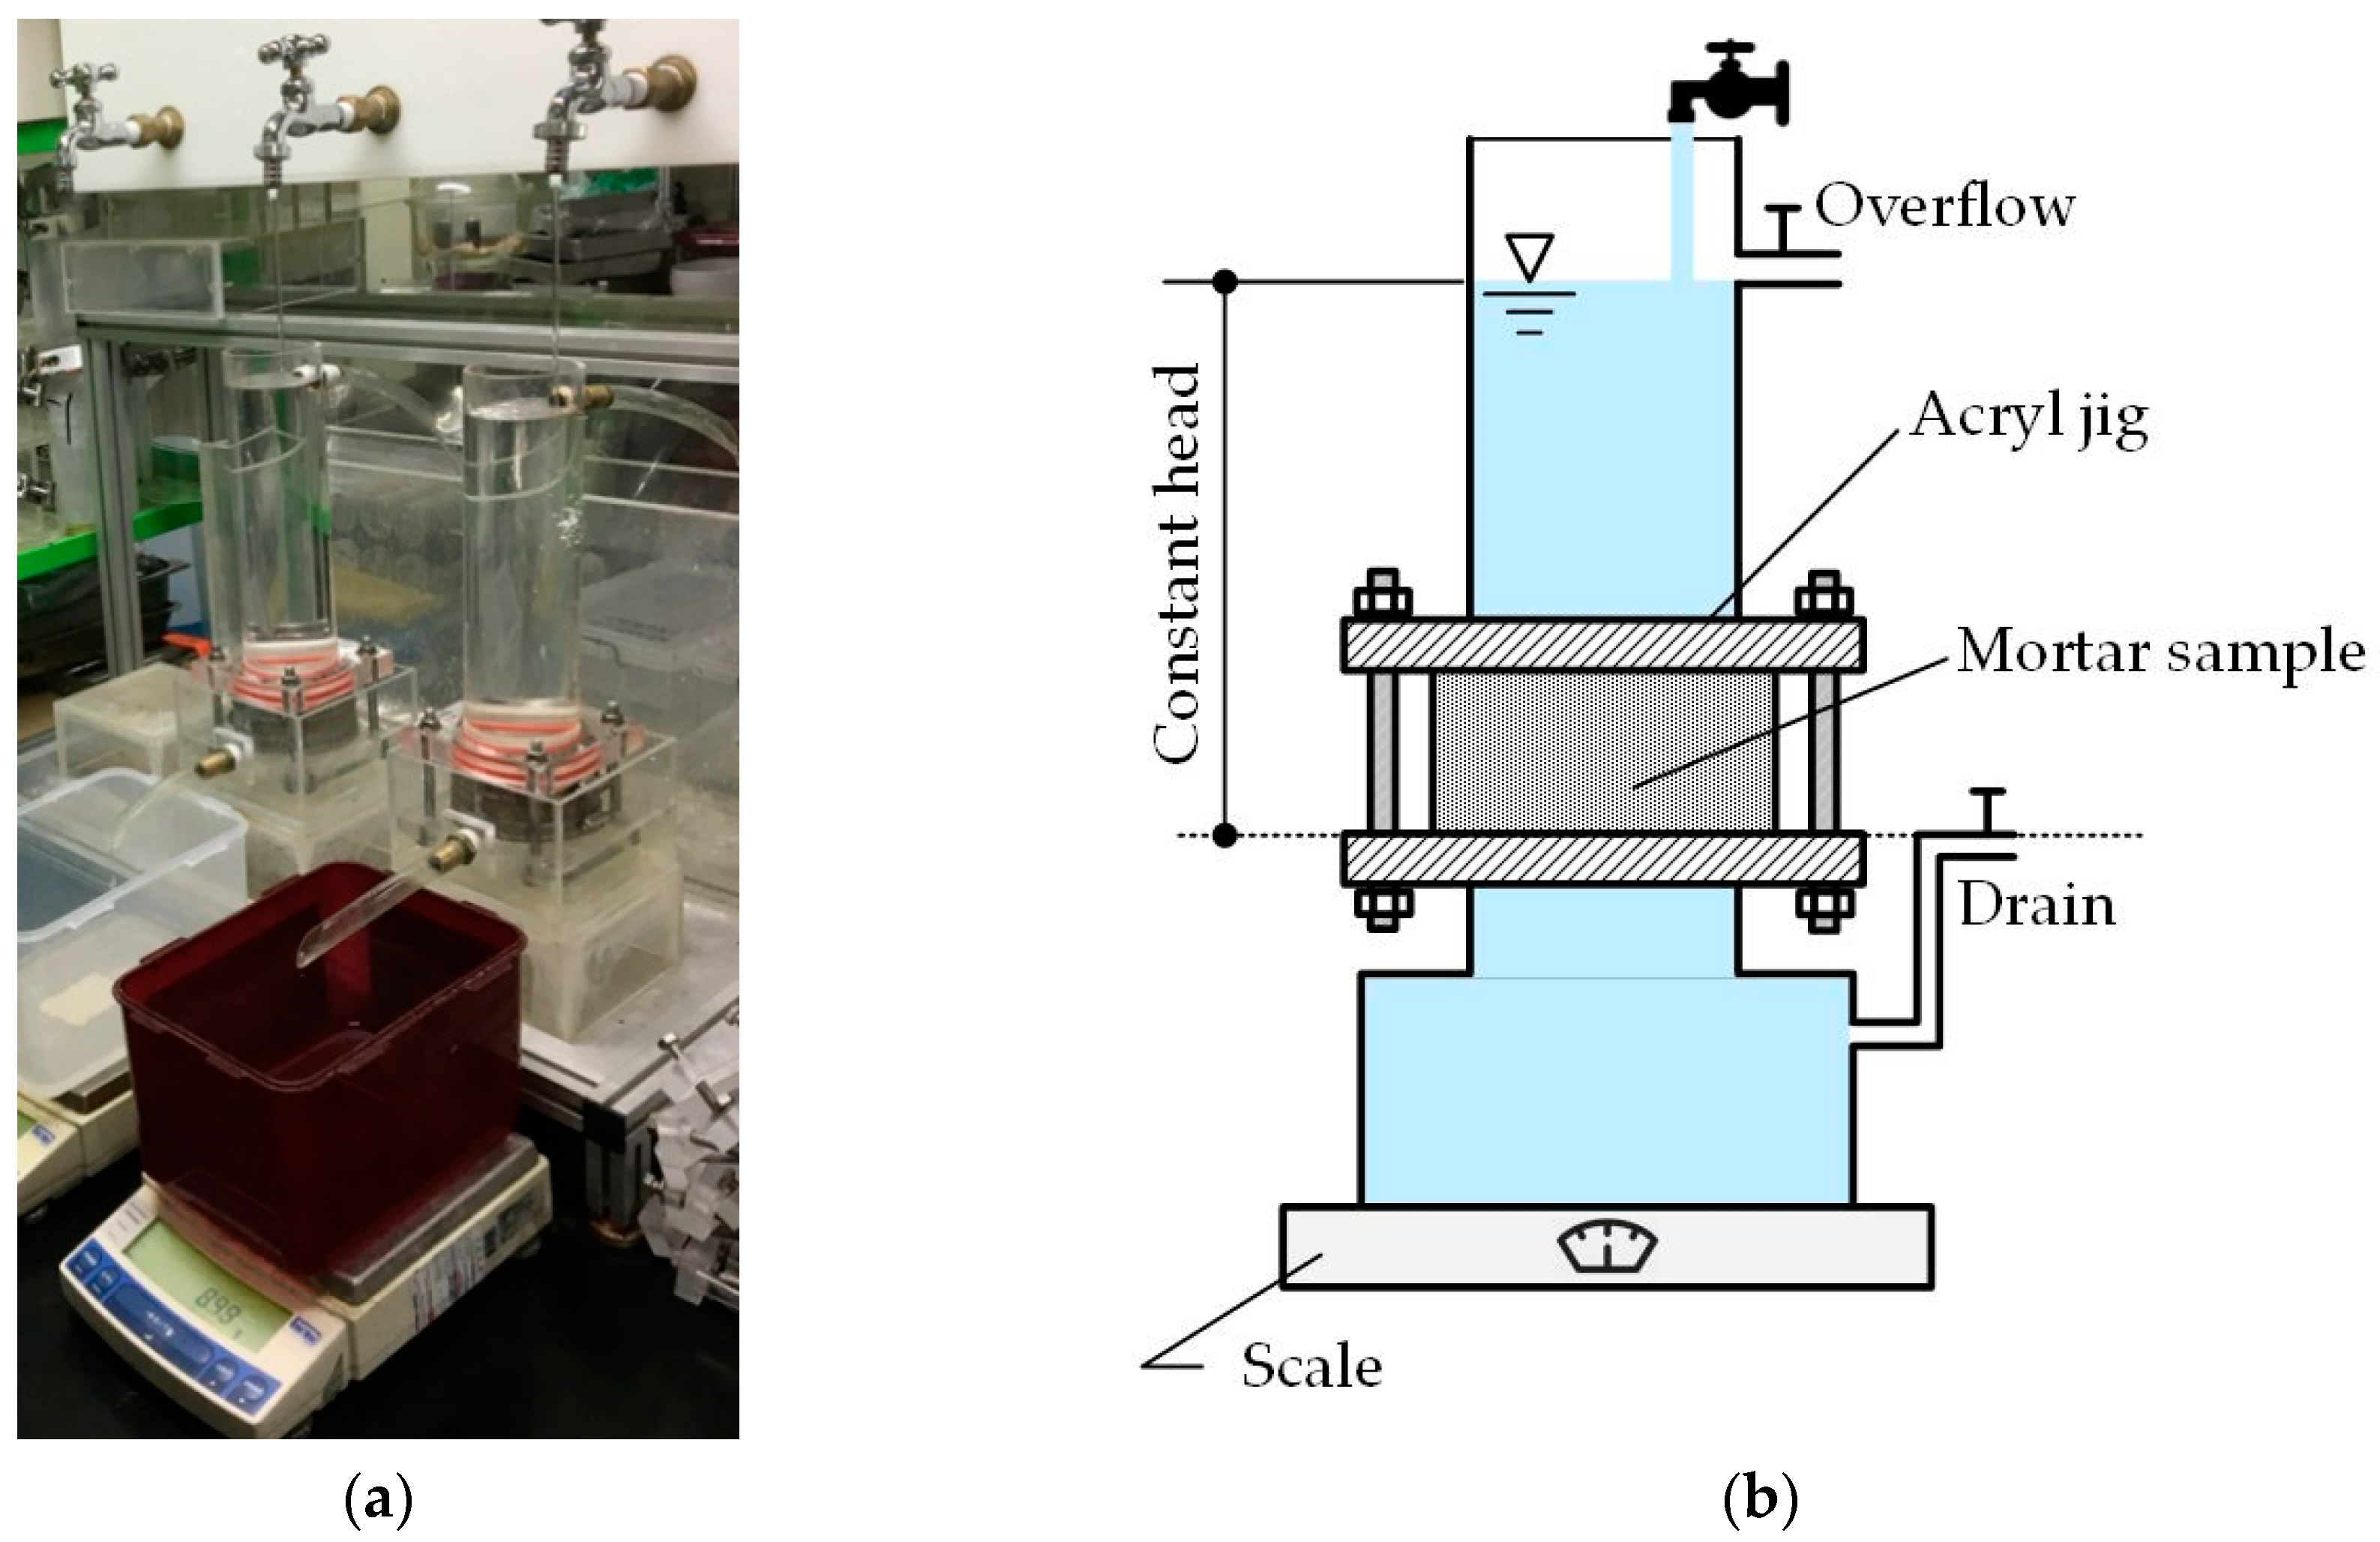
The self-healing performance of pre-cracked mortar specimens was assessed by constant head water flow test (Figure 2) on sets of three ϕ100 × 50 mm cylinders fabricated for each considered mix proportions. The fabricated specimens were stored for 1 day in a constant temperature and humidity chamber at temperature of 20 ± 1 °C and relative humidity of 100% prior to water curing for 27 days at 20 ± 1 °C. Regular cracking was induced by splitting test on the specimens notched in both ends. The crack width was adjusted to 0.25 mm and 0.30 mm by disposing silicon sheets on both ends of the specimens. The cylinders were installed in an acryl mold to fix them during the water flow test. The experimental setup follows the method proposed by Choi et al. [33], which is based on the work of Lepech and Li [34].

2.2. Material Test of Concrete

Table 3 summarizes the mix proportions of concrete using the 3 different types of mortar of this study. As mentioned above, two different sizes of clinker powder were considered to replace cement and sand. Among the ingredients, 0.85 stands for clinker binder (particle size < 0.85 mm) and 2.5 for clinker aggregate (grain size < 2.5 mm). SP represents superplasticizer of which the proportion corresponds to 1.5 weight percent.

2.3. Test for Fexural Behavior

2.3.1. Test Variables

The three different concrete mixes listed in Table 3 and four different loading and curing conditions were chosen as test variables. The concrete mixes differ by the maximum particle size of the clinker powder replacing the binder and the aggregates: the mix with particle size of 0.85 mm for the clinker replacing aggregates; the mix with 50% of 0.85-mm clinker and 50% of 2.5-mm clinker replacing binder and aggregates; and, the plain series (control). The four loading and curing conditions are:
  • V_28D series for the members at 28 days loaded until the ultimate state;
  • PLRL_28D series for the members pre-loaded up to 50% of the ultimate load at 28 days followed by loading until the ultimate state;
  • RL_28 + 90D series for the members pre-loaded up to 50% of the ultimate load at 28 days, followed by 90 days of water curing prior to loading until the ultimate state;
  • V_28 + 90D series for the members loaded up to the ultimate load after 28 days and after 28 + 90 days.
The combination of these test variables gives a total of 12 test members. The members were fabricated with the mixes presented in Table 3 and were subjected to air-dry curing until 28 days. Table 4 arranges the designation and features of the test members. Note that this additional period of 90 days was decided following the work of Alyousif [35], which stated that engineered cementitious composite beams exhibit strength recovery after 90 days of extended moist curing regardless of their size.

2.3.2. Fabrication of Test Members and Test Setup

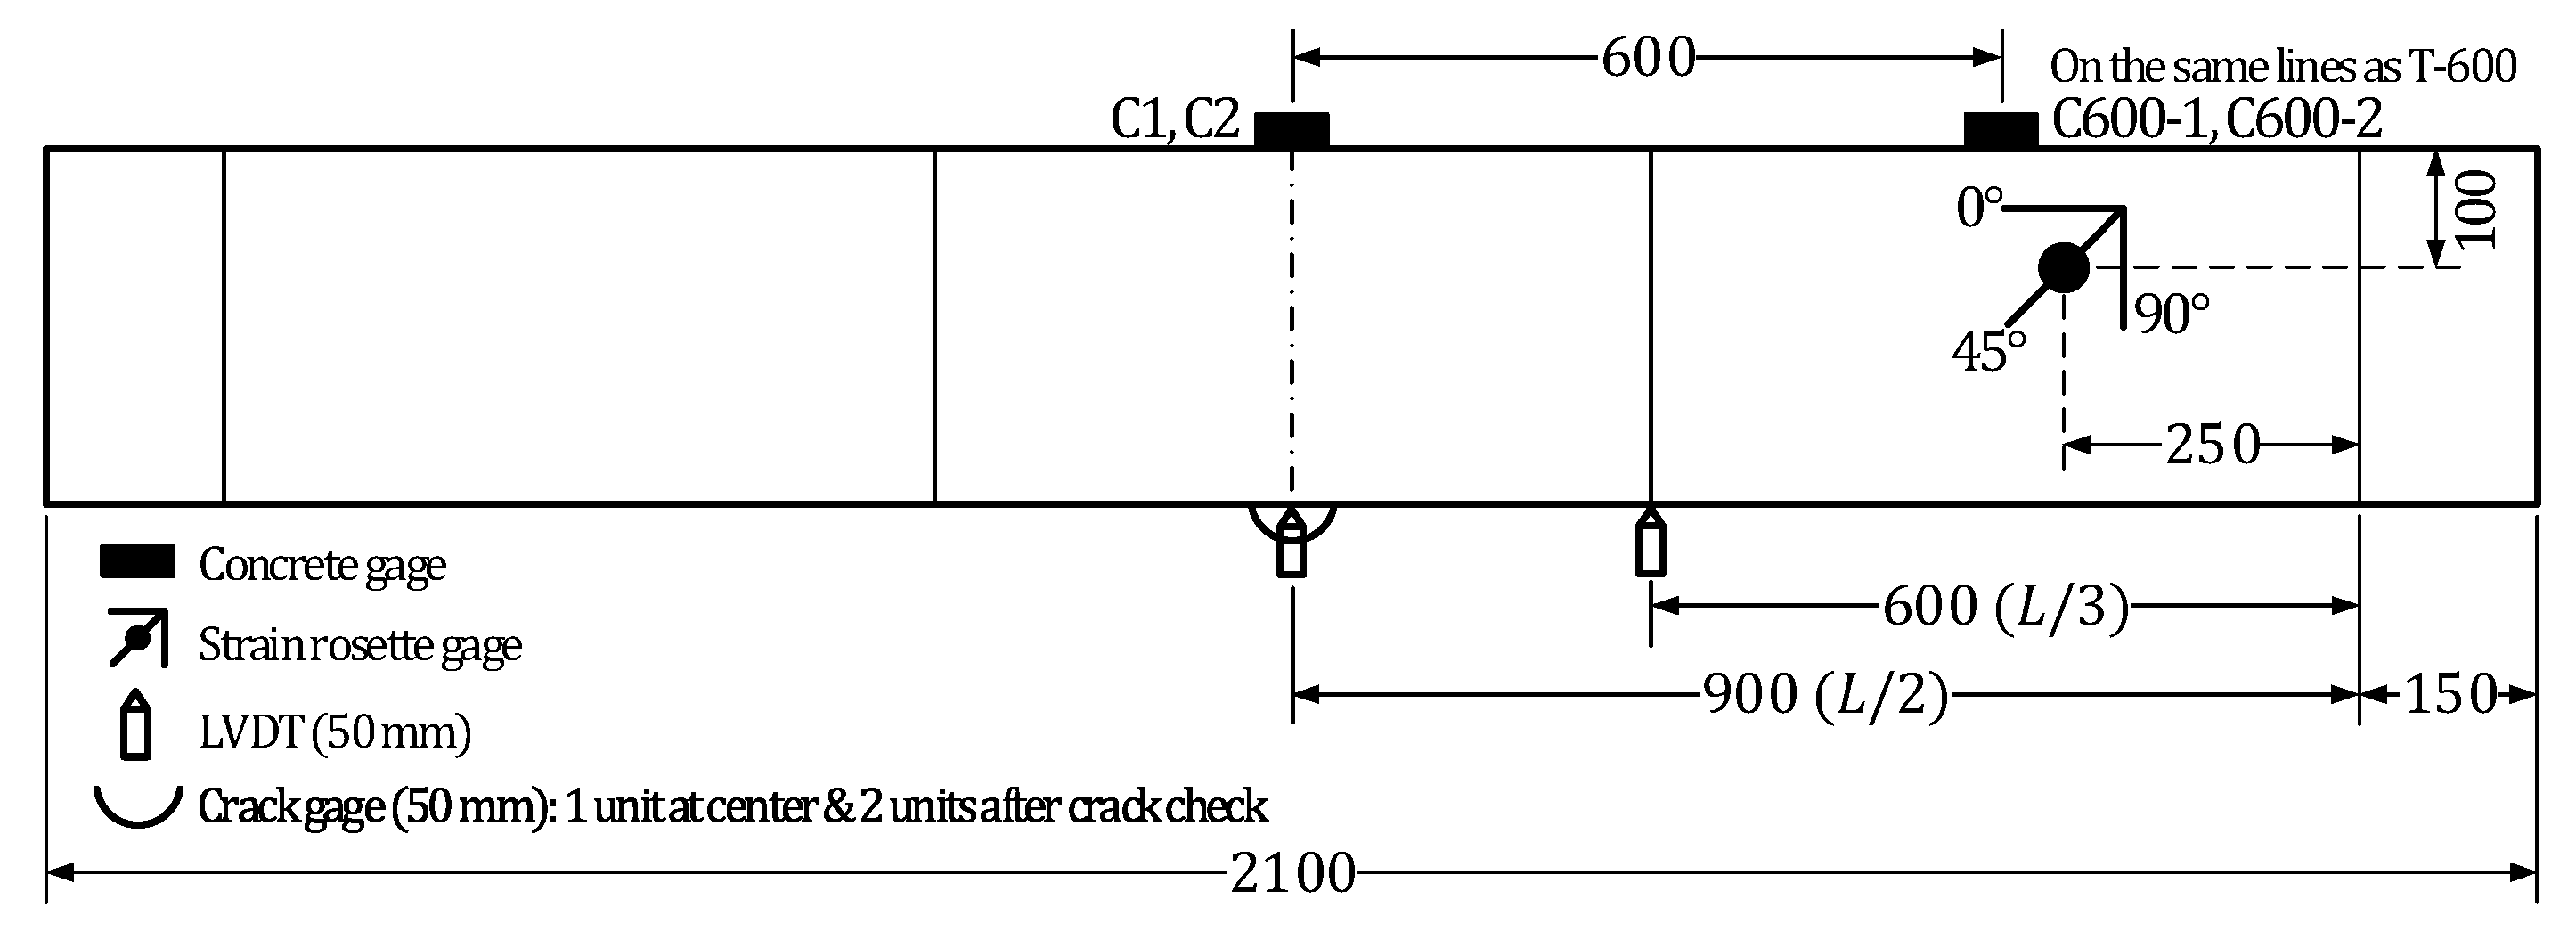
Figure 3 depicts the shape of the flexural test members for examining the stiffness recovery. The reinforced concrete members present rectangular cross-section with width of 200 mm and height of 300 mm and were designed to have pure bending section of 600 mm. The steel reinforcement uses SD400 bars with a 19 mm-diameter as tensile reinforcement, a 13 mm-diameter as compressive reinforcement and a 13 mm-diameter as shear reinforcement. The materials were first dry-mixed prior to the introduction of water and the admixtures. Wet curing was conducted for two days in a laboratory by covering the members with a curing tent and supplying continuously appropriate humidity. Thereafter, dry-air curing was performed until 28 days.
Strain gages were installed on the tensile and shear reinforcing bars before placing the concrete. Four strain gages were disposed on the tensile reinforcement with two sensors at mid-span and two sensors at 1/3 positions, that is at 600 mm in both sides from mid-span. Four strain gages were attached to the shear reinforcement with one sensor in each fourth and fifth shear rebar on the left and right-hand sides of the critical section at mid-span. The layout of the reinforcement strain gages is shown in Figure 4.
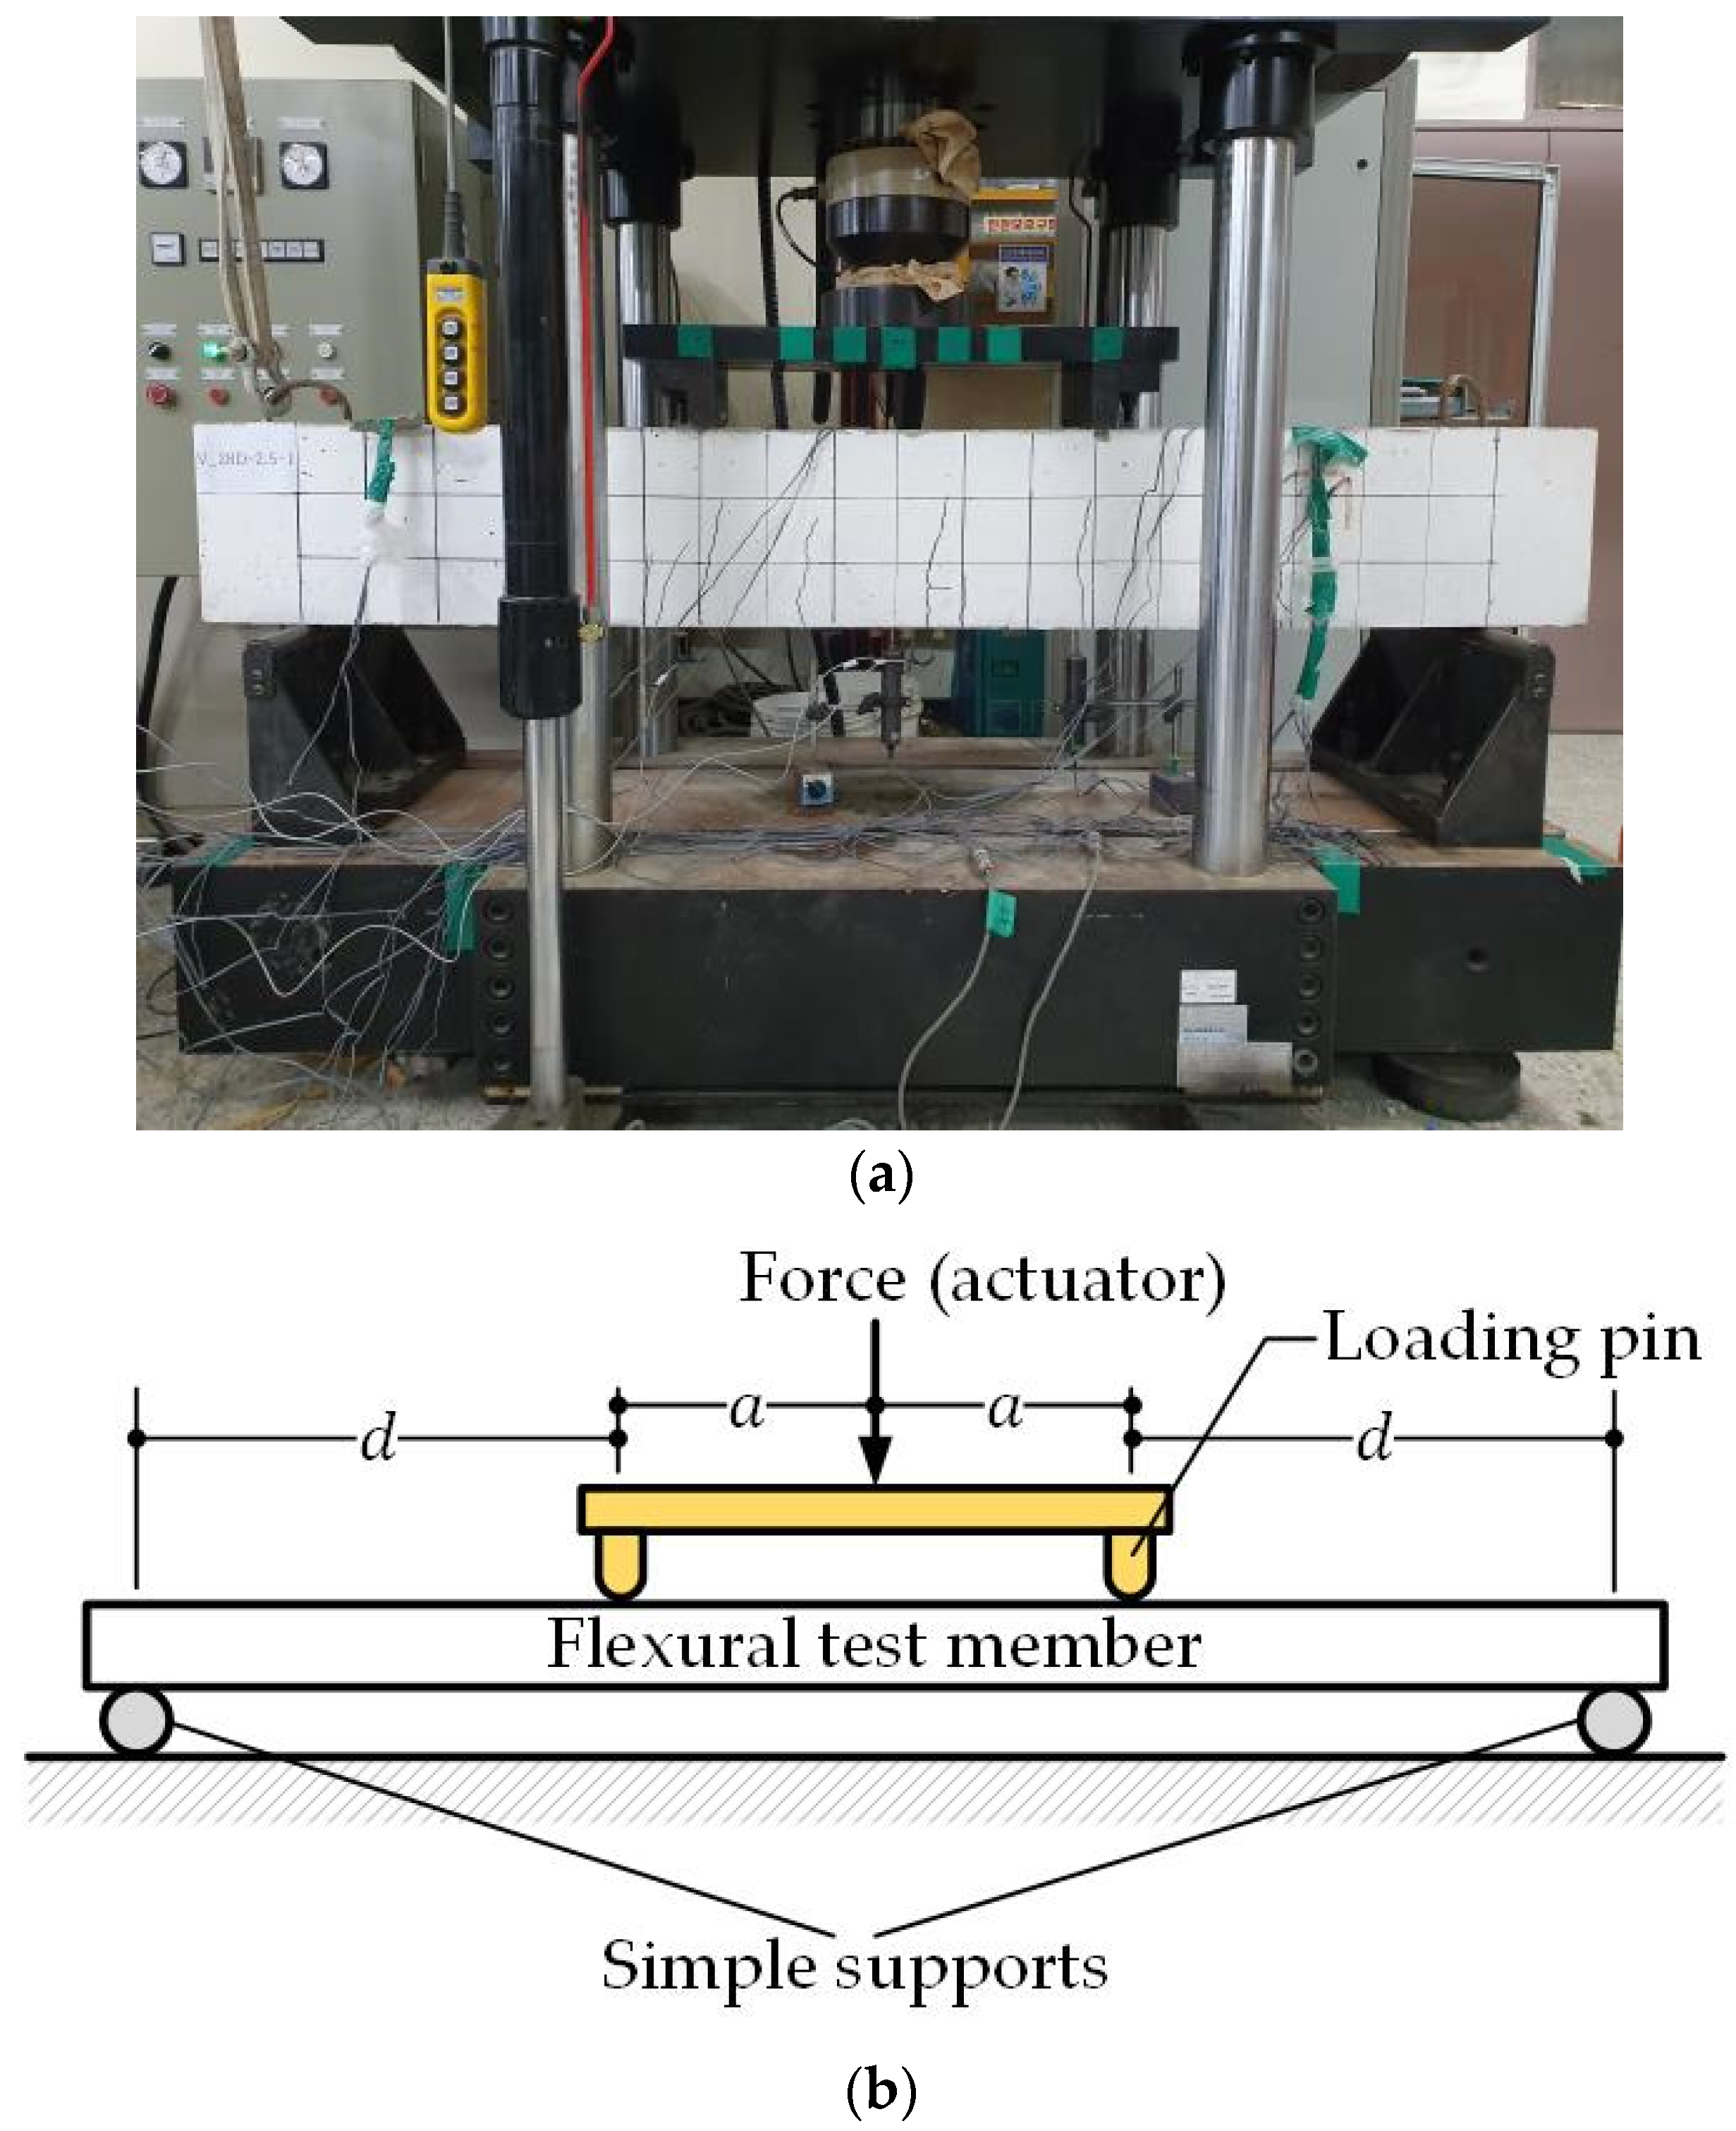
Figure 5 shows the setup for the 4-point bending test of the members as prescribed by ASTM C1609. The test members were simply supported by disposing them on supports located 150 mm from the ends of the members to achieve a supported length of 1800 mm. An LVDT was installed at the loading point for measuring the deflection to achieve displacement control for loading applied at speed of 0.5 mm/min. Figure 6 presents a photograph and a schematic illustration of the 4-point bending test of the flexural test members.
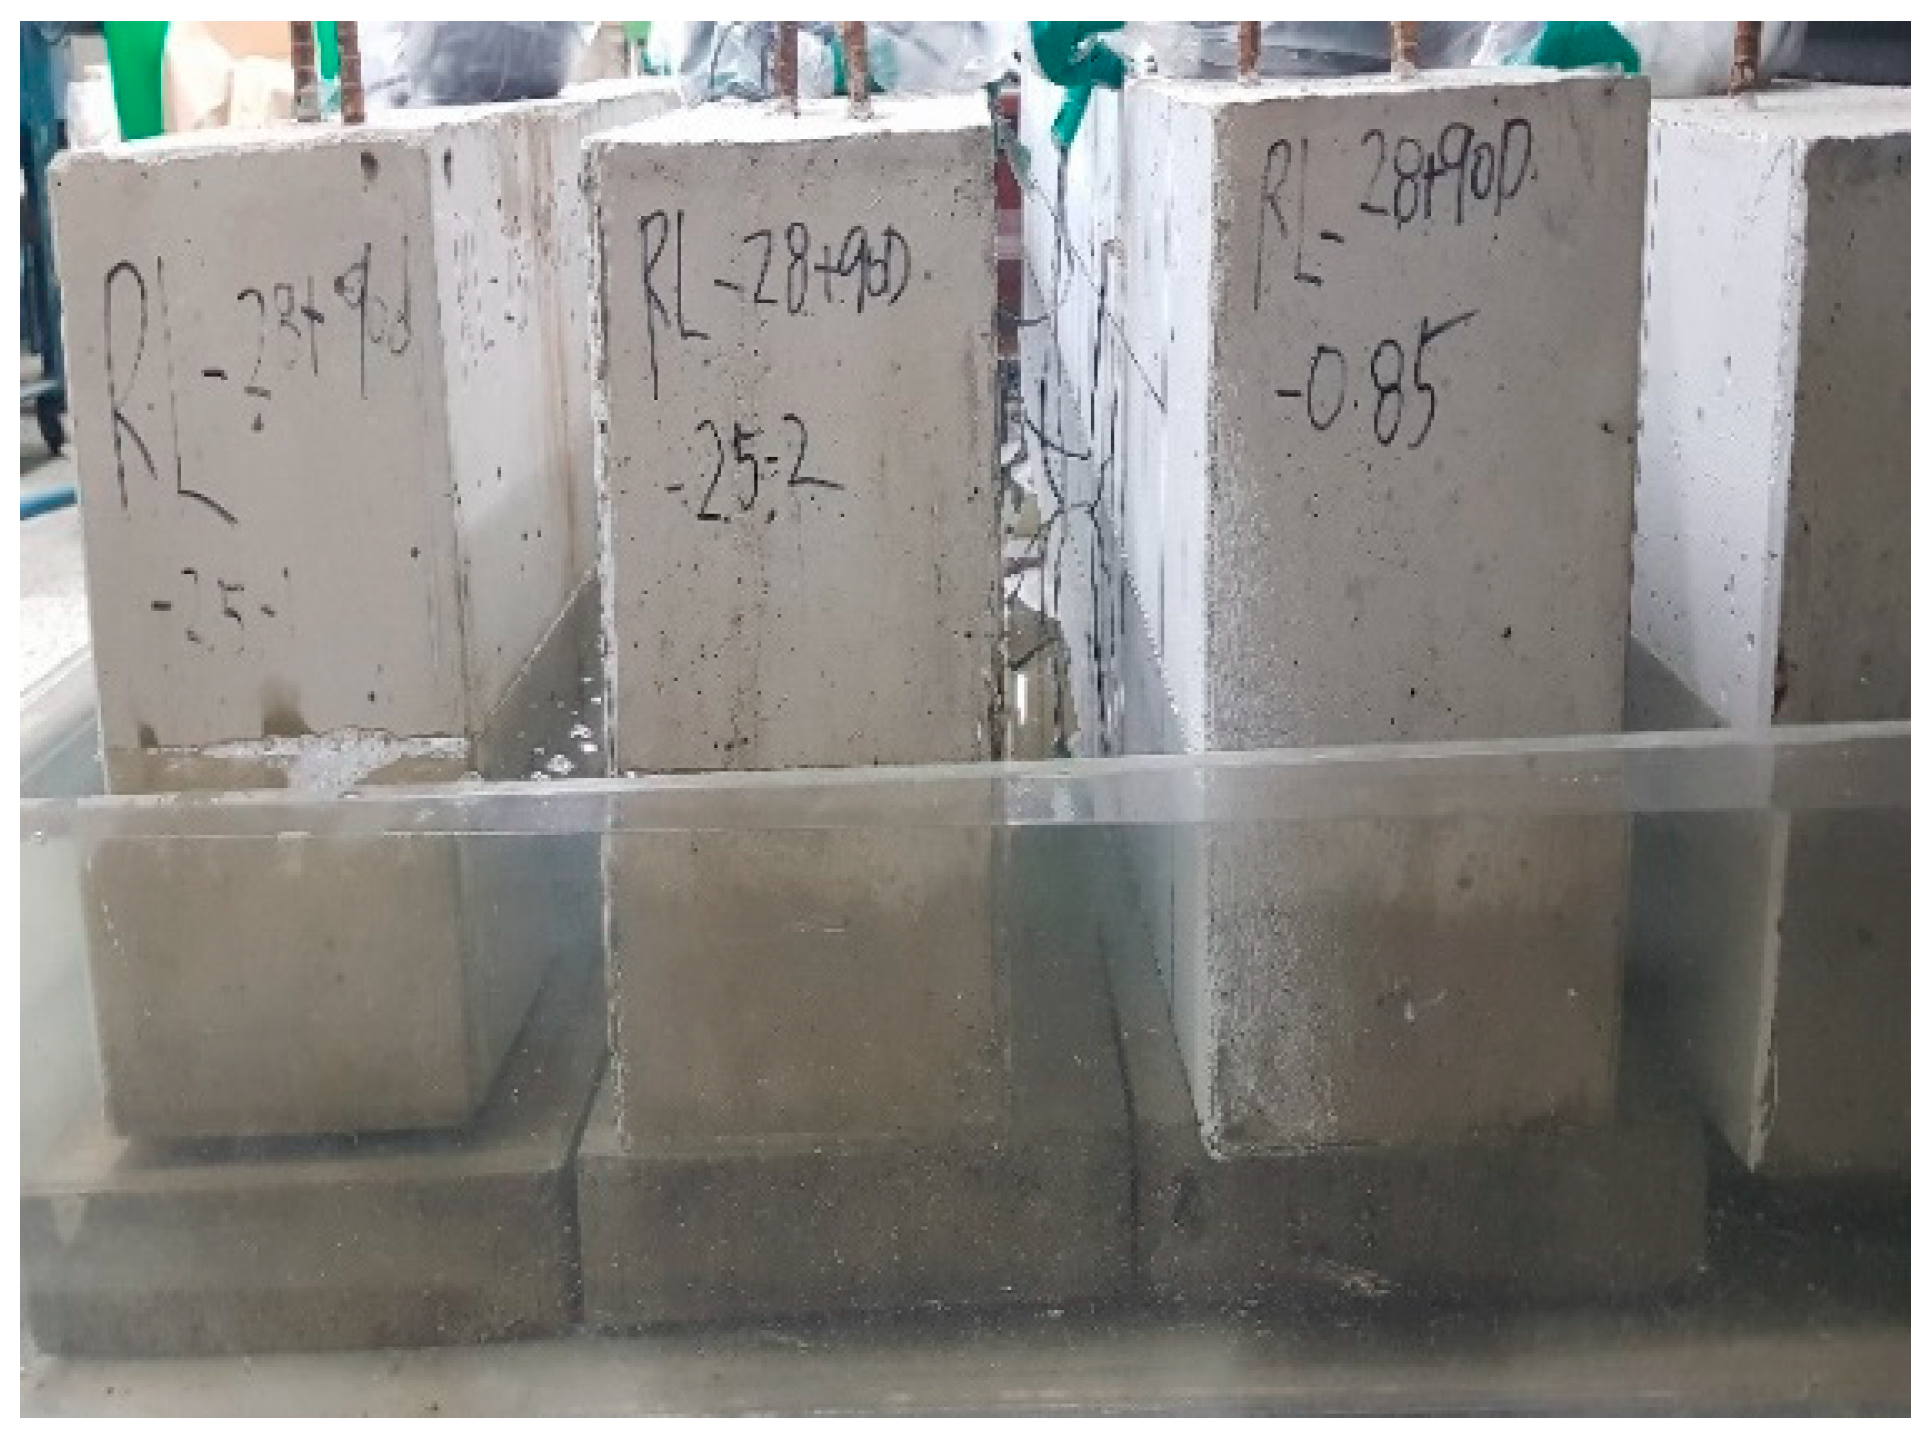
As explained in Table 4, pre-loading was applied up to 50% of the ultimate load followed by loading until the ultimate state at 28 days for members PLRL_28D. Members RL_28 + 90D were pre-loaded up to 50% of the ultimate load at 28 days and 150 mm of their lower part was then subjected to partial water curing for 90 days to examine the crack healing performance of pre-damaged members (Figure 7) before loading until the ultimate state. Members V_28 + 90D experienced dry-air curing until 118 days (28 + 90 days) before being loaded up to the ultimate load to examine the stiffness recovery according to the maximum size of the clinker powder replacing the binder and the aggregates.

3. Test Results

3.1. Material Test Results

The material test results of mortar and concrete are presented. Table 5 shows the compressive strength and slump flow measured for each of the considered mortars listed in Table 2. In Table 5, the values in parentheses represent the standard deviation, σ .
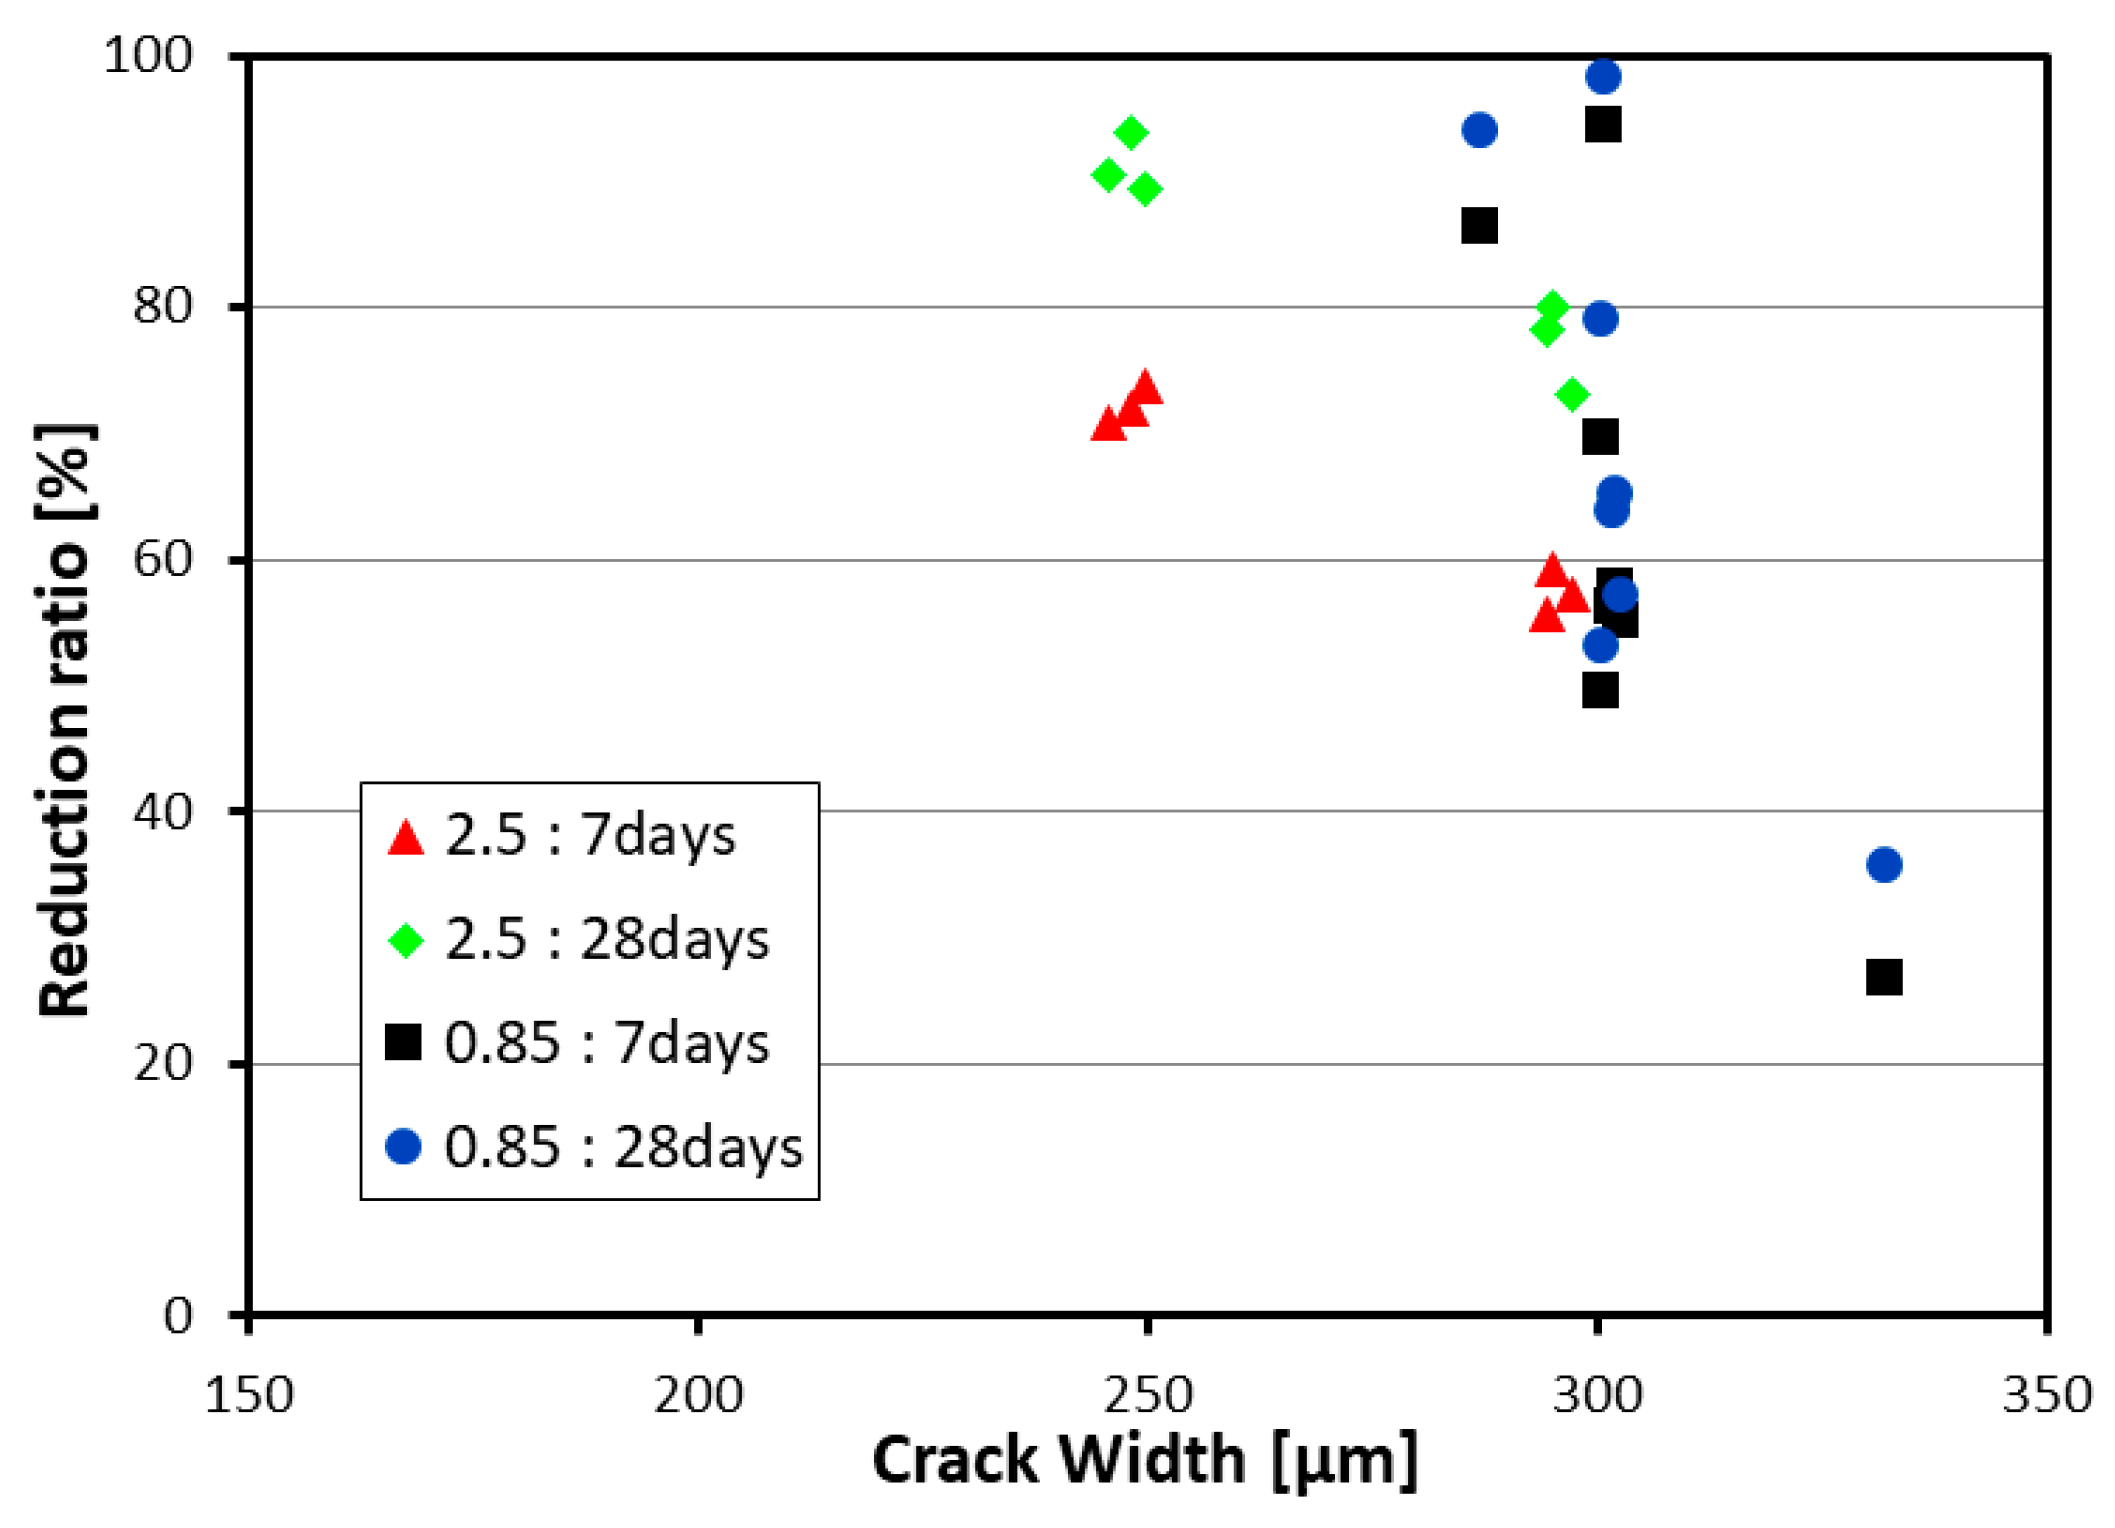
The water flow test results are plotted in Figure 8. The reduction ratio in Figure 8 indicates the water flow at 7 or 28 days as compared to that at day zero. This reduction ratio appears to be smaller as the crack width is large and the age is young. On the whole, the reduction ratio of the 0.85-mm series is higher than that of the 2.5-mm series samples, which shows that the replacement of binder by clinker powder brings a greater crack healing effect.
The basic physical properties of the concrete mixes are presented in Table 6 and Table 7. Recalling that some test members experienced pre-damage at 28 days and were reloaded 90 days later, measurement of the physical properties was conducted at 28 days and 28 + 90 days. In Table 5, the compressive strength, fck, was measured on prismatic specimens at 28 days and 90 days later in compliance with KS L ISO 679. Similar levels of compressive strength were developed in all the mixes. The elastic modulus, Ec, was measured as the slope of the linear 10–40% region in the stress–strain diagram using triaxial concrete strain rosette gages attached to the ϕ100 × 200-mm mold. Results similar to those of the compressive strength were obtained. The 0.85-mix series with a relatively meaningful binder replacement ratio by 0.85 mm of clinker exhibited the best physical properties. The slump and air content measured on fresh concrete are also indicated in Table 6. Table 7 arranges the flexural strength, fb, measured using the third-point loading method in compliance with KS F 2048. In Table 7, the values in parentheses represent the standard deviation, σ . Similarly to the results of Table 6, similar flexural strength was measured in all the mixes. Here also, the 0.85-mix series with a relatively meaningful binder replacement ratio by 0.85 mm of clinker exhibited the best physical properties. In Table 6 and Table 7, the values in parentheses represent the standard deviation, σ .

3.2. Flexural Test Results

3.2.1. Crack, Yield, Ultimate Loads and Failure Pattern

All the test members exhibited negligible difference in the crack, yield and ultimate loads apart from some slight variability. Moreover, all the test members failed through flexure. Table 8 summarizes the measured crack, yield and ultimate loads as well as the failure pattern of the 12 test members listed in Table 4.

3.2.2. Load-Deflection Relations

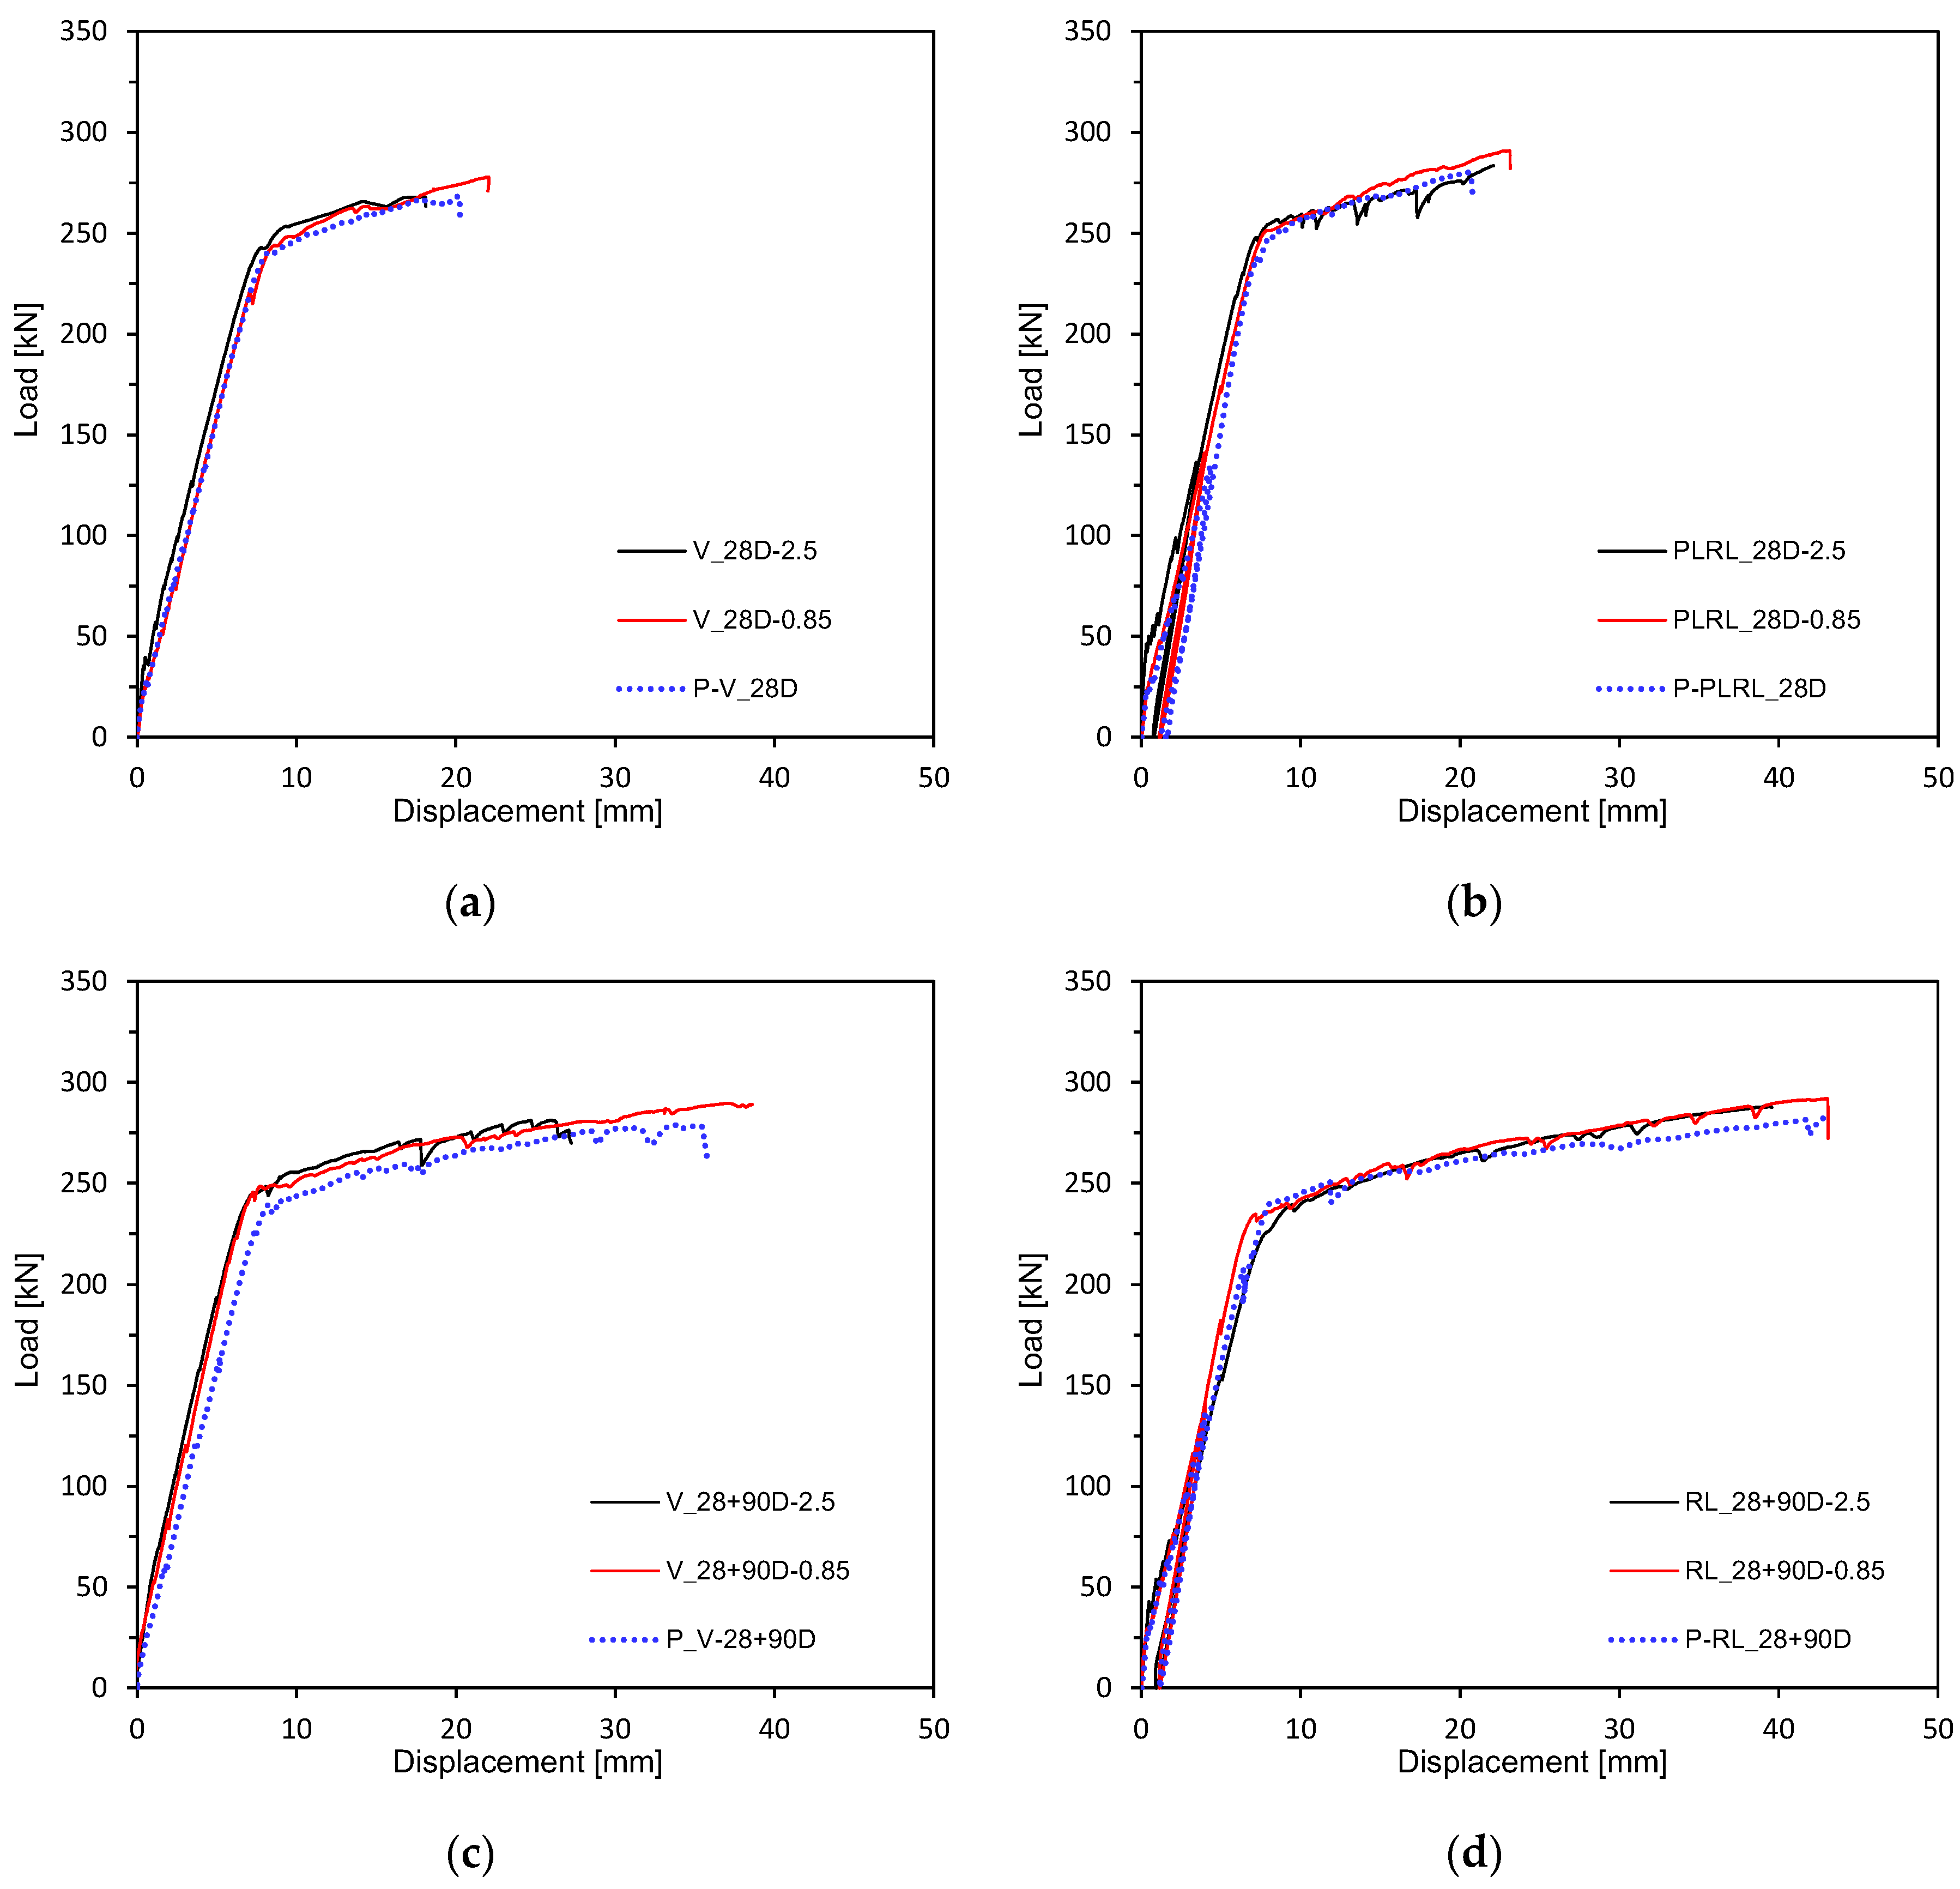
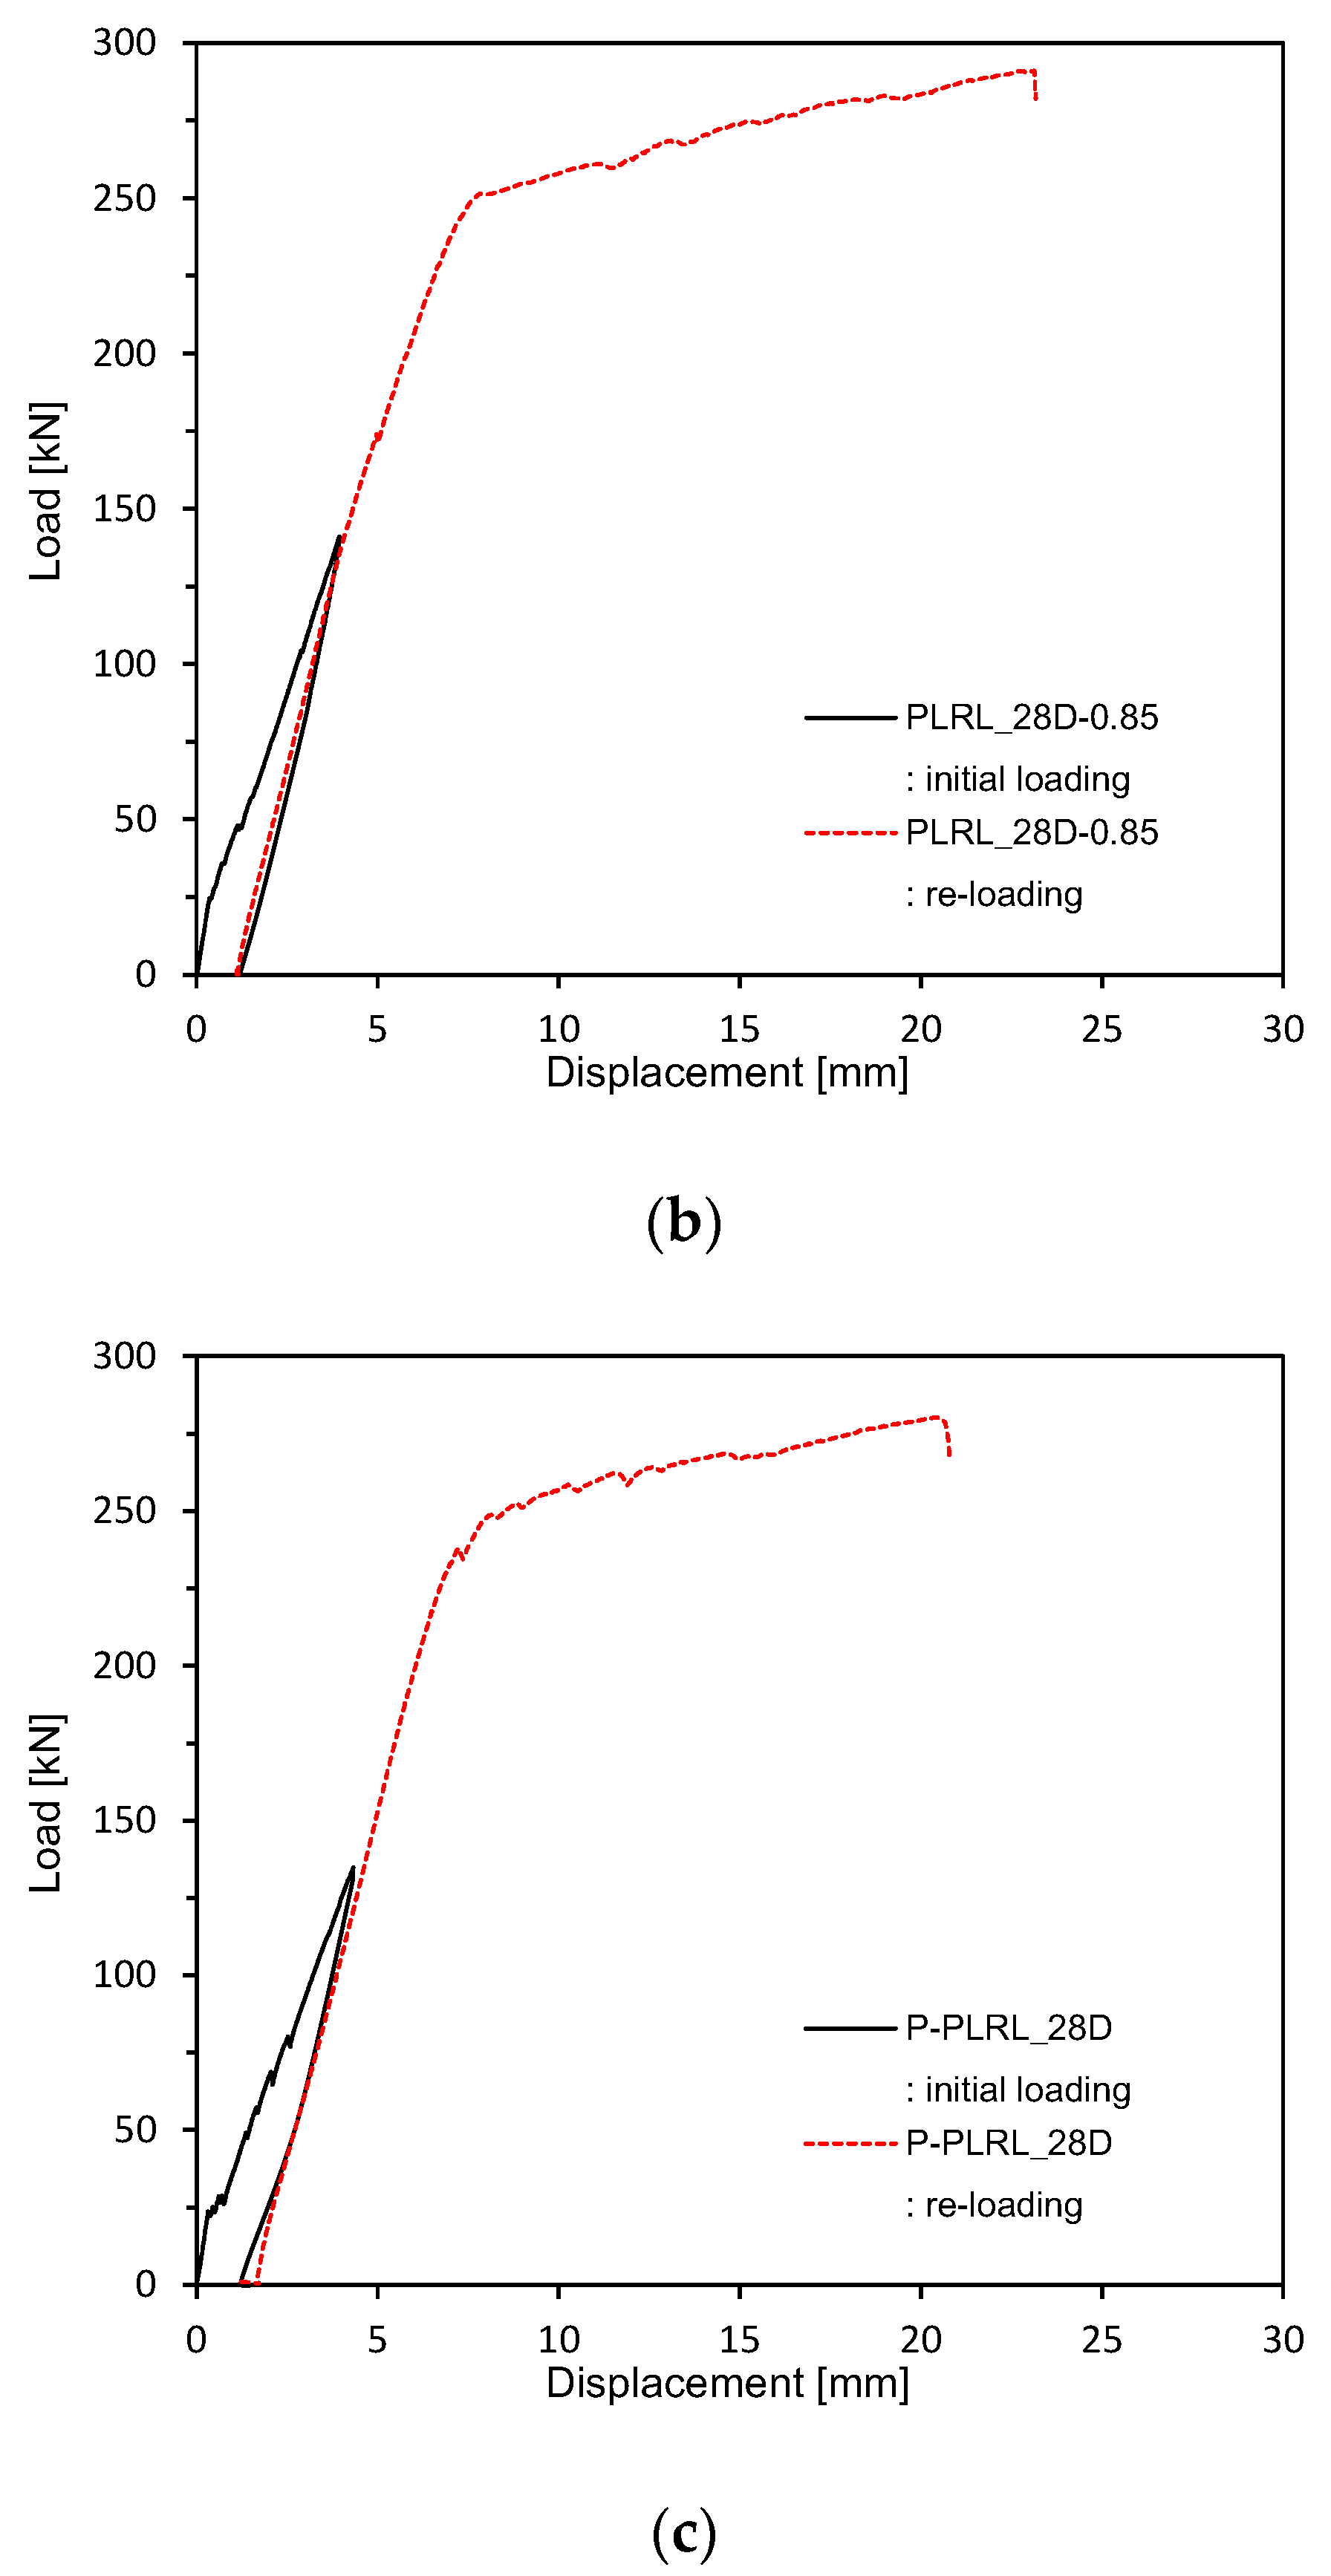
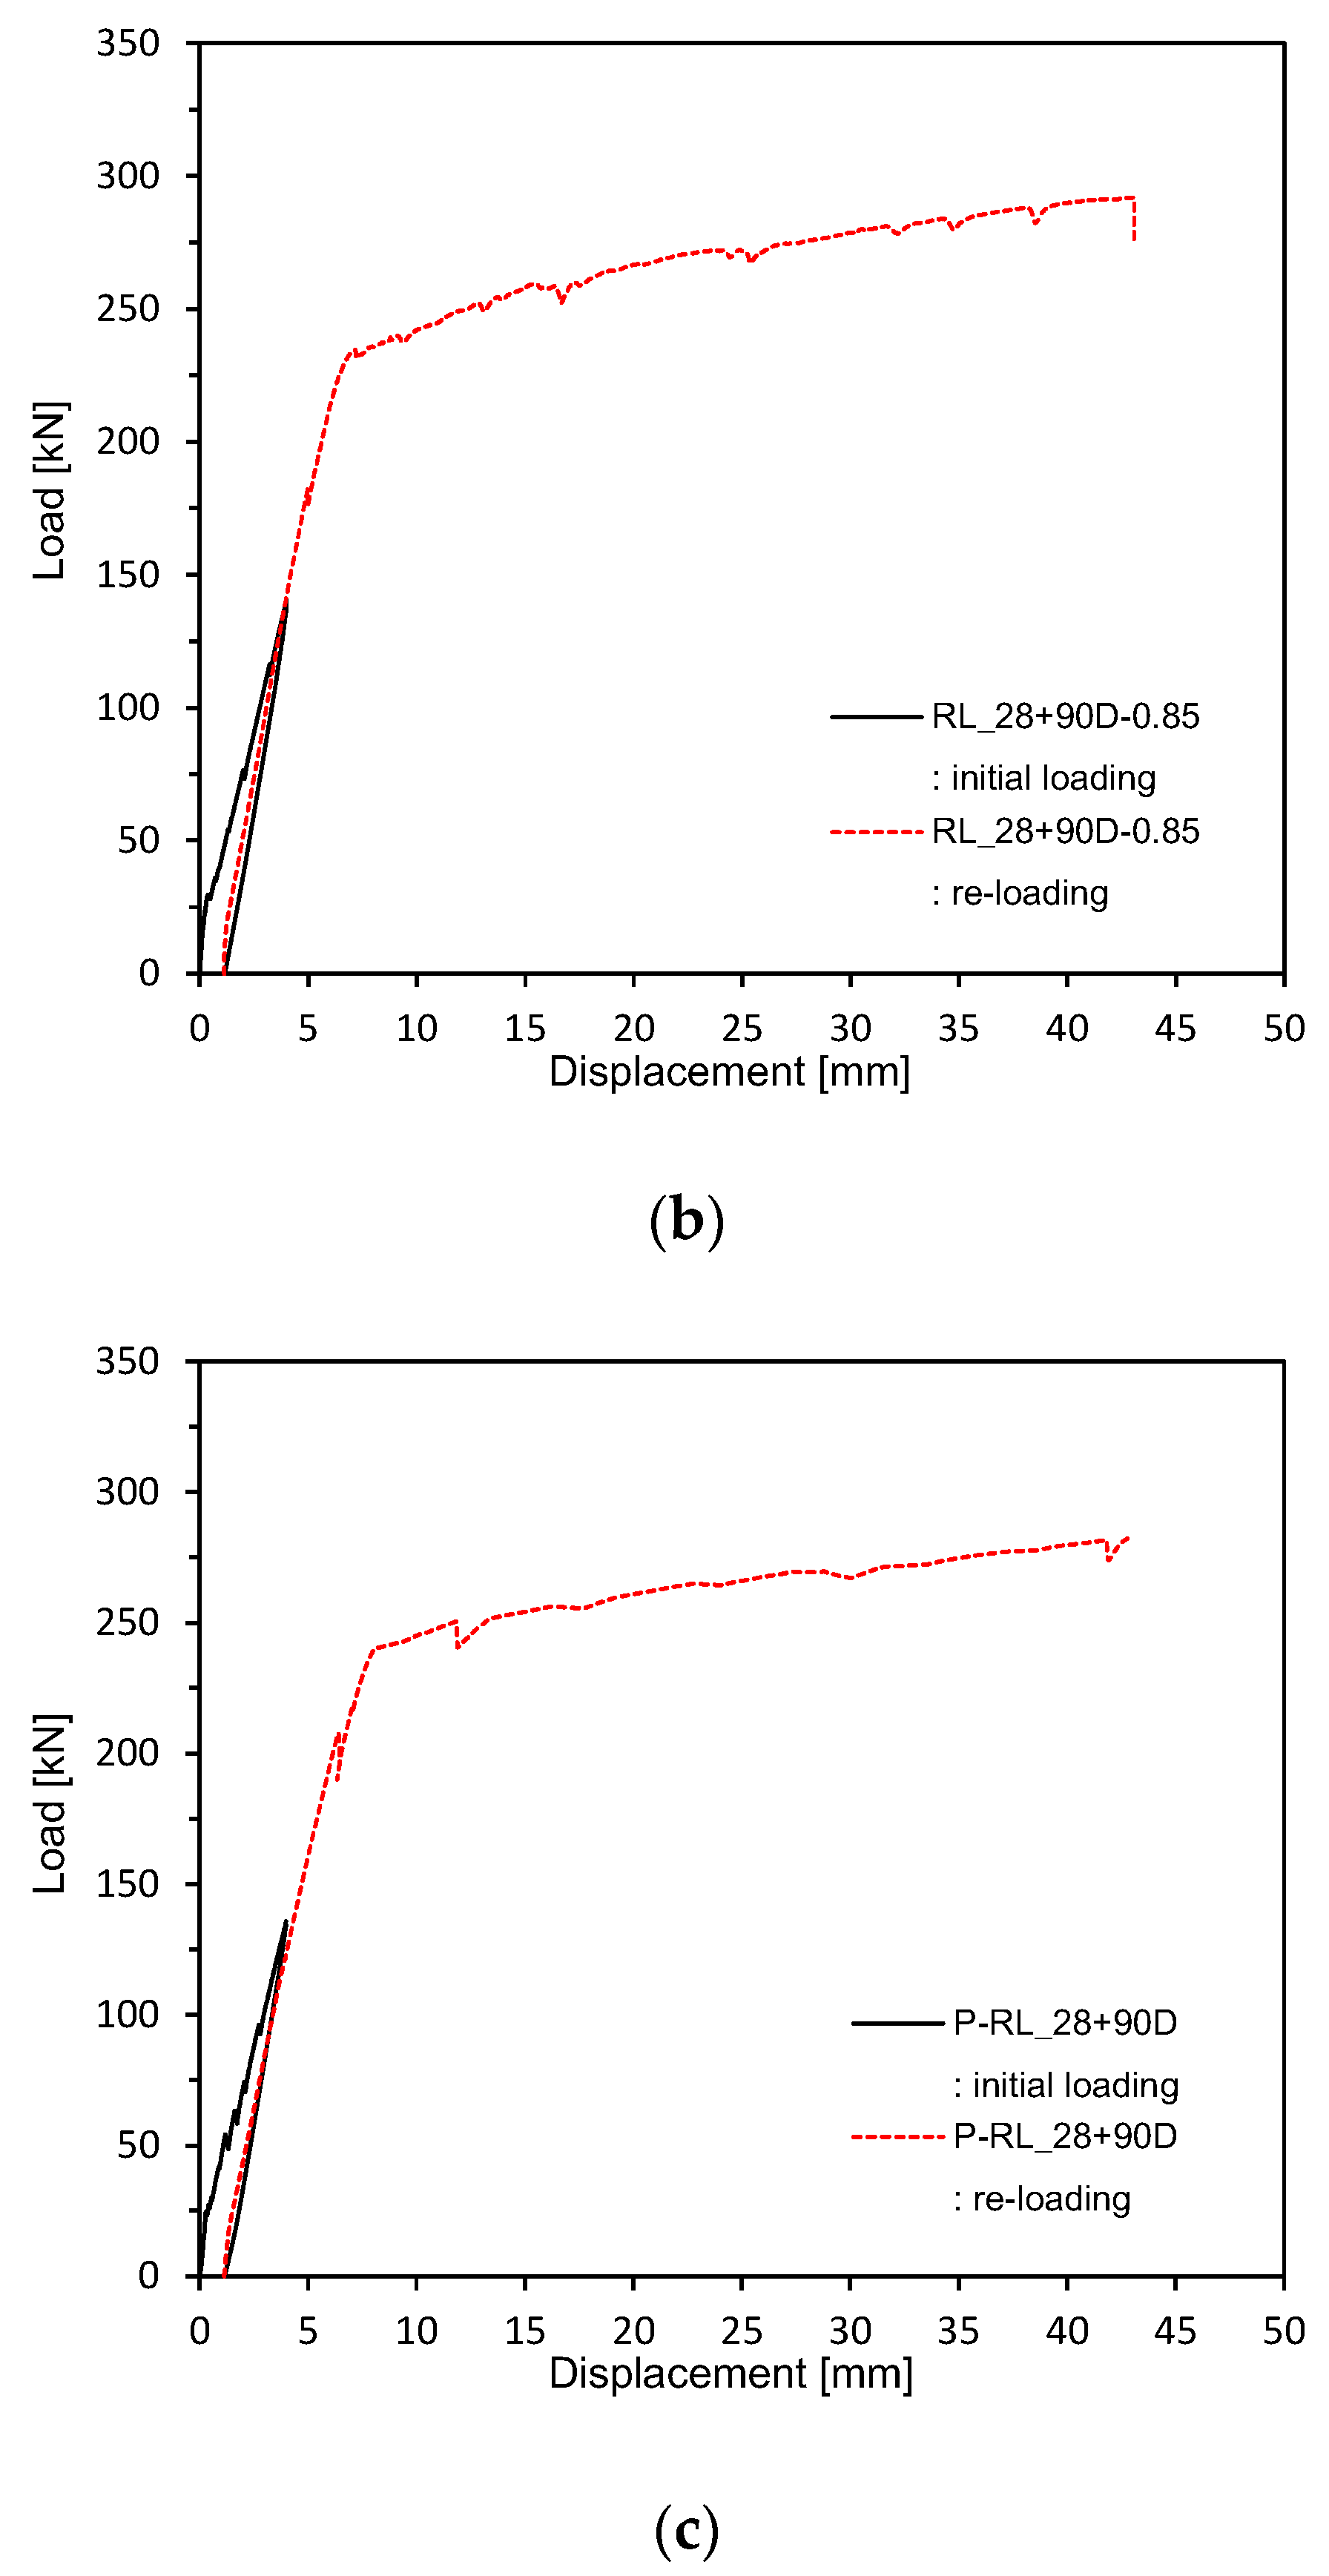
Figure 9 and Figure 10 plot the load-deflection relations measured after 28 days of curing. Figure 11 shows the load-deflection relations after pre-loading. Figure 12 plots the load-deflection relations after pre-loading and additional 90 days of curing. All the test members show linear load-deflection relations until early cracking followed by a nonlinear increase in the deflection after cracking and finally the increase in the load until the ultimate load. The members that experienced additional 90 days of curing after 28 days appear to undergo ultimate deflection nearly larger than 100% of that of the members loaded after 28 days of curing due to the plastic deformation effect induced by their age and the yield of steel reinforcement. This result confirms the increasing trend in the flexural resistance observed by Alyousif [35].

3.2.3. Load–Rebar Strain Relations

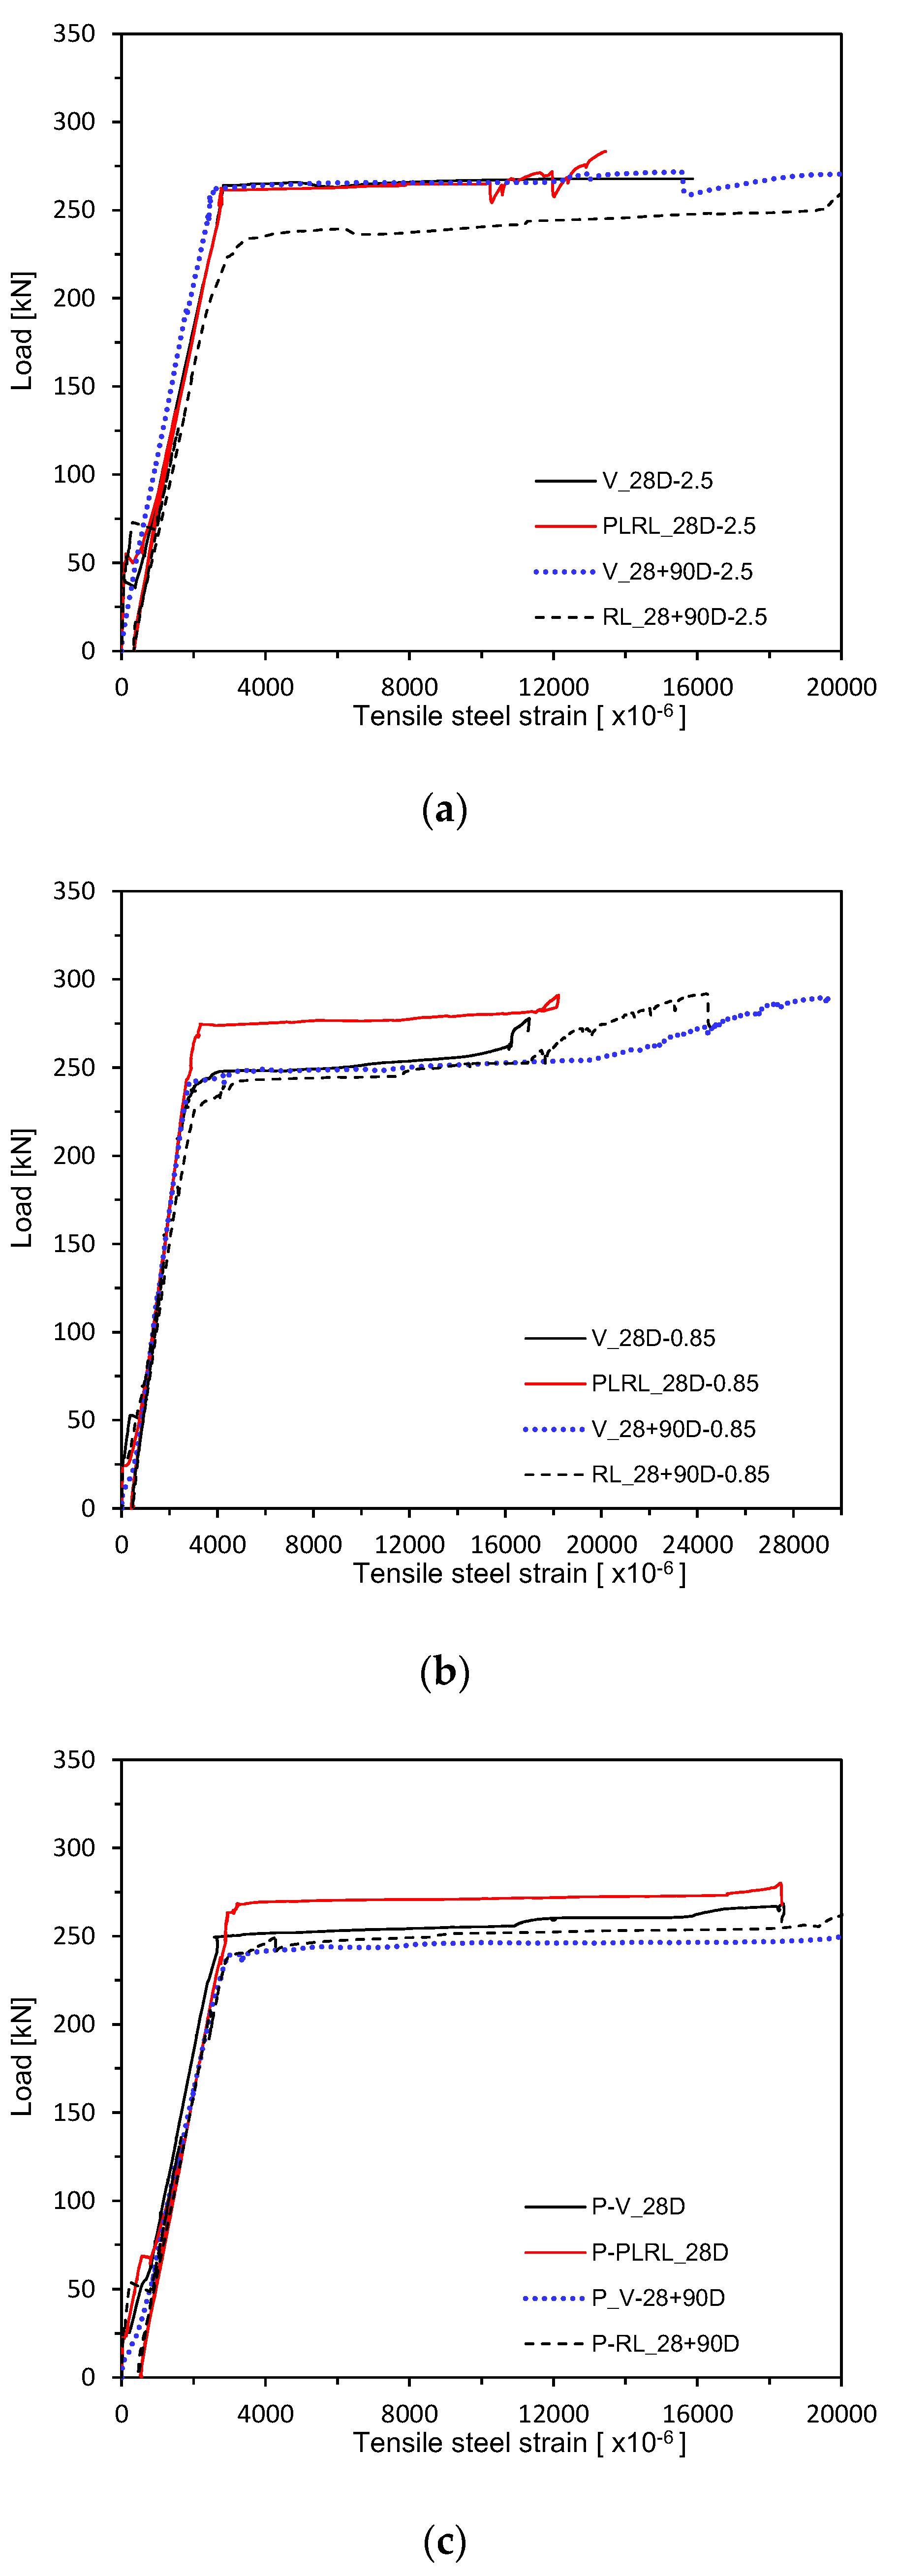
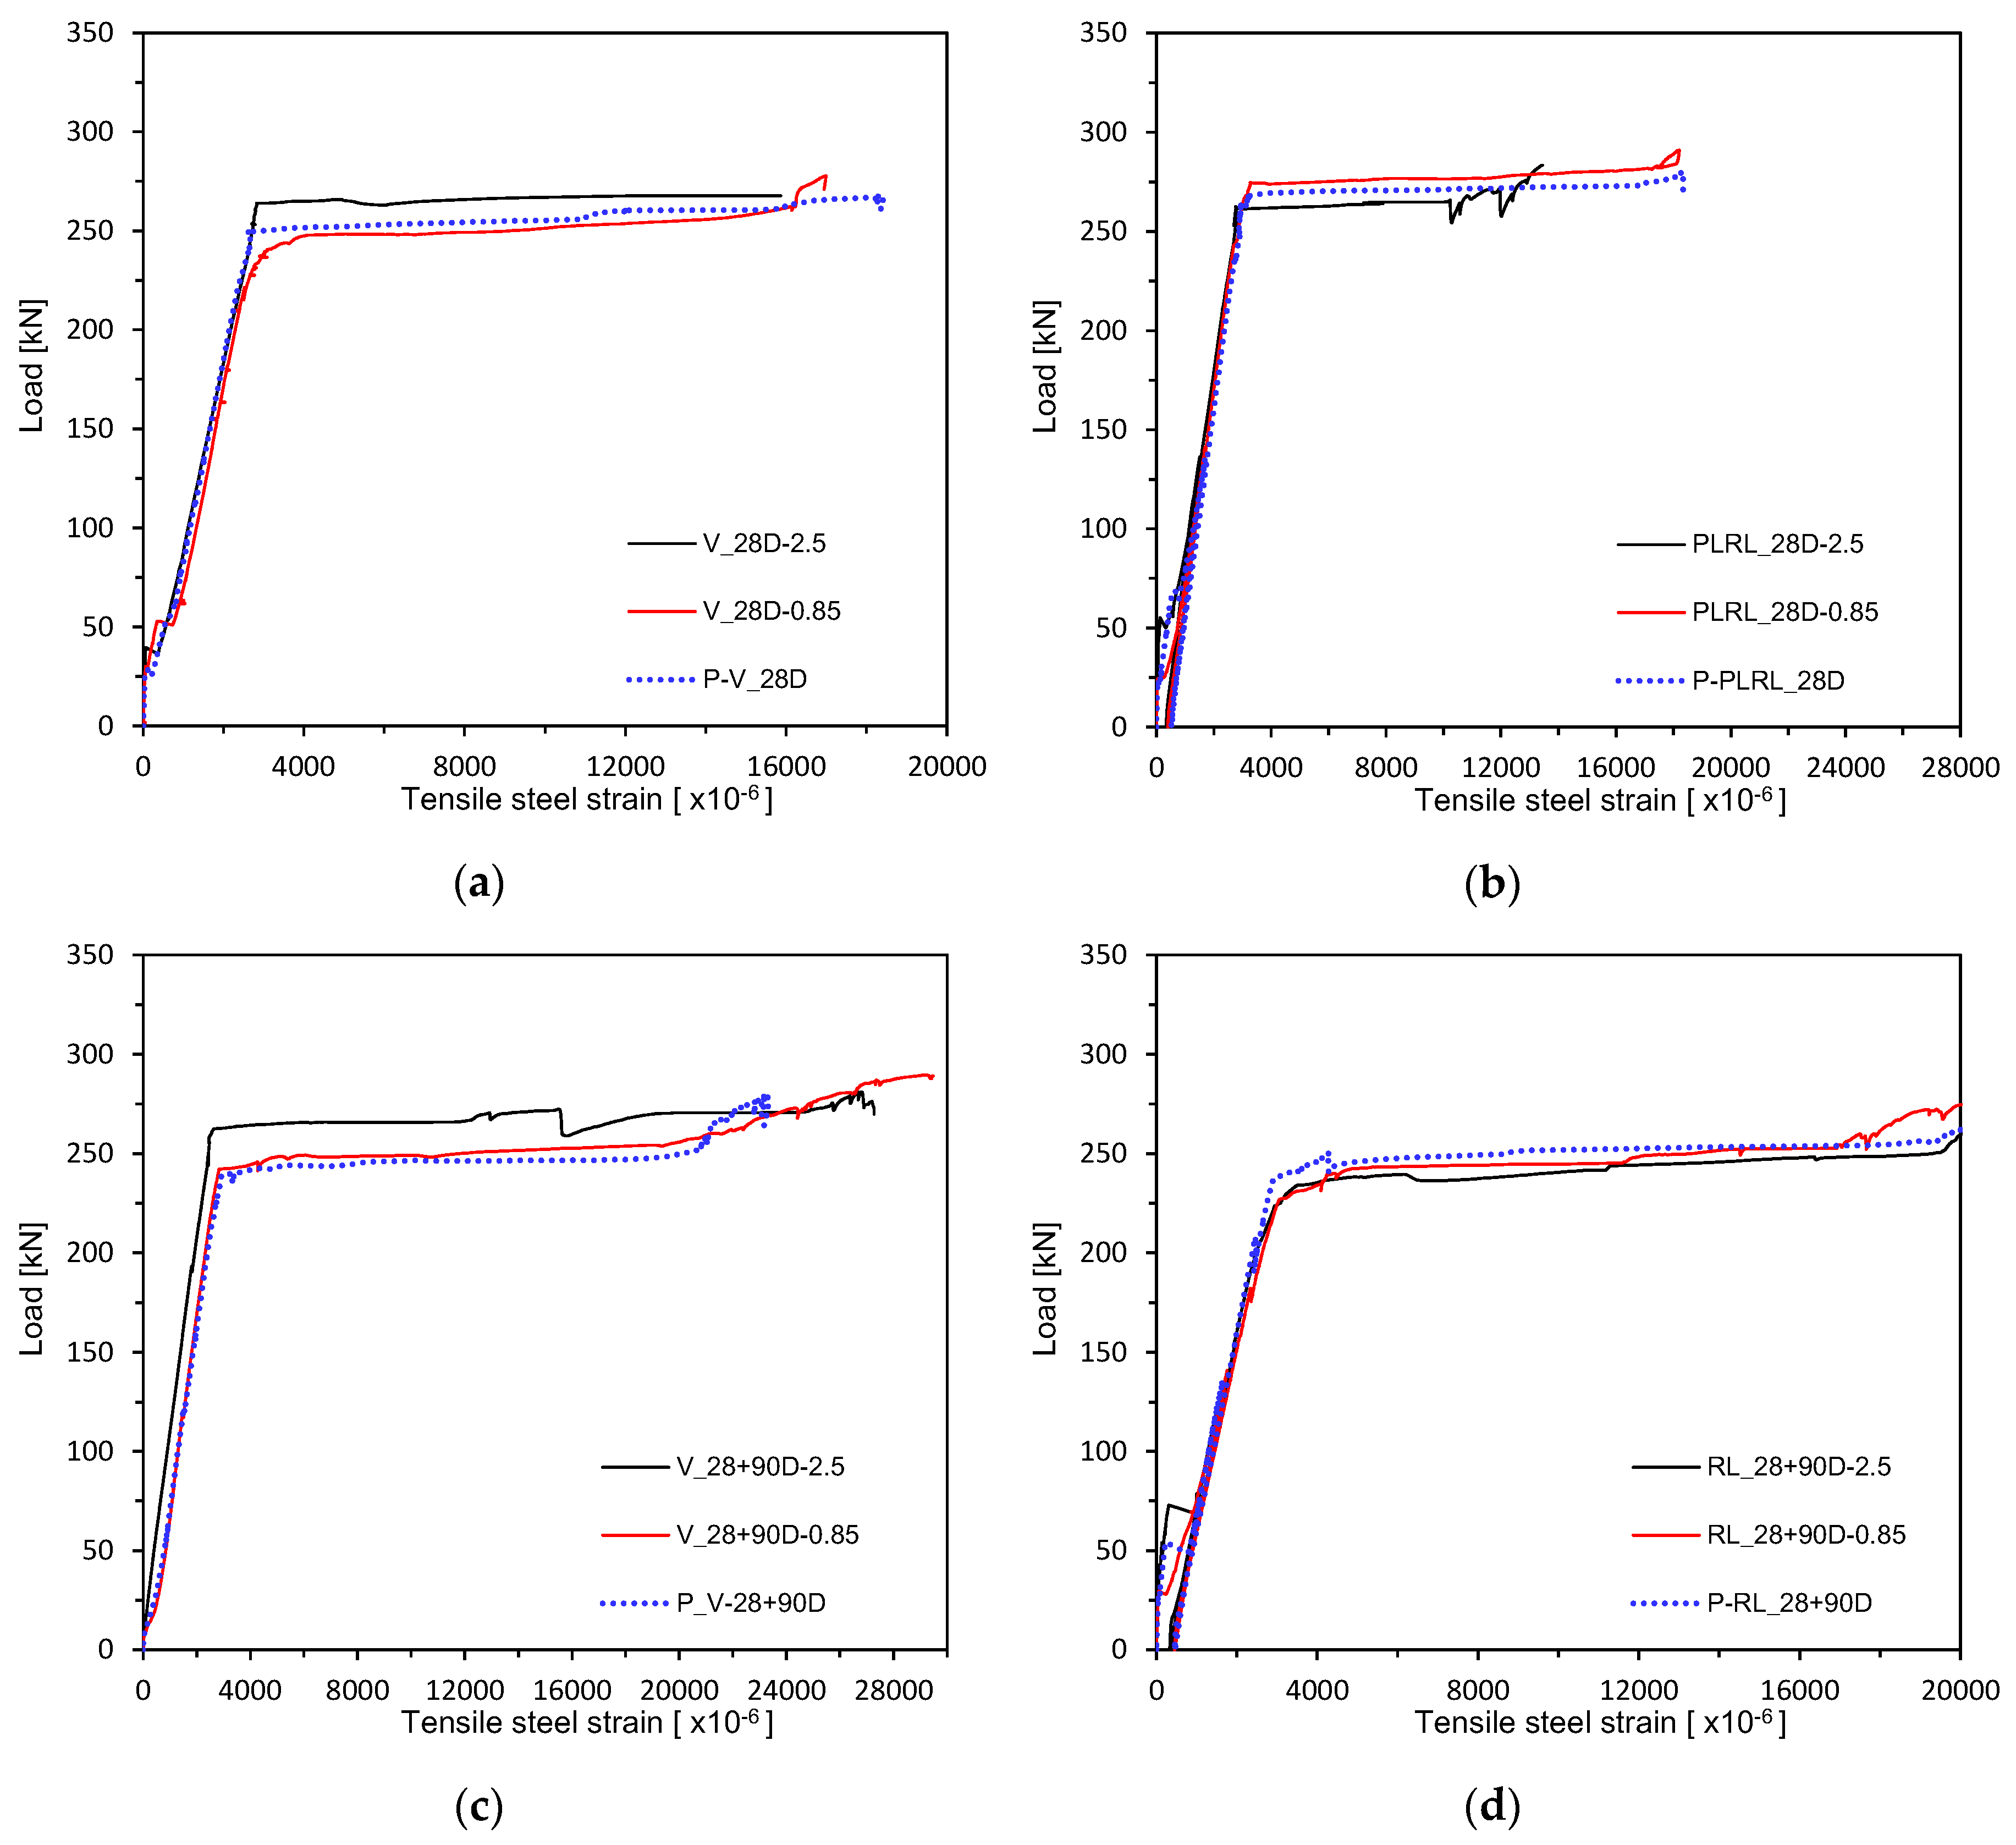
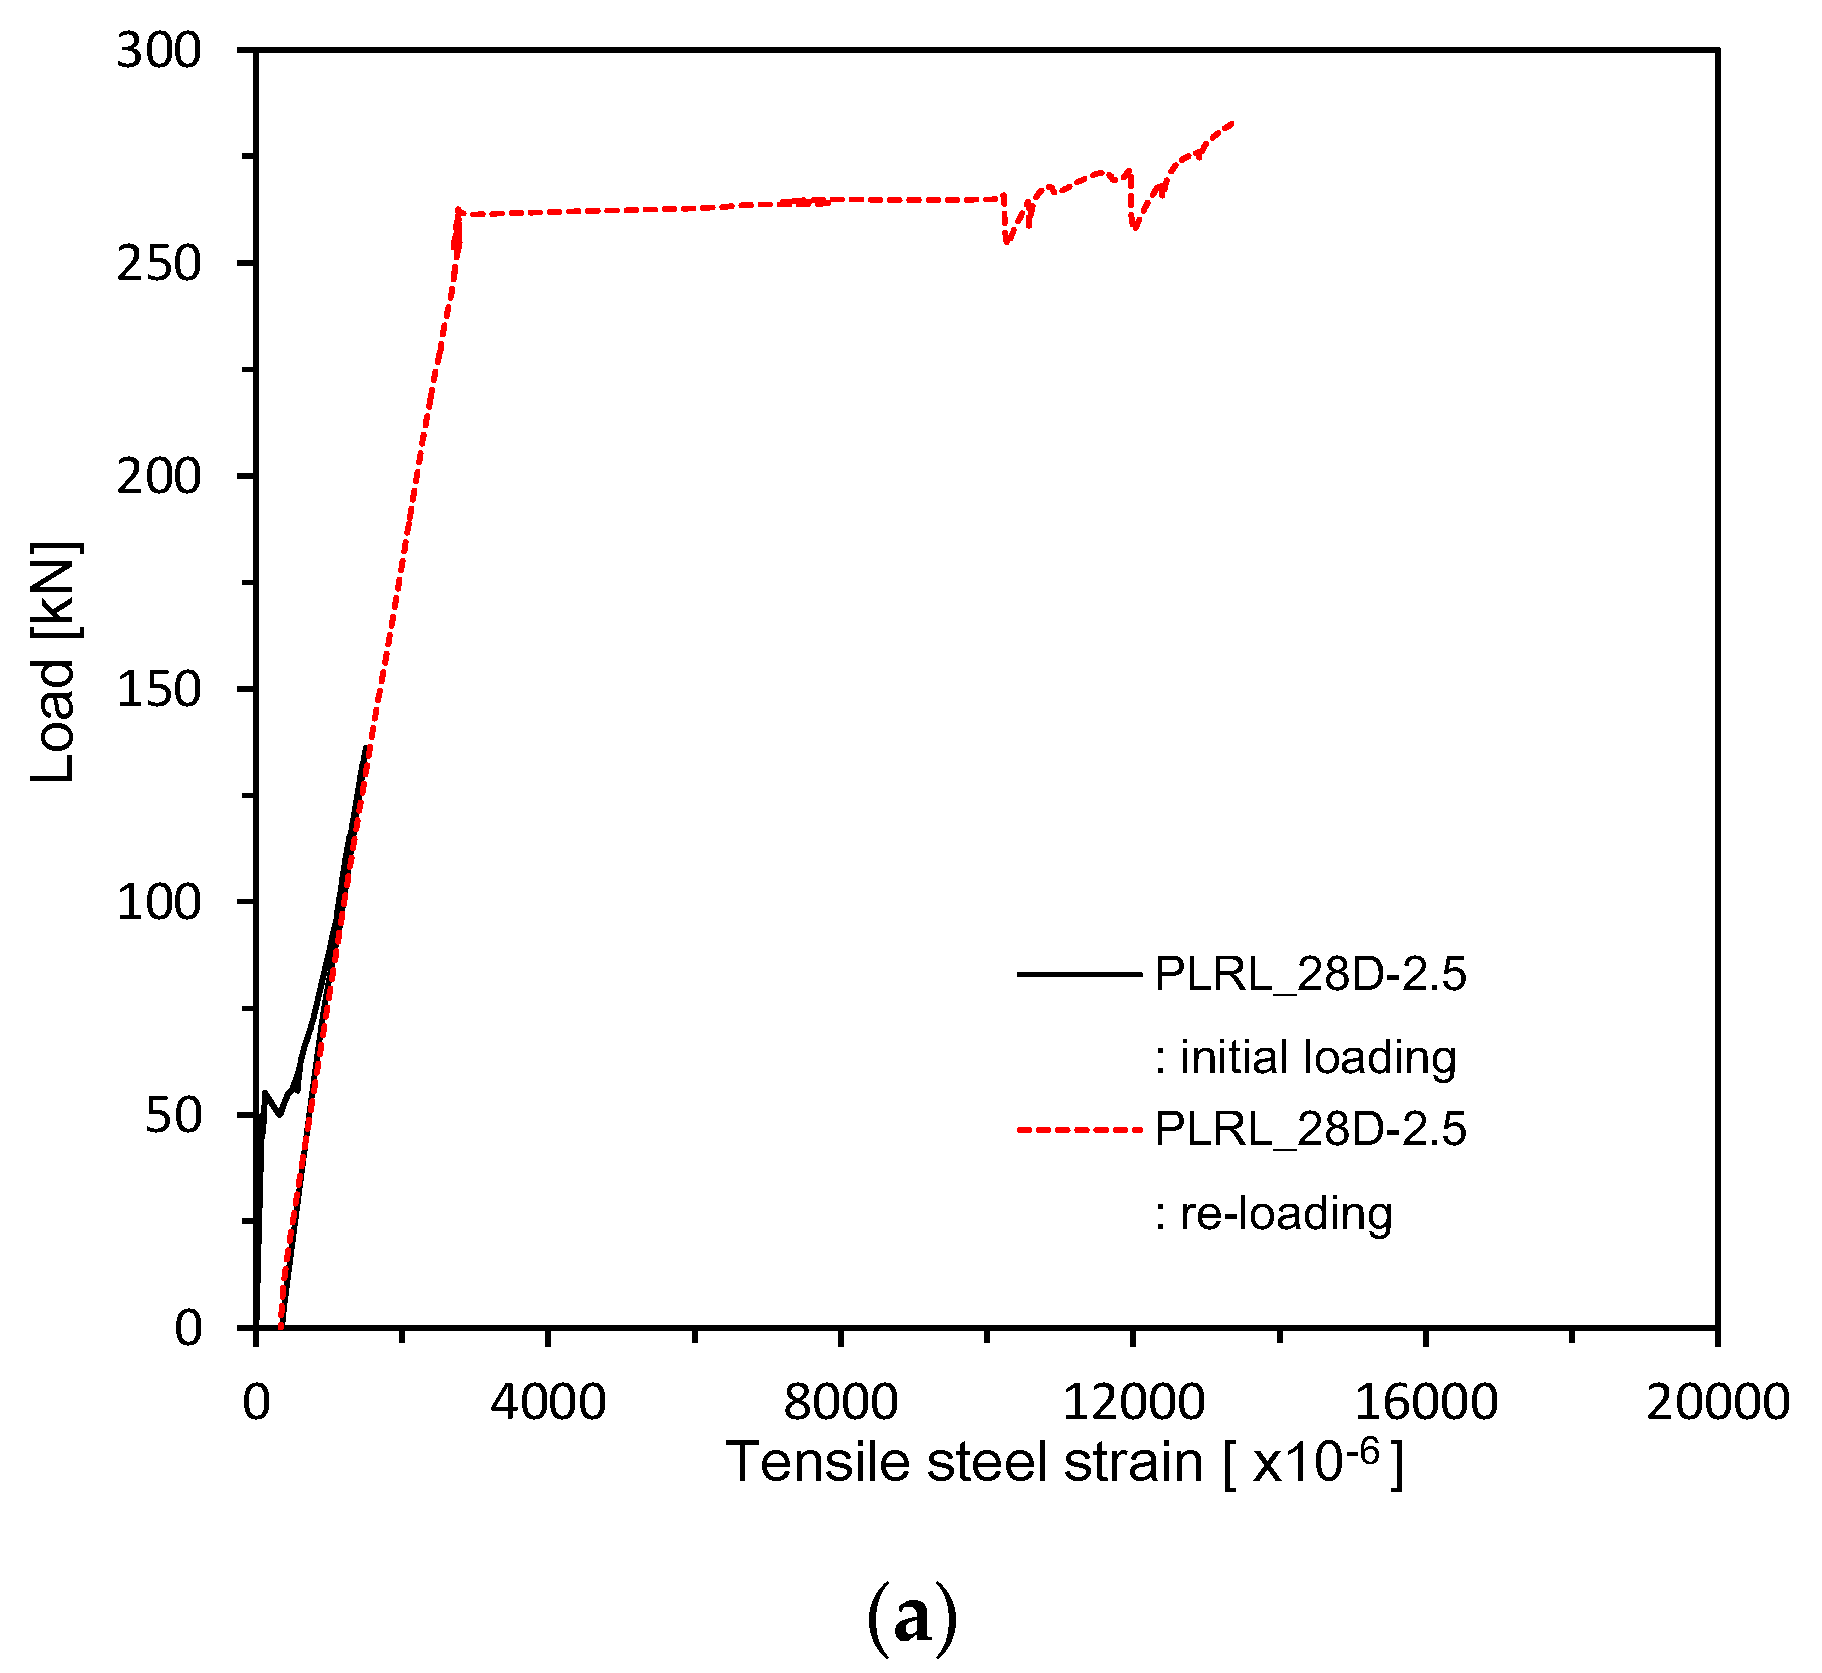
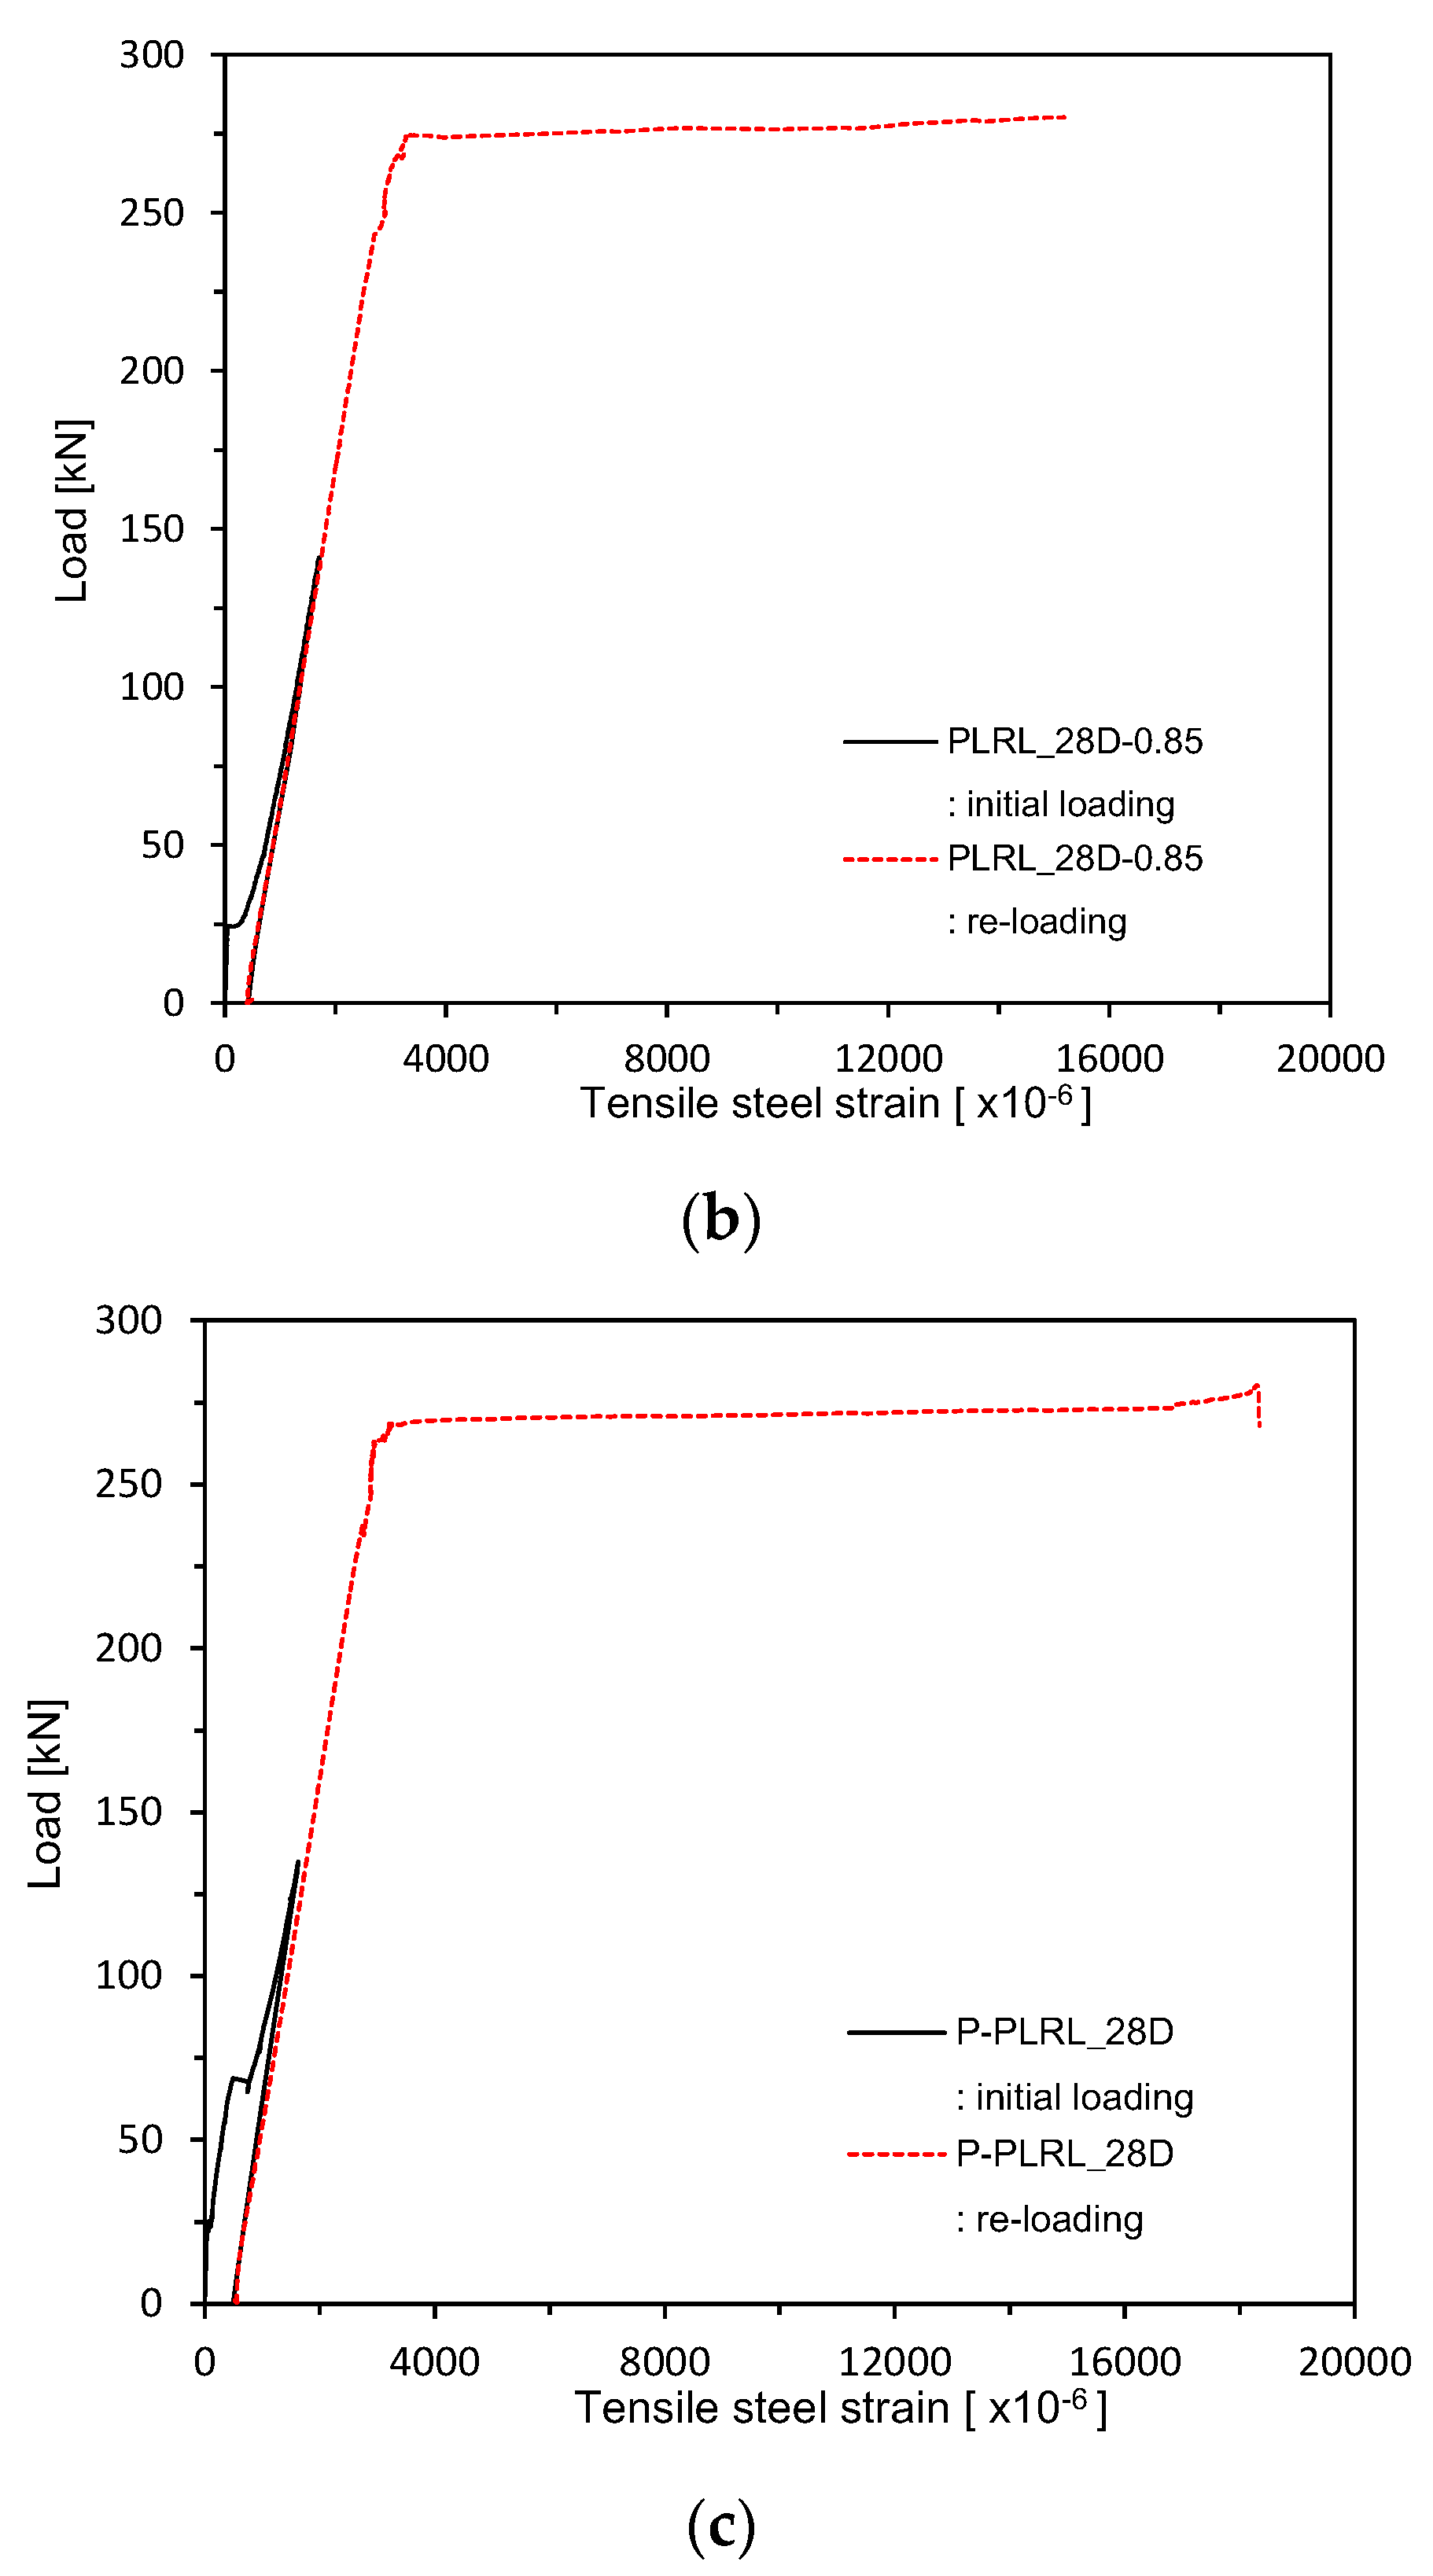
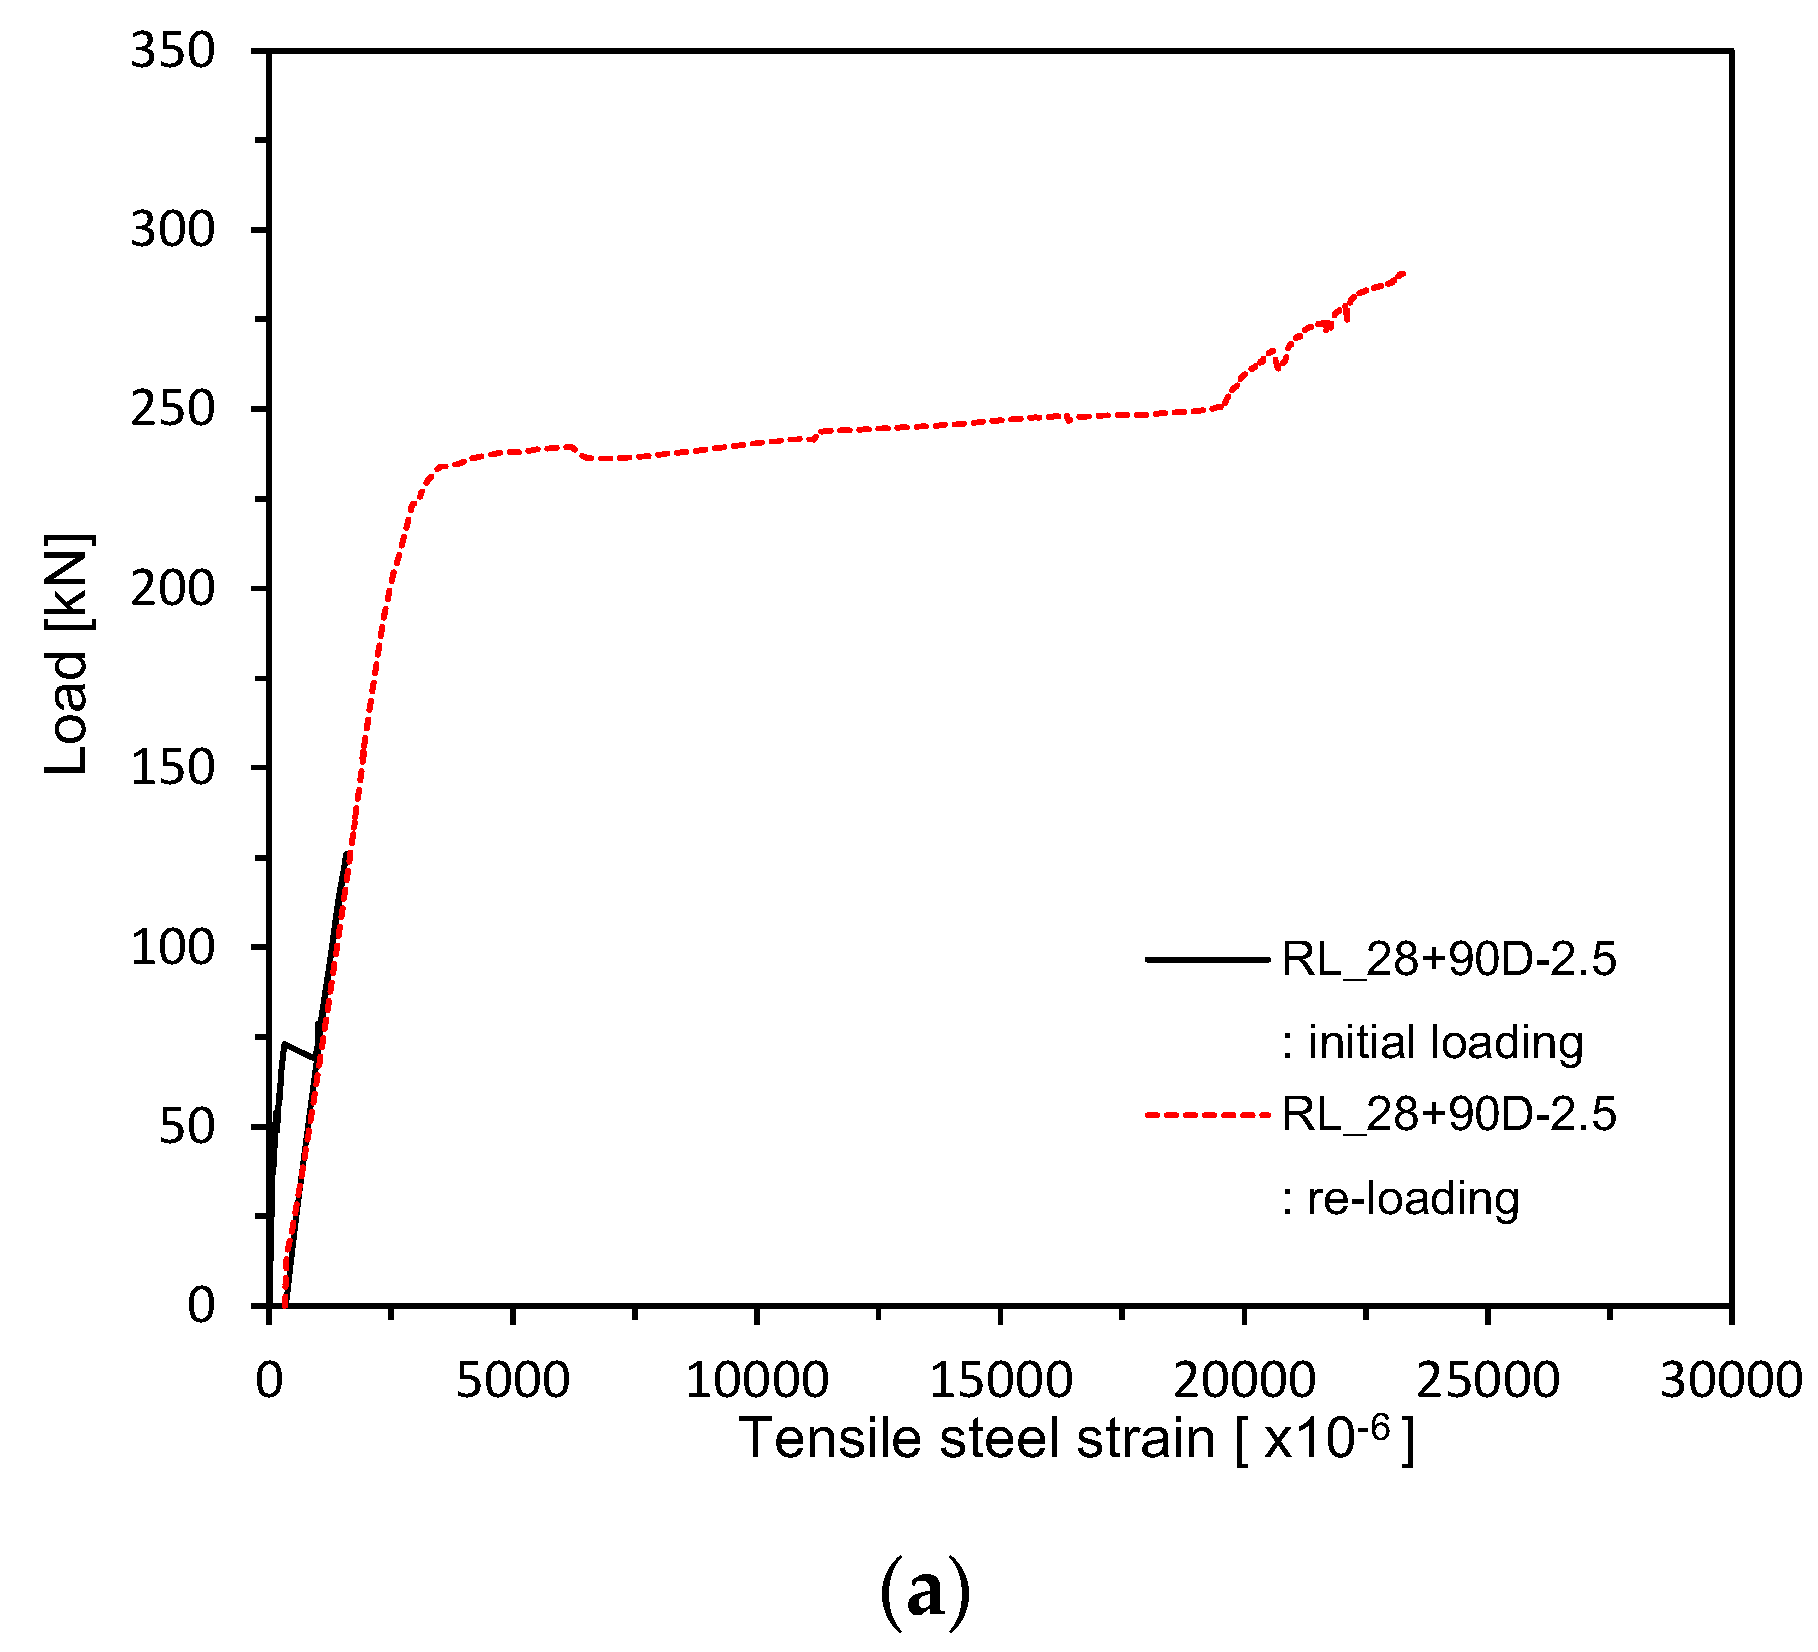
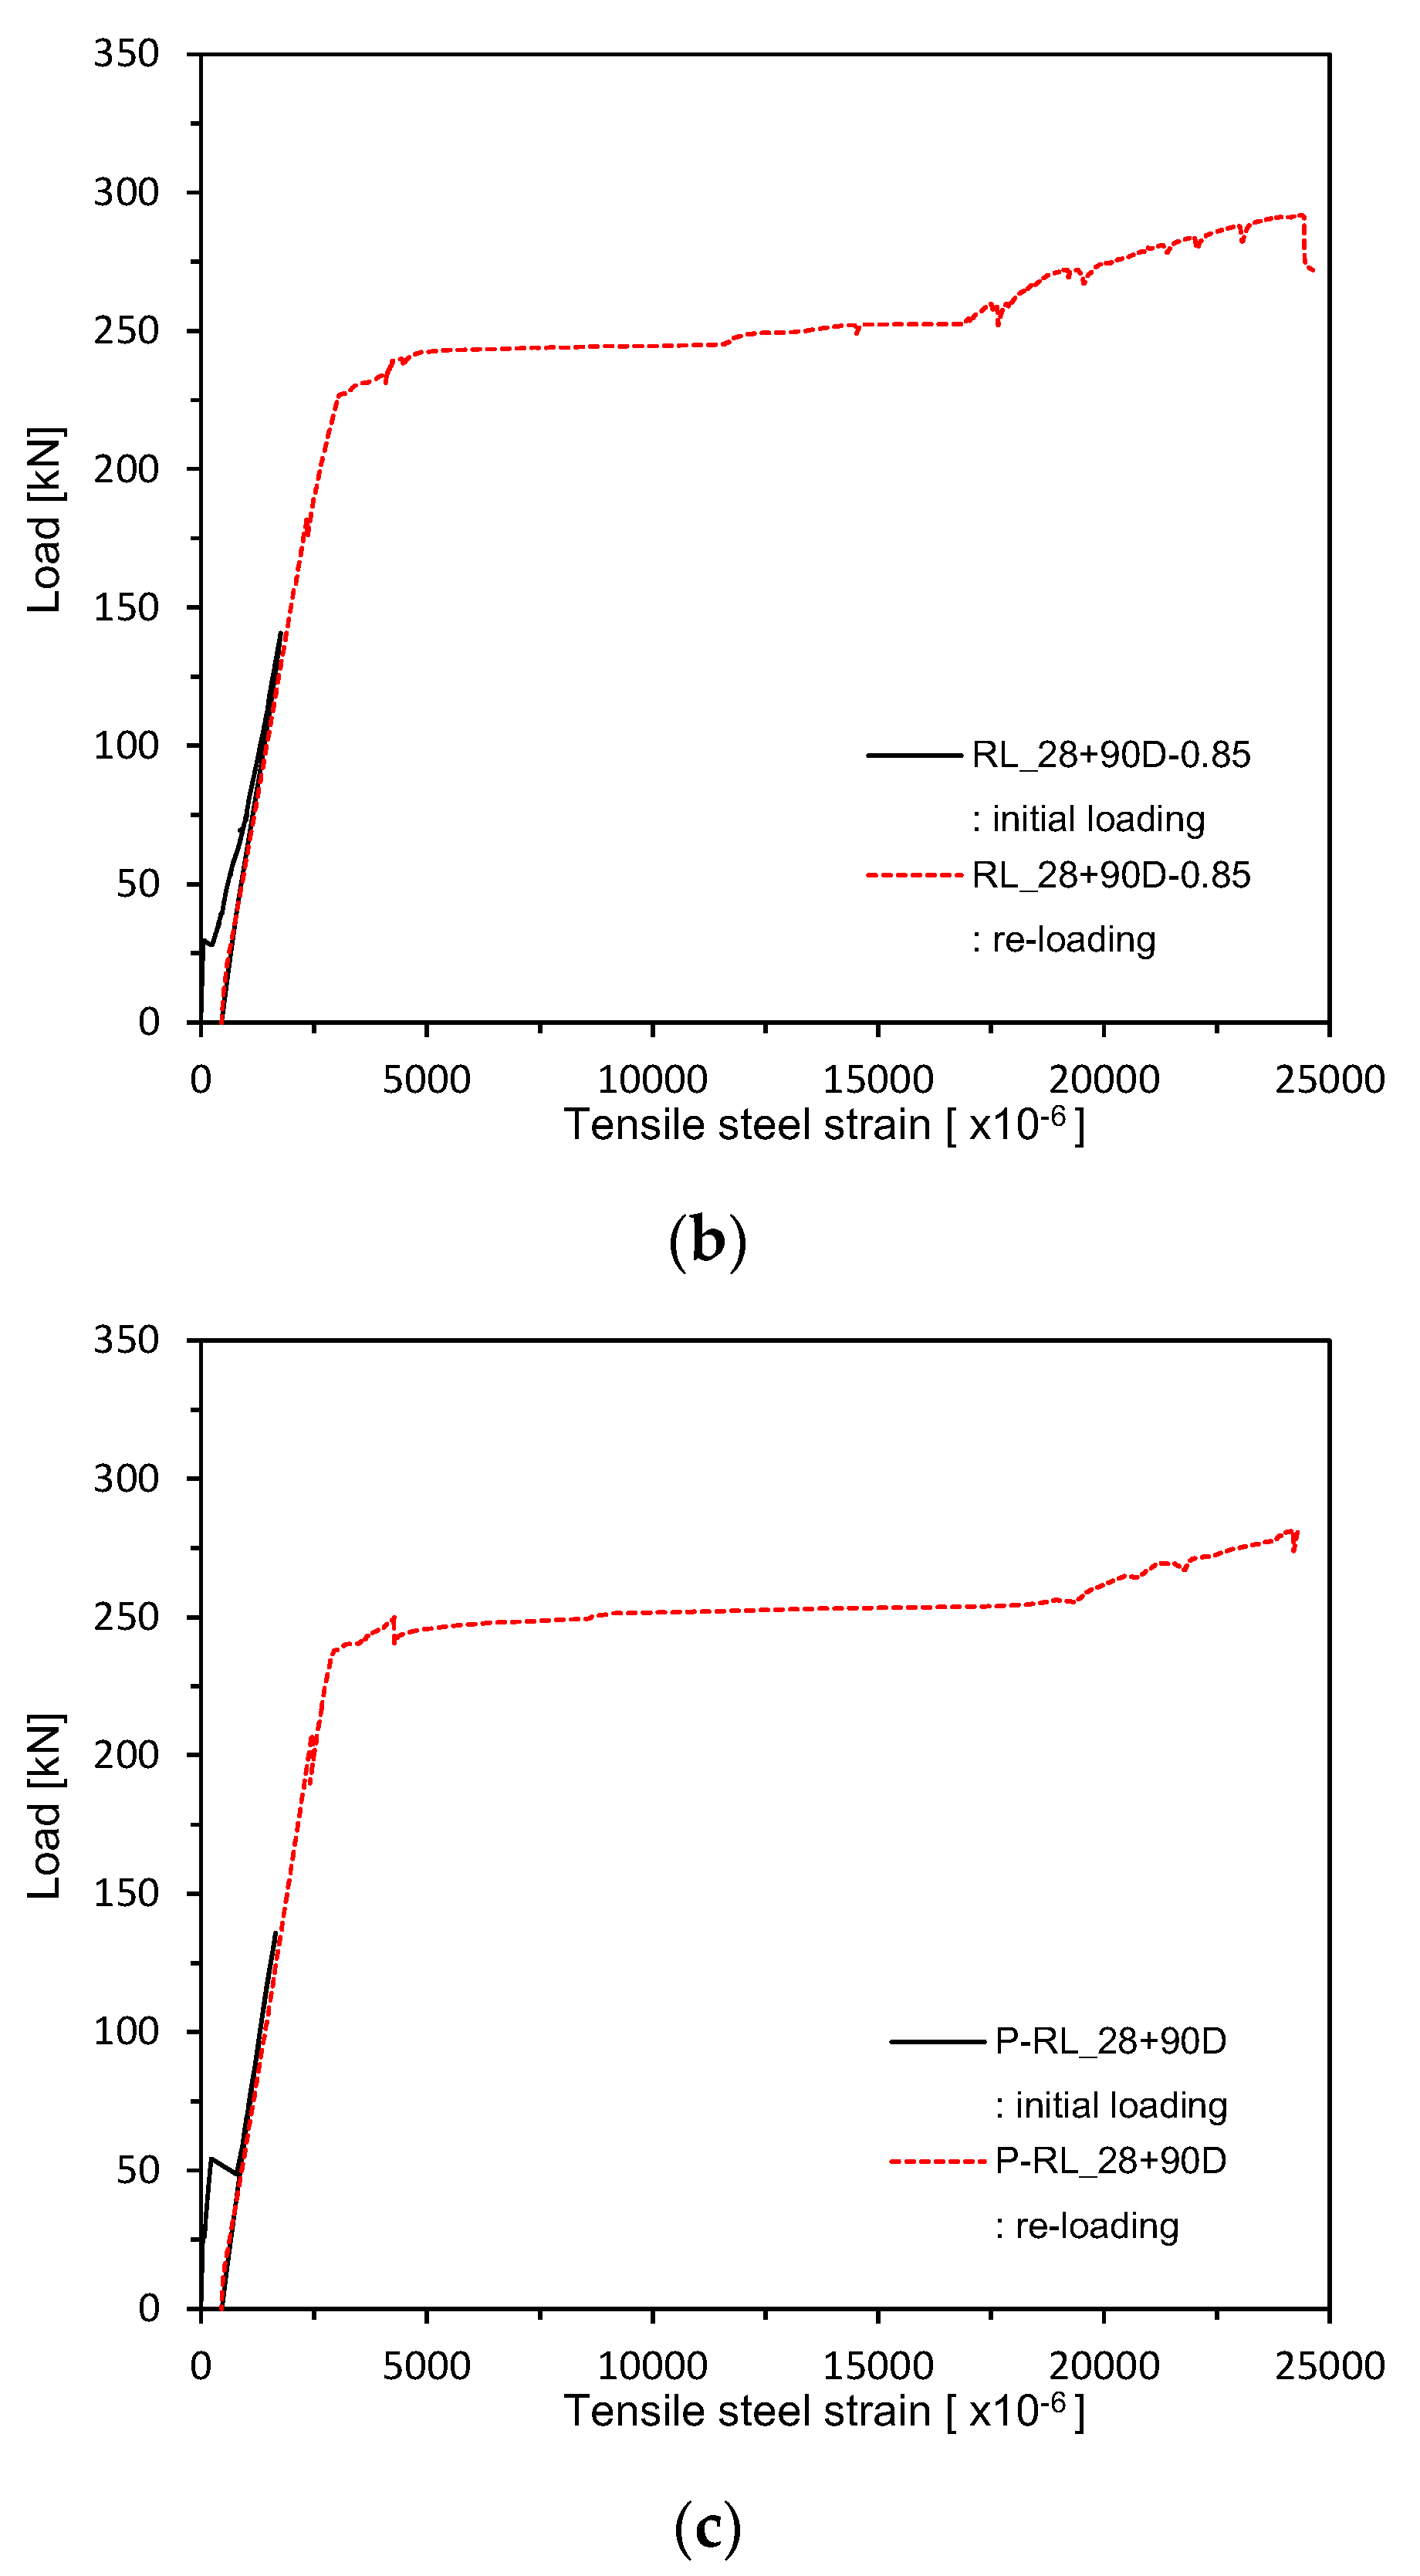
Figure 13 and Figure 14 plot the load–rebar strain relations measured after 28 days of curing. Figure 15 shows the load–rebar strain relations after pre-loading. Figure 16 plots the load–rebar strain relations after pre-loading and an additional 90 days of curing. Here, the rebar strain practically did not develop before cracking and started to increase linearly after the initiation of cracks to increase starkly after yielding.

3.2.4. Load–Concrete Strain Relations

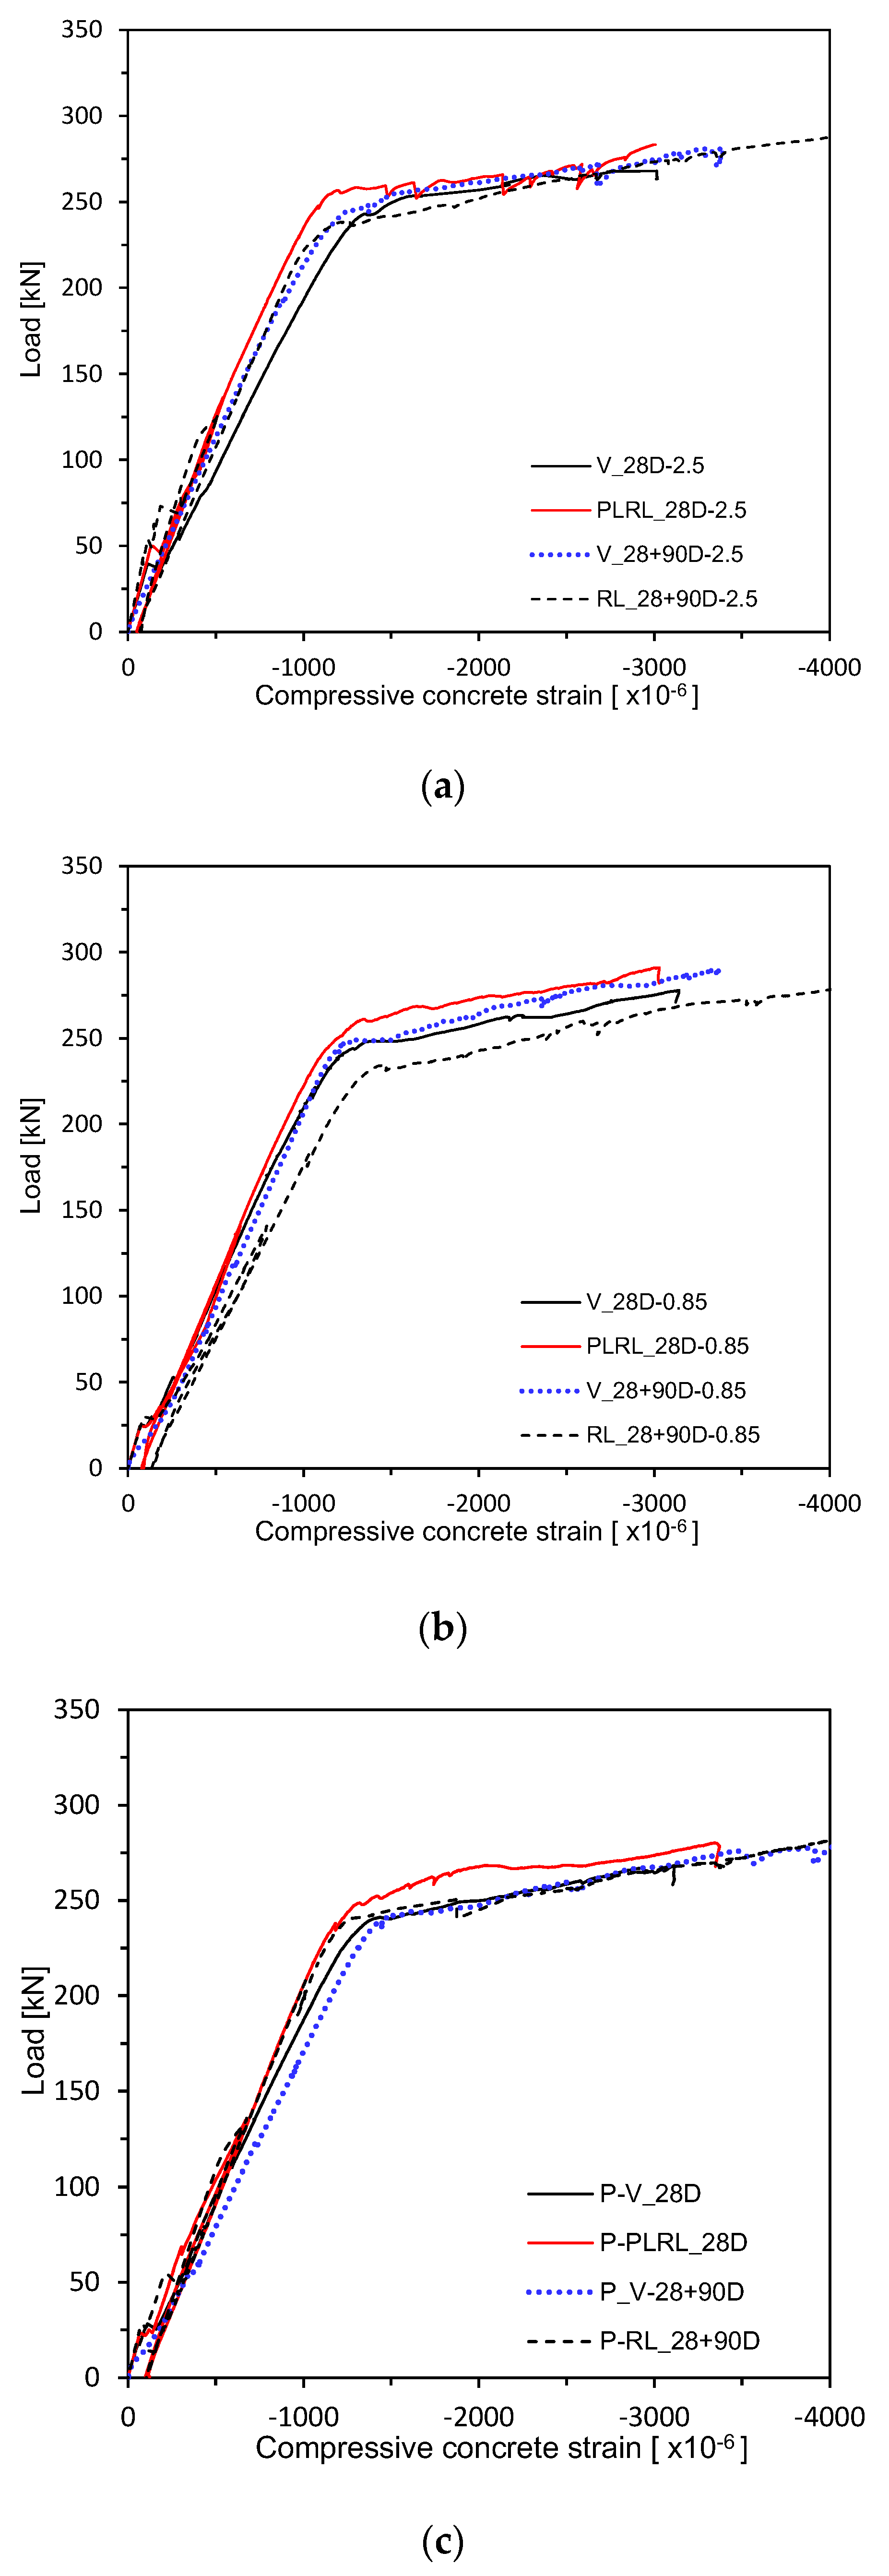
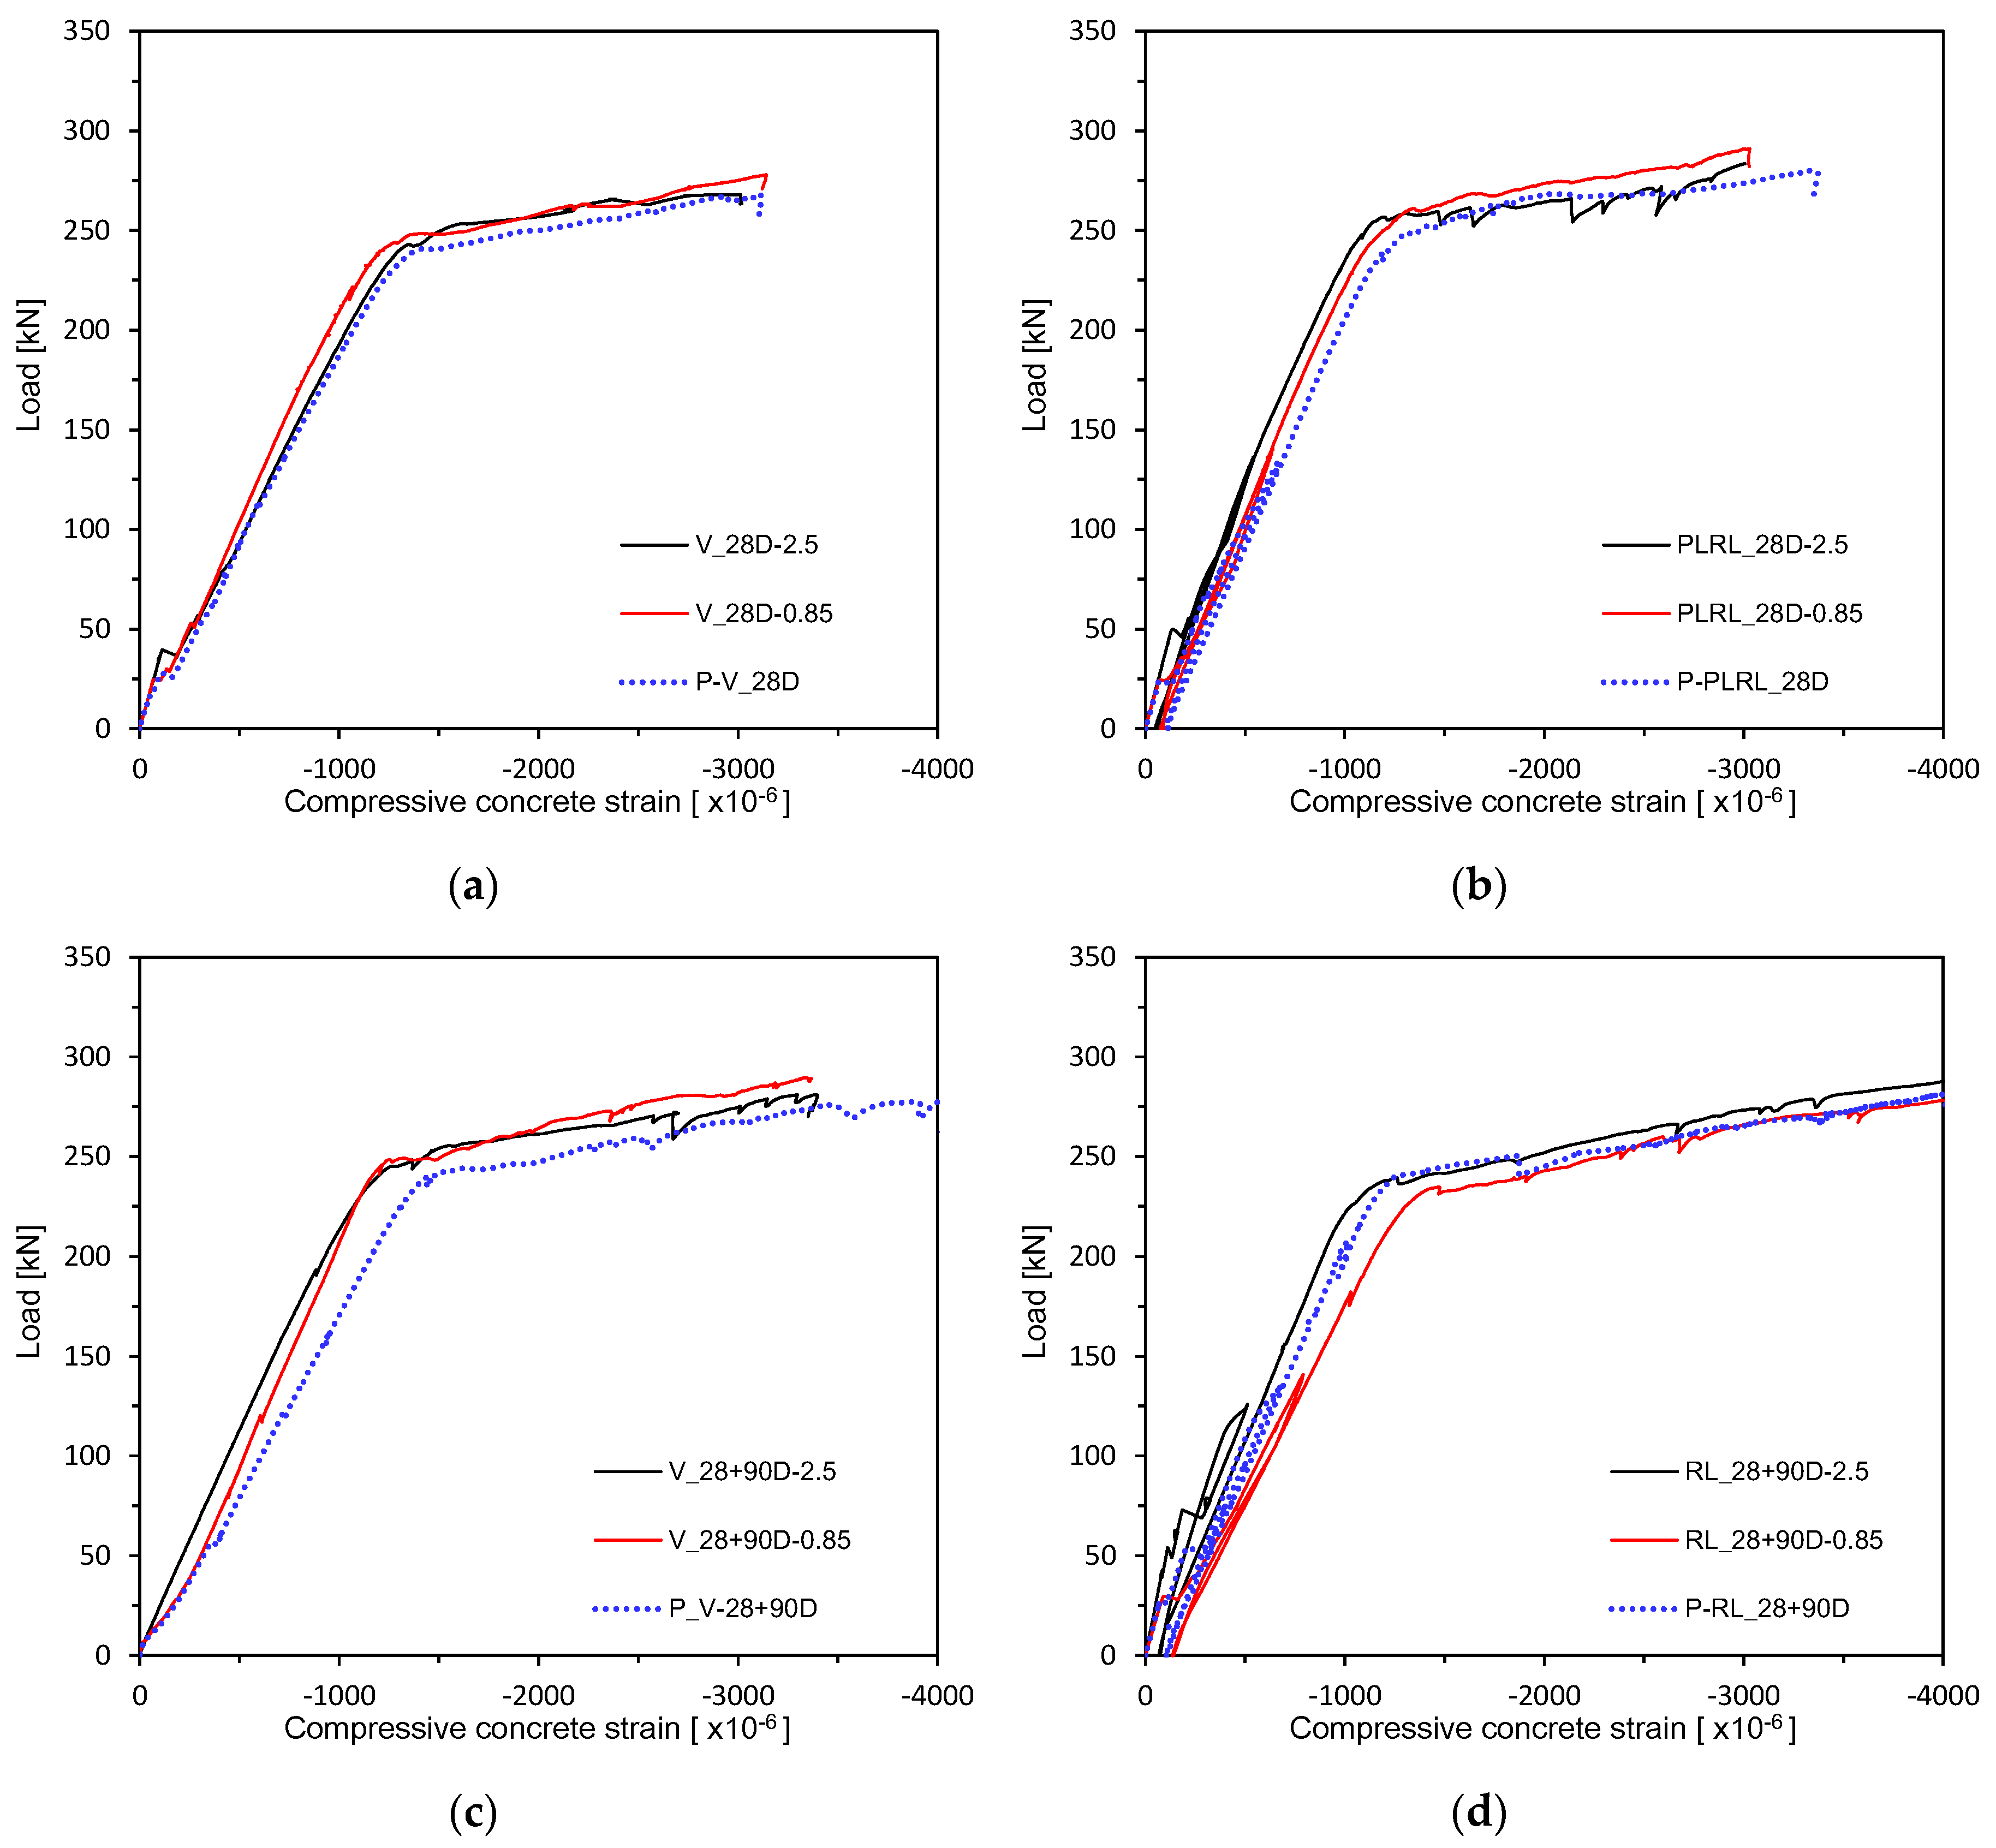
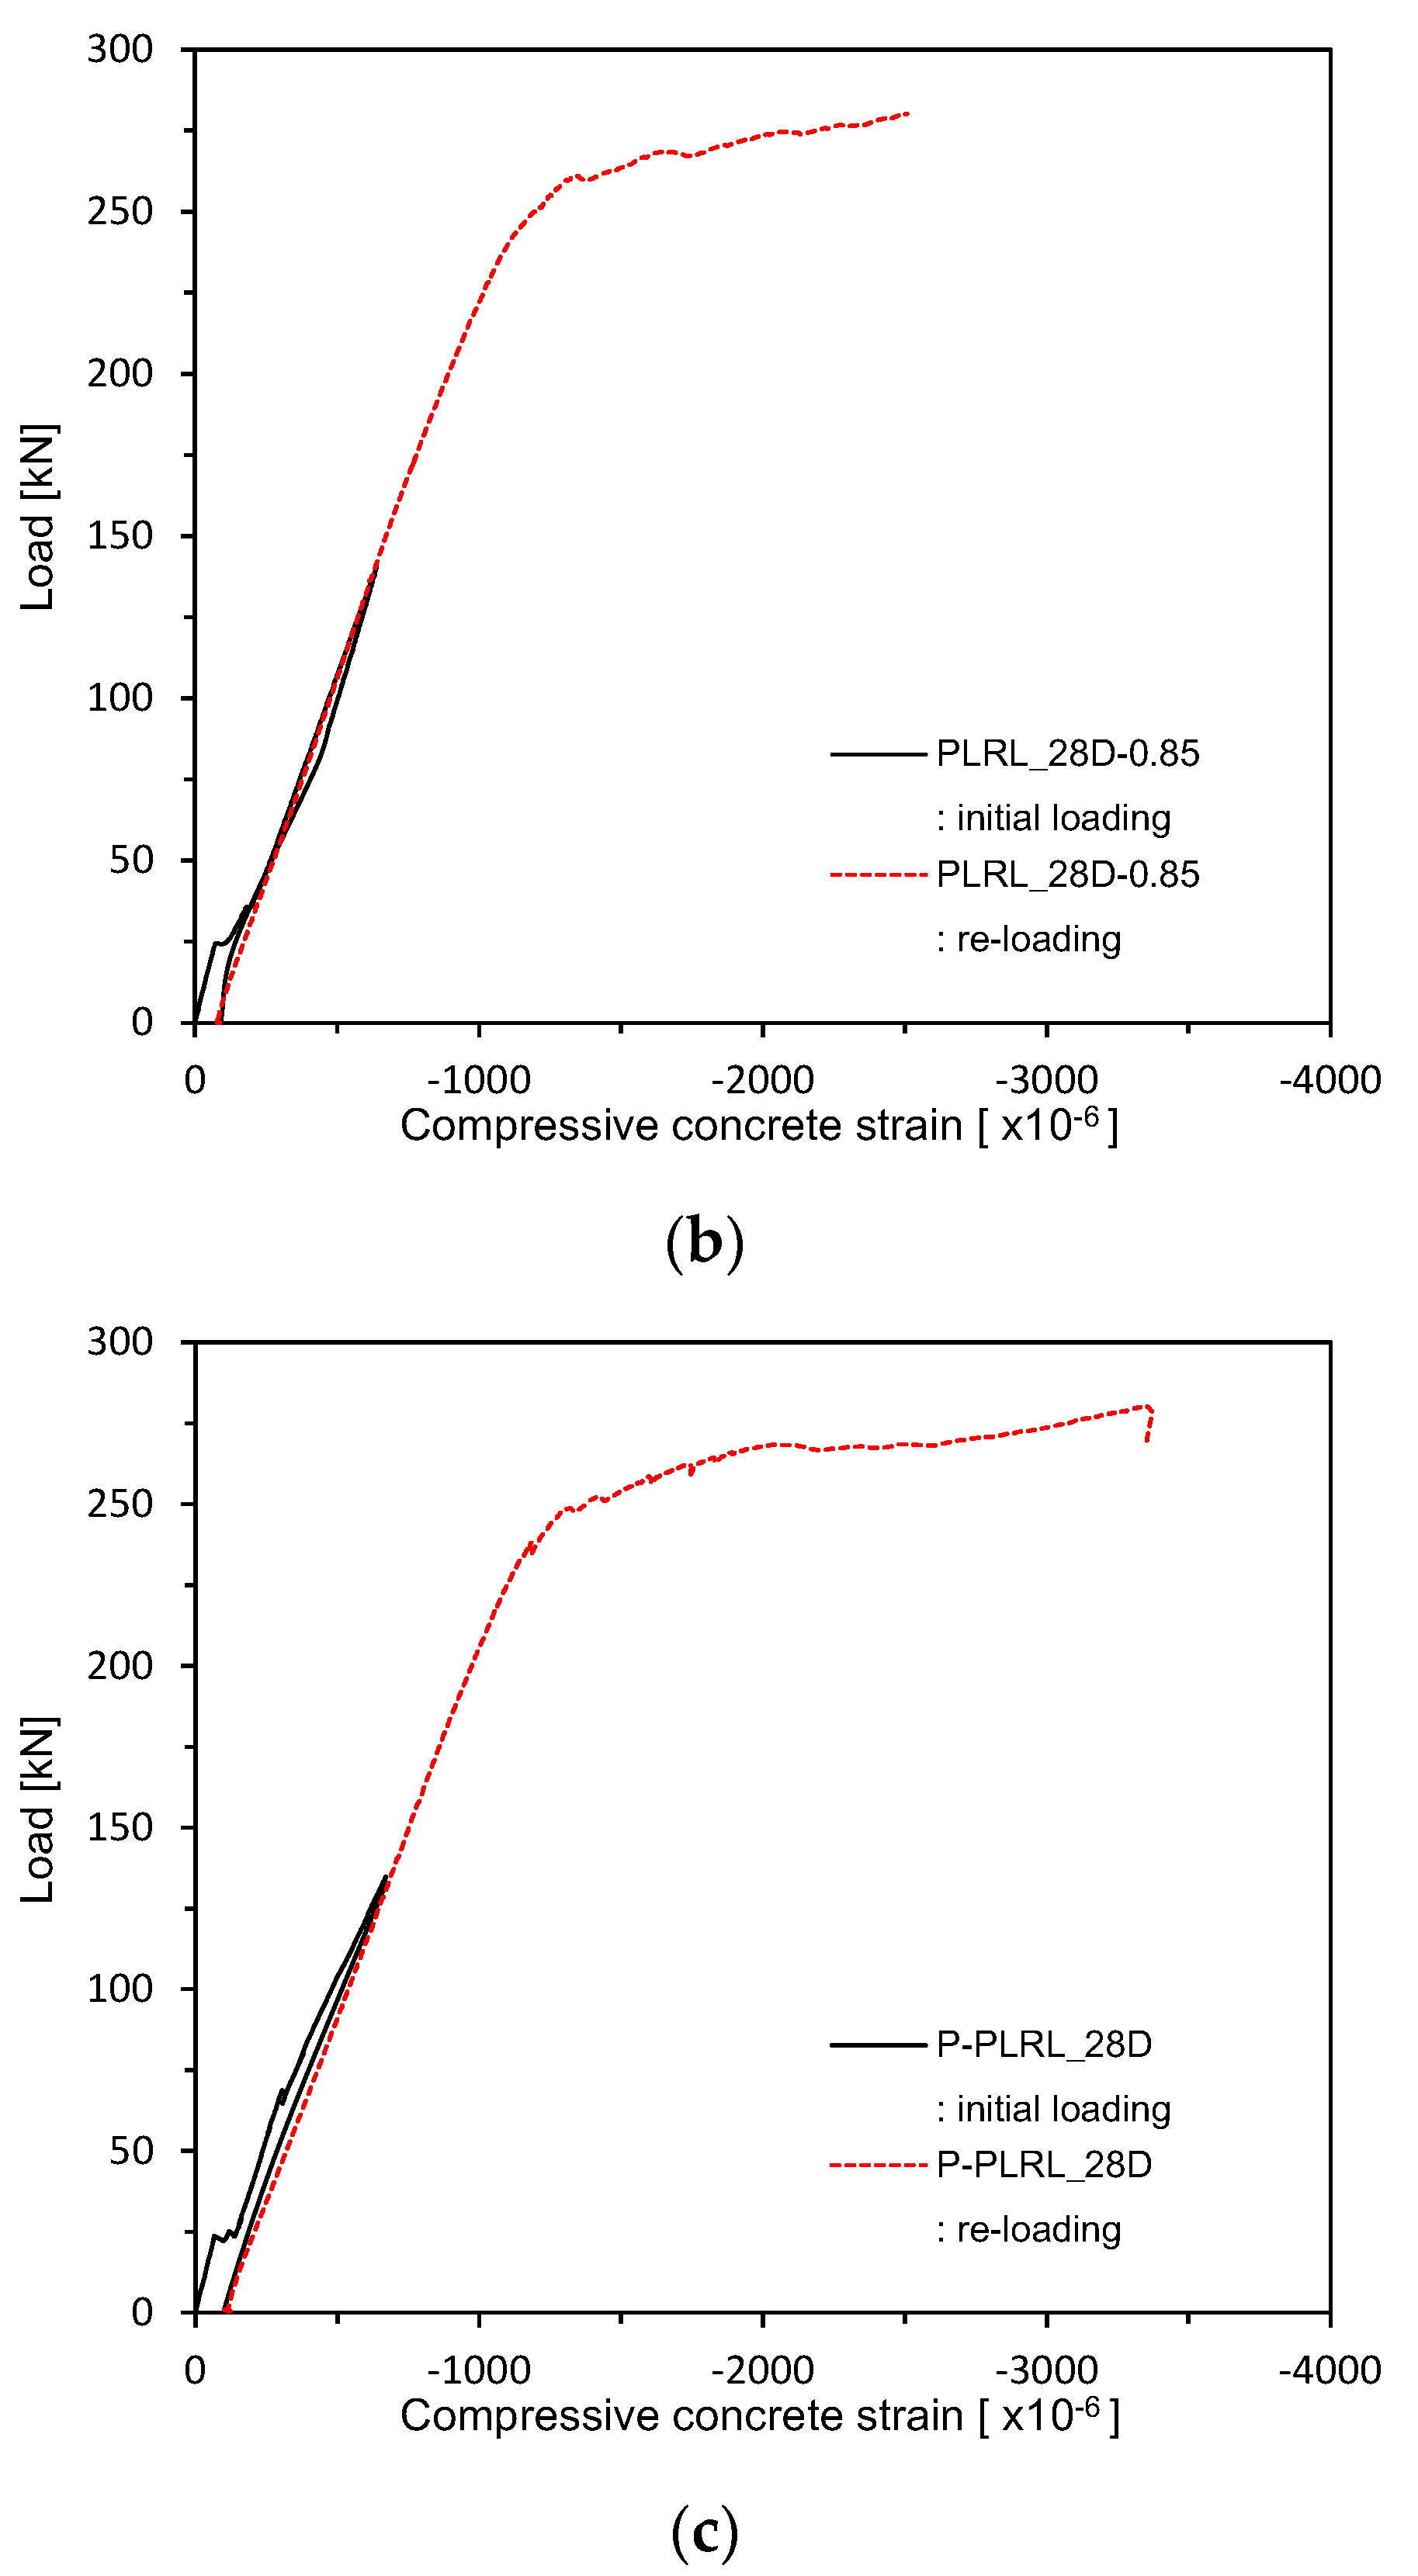
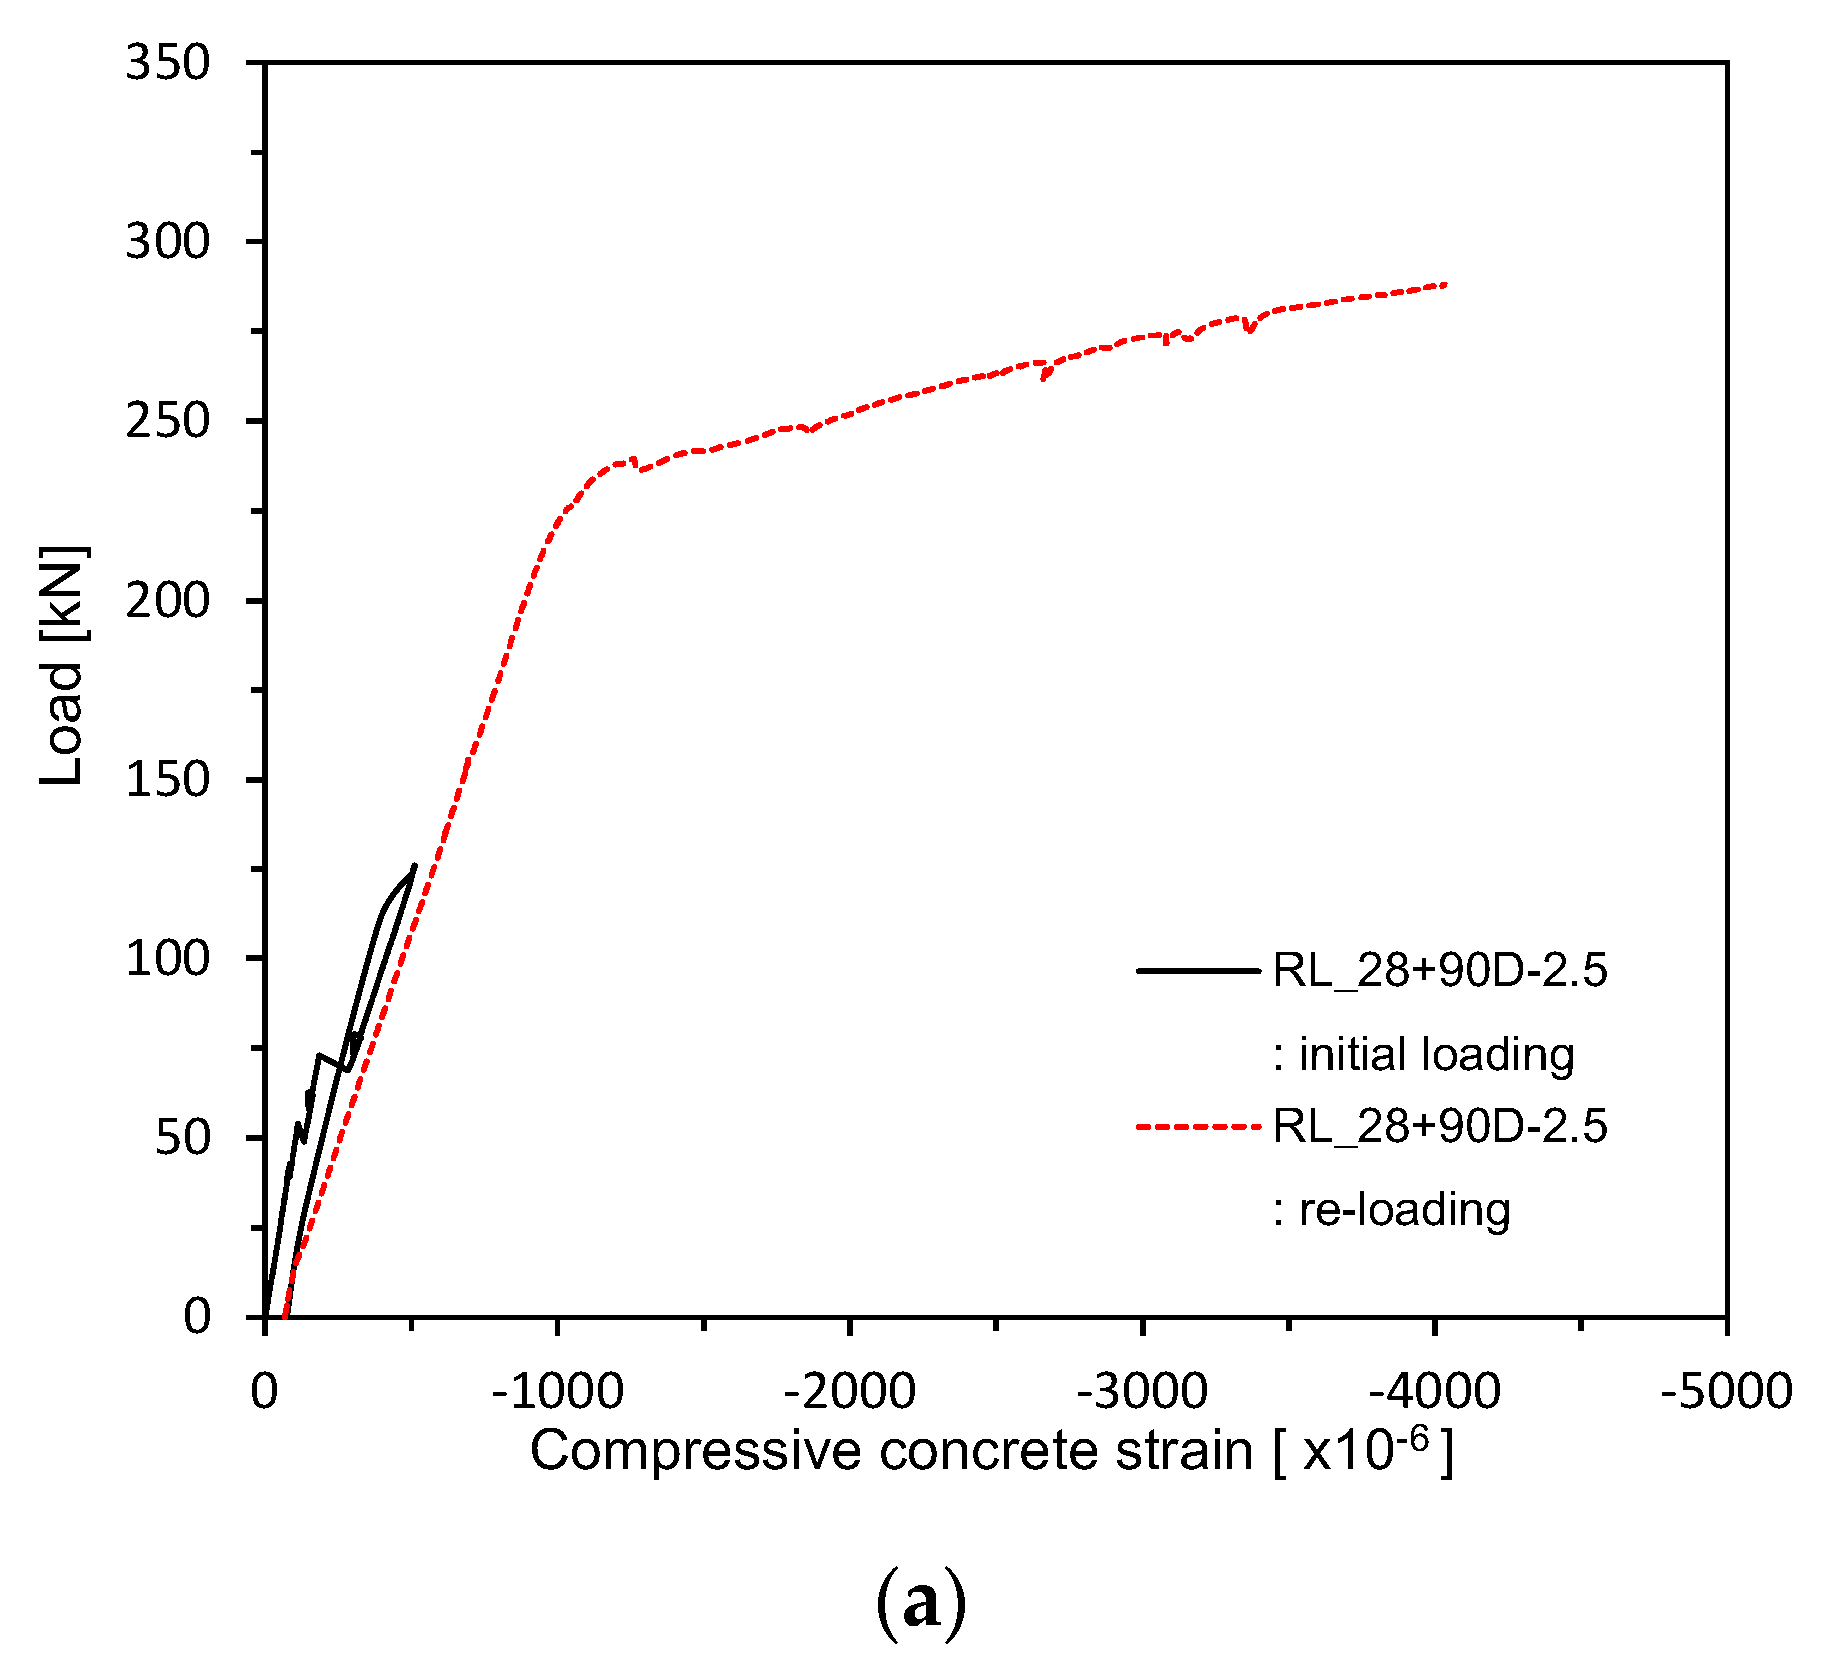
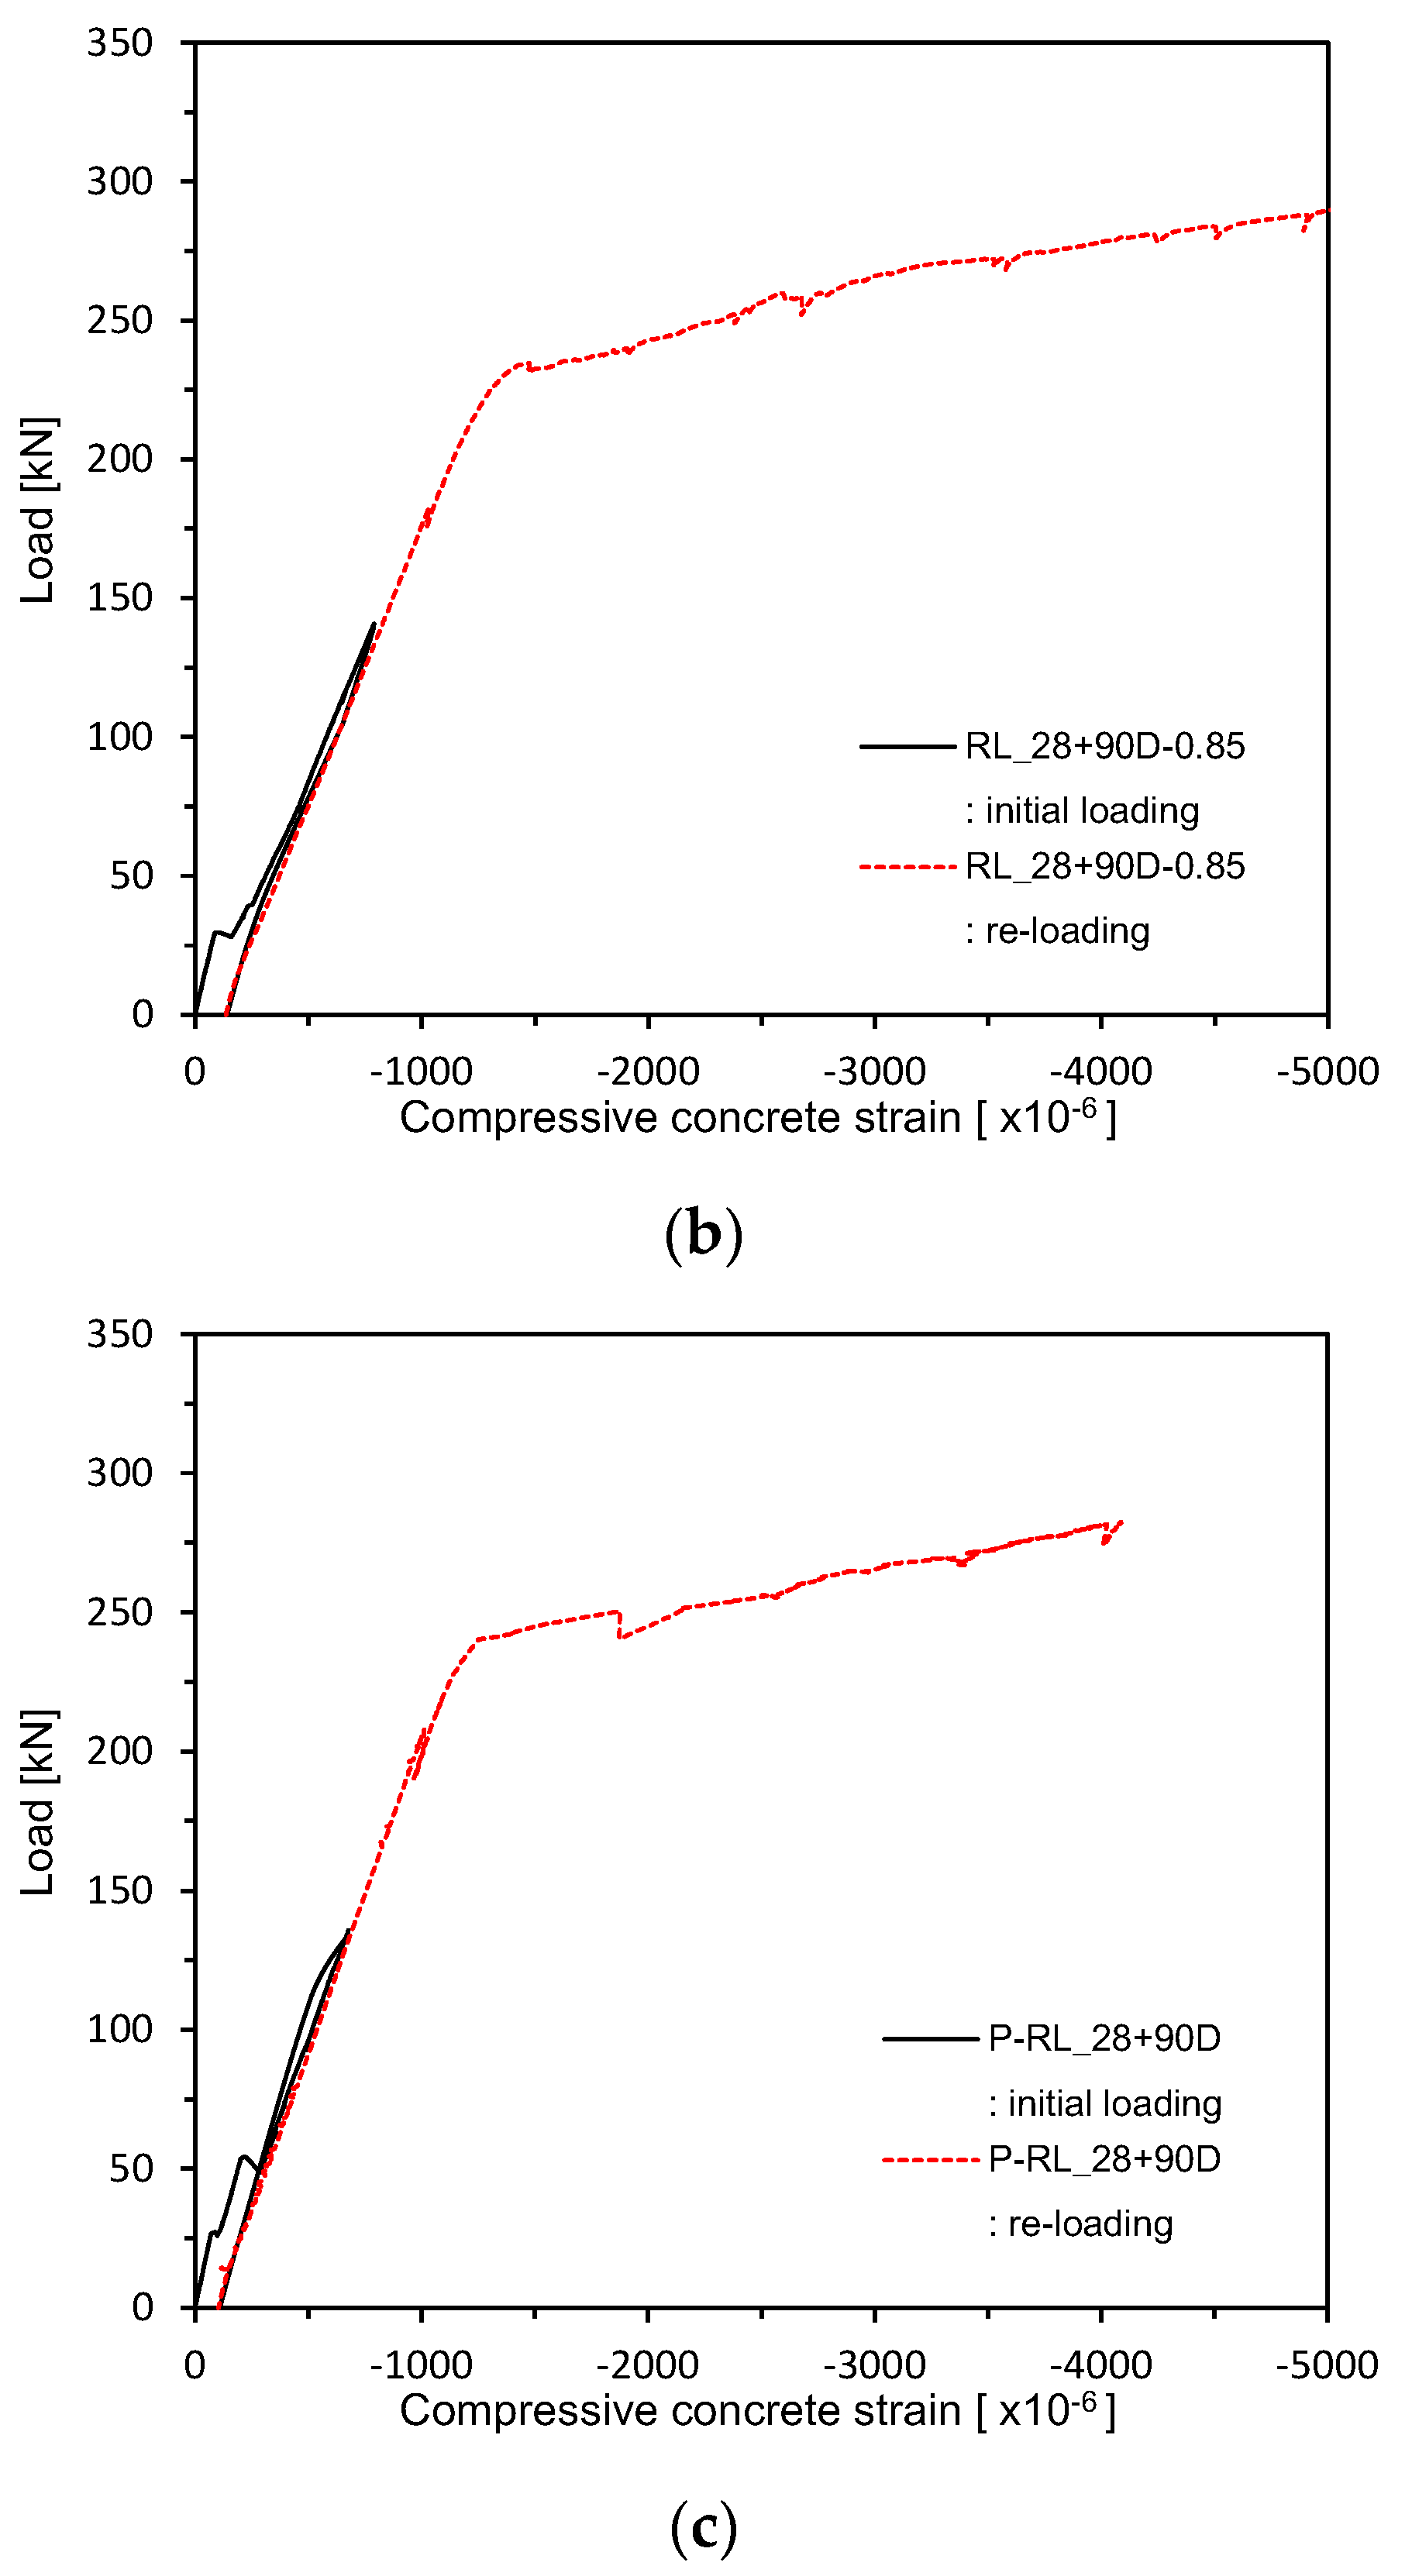
Figure 17 and Figure 18 plot the load–concrete strain relations measured after 28 days of curing. Figure 19 shows the load–concrete strain relations after pre-loading. Figure 20 plots the load–concrete strain relations after pre-loading and additional 90 days of curing. The members loaded up to the ultimate at 28 days developed ultimate concrete strain of about 0.0030 but those which experienced additional 90 days of curing saw their ultimate concrete strain be around 0.0040 due to effects of aging and residual deformation.

3.2.5. Crack Patterns

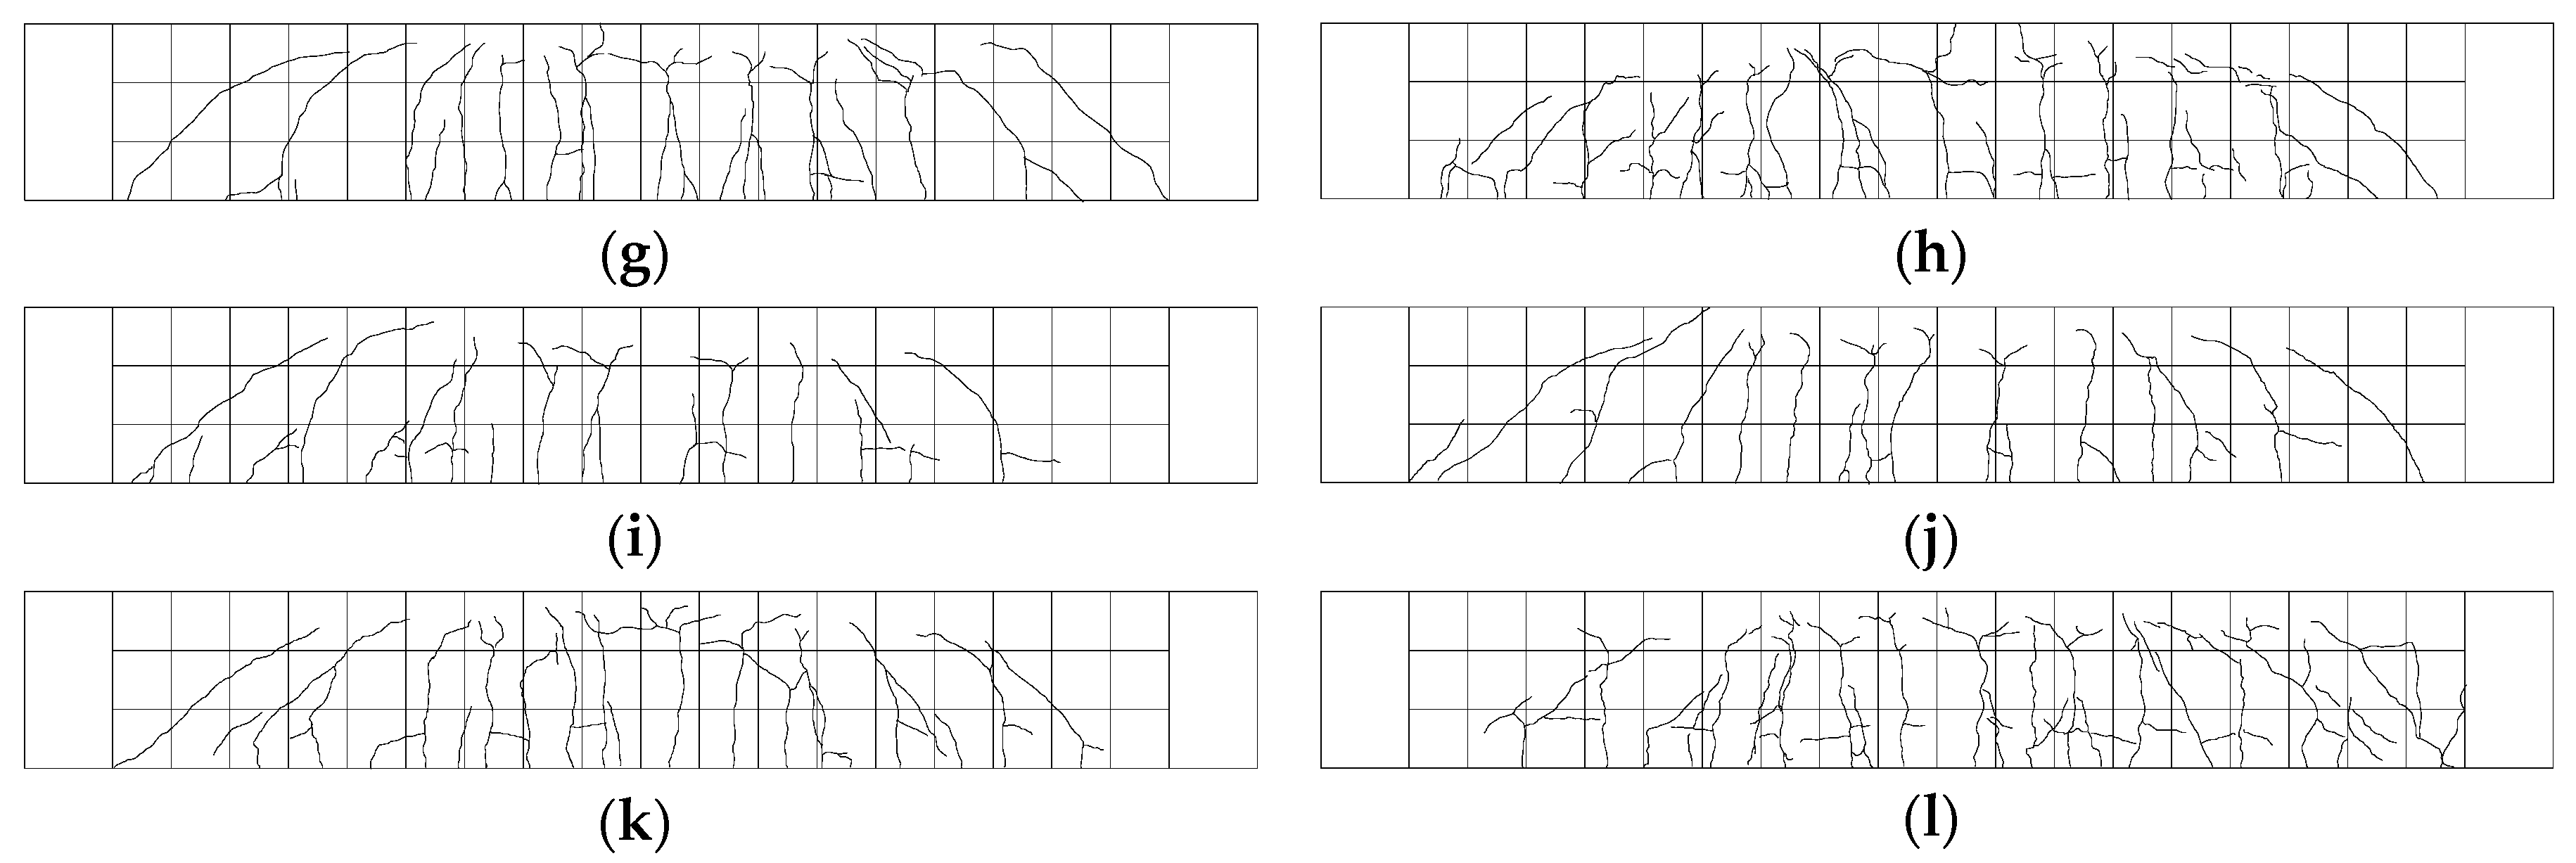
The number of vertical cracks observed in the test members ran between 10 and 15 with 11 cracks for member V_28D-2.5, 15 for member PLRL_28D-2.5, 14 for member RL_28 + 90D-2.5, 10 for member V_28 + 90D-2.5, 13 for member V_28D-0.85, 14 for member PLRL_28D-0.85, 12 for member RL_28 + 90D-0.85, 15 for member V_28 + 90D-0.85, 13 for member P-PLRL_28D, 14 for member P-RL_28 + 90D, and 13 for member P-V_28 + 90D. The crack pattern after the flexural test of the test members is shown in Figure 21. All the members experienced flexural cracking and flexural failure.

4. Discussion of Results

4.1. Visual Observation of Crack Healing Effect

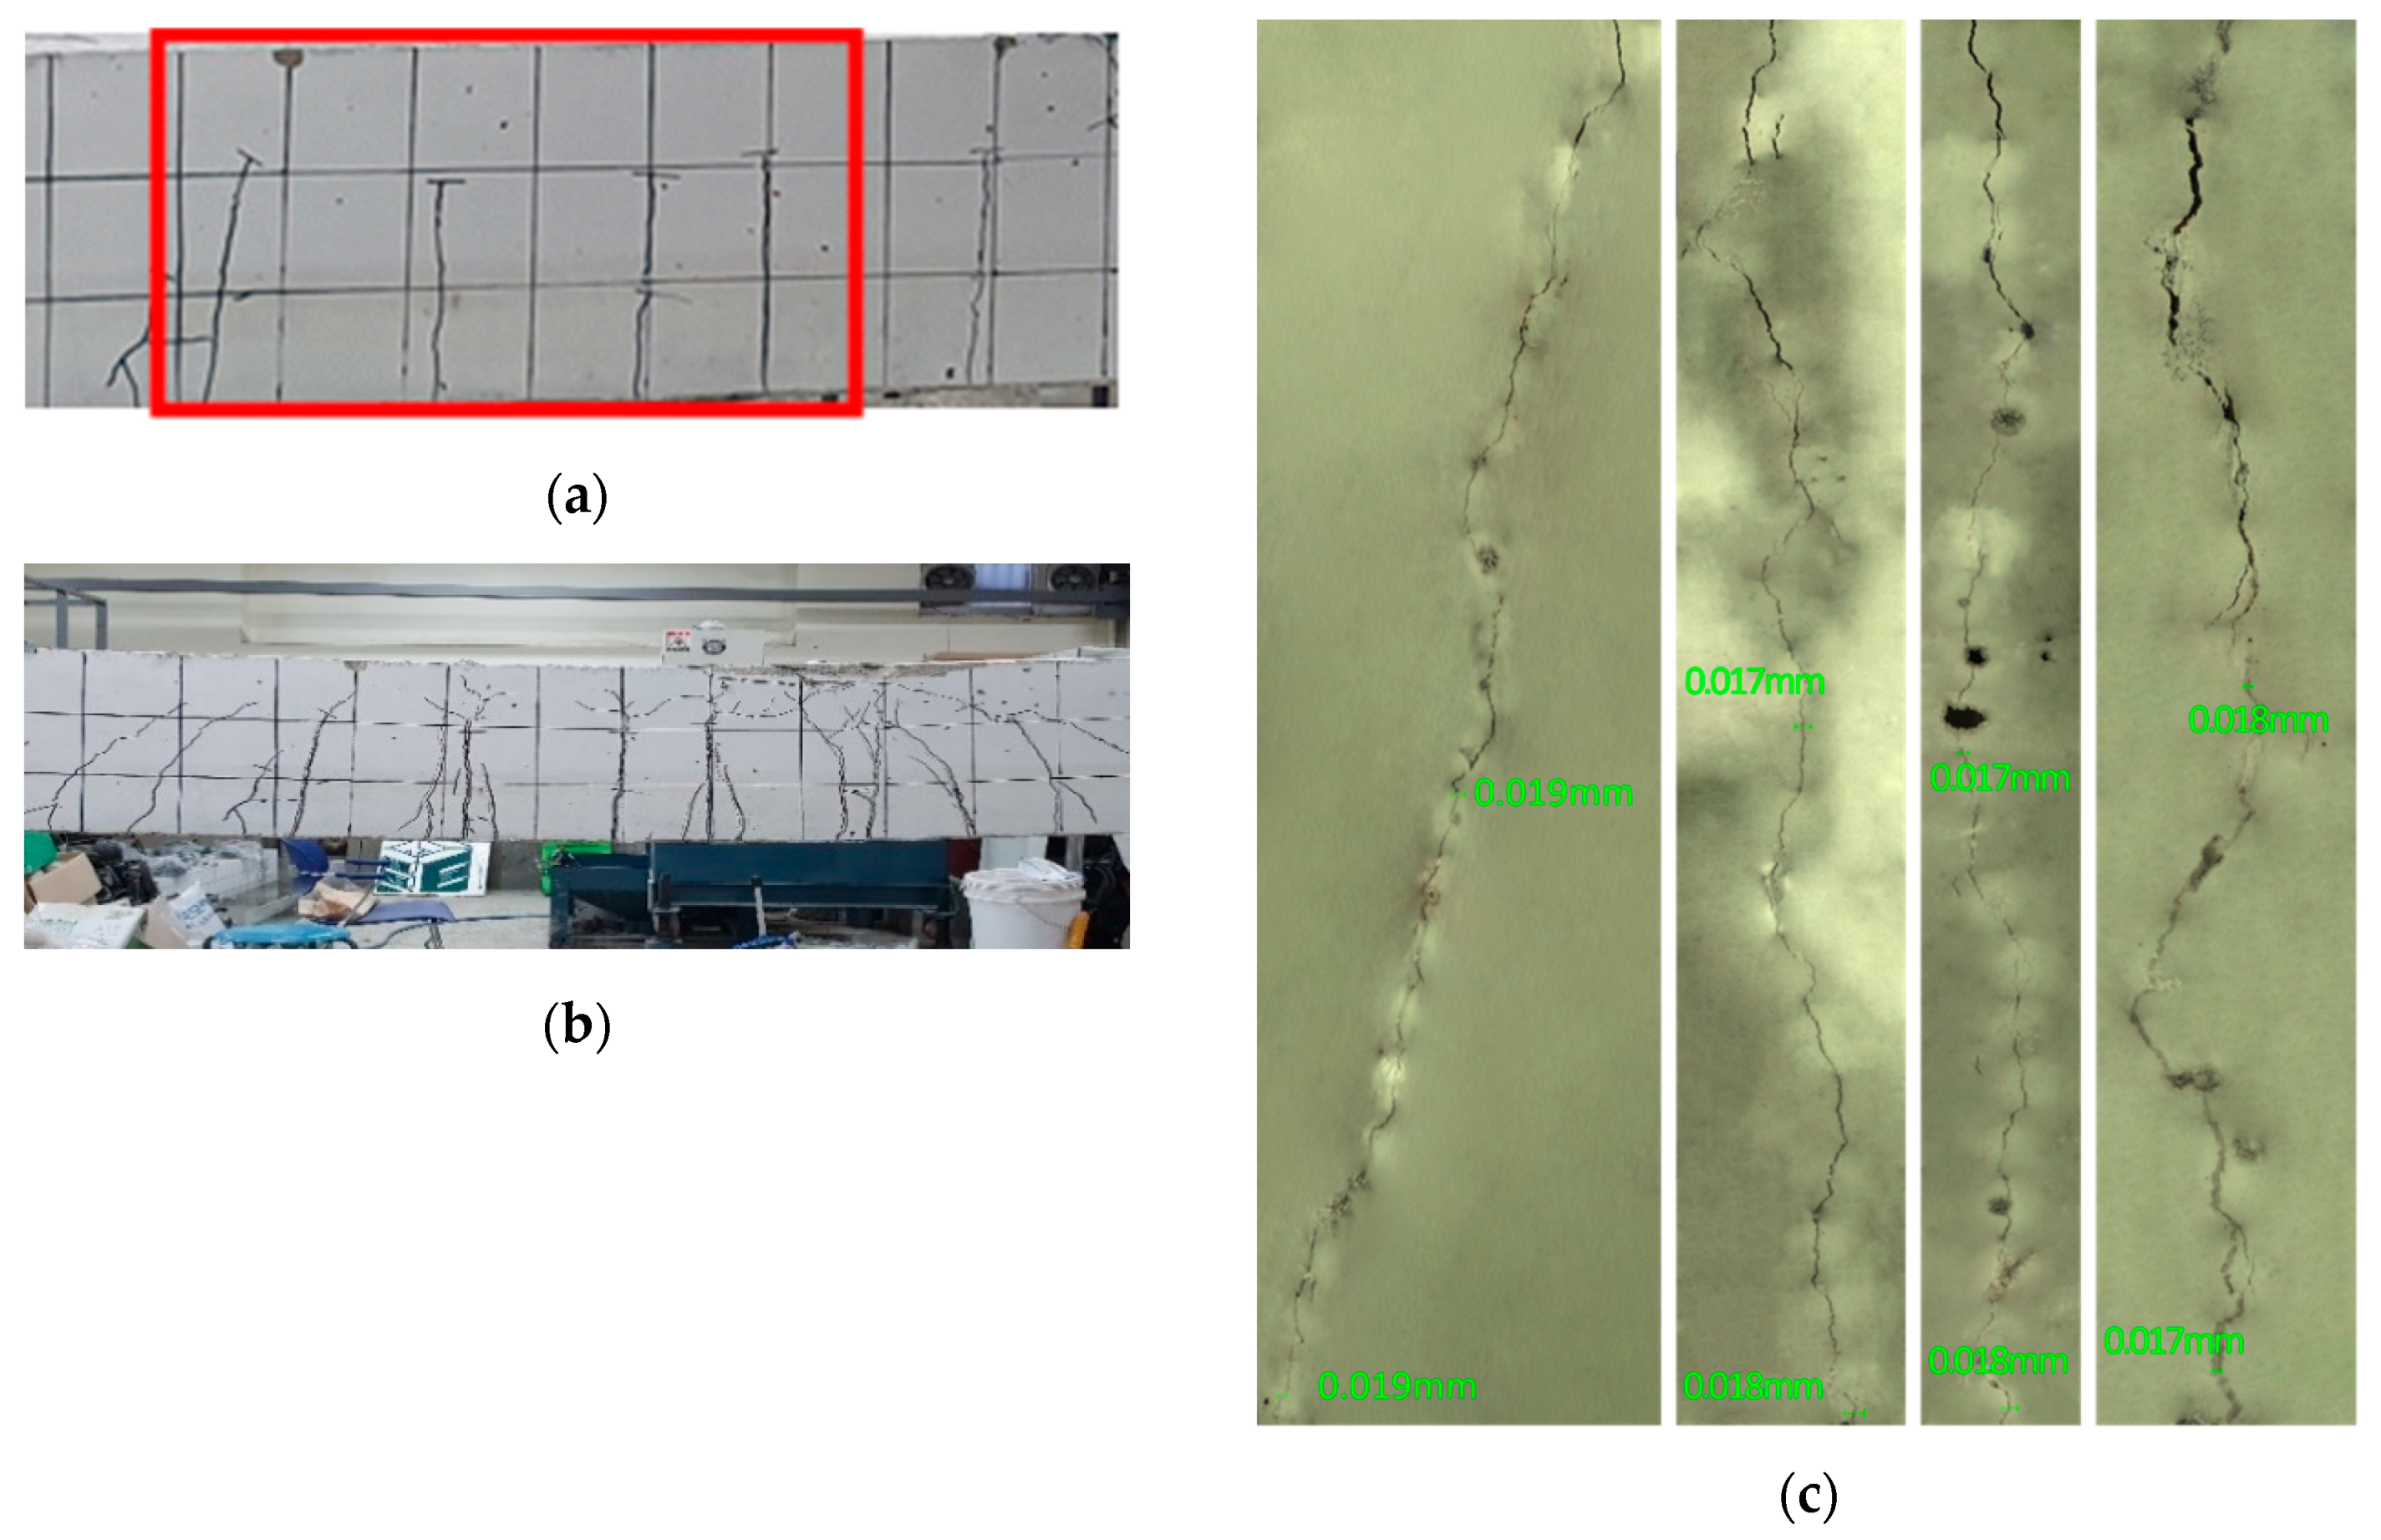
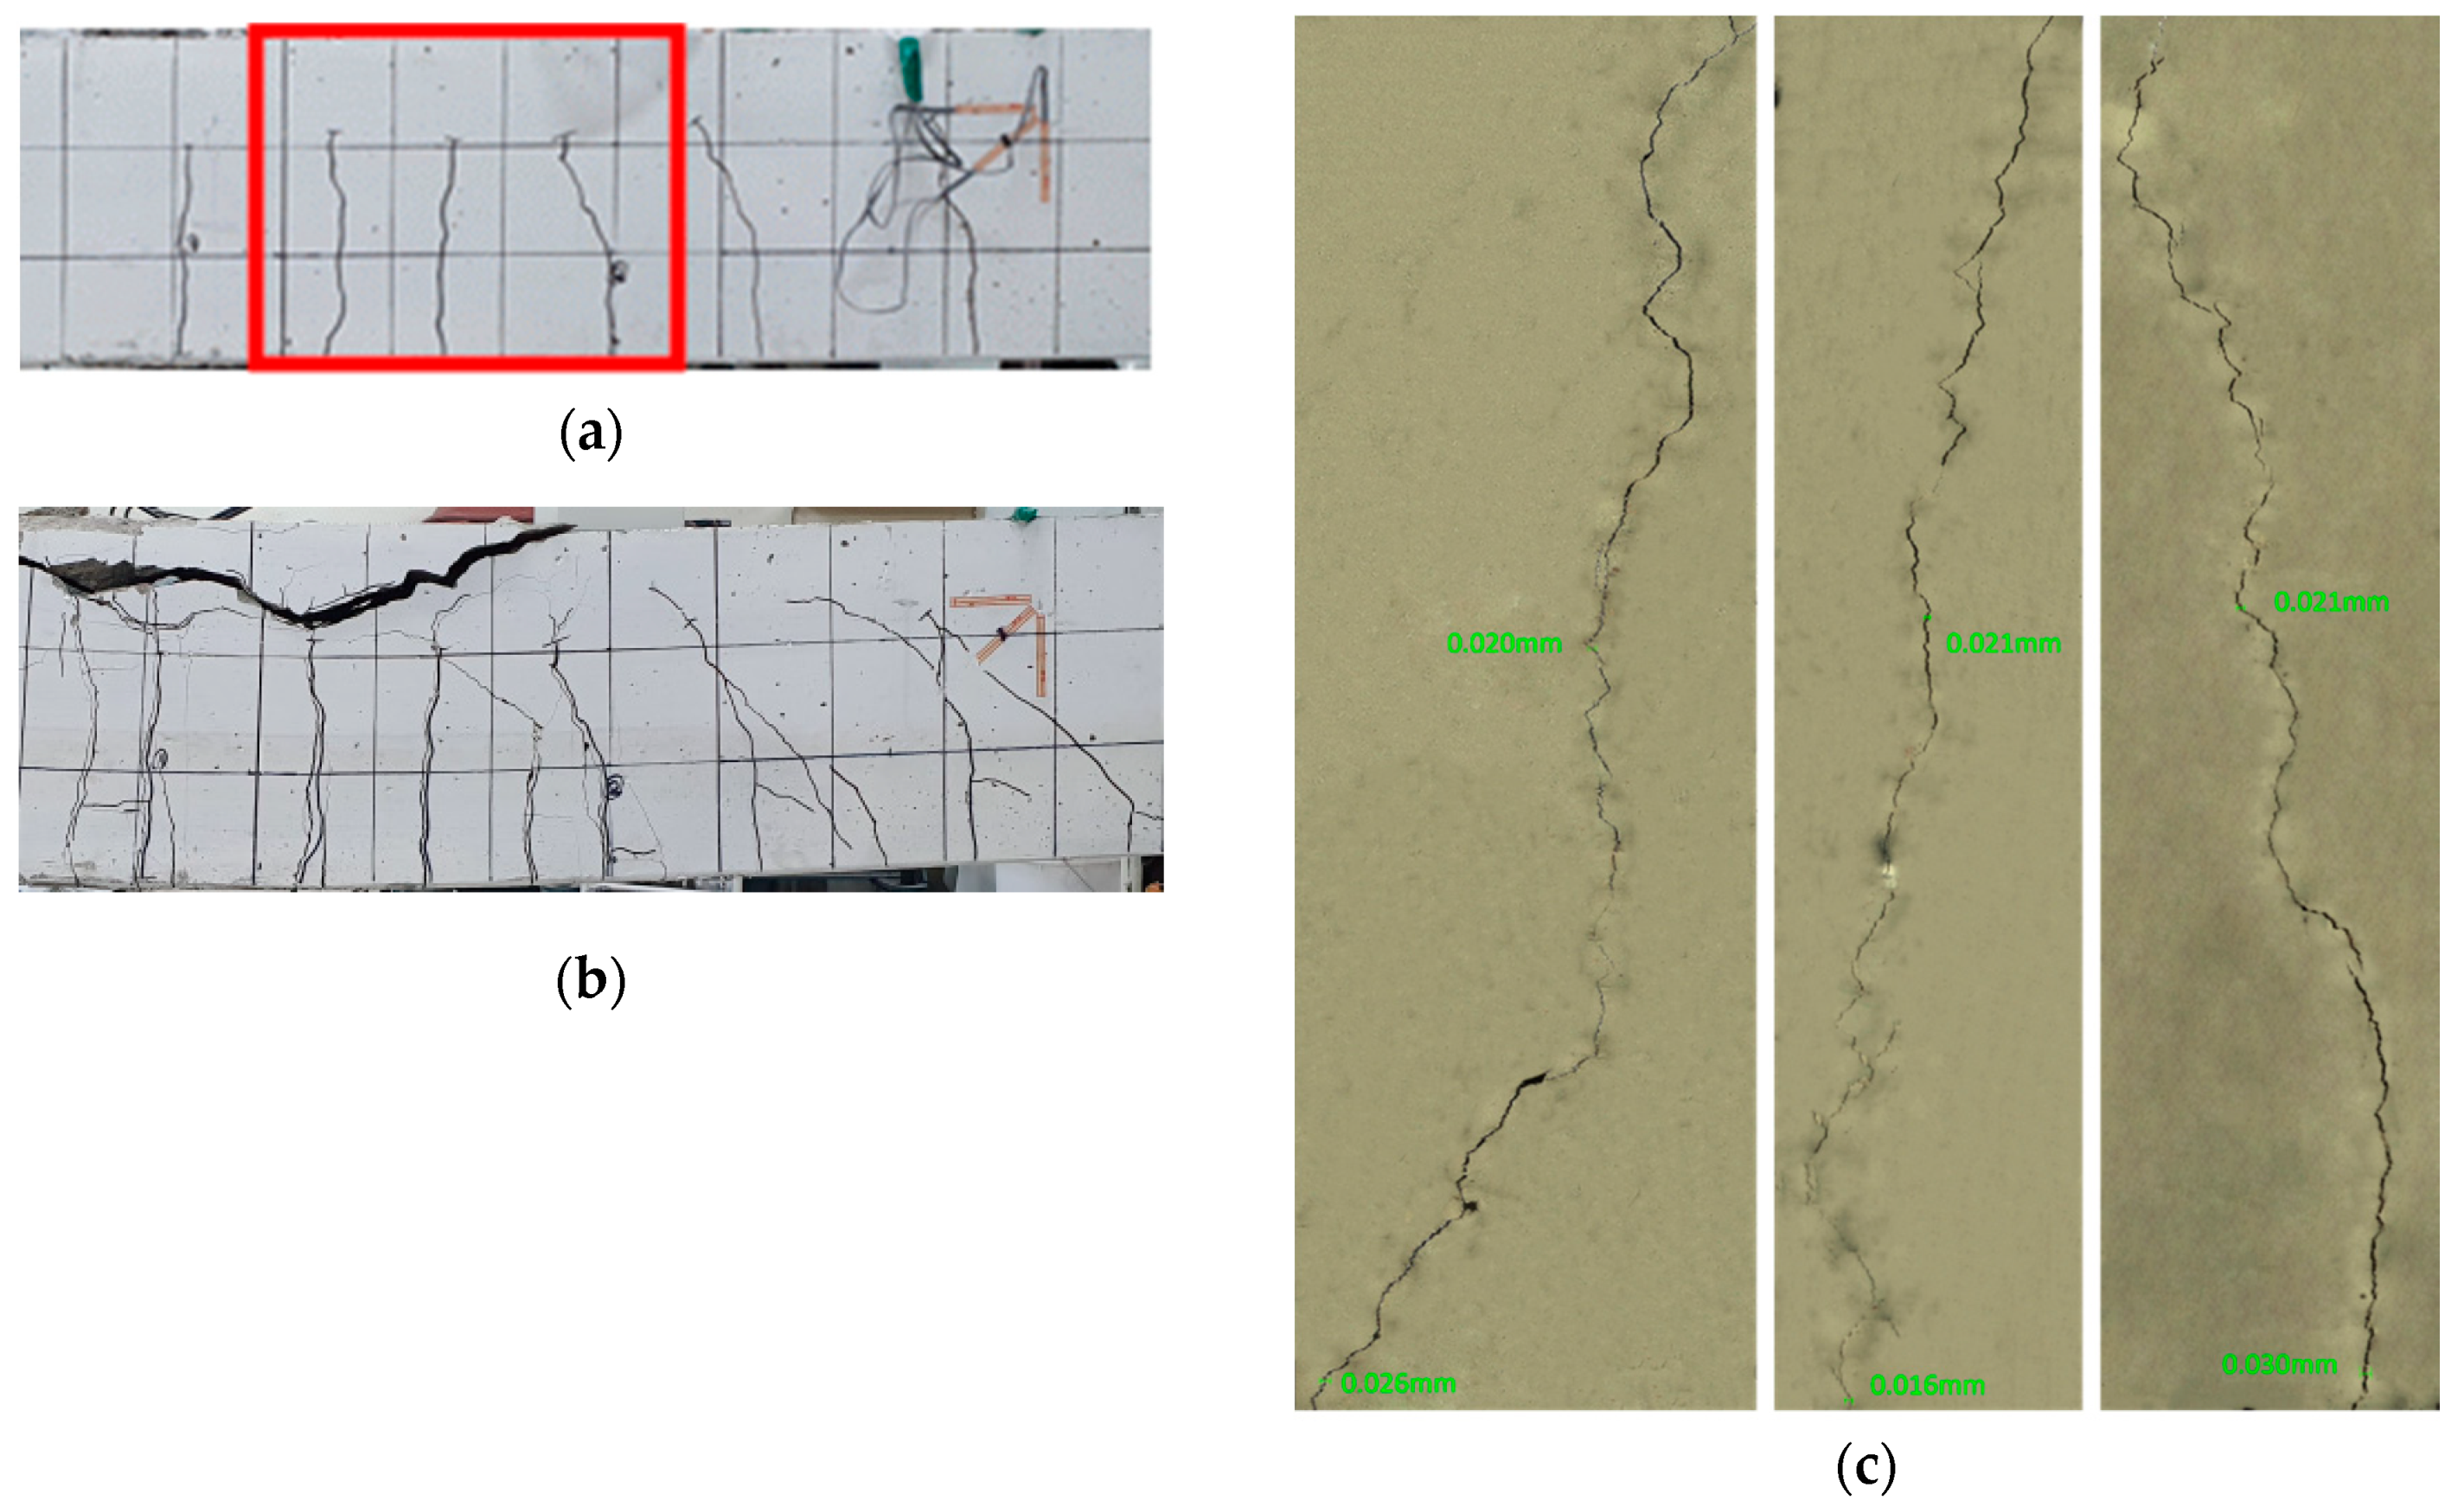
Figure 22, Figure 23 and Figure 24 illustrate the cracks and healing of the test members after pre-damage at 28 days and after the additional 90 days of curing. The target crack width before loading of the members pre-loaded up to 50% of the ultimate load was 0.16 mm. In view of the figures, the maximum crack width after 90 days of additional curing ranged between 0.019 and 0.053 mm. Such a result can be attributed to various factors like the crack closure generated by the removal of the load and the autogenous healing.
The enlarged images of the cracks reveal that the 0.85-series members replacing binder by 100% of clinker achieved the best crack healing performance. The 2.5-series members replacing each binder and aggregates by 50% of clinker exhibited crack healing performance in-between that of the P-series members without clinker and that of the 0.85-series members.
An attempt to objectively quantify the crack healing effect is achieved by measuring the crack distribution density from the observed crack patterns shown in Figure 21. Table 9 arranges the crack distribution density of the flexural specimens obtained by counting the number of cracks at the bottom of the members and dividing this number by the member’s length (2000 mm). All the specimens experienced a similar number of vertical cracks. Moreover, the overall crack pattern observed in the beam members were similar to those of the experimental results reported by Alyousif [35].
A closer look reveals that, for the 0.85-series members, the RL-series members that suffered pre-damage exhibit relatively smaller crack density than the V-series members which did not experience pre-damage. Besides, the opposite occurs for the P-series and 2.5-series members. This situation can be credited to the fact that, compared to the 2.5-series members, the 0.85-series members exhibit a strong healing effect for cracks thinner than 200 μm, which reduces the number of cracks, but does not heal wider cracks, which experience crack opening under reloading. This phenomenon becomes more acute in older members. According to the studies by Sunayana and Barai [36] and Sturm et al. [37], the closer cracking spacing in the beams might be caused by the effect of high shrinkage in beams. In other words, the healing effect improves with time. Consequently, the fine grain size of clinker makes it possible to replace fine aggregates and longer healing time increases the crack healing effect.

4.2. Evaluation of Crack Healing Effect by Water Flow Test

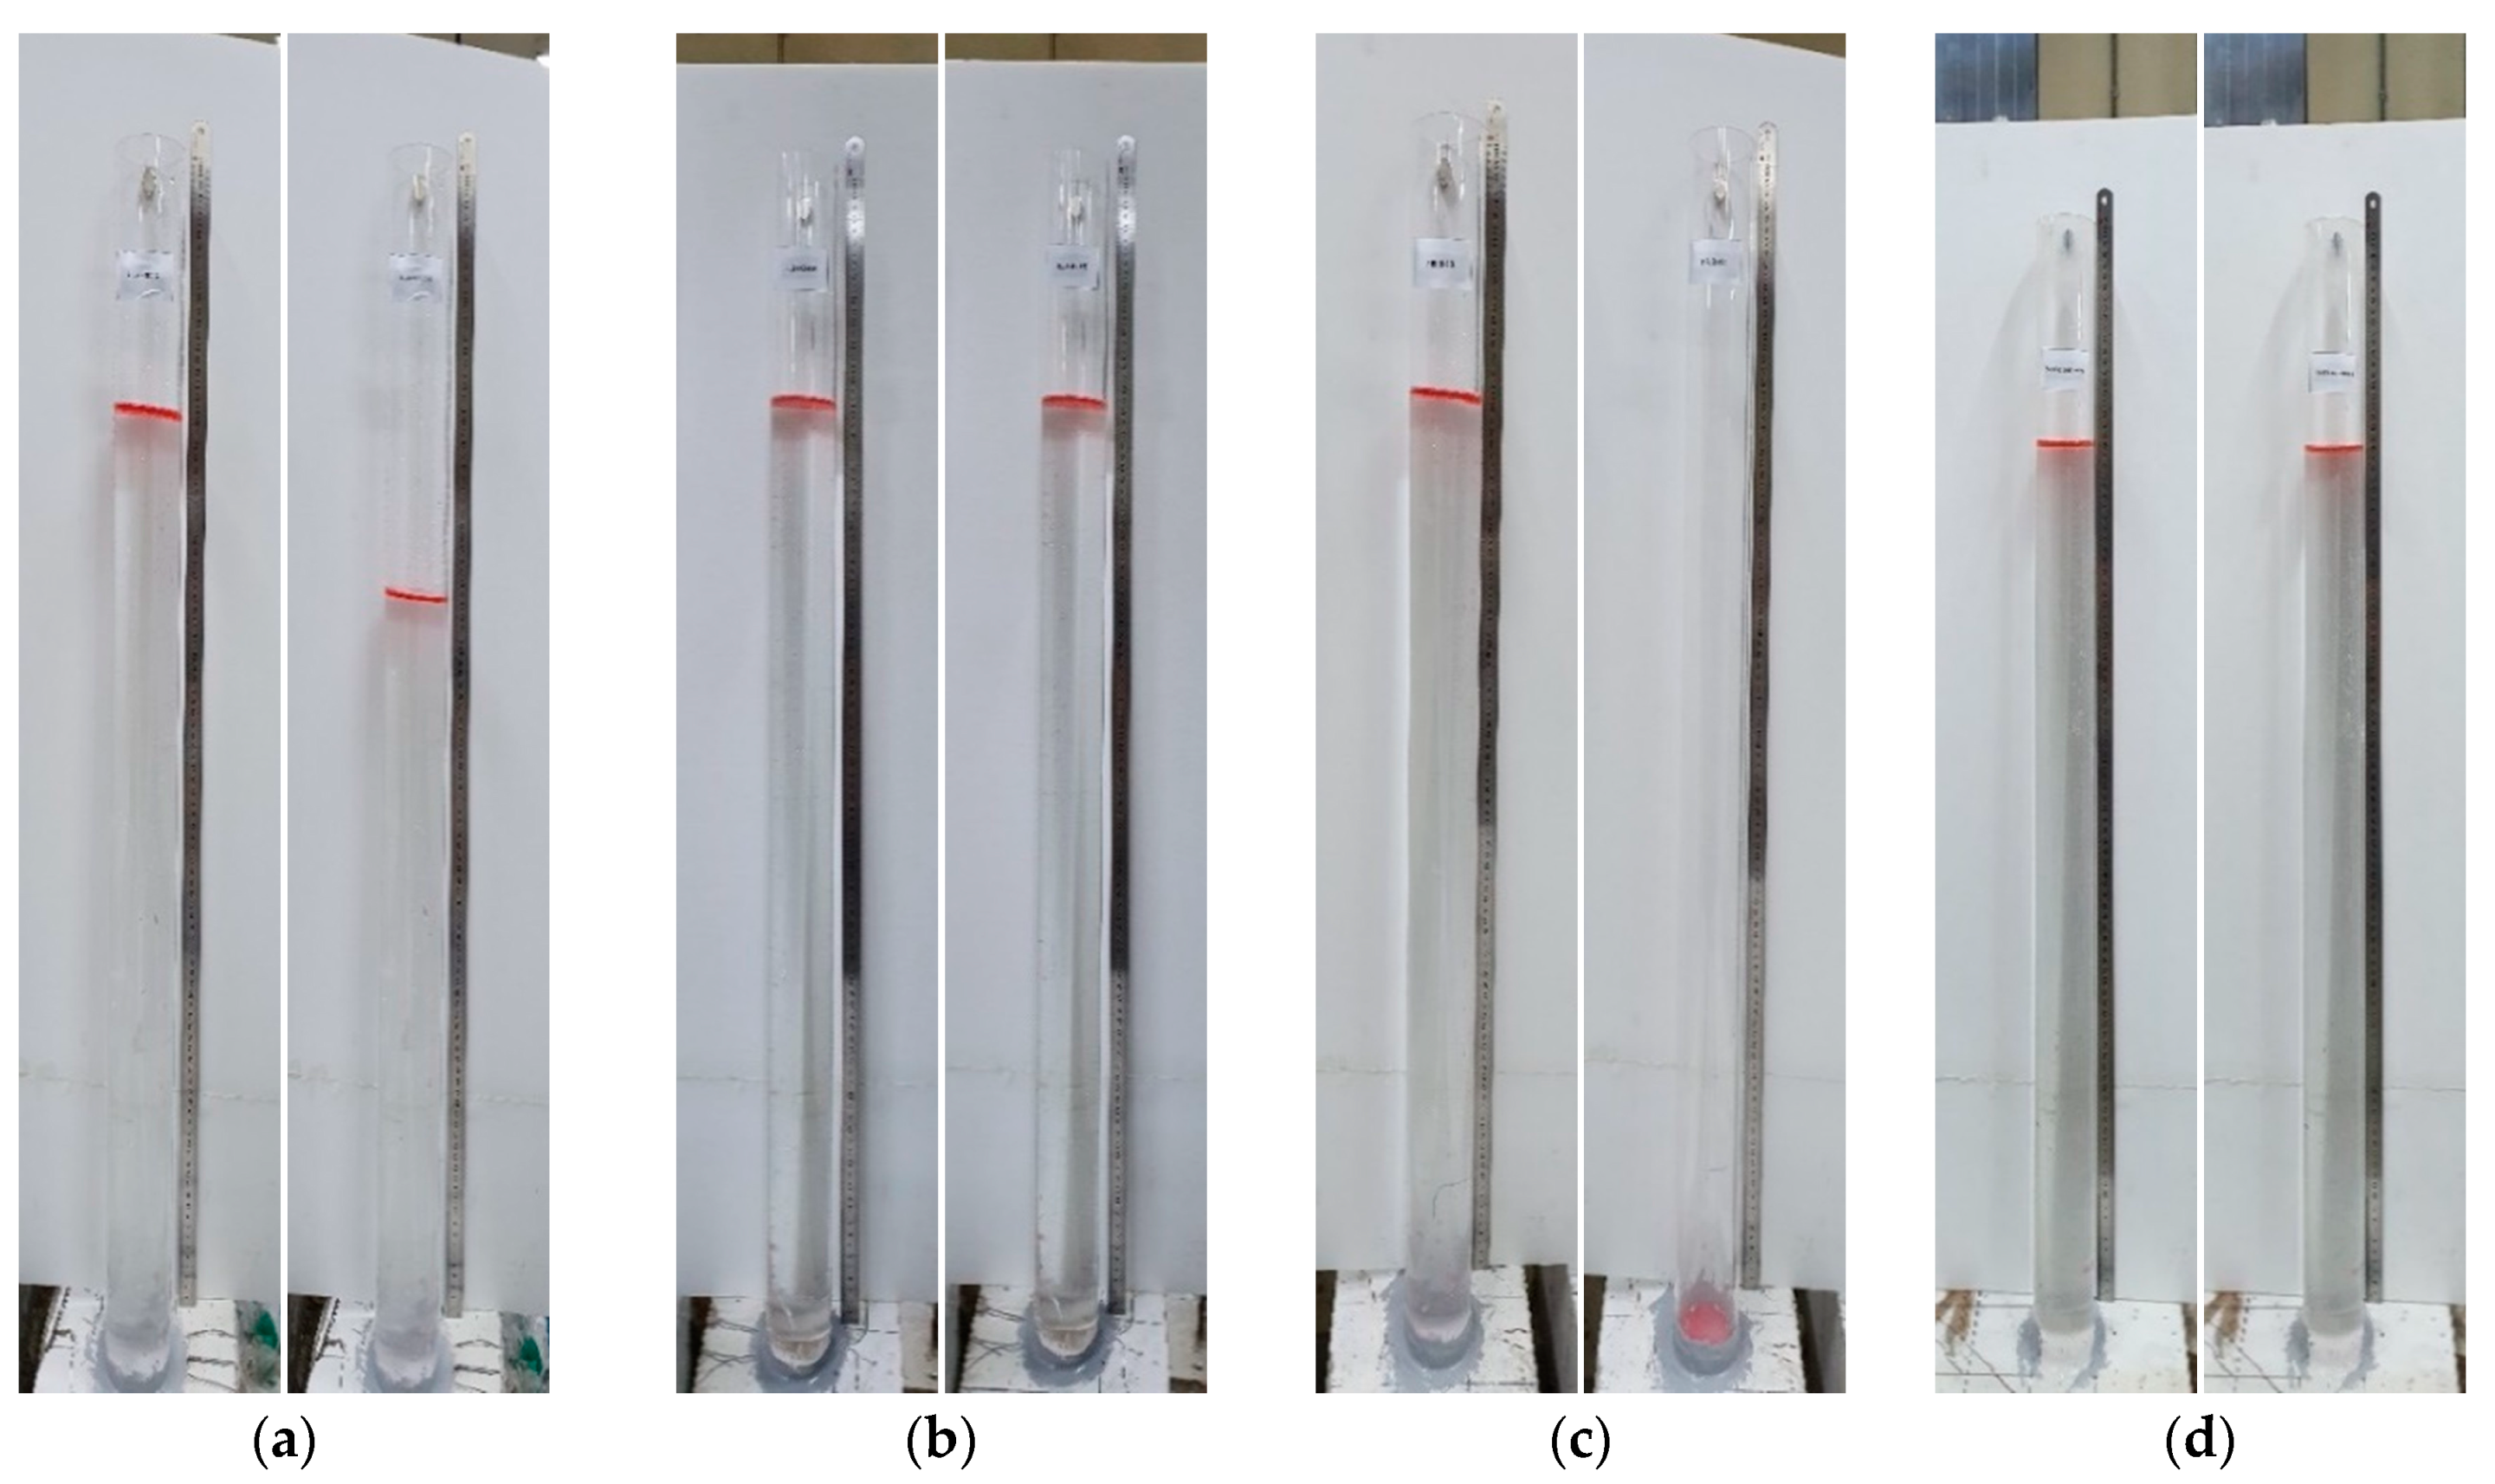
The crack healing effect was also examined by water flow test. Figure 25 shows the water flow test performed to evaluate quantitatively the crack healing effect achieved in the test members after pre-damage at 28 days and an 90 additional days of curing. The water flow test was performed using cylindrical tubes made of acryl with a diameter of 100 mm and height of 1000 mm. The tubes were installed over the cracked and healthy parts of the members that were waterproofed. Water was filled in the tubes up to the specified height and the difference in water level in the tube was measured after 4 h.
The results of the water flow test are arranged in Table 10. There is no way to provide direct figures about the crack healing effect but the drop of the water level in the water flow test can give indirect insight on this effect. It appears that the 0.85-series members replacing binder by 100% of clinker achieved the best crack healing performance whereas the 2.5-series members replacing each binder and aggregates by 50% of clinker exhibited crack healing performance in-between that of the P-series members without clinker and that of the 0.85-series members. This verifies the previous observation done in view of the enlarged images of the cracks.
The results arranged in Table 10 support the conclusion of Escoffres et al. [12], although it concerned high-performance fiber reinforced concrete, that the addition of crystalline admixture slowed down the self-healing process measured by water permeability but provided greater mechanical recovery under tension to the material. In other words, this means that the improvement of durability by self-healing will remain in presence of crystalline admixture until a significant variation of the applied load.

4.3. Evaluation of Crack Healing Effect on Mechanical Performance

4.3.1. Yield and Ultimate Loads

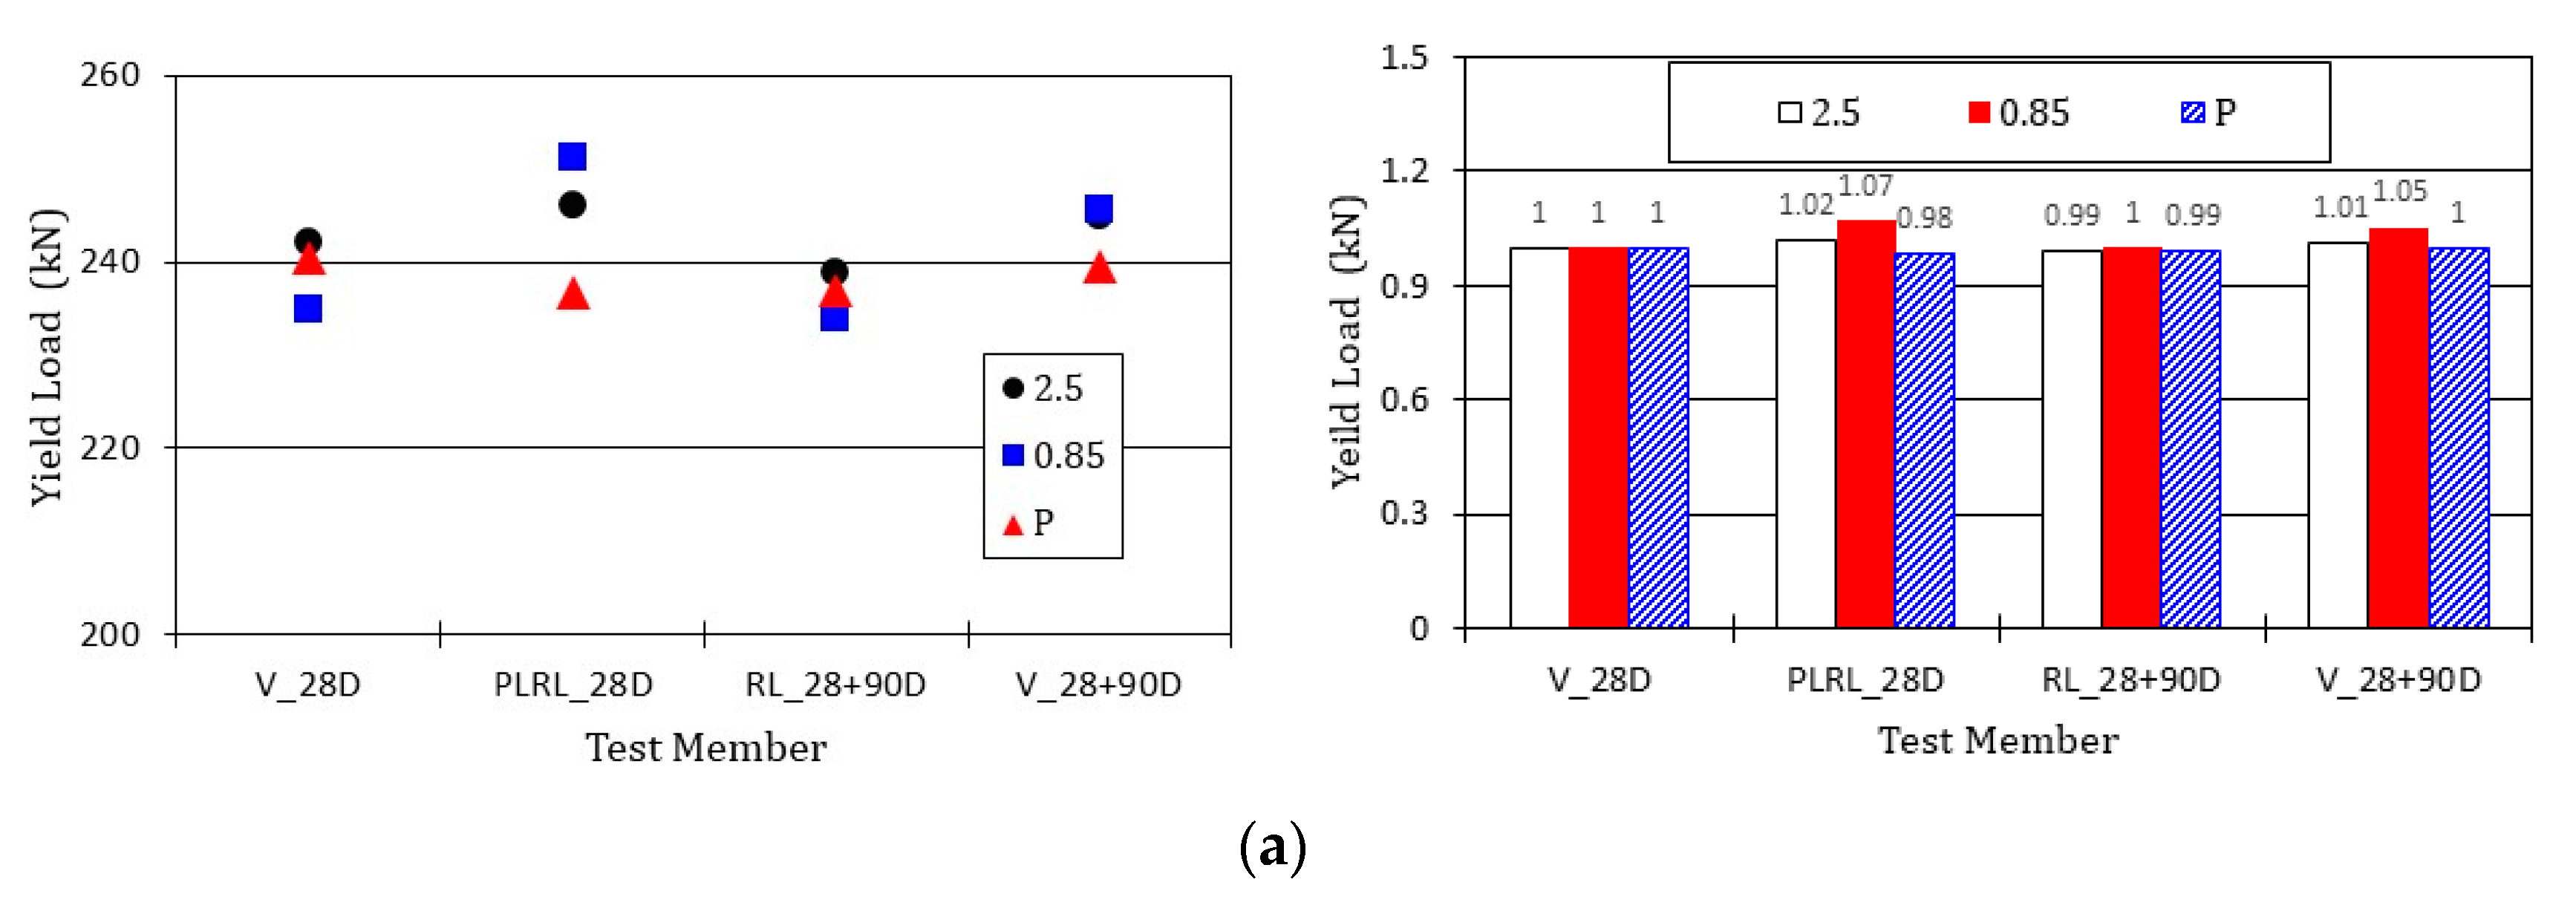
Figure 26 compares the yield load of the steel reinforcement and the ultimate load of the members after pre-damage at 28 days. All the test members exhibit similar tendency. Compared to member V_28D which experienced 28 days of air-dry curing and loaded up to the ultimate state at 28 days, the test members showed a maximum difference of 7% for the yield load and approximately 8% for the ultimate load. Considering that the difference in the load was 4% to 5% between 28 days and 28 + 90 days as well as the corresponding difference in the strength, the P-series members without crack healing agent seem to undergo an actual difference of 2% to 3% in the yield and ultimate load with the same tendency as those observed in the other members. This last result may indicate that the crack healing effect has practically no effect in improving the yield and ultimate loads of the reinforced concrete member.

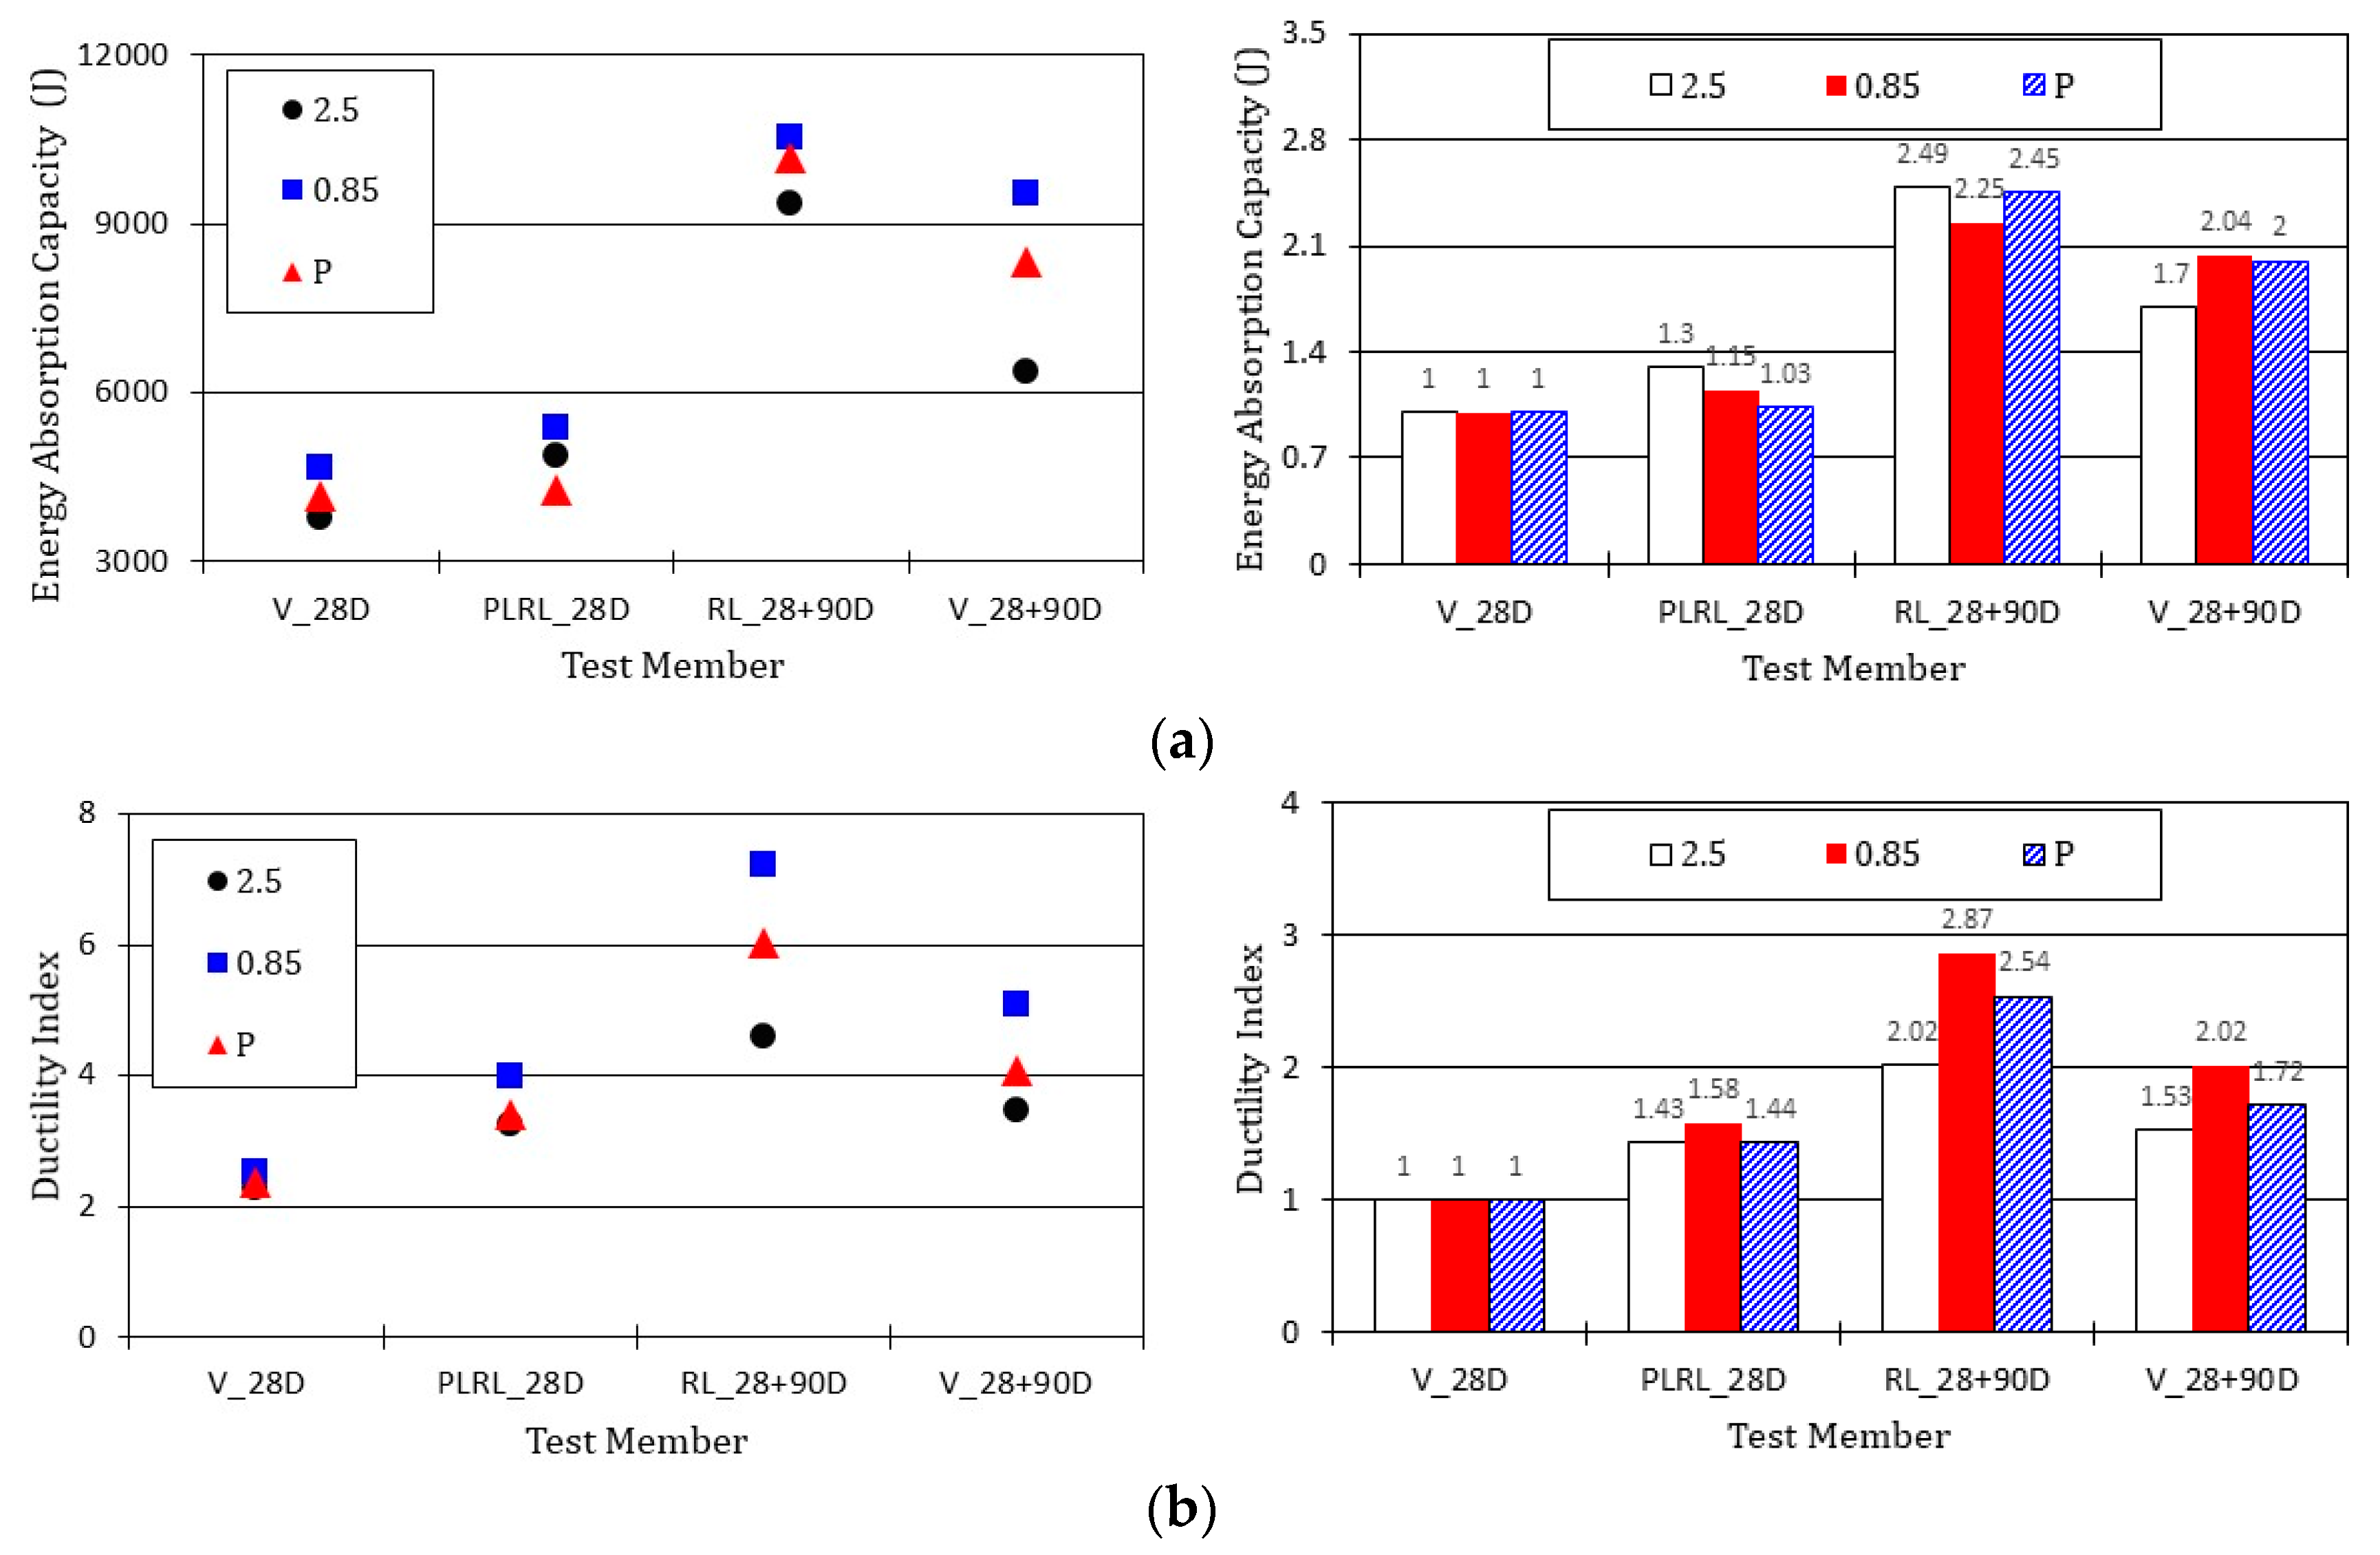
4.3.2. Energy Absorption Capacity and Ductility Index

Figure 27 compares the energy absorption capacity and ductility index of the test members after pre-damage at 28 days. It appears that the energy absorption capacity increased with the age. Member RL_28 + 90D, which was pre-damaged and experienced additional curing for 90 days, exhibited the highest energy absorption capacity. Such an increase in the energy absorption capacity can be attributed to the increase in the concrete strength with the age and the continuous evolution of cementitious composites with time [34]. Moreover, the members that were pre-damaged and reloaded developed higher energy absorption capacity because of the relatively larger displacement sustained during reloading due to the rebar yield and plastic deformation induced by pre-damage compared to that of the not pre-damaged members. The ductility index of all the test members shows a tendency resembling that of the energy absorption capacity. Compared to member V_28D, the difference in the energy absorption capacity reached a maximum of 249% and that for the ductility index reached approximately 287%. The crack healing had some effect on the increase in the energy absorption capacity and the ductility index but this increasing effect appears to be minimal when considering the increase in the energy absorption capacity brought by the age and the larger displacement sustained during reloading caused by the plastic deformation induced by pre-damage.

5. Conclusions

The present study examined the effect of self-healing on the flexural behavior of reinforced concrete members. The considered healing agents were clinker binder and aggregates as well as crystalline admixtures. A total of 12 test members were fabricated with respect to 3 different concrete mixes and 4 different loading and curing conditions. The following conclusions can be drawn from the experimental results.
  • The utilization of mineral admixtures was seen to improve the self-healing performance of mortar. Especially, healing ratios of 100% for crack widths smaller than 200 μm and 85% to 90% for crack widths of 250 μm were observed according to the admixing of clinker binder and aggregates. All the considered mixes exhibited similar results in terms of the compressive strength, elastic modulus and flexural strength. The series with a relatively meaningful binder replacement ratio by 0.85-mm clinker exhibited the best physical properties.
  • A negligible difference was observed in the crack, yield and ultimate loads. Failure occurred through flexure with a similar number of vertical cracks. All the test members showed linear load-deflection relationship until the initiation of cracks followed by a nonlinear increase in the deflection beyond the crack initiation and the load continued to increase until the ultimate load. For the test members cured additionally for 90 days after 28 days, the ultimate deflection reached more than 100% of that of the members loaded after 28 days of curing due to the plastic deformation caused by the yield of the rebar and the aging.
  • Rebar strain practically did not occur prior to the initiation of cracks and grew linearly after cracking to experience a large increase after yielding. The ultimate concrete strain in the members loaded up to the ultimate load at 28 days reached 0.0030 but that in the members that were additionally cured for 90 days after 28 days reached 0.0040 due to the aging and the effect of residual deformation.
  • The maximum crack width observed after 90 days of additional curing ranged between 0.019 and 0.053 mm. These values can be attributed to various factors like crack closure following the removal of loading as well as crack healing. The enlarged images of the cracks revealed that the 0.85-series members replacing binder by 100% of clinker achieved the best crack healing performance. The 2.5-series members replacing each binder and aggregates by 50% of clinker exhibited crack healing performance in-between that of the P-series members without clinker and that of the 0.85-series members. This observation was confirmed by the results of the water flow test performed on the test members.
  • In terms of mechanical performance, the crack healing property of concrete increased, to some extent, the rebar yield load, the members’ ultimate load and energy absorption capacity and ductility index. However, this effect appeared to be minimal when considering the increase in the energy absorption capacity brought by the age and the larger displacement sustained during reloading caused by the plastic deformation induced by pre-damage.
  • An attempt to objectively quantify the crack healing effect by measuring the crack distribution density from the observed crack patterns was performed and this confirmed the crack healing effect provided by clinker powder.
  • Finally, the fine grain size of clinker made it possible to replace fine aggregates and the longer healing time increased the crack healing effect.

Author Contributions

Conceptualization, K.-M.L. and S.-W.Y.; methodology, Y.-C.C. and S.-W.Y.; experiment, B.P. and S.-W.Y.; validation, B.P. and Y.-C.C.; investigation, K.-M.L. and J.F.C.; data curation, B.P. and S.-W.Y.; writing—original draft preparation, J.F.C. and S.-W.Y.; writing—review and editing, Y.-C.C. and J.F.C.; visualization, B.P.; supervision, S.-W.Y.; project administration, K.M.L. and S.-W.Y.; funding acquisition, K.-M.L. All authors have read and agreed to the published version of the manuscript.

Funding

This research was supported by a grant (20SCIP-C158977-01) from Construction Technology Research Program funded by Ministry of Land, Infrastructure and Transport of Korean government. And this research was also supported by the Gachon University research fund of 2020 (GCU-2020-03030001).

Conflicts of Interest

The authors declare no conflict of interest.

References

  1. James, A.; Bazarchi, E.; Chiniforush, A.A.; Aghdam, P.P.; Hosseini, M.R.; Akbarnezhad, A.; Martek, I.; Ghodoosi, F. Rebar corrosion detection, protection, and rehabilitation of reinforced concrete structures in coastal environments: A review. Constr. Build. Mater. 2019, 224, 1026–1039. [Google Scholar] [CrossRef]
  2. Van Tittelboom, K.; De Belie, N. Self-healing of cementitious materials—A review. Materials 2013, 6, 2182–2217. [Google Scholar] [CrossRef] [Green Version]
  3. Wang, W.; Zhang, T.; Wang, X.; He, Z. Research status of self-healing concrete. Earth Environ. Sci. 2019, 218, 012037. [Google Scholar] [CrossRef]
  4. Rajczakowska, M.; Habermehl-Cwirzen, K.; Hedlund, H.; Cwirzen, A. Autogenous self-healing: A better solution for concrete. J. Mater. Civ. Eng. 2019, 31, 03119001. [Google Scholar] [CrossRef]
  5. Zhang, W.; Zheng, Q.; Ashour, A.; Han, B. Self-healing cement concrete for resilient infrastructures: A review. Compos. Part B 2020, 189, 107892. [Google Scholar] [CrossRef]
  6. Camara, L.A.; Wons, M.; Esteves, I.C.A.; Medeiros-Junior, R.A. Monitoring the self-healing of concrete from the ultrasonic pulse velocity. J. Compos. Sci. 2019, 3, 16. [Google Scholar] [CrossRef] [Green Version]
  7. Wang, X.; Fang, C.; Li, D.; Han, N.; Xing, F. A self-healing cementitious composite with mineral admixtures and built-in carbonate. Cem. Concr. Comp. 2018, 92, 216–229. [Google Scholar] [CrossRef]
  8. Park, B.; Choi, Y.C. Investigating a new method to assess the self-healing performance of hardened cement pastes containing supplementary cementitious materials and crystalline admixtures. J. Mater. Res. Technol. 2019, 8, 6058–6073. [Google Scholar] [CrossRef]
  9. Lee, M.W. Prospects and future directions of self-healing fiber-reinforced composite materials. Polymers 2020, 12, 379. [Google Scholar] [CrossRef] [Green Version]
  10. Kim, S.; Yoo, D.Y.; Kim, M.J.; Banthia, N. Self-healing capability of ultra-high-performance fiber-reinforced concrete after exposure to cryogenic temperature. Cem. Concr. Comp. 2019, 104, 103335. [Google Scholar] [CrossRef]
  11. Wang, J.; Ding, S.; Han, B.; Ni, Y.; Ou, J. Self-healing properties of reactive powder concrete with nanofillers. Smart Mater. Struct. 2018, 27, 115033. [Google Scholar] [CrossRef]
  12. Escoffres, P.; Desmettre, C.; Charron, J.P. Effect of a crystalline admixture on the self-healing capability of high-performance fiber reinforced concretes in service conditions. Constr. Build. Mater. 2018, 173, 763–774. [Google Scholar] [CrossRef]
  13. Kua, H.W.; Gupta, S.; Aday, A.N.; Srubar, W.V., III. Biochar-immobilized bacteria and superabsorbent polymers enable self-healing of fiber-reinforced concrete after multiple damage cycles. Cem. Concr. Compos. 2019, 100, 35–52. [Google Scholar] [CrossRef]
  14. Xu, J.; Yao, W. Multiscale mechanical quantification of self-healing concrete incorporating non-ureolytic bacteria-based healing agent. Cem. Concr. Res. 2014, 64, 1–10. [Google Scholar] [CrossRef]
  15. Zhang, Z.; Zhang, Q.; Li, V.C. Multiple-scale investigations on self-healing induced mechanical property recovery of ECC. Cem. Concr. Compos. 2019, 103, 293–302. [Google Scholar] [CrossRef]
  16. Deng, H.; Liao, G. Assessment of influence of self-healing behavior on water permeability and mechanical performance of ECC incorporating superabsorbent polymer (SAP) particles. Constr. Build. Mater. 2018, 170, 455–465. [Google Scholar] [CrossRef]
  17. Xue, C.; Li, W.; Li, J.; Tam, V.W.Y.; Ye, G. A review study on encapsulation-based self-healing for cementitious material. Struct. Concr. 2019, 20, 198–212. [Google Scholar] [CrossRef] [Green Version]
  18. Gupta, S.; Pang, S.D.; Kua, H.W. Autonomous healing in concrete by bio-based healing agents—A review. Constr. Build. Mater. 2017, 146, 419–428. [Google Scholar] [CrossRef]
  19. Park, B.; Choi, Y.C. Self-healing capability of cementitious materials with crystalline admixtures and super absorbent polymers (SAPs). Constr. Build. Mater. 2018, 189, 1054–1066. [Google Scholar] [CrossRef]
  20. Hong, G.; Song, C.; Park, J.; Choi, S. Hysteretic behavior of rapid self-sealing of cracks in cementitious materials incorporating superabsorbent polymers. Constr. Build. Mater. 2019, 195, 187–197. [Google Scholar] [CrossRef]
  21. Lv, L.; Guo, P.; Liu, G.; Han, N.; Xing, F. Light induced self-healing in concrete using novel cementitious capsules containing UV curable adhesive. Cem. Concr. Compos. 2020, 105, 103445. [Google Scholar] [CrossRef]
  22. Qureshi, T.S.; Kanellopoulos, A.; Al-Tabbaa, A. Encapsulation of expansive powder minerals within a concentric glass capsule system for self-healing concrete. Constr. Build. Mater. 2016, 121, 629–643. [Google Scholar] [CrossRef]
  23. Gilabert, F.A.; Van Tittelboom, K.; Van Stappen, J.; Cnudde, V.; De Belie, N.; Van Paepegem, W. Integral procedure to assess crack filling and mechanical contribution of polymer-based healing agent in encapsulation-based self-healing concrete. Cem. Concr. Compos. 2017, 77, 68–80. [Google Scholar] [CrossRef]
  24. Snoeck, D.; Pel, L.; De Belie, N. Autogenous healing in cementitious materials with superabsorbent polymers quantified by means of NMR. Sci. Rep. 2020, 10, 642. [Google Scholar] [CrossRef] [PubMed]
  25. Park, B.; Choi, Y.C. Quantitative evaluation of crack self-healing in cement-based materials by absorption test. Constr. Build. Mater. 2018, 184, 1–10. [Google Scholar] [CrossRef]
  26. Azarsa, P.; Gupta, R.; Biparva, A. Assessment of self-healing and durability parameters of concretes incorporating crystalline admixtures and Portland Limestone Cement. Cem. Concr. Compos. 2019, 99, 17–31. [Google Scholar] [CrossRef]
  27. Guo, S.; Chidiac, S. Self-healing concrete: A critical review. In Proceedings of the 2019 CSCE Annual Conference, Laval, QC, Canada, 12–15 June 2019. [Google Scholar]
  28. Choi, Y.C.; Park, B. Enhanced autogenous healing of ground granulated blast furnace slag blended cements and mortars. J. Mater. Res. Technol. 2019, 8, 3443–3452. [Google Scholar] [CrossRef]
  29. Takagi, E.M.; Lima, M.G.; Helene, P.; Meideros-Junior, R.A. Self-healing of self-compacting concretes made with blast furnace slag cements activated by crystalline admixture. Int. J. Mater. Prod. Tec. 2018, 56, 169–186. [Google Scholar] [CrossRef]
  30. Yuan, L.; Chen, S.; Wang, S.; Huang, Y.; Yang, Q.; Liu, S.; Wang, J.; Du, P.; Cheng, X.; Zhou, Z. Research on the improvement of concrete self-healing based on the regulation of cement particle size distribution (PSD). Materials 2019, 12, 2818. [Google Scholar] [CrossRef] [Green Version]
  31. Berger, R.L. Properties of concrete with cement clinker aggregate. Cem. Concr. Res. 1974, 4, 99–112. [Google Scholar] [CrossRef]
  32. Allahverdi, J.S.A. Using PC clinker as aggregate-enhancing concrete properties by improving ITZ microstructure. Mag. Concr. Res. 2020, 72, 173–181. [Google Scholar] [CrossRef]
  33. Choi, S.W.; Bae, W.H.; Lee, K.M.; Shin, K.J. Correlation between crack width and water flow of cracked mortar specimens measured by constant water head permeability test. J. Korea Concr. Inst. 2017, 29, 267–273. [Google Scholar] [CrossRef]
  34. Lepech, M.D.; Li, V.C. Water permeability of engineered cementitious composites. Cem. Concr. Compos. 2009, 31, 744–753. [Google Scholar] [CrossRef]
  35. Alyousif, A. Self-Healing Capability of Engineered Cementitious Composites Incorporating Different Types of Pozzolanic Materials. Ph.D. Thesis, Ryerson University, Toronto, ON, Canada, 2016. [Google Scholar]
  36. Sunayana, S.; Barai, S.V. Flexural performance and tension-stiffening evaluation of reinforced concrete beam incorporating recycled aggregate and fly ash. Constr. Build. Mater. 2018, 174, 210–223. [Google Scholar] [CrossRef]
  37. Sturm, A.B.; Visintin, P.; Oehlers, D.J. Time dependent serviceability behavior of reinforced concrete beam: Partial interaction tension stiffening mechanics. Struct. Concr. 2018, 19, 508–523. [Google Scholar] [CrossRef]
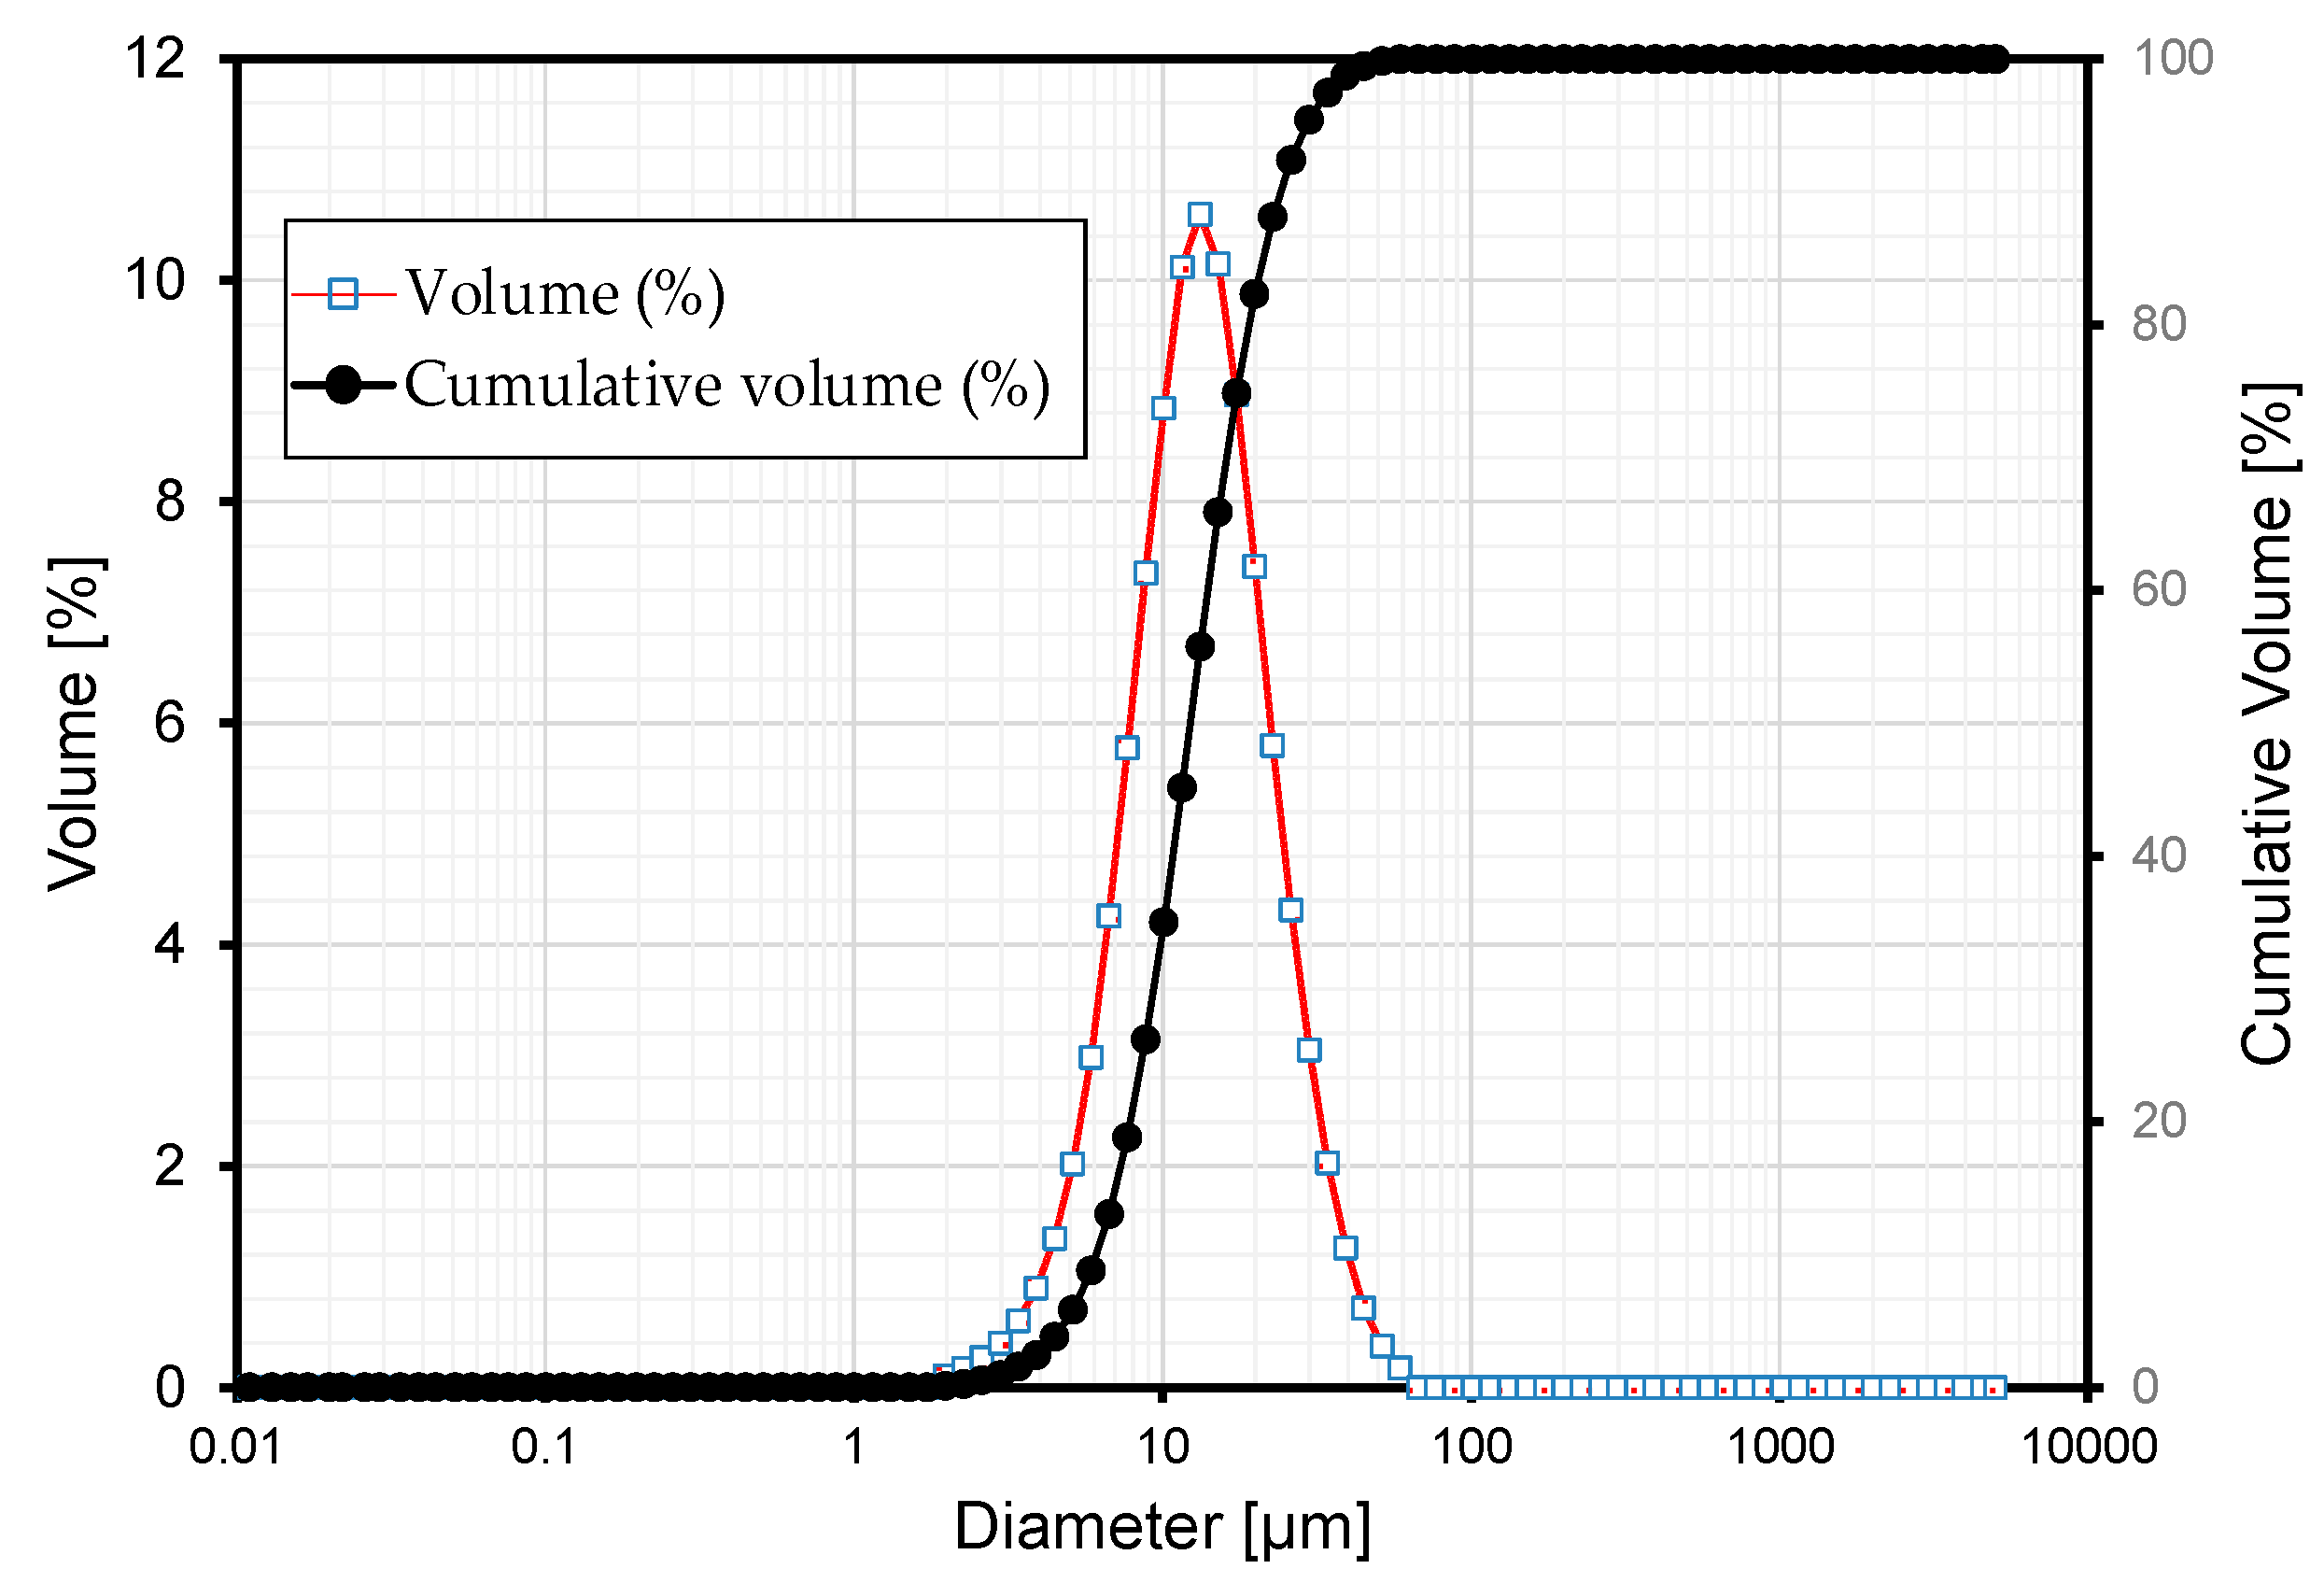
Figure 1. Grain size analysis results of GGBFS.
Materials 13 04516 g001
Figure 2. Water flow test: (a) photograph of actual test on mortar; (b) schematic illustration.
Materials 13 04516 g002
Figure 3. Dimensions and shape of flexural test members.
Materials 13 04516 g003
Figure 4. Layout of reinforcement strain gages in test members.
Materials 13 04516 g004
Figure 5. Setup for 4-point loading test.
Materials 13 04516 g005
Figure 6. Four-point bending test of flexural members: (a) photograph of actual bending test; (b) schematic illustration.
Materials 13 04516 g006
Figure 7. Partial water curing of pre-damaged test members.
Materials 13 04516 g007
Figure 8. Water flow test results.
Materials 13 04516 g008
Figure 9. Load-deflection measurement by mixes: (a) 2.5 series; (b) 0.85 series; (c) Plain series.
Materials 13 04516 g009
Figure 10. Load-deflection measurement by loading conditions: (a) V_28D series; (b) PLRL_28D series; (c) RL_28D series; (d) RL_28 + 90D series.
Materials 13 04516 g010
Figure 11. Load-deflection measurement after 28 days (up to ultimate load after pre-loading): (a) 2.5 series; (b) 0.85 series; (c) Plain series.
Materials 13 04516 g011aMaterials 13 04516 g011b
Figure 12. Load-deflection measurement after 28 + 90 days (up to ultimate load after pre-loading and additional 90 days of curing after pre-loading): (a) 2.5 series; (b) 0.85 series; (c) Plain series.
Materials 13 04516 g012aMaterials 13 04516 g012b
Figure 13. Load–steel reinforcement strain measurement by mixes: (a) 2.5 series; (b) 0.85 series; (c) Plain series.
Materials 13 04516 g013
Figure 14. Load–steel reinforcement strain measurement by loading conditions: (a) V_28D series; (b) PLRL_28D series; (c) RL_28D series; (d) RL_28 + 90D series.
Materials 13 04516 g014
Figure 15. Load–steel reinforcement strain measurement after 28 days (up to ultimate load after pre-loading): (a) 2.5 series; (b) 0.85 series; (c) Plain series.
Materials 13 04516 g015aMaterials 13 04516 g015b
Figure 16. Load–steel reinforcement strain measurement after 28 + 90 days (up to ultimate load after pre-loading and additional 90 days of curing after pre-loading): (a) 2.5 series; (b) 0.85 series; (c) Plain series.
Materials 13 04516 g016aMaterials 13 04516 g016b
Figure 17. Load–concrete strain measurement by mixes: (a) 2.5 series; (b) 0.85 series; (c) Plain series.
Materials 13 04516 g017
Figure 18. Load–concrete strain measurement by loading conditions: (a) V_28D series; (b) PLRL_28D series; (c) RL_28D series; (d) RL_28 + 90D series.
Materials 13 04516 g018
Figure 19. Load–concrete strain measurement after 28 days (up to ultimate load after pre-loading): (a) 2.5 series; (b) 0.85 series; (c) Plain series.
Materials 13 04516 g019aMaterials 13 04516 g019b
Figure 20. Load–concrete strain measurement after 28 + 90 days (up to ultimate load after pre-loading and additional 90 days of curing after pre-loading): (a) 2.5 series; (b) 0.85 series; (c) Plain series.
Materials 13 04516 g020aMaterials 13 04516 g020b
Figure 21. Crack patterns of test members: (a) V_28D-2.5; (b) PLRL_28D-2.5; (c) RL_28 + 90D-2.5; (d) V_28 + 90D-2.5; (e) V_28D-0.85; (f) PLRL_28D-0.85; (g) RL_28 + 90D-0.85; (h) V_28 + 90D-0.85; (i) P-V_28D; (j) P-PLRL_28D; (k) P-RL_28+90D; (l) P-V_28 + 90D.
Materials 13 04516 g021aMaterials 13 04516 g021b
Figure 22. Crack healing of member RL_28 + 90D-2.5: (a) after pre-loading at 28 days + 90 days of additional curing; (b) after loading at 28 + 90 days; (c) enlargement of cracks after completion of test.
Materials 13 04516 g022
Figure 23. Crack healing of member RL_28 + 90D-0.85: (a) after pre-loading at 28 days + 90 days of additional curing; (b) after loading at 28 + 90 days; (c) enlargement of cracks after completion of test.
Materials 13 04516 g023
Figure 24. Crack healing of member P-RL_28 + 90D: (a) after pre-loading at 28 days + 90 days of additional curing; (b) after loading at 28 + 90 days; (c) enlargement of cracks after completion of test.
Materials 13 04516 g024
Figure 25. Results of water flow test: (a) 2.5 series; (b) 0.85 series; (c) Plain series; (d) healthy part.
Materials 13 04516 g025
Figure 26. Comparison of reinforcement yield load and members’ ultimate load: (a) yield load of steel reinforcement; (b) ultimate load of test members.
Materials 13 04516 g026aMaterials 13 04516 g026b
Figure 27. Comparison of energy absorption capacity and ductility index: (a) energy absorption capacity; (b) ductility index.
Materials 13 04516 g027
Table 1. Chemical composition of raw materials (in weight ratio).
MaterialCaOSiO2Al2O3Fe2O3MgOK2ONa2OSO3
GGBFS42.5129.1315.820.674.430.520.283.59
Clinker64.3422.874.962.941.280.820.230.44
Table 2. Mix proportions of mortar (in kg/m3, W/B = 0.4).
SeriesBinderAggregate
OPCGGBFSNa2SO4AnhydriteClinker BinderClinker SandSand
Plain690-----1380
2.5428173101069691311
0.854281731010138-1311
Table 3. Mix proportions of concrete (in kg/m3).
SeriesWaterOPCGGBFSNa2SO4AnhydriteClinkerAggreg.SP
0.852.5
Plain27549517210---13759
2.52764281731010696913119
0.852764281731010138-13119
Table 4. Designation and specifications of test members.
DesignationClinker Particle SizeCuring ConditionLoading and Pre-Damage Status
V_28D-2.52.5 mm28 days of air-dryingLoading up to ultimate state at 28 days
PLRL_28D-2.528 days of air-dryingPre-loading up to 50% of ultimate load at 28 days + loading up to ultimate state at 28 days
RL_28 + 90D-2.528 days of air-drying followed by partial water curing for 90 daysPre-loading up to 50% of ultimate load at 28 days + loading up to ultimate load 90 days after
V_28 + 90D-2.5Air-drying until 28 + 90 daysLoading up to ultimate state after 28 + 90 days
V_28D-0.850.85 mm28 days of air-dryingLoading up to ultimate state at 28 days
PLRL_28D-0.8528 days of air-dryingPre-loading up to 50% of ultimate load at 28 days + loading up to ultimate state at 28 days
RL_28 + 90D-0.8528 days of air-drying followed by partial water curing for 90 daysPre-loading up to 50% of ultimate load at 28 days + loading up to ultimate load 90 days after
V_28 + 90D-0.85Air-drying until 28 + 90 daysLoading up to ultimate state after 28 + 90 days
P-V_28DOPC28 days of air-dryingLoading up to ultimate state at 28 days
P-PLRL_28D28 days of air-dryingPre-loading up to 50% of ultimate load at 28 days + loading up to ultimate state at 28 days
P-RL_28 + 90D28 days of air-drying followed by partial water curing for 90 daysPre-loading up to 50% of ultimate load at 28 days + loading up to ultimate load 90 days after
P-V_28 + 90DAir-drying until 28 + 90 daysLoading up to ultimate state after 28 + 90 days
Table 5. Compressive strength and slump flow of considered mortars.
SeriesCompressive Strength   ( σ ) Slump Flow   ( σ ) (mm)
7 Days (MPa)28 Days (MPa)
Plain38.32 (1.12)47.46 (1.48)203 (8.2)
2.537.27 (0.89)48.92 (1.59)207 (8.0)
0.8537.89 (1.03)49.33 (1.56)208 (8.1)
Table 6. Physical properties of concrete mixes.
Series f ck   ( σ ) E c   ( σ ) Slump   ( σ )
(mm)
Air
28 Days
(MPa)
28 + 90 Days
(MPa)
28 Days
(MPa)
28 + 90 Days
(MPa)
(%)
Plain57.55 (2.01)59.65 (1.98)26,713 (1,219)29,453 (1,410)42.5 (2.10)7.5
2.560.79 (2.08)67.58 (2.11)21,670 (1,002)25,538 (987)44.2 (2.06)4.6
0.8562.88 (2.14)63.63 (2.18)28,190 (1,145)29,087 (1,328)45.2 (1.97)8.2
Table 7. Flexural test results of concrete mixes.
SeriesWidth of Failure Section (mm)Height of Failure Section (mm) Load   ( σ )
(kN)
f b   ( σ )
(MPa)
28 Days28 + 90 Days28 Days28 + 90 Days28 Days28 + 90 Days28 Days28 + 90 Days
Plain99.8100.0101.098.816.0 (0.92)16.6 (1.01)7.1 (0.31)7.6 (0.18)
2.5101.7100.0100.0100.013.8 (0.73)18.2 (1.12)6.1 (0.27)8.4 (0.31)
0.8598.0100.0100.5100.017.6 (0.77)19.3 (1.09)8.0 (0.29)8.7 (0.28)
Table 8. Crack, yield and ultimate loads and failure patterns of test members.
Test MembersCrack Load (kN)Yield
(kN, mm)
Ultimate
(kN, mm)
Ultimate/YieldFailure Pattern
LoadDispl.LoadDispl.LoadDispl.
V_28D-2.55.63242.187.93267.9018.101.112.28Flexure
PLRL_28D-2.54.16246.206.52283.3321.321.153.27Flexure
RL_28 + 90D-2.511.54238.978.39288.0038.581.214.60Flexure
V_28 + 90D-2.59.96245.027.48281.0126.021.153.48Flexure
V_28D-0.852.78234.947.93277.8820.021.182.52Flexure
PLRL_28D-0.854.71251.365.51290.9821.921.163.98Flexure
RL_28 + 90D-0.8511.79233.915.81291.9041.941.257.22Flexure
V_28 + 90D-0.859.42245.597.28289.5537.021.185.09Flexure
P-V_28D6.17240.448.52268.2920.231.122.37Flexure
P-PLRL_28D5.37236.815.47279.6218.661.183.41Flexure
P-RL_28 + 90D11.32237.086.94282.6041.781.196.02Flexure
P-V_28 + 90D5.92239.548.26278.7533.721.164.08Flexure
Table 9. Crack distribution density at bottom of specimens (/mm).
Test Member2.5-Series0.85-SeriesP-Series
V_28D0.00550.00650.0050
V_28 + 90D0.00500.00750.0065
PLRL_28D0.00750.00700.0065
RL_28 + 90D0.00700.00600.0070
Table 10. Water flow test results.
Test MemberInitial Water Height (mm)Final Water
Height (mm)
Difference of Water Height (mm)
Healthy part8007982
RL_28 + 90D-2.5642158
RL_28 + 90D-0.857982
P-RL_28 + 90D0800