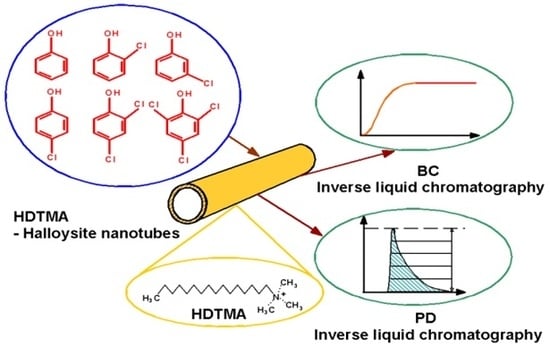
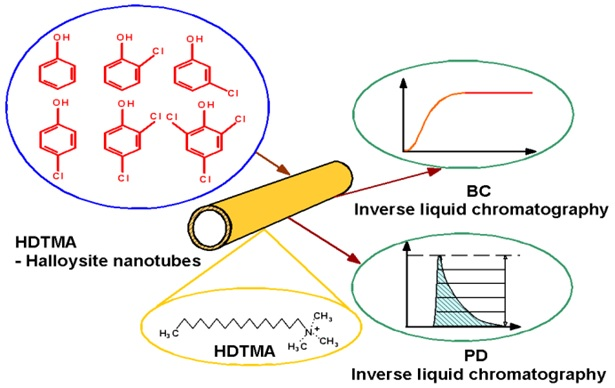
Adsorption of Phenol and Chlorophenols by HDTMA Modified Halloysite Nanotubes


Abstract
1. Introduction
2. Materials and Methods
2.1. Chemicals and Materials
2.2. Preparation of HDTMA/Halloysite
2.3. Characterization of Adsorbent
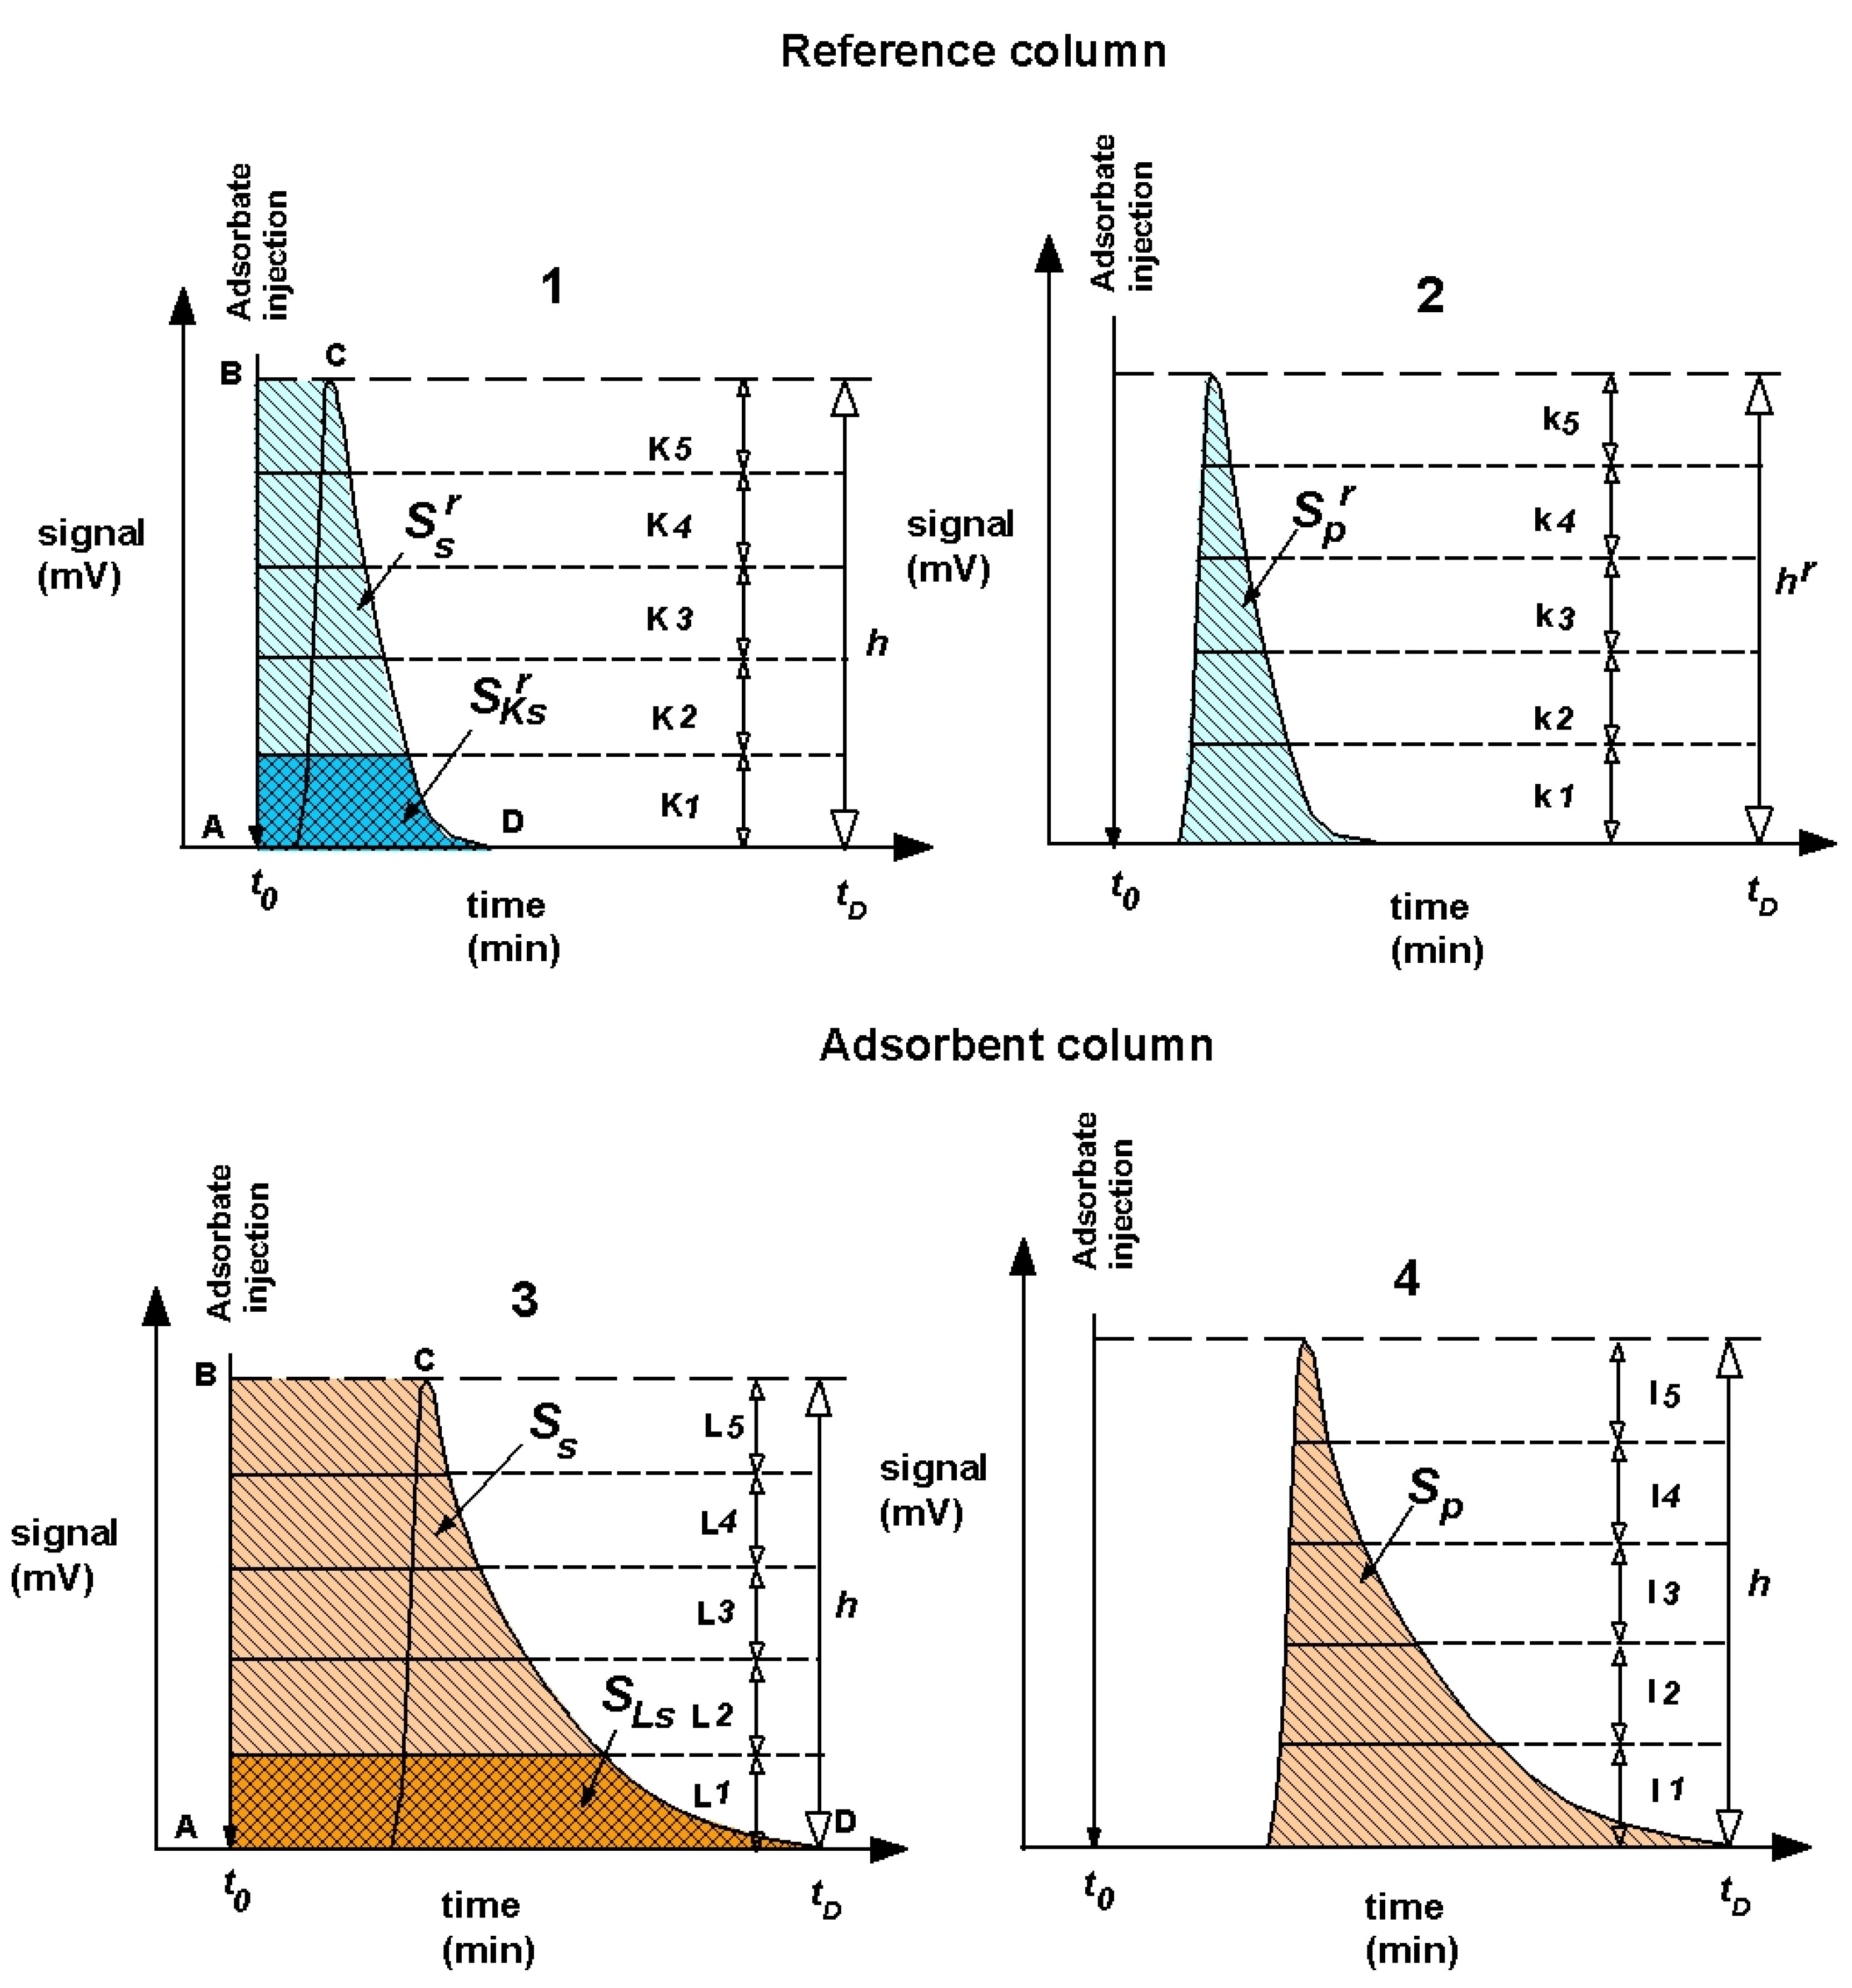
2.4. Inverse Liquid Chromatography Methods
2.4.1. Adsorption Measurements by the PD ILC Method
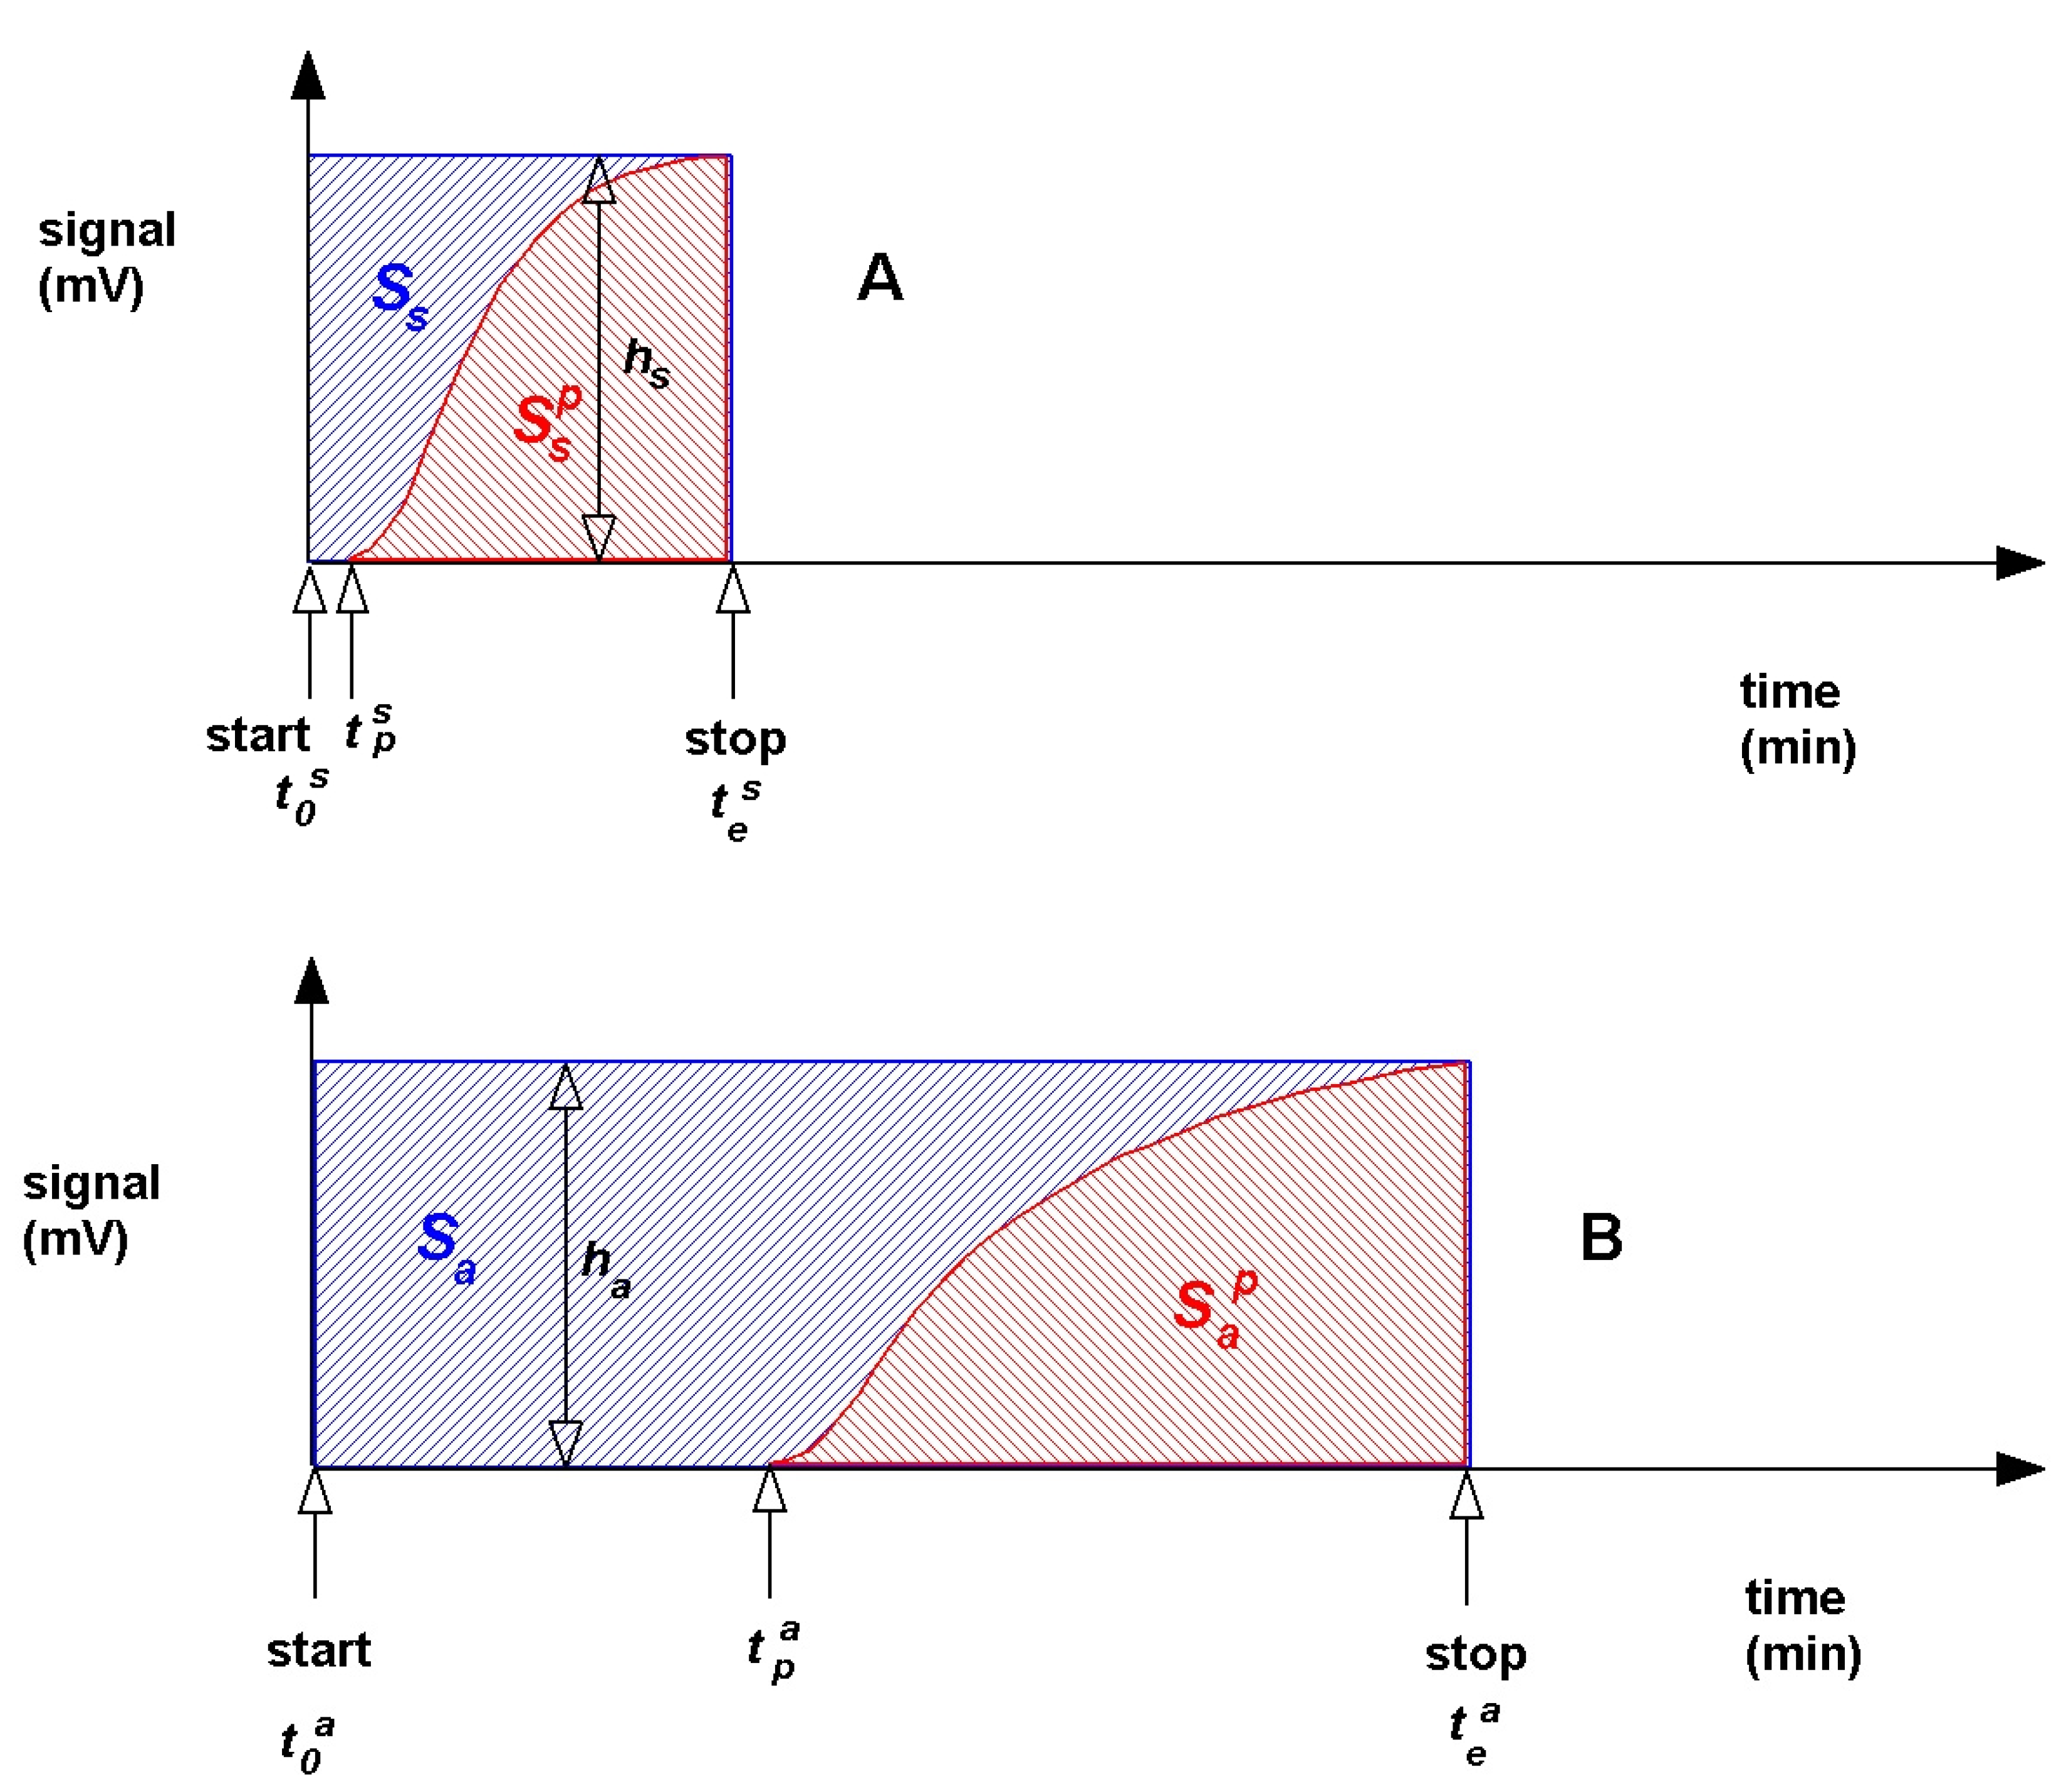
2.4.2. Adsorption Measurements by the BC ILC Method
2.5. Surface Characteristics of the Adsorbents by Inverse GAS Chromatography Method
2.6. Chromatographic Measurements
3. Results and Discussion
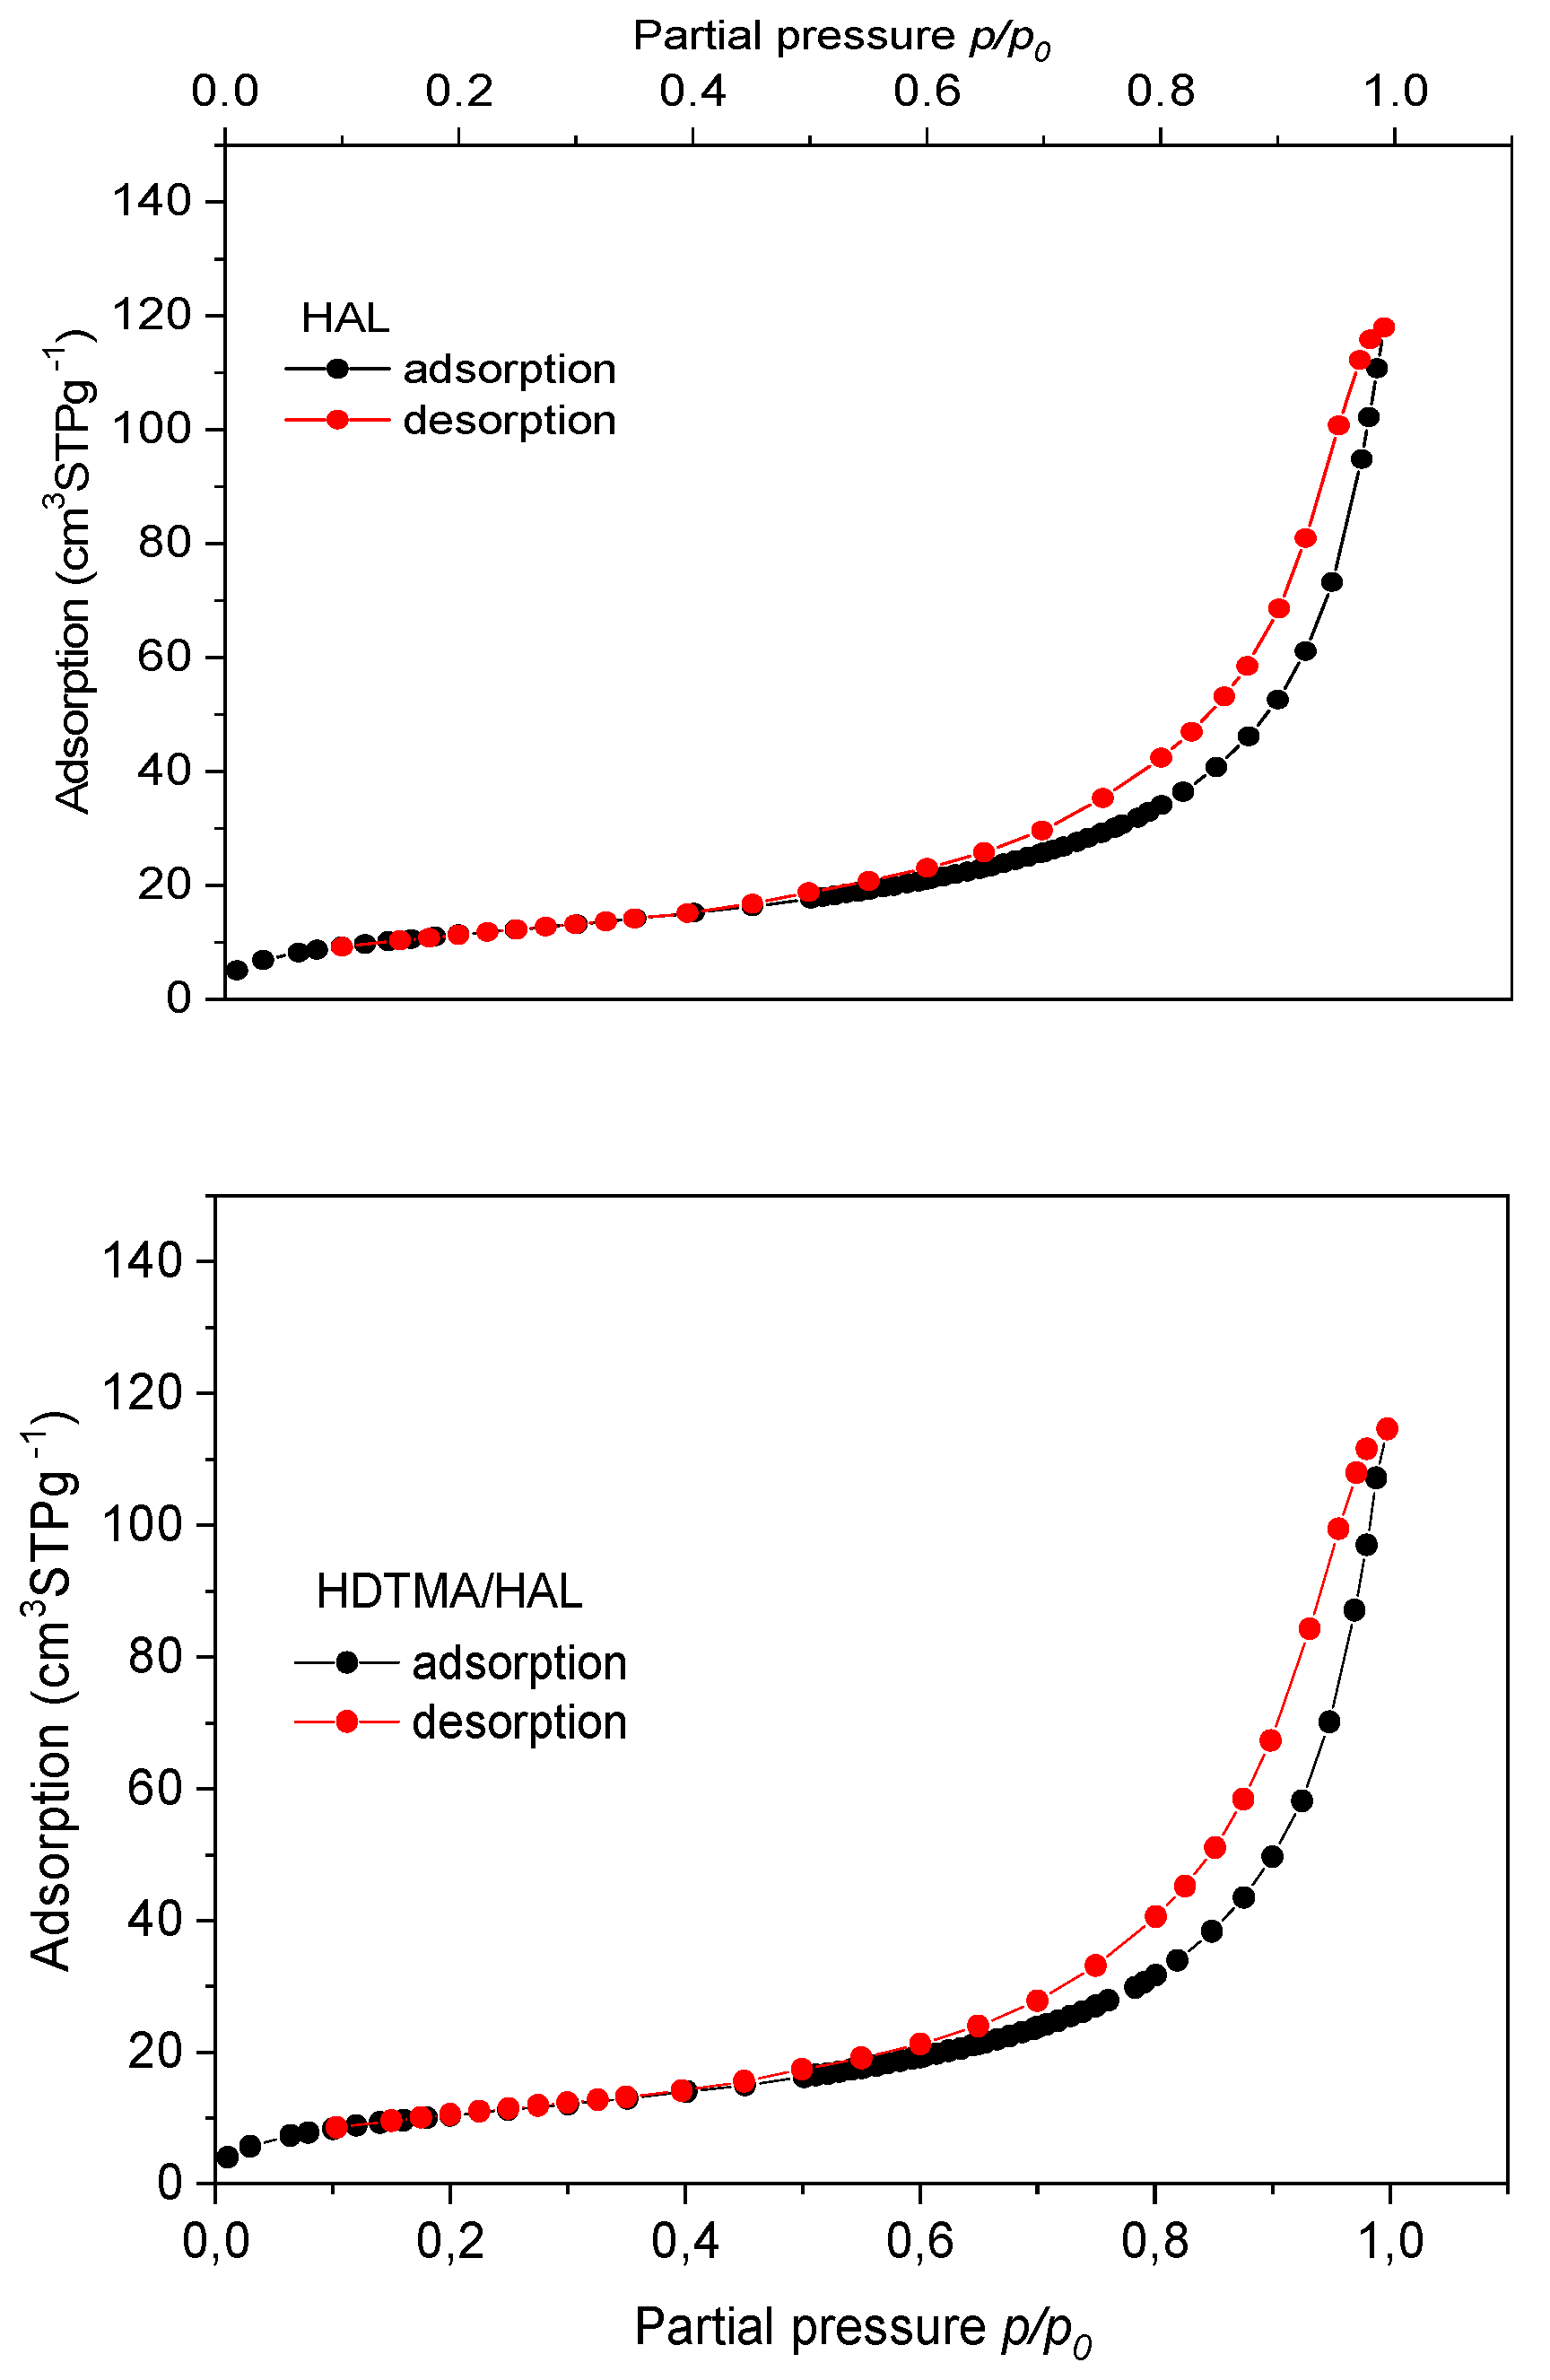
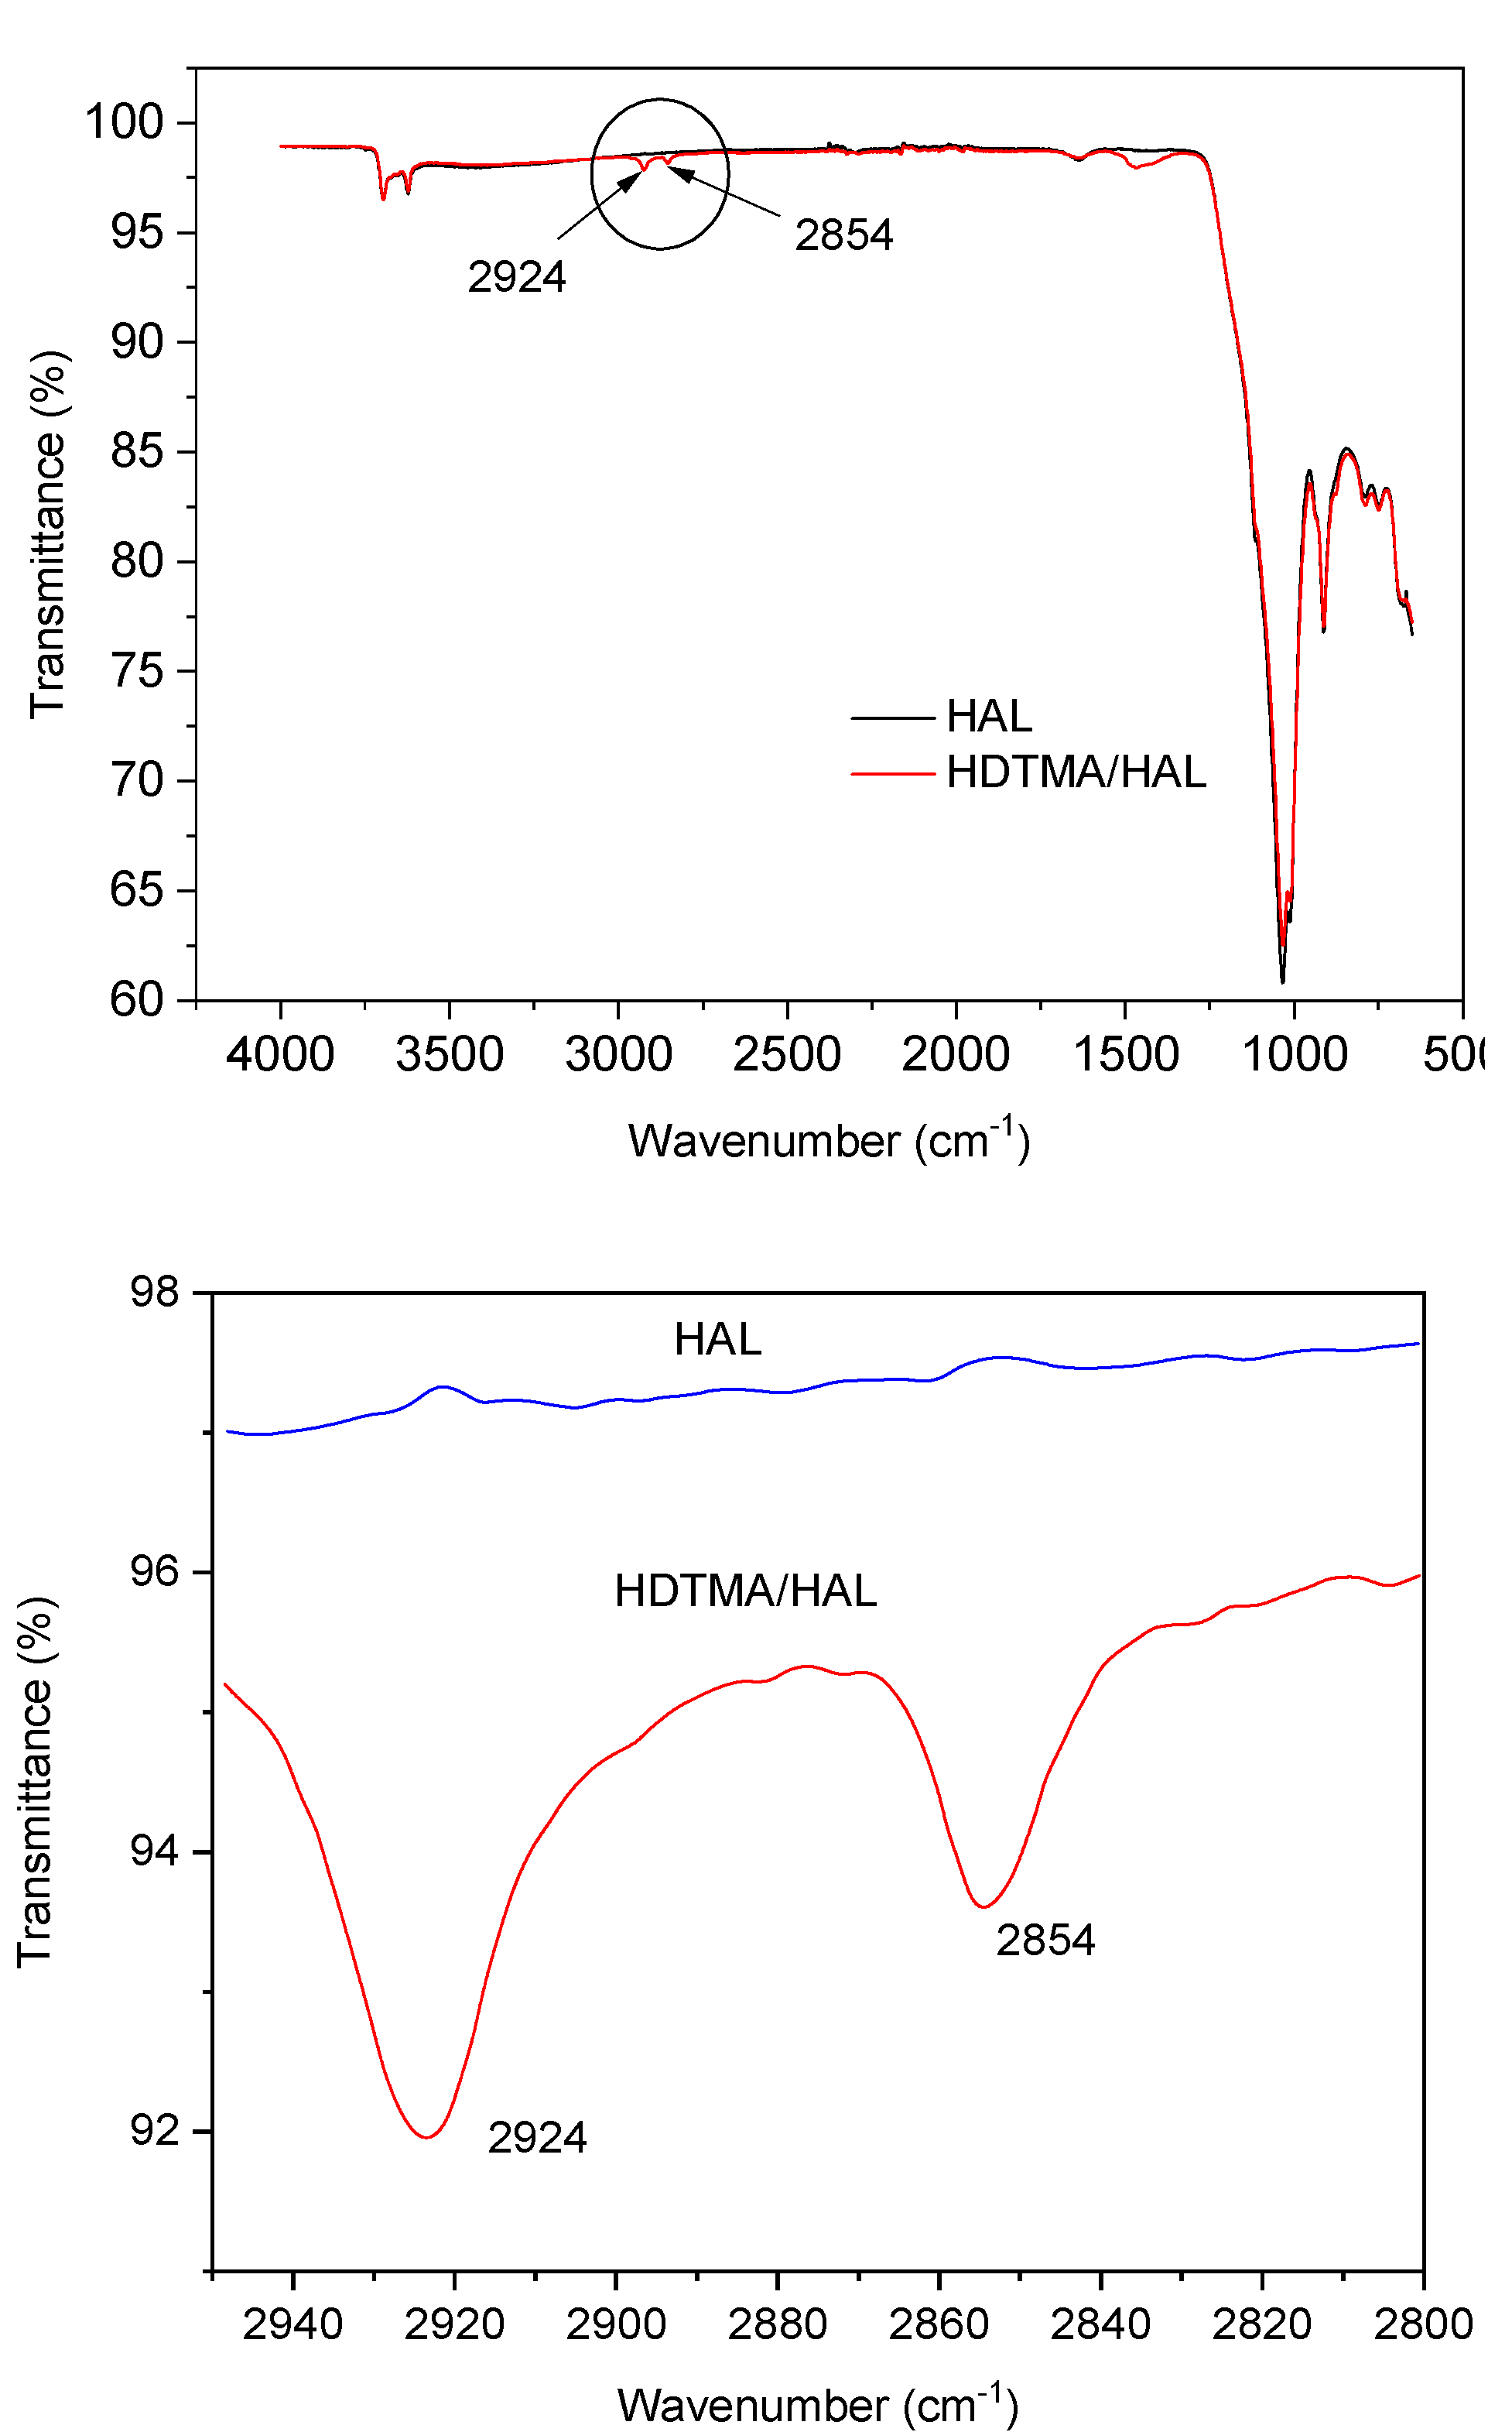
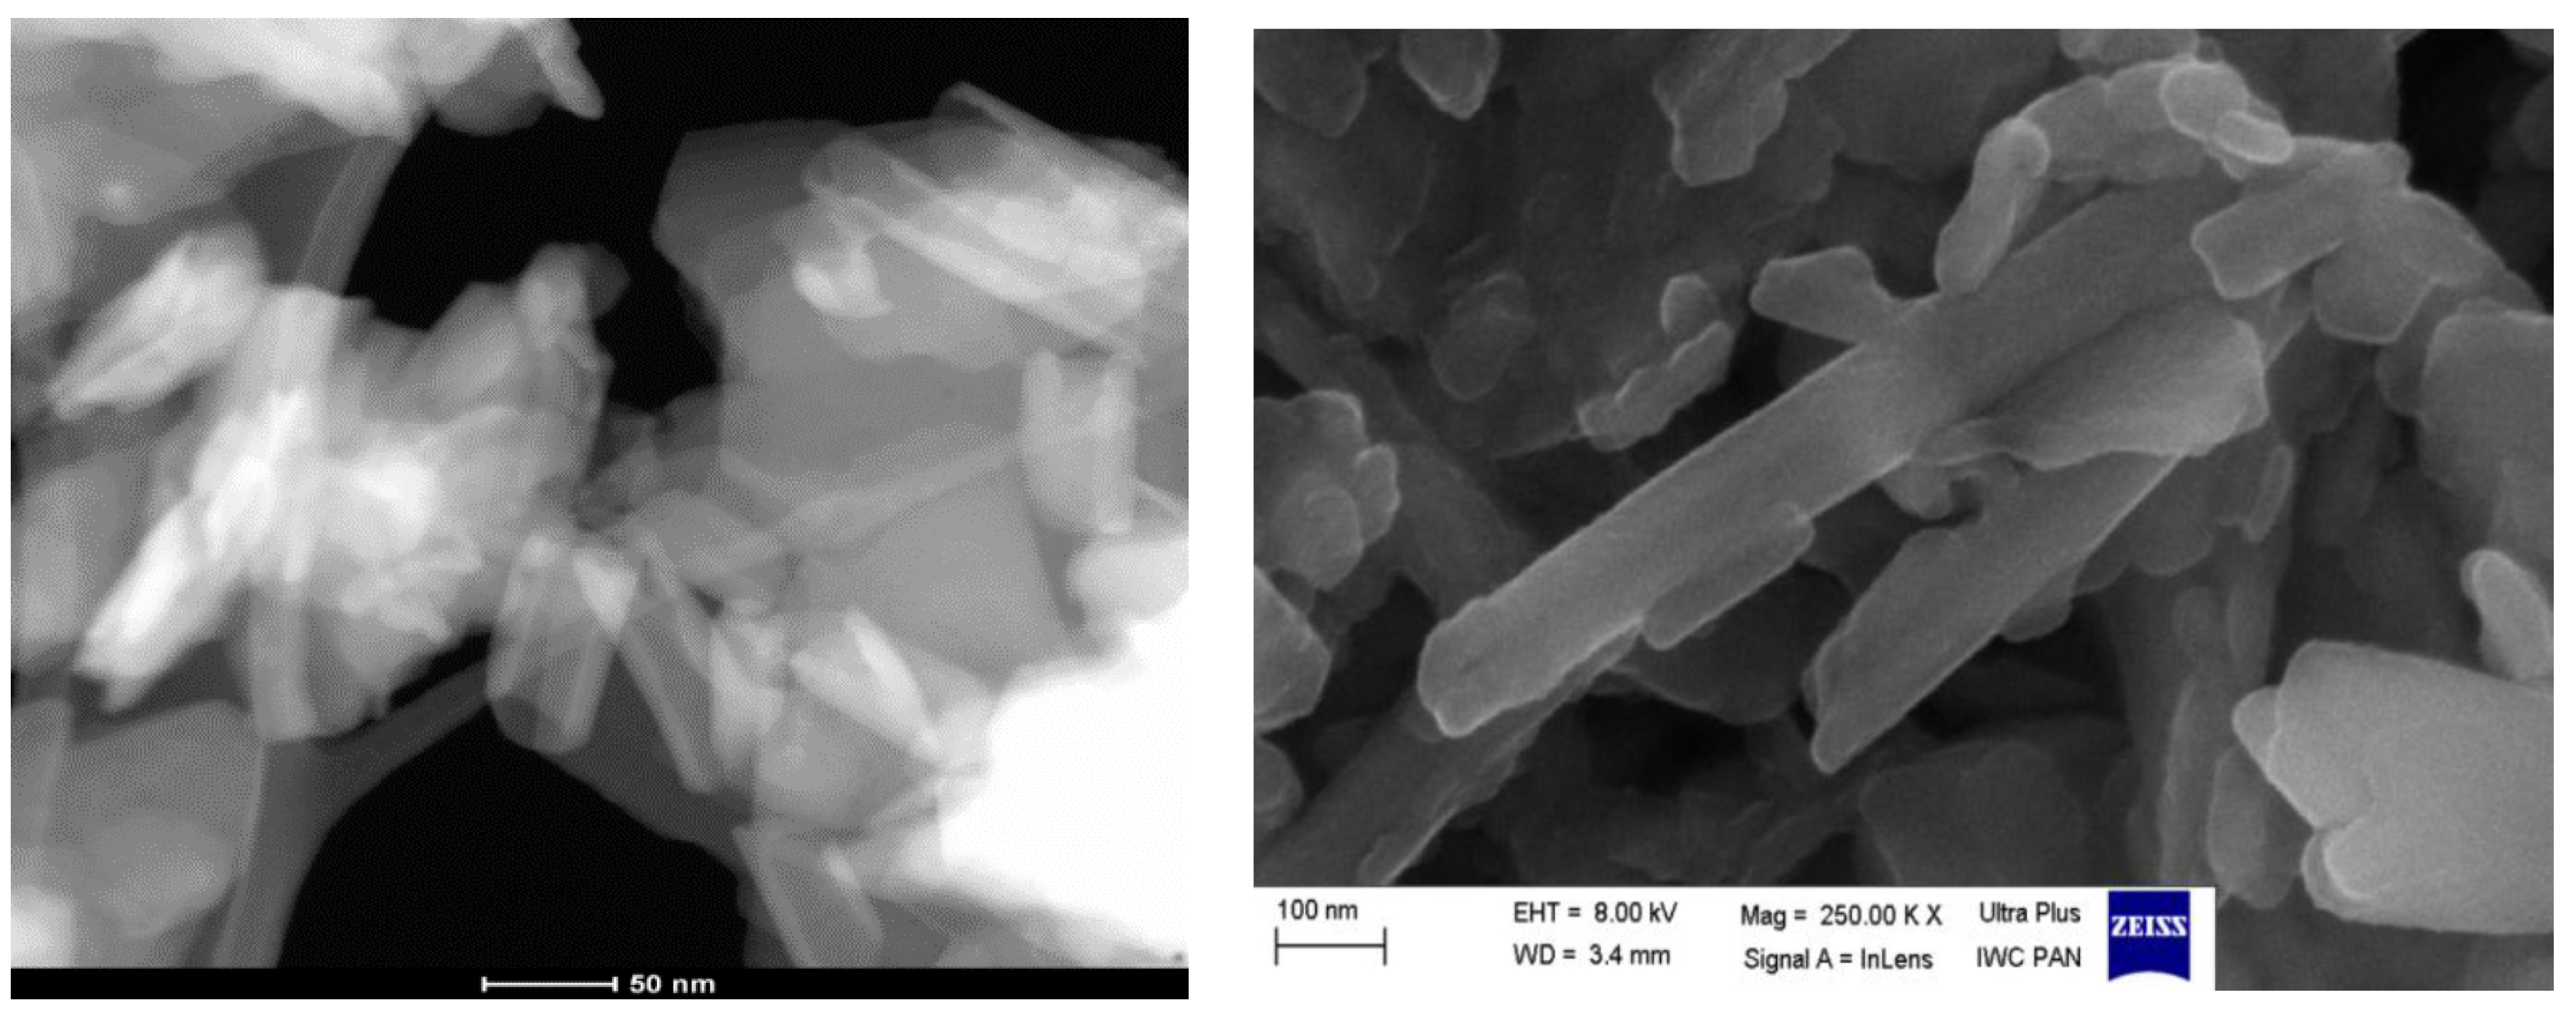
Characterization of the HDTMA/Halloysite Adsorbent
4. Conclusions
Supplementary Materials
Author Contributions
Funding
Conflicts of Interest
References
- Issabayeva, G.; Hang, S.Y.; Wong, M.C.; Aroua, M.K. A review on the adsorption of phenols from wastewater onto diverse gropus of adsorbents. Rev. Chem. Eng. 2018, 34, 855–873. [Google Scholar] [CrossRef]
- Garba, Z.N.; Zhou, W.; Lawan, I.; Xiao, W.; Zhang, M.; Wang, L.; Chen, L.; Yuan, Z. An overview of chlorophenols as contaminants and their removal from wastewater by adsorption: A review. J. Environ. Manag. 2019, 241, 59–75. [Google Scholar] [CrossRef]
- Czaplicka, M. Sources and transformations of chlorophenols in the natural environment. Sci. Total Environ. 2004, 322, 21–39. [Google Scholar] [CrossRef]
- Honda, M.; Kannan, K. Biomonitoring of chlorophenols in human urine from several Asian countries, Greece and the United States. Environ. Pollut. 2018, 232, 487–493. [Google Scholar] [CrossRef]
- Park, Y.; Ayoko, G.A.; Kurdi, R.; Horváth, E.; Kristóf, J.; Frost, R.L. Adsorption of phenolic compounds by organoclays: Implications for the removal of organic pollutants from aqueous media. J. Colloid Interface Sci. 2013, 406, 196–208. [Google Scholar] [CrossRef]
- Ali, I.; Asim, M.; Khan, T.A. Low cost adsorbents for the removal of organic pollutants from wastewater. J. Environ. Manag. 2012, 113, 170–183. [Google Scholar] [CrossRef]
- Lorenc-Grabowska, E.; Diez, M.A.; Gryglewicz, G. Influence of pore size distribution on the adsorption of phenol on PET-based activated carbons. J. Colloid Interface Sci. 2016, 69, 205–212. [Google Scholar] [CrossRef]
- Chen, C.; Geng, X.; Huang, W. Adsorption of 4-chlorophenol and aniline by nanosized activated carbons. Chem. Eng. J. 2017, 327, 941–952. [Google Scholar] [CrossRef]
- Madannejad, S.; Rashidi, A.; Sadeghhassani, S.; Shemirani, F.; Ghasemy, E. Removal of 4-chlorophenol from water using different carbon nanostructures: A comparison study. J. Mol. Liq. 2018, 249, 877–885. [Google Scholar] [CrossRef]
- Lin, S.-H.; Juang, R.-S. Adsorption of phenol and its derivatives from water using synthetic resins and low-cost natural adsorbents: A review. J. Environ. Manag. 2009, 90, 1336–1349. [Google Scholar] [CrossRef]
- Qiu, X.; Li, N.; Ma, X.; Yang, S.; Xu, Q.; Li, H.; Lu, J. Facile preparation of acrylic ester-based crosslinked resin and its adsorption of phenol at high concentration. J. Environ. Chem. Eng. 2014, 2, 745–751. [Google Scholar] [CrossRef]
- Zhang, X.; Li, A.; Jiang, Z.; Zhang, Q. Adsorption of dyes and phenol from water on resin adsorbents: Effect of adsorbate size and pore size distribution. J. Hazard. Mater. 2006, 137, 1115–1122. [Google Scholar] [CrossRef]
- Huang, J.; Jin, X.; Deng, S. Phenol adsorption on an N-methylacemetamide-modified hypercrosslinked resin from aqueous solutions. Chem. Eng. J. 2012, 192, 192–200. [Google Scholar] [CrossRef]
- Huang, J.; Zha, H.; Jin, X.; Deng, S. Efficient adsorptive removal of phenol by a diethylenetriamine-modified hypercrosslinked styrenedivinylbenzene (PS) resin from aqueous solution. Chem. Eng. J. 2012, 195, 40–48. [Google Scholar] [CrossRef]
- Pan, B.; Pan, B.; Zhang, W.; Zhang, Q.; Zhang, Q.; Zheng, S. Adsorptive removal of phenol from aqueous phase by using a porous acrylic ester polymer. J. Hazard. Mater. 2008, 157, 293–299. [Google Scholar] [CrossRef]
- Khalid, M.; Joly, G.; Renaud, A.; Magnoux, P. Removal of phenol from water by adsorption using zeolites. Industrial & Engineering Chemistry Research. Ind. Eng. Chem. Res. 2004, 43, 5275–5280. [Google Scholar]
- Damjanović, L.; Rakić, V.; Rac, V.; Stošić, D.; Auroux, A. The investigation of phenol removal from aqueous solutions by zeolites as solid adsorbents. J. Hazard. Mater. 2010, 184, 477–484. [Google Scholar] [CrossRef]
- Xie, J.; Meng, W.; Wu, D.; Zhang, Z.; Kong, H. Removal of organic pollutants by surfactant modified zeolite: Comparison between ionizable phenolic compounds and non-ionizable organic compounds. J. Hazard. Mater. 2012, 231, 57–63. [Google Scholar] [CrossRef]
- Sarkar, B.; Xi, Y.; Megharaj, M.; Krishnamurti, G.S.M.; Rajarathnam, D.; Naidu, R. Remediation of hexavalent chromium through adsorption by bentonite based Arquad® 2HT-75 organoclays. J. Hazard. Mater. 2010, 183, 87–97. [Google Scholar] [CrossRef]
- Yu, J.-Y.; Shin, M.Y.; Noh, J.-H.; Seo, J.J. Adsorption of phenol and chlorophenols on Ca-montmorillonite in aqueous. Geosci. J. 2004, 8, 185–189. [Google Scholar] [CrossRef]
- Su, J.; Lin, H.-F.; Wang, Q.-P.; Xie, Z.M.; Chen, Z.L. Adsorption of phenol from aqueous solutions by organomontmorillonite. Desalination 2011, 269, 163–169. [Google Scholar] [CrossRef]
- Djebbar, M.; Djafri, F.; Bouchekara, M.; Djafri, A. Adsorption of phenol on natural clay. Appl. Water Sci. 2012, 2, 77–86. [Google Scholar] [CrossRef]
- Zhang, L.; Zhang, B.; Wu, T.; Sun, D.; Li, Y. Adsorption behavior and mechanism of chlorophenols onto organoclays in aqueous solution. Colloids Surf. A Physicochem. Eng. Asp. 2015, 484, 118–129. [Google Scholar] [CrossRef]
- Yang, Q.; Gao, M.; Zang, W. Comparative study of 2,4,6-trichlorophenol adsorption by montmorillonites functionalized with surfactants differing in the number of head group and alkyl chain. Colloids Surf. A Physicochem. Eng. Asp. 2017, 520, 805–816. [Google Scholar] [CrossRef]
- Richards, S.; Bouazza, A. Phenol adsorption in organo-modified basaltic clay and bentonite. Appl. Clay Sci. 2007, 37, 133–142. [Google Scholar] [CrossRef]
- Ocampo-Perez, R.; Leyva-Ramos, R.; Mendoza-Barron, J.; Guerrero-Coronado, R.M. Adsorption rate of phenol from aqueous solution onto organobentonite: Surface diffusion and kinetic models. J. Colloid Interface Sci. 2011, 364, 195–204. [Google Scholar] [CrossRef]
- Gładysz-Płaska, A. Application of modified clay for removal of phenol and PO43− ions from aqueous solutions. Adsorpt. Sci. Technol. 2017, 35, 692–699. [Google Scholar] [CrossRef]
- Cavallaro, G.; Lazzara, G.; Rozhina, E.; Konnova, S.; Kryuchkova, M.; Khaertdinov, N.; Fakhrullin, R. Organic-nanoclay composite materials as removal agents for environmental decontamination. RSC Adv. 2019, 9, 40553–40564. [Google Scholar] [CrossRef]
- Wang, G.; Lian, C.; Xi, Y.; Sun, Z.; Zheng, S. Evaluation of nonionic surfactant modified montmorillonite as mycotoxins adsorbent for aflatoxin B1 and zearalenone. J. Colloid Interface Sci. 2016, 518, 48–56. [Google Scholar] [CrossRef]
- Shen, T.; Gao, M. Gemini surfactant modified organo-clays for removal of organic pollutants from water: A review. Chem. Eng. J. 2019, 375, 121910. [Google Scholar] [CrossRef]
- Lee, S.Y.; Kim, S.J. Adsorption of naphthalene by HDTMA modified kaolinite and halloysite. Appl. Clay Sci. 2002, 22, 55–63. [Google Scholar] [CrossRef]
- Gładysz-Płaska, A.; Lipke, A.; Tarasiuk, B.; Makarska-Białokoz, M.; Majdan, M. Naphthalene sorption on red clay and halloysite modified by quaternary ammonium salts. Adsorpt. Sci. Technol. 2017, 35, 464–472. [Google Scholar] [CrossRef]
- Joussein, E.; Petit, S.; Churchman, G.J.; Theng, B.K.G.; Righi, D.; Delvaux, B. Halloysite clay minerals-a review. Clay Miner. 2005, 40, 383–426. [Google Scholar] [CrossRef]
- Pasbakhsh, P.; Churchman, G.J.; Keeling, J.L. Characterisation of properties of various halloysites relevant to their use as nanotubes and microfibre fillers. Appl. Clay Sci. 2013, 74, 47–57. [Google Scholar] [CrossRef]
- Tana, D.; Yuan, P.; Liu, D.; Du, P. Surface Modifications of Halloysite. In Developments in Clay Science; Elsevier Ltd.: Amsterdam, The Netherlands, 2016; Volume 7, Chapter 8; pp. 167–201. [Google Scholar]
- Hameed, B.H. Equilibrium and kinetics studies of 2,4,6-trichlorophenol adsorption onto activated clay. Colloids Surf. A Physicochem. Eng. Asp. 2007, 307, 45–52. [Google Scholar] [CrossRef]
- Zango, Z.U.; Garba, Z.N.; Bakar, N.H.H.A.; Tan, W.L.; Bakar, M.A. Adsorption studies of Cu2+-Hal nanocomposites for the removal of 2,4,6-trichlorophenol. Appl. Clay Sci. 2016, 132–133, 68–78. [Google Scholar] [CrossRef]
- Olu-Owolabi, B.I.; Alabi, A.H.; Diagboya, P.N.; Unuabonah, E.I.; Düring, R.-A. Adsorptive removal of 2,4,6-trichlorophenol in aqueous solution using calcined kaolinite-biomass composites. J. Environ. Manag. 2017, 192, 94–99. [Google Scholar] [CrossRef]
- Słomkiewicz, P.M.; Szczepanik, B.; Garnuszek, M. Determination of adsorption isotherms of aniline and 4-chloroaniline on halloysite adsorbent by inverse liquid chromatography. Appl. Clay Sci. 2015, 114, 221–228. [Google Scholar] [CrossRef]
- Szczepanik, B.; Słomkiewicz, P. Photodegradation of aniline in water in the presence of chemically activated halloysite. Appl. Clay Sci. 2016, 124, 31–38. [Google Scholar] [CrossRef]
- Brunauer, S.; Emmett, P.H.; Teller, E. Adsorption of gases in multimolecular layers. J. Am. Chem. Soc. 1938, 568, 309–319. [Google Scholar] [CrossRef]
- Gregg, S.J.; Sing, K.S.W. Adsorption. Surface Area and Porosity, 2nd ed.; Academic Press: London, UK, 1982; pp. 41–49. [Google Scholar]
- Paryjczak, T. Gas. Chromatography in Adsorption and Catalysis; Ellis Horwood: Chichester, UK, 1987; pp. 104–114. [Google Scholar]
- Szczepanik, B.; Słomkiewicz, P.M.; Garnuszek, M.; Czech, K. Adsorption of chloroanilines from aqueous solutions on the modified halloysite. Appl. Clay Sci. 2014, 101, 260–264. [Google Scholar] [CrossRef]
- Lech, A. Computer Software KSPD.; Metroster: Toruń, Poland, 2011. [Google Scholar]
- Dorris, G.M.; Gray, D.G. Adsorption of n-alkanes at zero surface coverage on cellulose paper and wood fibers. J. Colloid Interface Sci. 1980, 77, 353–363. [Google Scholar] [CrossRef]
- Schultz, J.; Lavielle, L.; Martin, C. The role of the interface in carbon fibre-epoxy composites. J. Adhes. 1987, 23, 45–60. [Google Scholar] [CrossRef]
- Papirer, E.; Balard, H.; Vidal, A. Inverse gas chromatography: A valuablemethod for the surface characterization of fillers for polymers (glass fibres and silicas). Eur. Polym. J. 1988, 24, 783–790. [Google Scholar] [CrossRef]
- Voelkel, A. Physicochemical measurements (inverse gas chromatography). In Gas Chromatography; Poole, C., Ed.; Elsevier: Amsterdam, The Netherlands, 2012; Chapter 20; pp. 477–494. [Google Scholar]
- Sing, K.S.W.; Everett, D.H.; Haul, R.A.W.; Moscou, L.; Pierotti, R.A.; Rouquerol, J.; Siemieniewska, T. Reporting physisorption data for gas/solid systems with special reference to the determination of surface area and porosity. Pure Appl. Chem. 1985, 57, 603–619. [Google Scholar] [CrossRef]
- Joussein, E.; Petit, S.; Delvaux, B. Behaviour of halloysite clay under formamide treatment. Appl. Clay Sci. 2007, 35, 17–34. [Google Scholar] [CrossRef]
- Cheng, H.; Frost, R.L.; Yang, J.; Liu, Q.; He, J. Infrared and infrared emission spectroscopic study of typical Chinese kaolinite and halloysite. Spectrochim. Acta Part. A Mol. Biomol. Spectrosc. 2010, 77, 1014–1020. [Google Scholar] [CrossRef]
- Apreutesei, R.E.; Catrinescu, C.; Teodosiu, C. Surfactant-modified natural zeolites for environmental applications in water purification. Environ. Eng. Manag. J. 2008, 2, 149–161. [Google Scholar]
- Freundlich, H.M.F. Über die adsorption in lősungen. Z. Phys. Chem. 1906, 57, 385–490. [Google Scholar] [CrossRef]
- Langmuir, I. The constitution and fundamental properties of solids and liquids. J. Am. Chem. Soc. 1916, 38, 2221–2295. [Google Scholar] [CrossRef]
- Program. Origin User’s Manual; Microcal Software Inc.: Northampton, MA, USA, 2018.
- Boudart, M.; Mears, D.E.; Vannice, M.A. Kinetics of heterogeneous catalytic reactions. Ind. Chim. Belg. 1967, 32, 281–284. [Google Scholar]
- Yoshida, S.; Iwamura, S.; Ogino, I.; Mukat, S.R. Adsorption of Phenol in flow systems by a monolithic carbon cryogel with microhoneycomb structure. Adsorption 2016, 22, 1051–1054. [Google Scholar] [CrossRef]
- Hanen, N.; Abdelmottaleb, Q. Modeling of the dynamic adsorption of phenol from an aqueous solution on activated carbon from olive stones. Int. J. Chem. Eng. Appl. 2013, 4, 254. [Google Scholar]
- Elsami, A.; Mehralian, M.; Moheb, A. A study of 4-chlorophenol continuous adsorption on nano graphene oxide column: Model comparison and breakthrough behaviors. J. Water Reuse Desalin. 2017, 7, 272–279. [Google Scholar]
- Pinelli, D.; Bacca, A.E.M.; Kaushik, A.; Basu, S.; Nocentini, M.; Bertin, L.; Frascari, D. Batch and continuous flow adsorption of phenolic compounds from olive mill wastewater: A comparison between nonionic and ion exchange resins. Int. J. Chem. Eng. 2016, 2016, 13. [Google Scholar] [CrossRef]


| Adsorbate | Adsorbent | Adsorption Capacity (mg/g) |
|---|---|---|
| Phenol | Activated Carbons (Granular, Commercial, Powdered, Activated) | 350.0, 322.5, 303.0, 283.3 |
| Sawdust | 64.0 | |
| Chitosan | 59.74 | |
| Red Mud | 59.2 | |
| Hollow Mesoporous Carbon Sphere | 207.8 | |
| Magnetic Nanoparticles | 123.45 | |
| Graphene Aerogels-Mesoporous Silica | 90.0 | |
| Multiwalled Carbon Nanotubes | 64.6 | |
| HDTMA-Clinoptilolite Zeolite | 11.4 [10] | |
| HDTMA-Montmorillonite | 94.9 [10] | |
| 2-Chlorophenol | Red Mud | 117.3 |
| Carbon Nanotubes | 86.1 | |
| Chitosan | 70.52 | |
| Hypersol-Macronet Resins | 125.7, 136.2 [10] | |
| Natural Clay | 23.59 [2] | |
| 4-Chlorophenol | Activated Carbons (Commercial, Granular, Activated) | 500.0, 319.9, 280.0 |
| Red Mud | 127.1 | |
| Chitosan | 96.43 | |
| Carbon Nanotubes | 51.5 | |
| Hypersol-Macronet Resins | 144.4, 163.2 | |
| Amberlite XAD-16 | 291.6 [10] | |
| 2-, 4-Dichlorophenol | Corn Cob Activated Carbon | 451.2 |
| Chitosan | 315.46 | |
| Red Mud | 130.0 | |
| 2-, 5-Dichlorophenol | Porous Clay Heterostructure | 45.5 |
| 3-, 4-Dichlorophenol | Porous Clay Heterostructure | 48.7 |
| 2-, 4-, 6-Trichlorophenol | Coconut Husk Activated Carbon | 716.1 |
| Chitosan | 375.94 | |
| Coconut Shell Activated Carbon | 122.34 | |
| Copper (II)-Halloysite Nanotubes | 135.06 | |
| Na-Montmorillonite Modified Different Surfactants | 328.9, 306.7 [24] |
| Parameter | HAL | HDTMA/HAL |
|---|---|---|
| Surface Area SBET (m2/g) | 47 | 43 |
| Total Pore Volume Vt (cm3/g) | 0.1773 | 0.1716 |
| Micropore Volume Vmik (cm3/g) | 0.0061 | 0.0058 |
| Mezopore Volume Vmez (cm3/g) | 0.1713 | 0.1658 |
| Pore Diameter (nm) | 16.8 | 17.6 |
| Adsorbent | Dispersive Free Adsorption Energy of Adsorbate (kJ/mol) | KB | Ka | Kb/Ka | ||
|---|---|---|---|---|---|---|
| Methanol | Acetonitryle | Ethylacetate | ||||
| HAL | −7.3 | −13.1 | −11.7 | 0.41 | 0.64 | 0.64 |
| HDTMA/HAL | −4.5 | −9.3 | −8.5 | 0.46 | 0.43 | 1.06 |
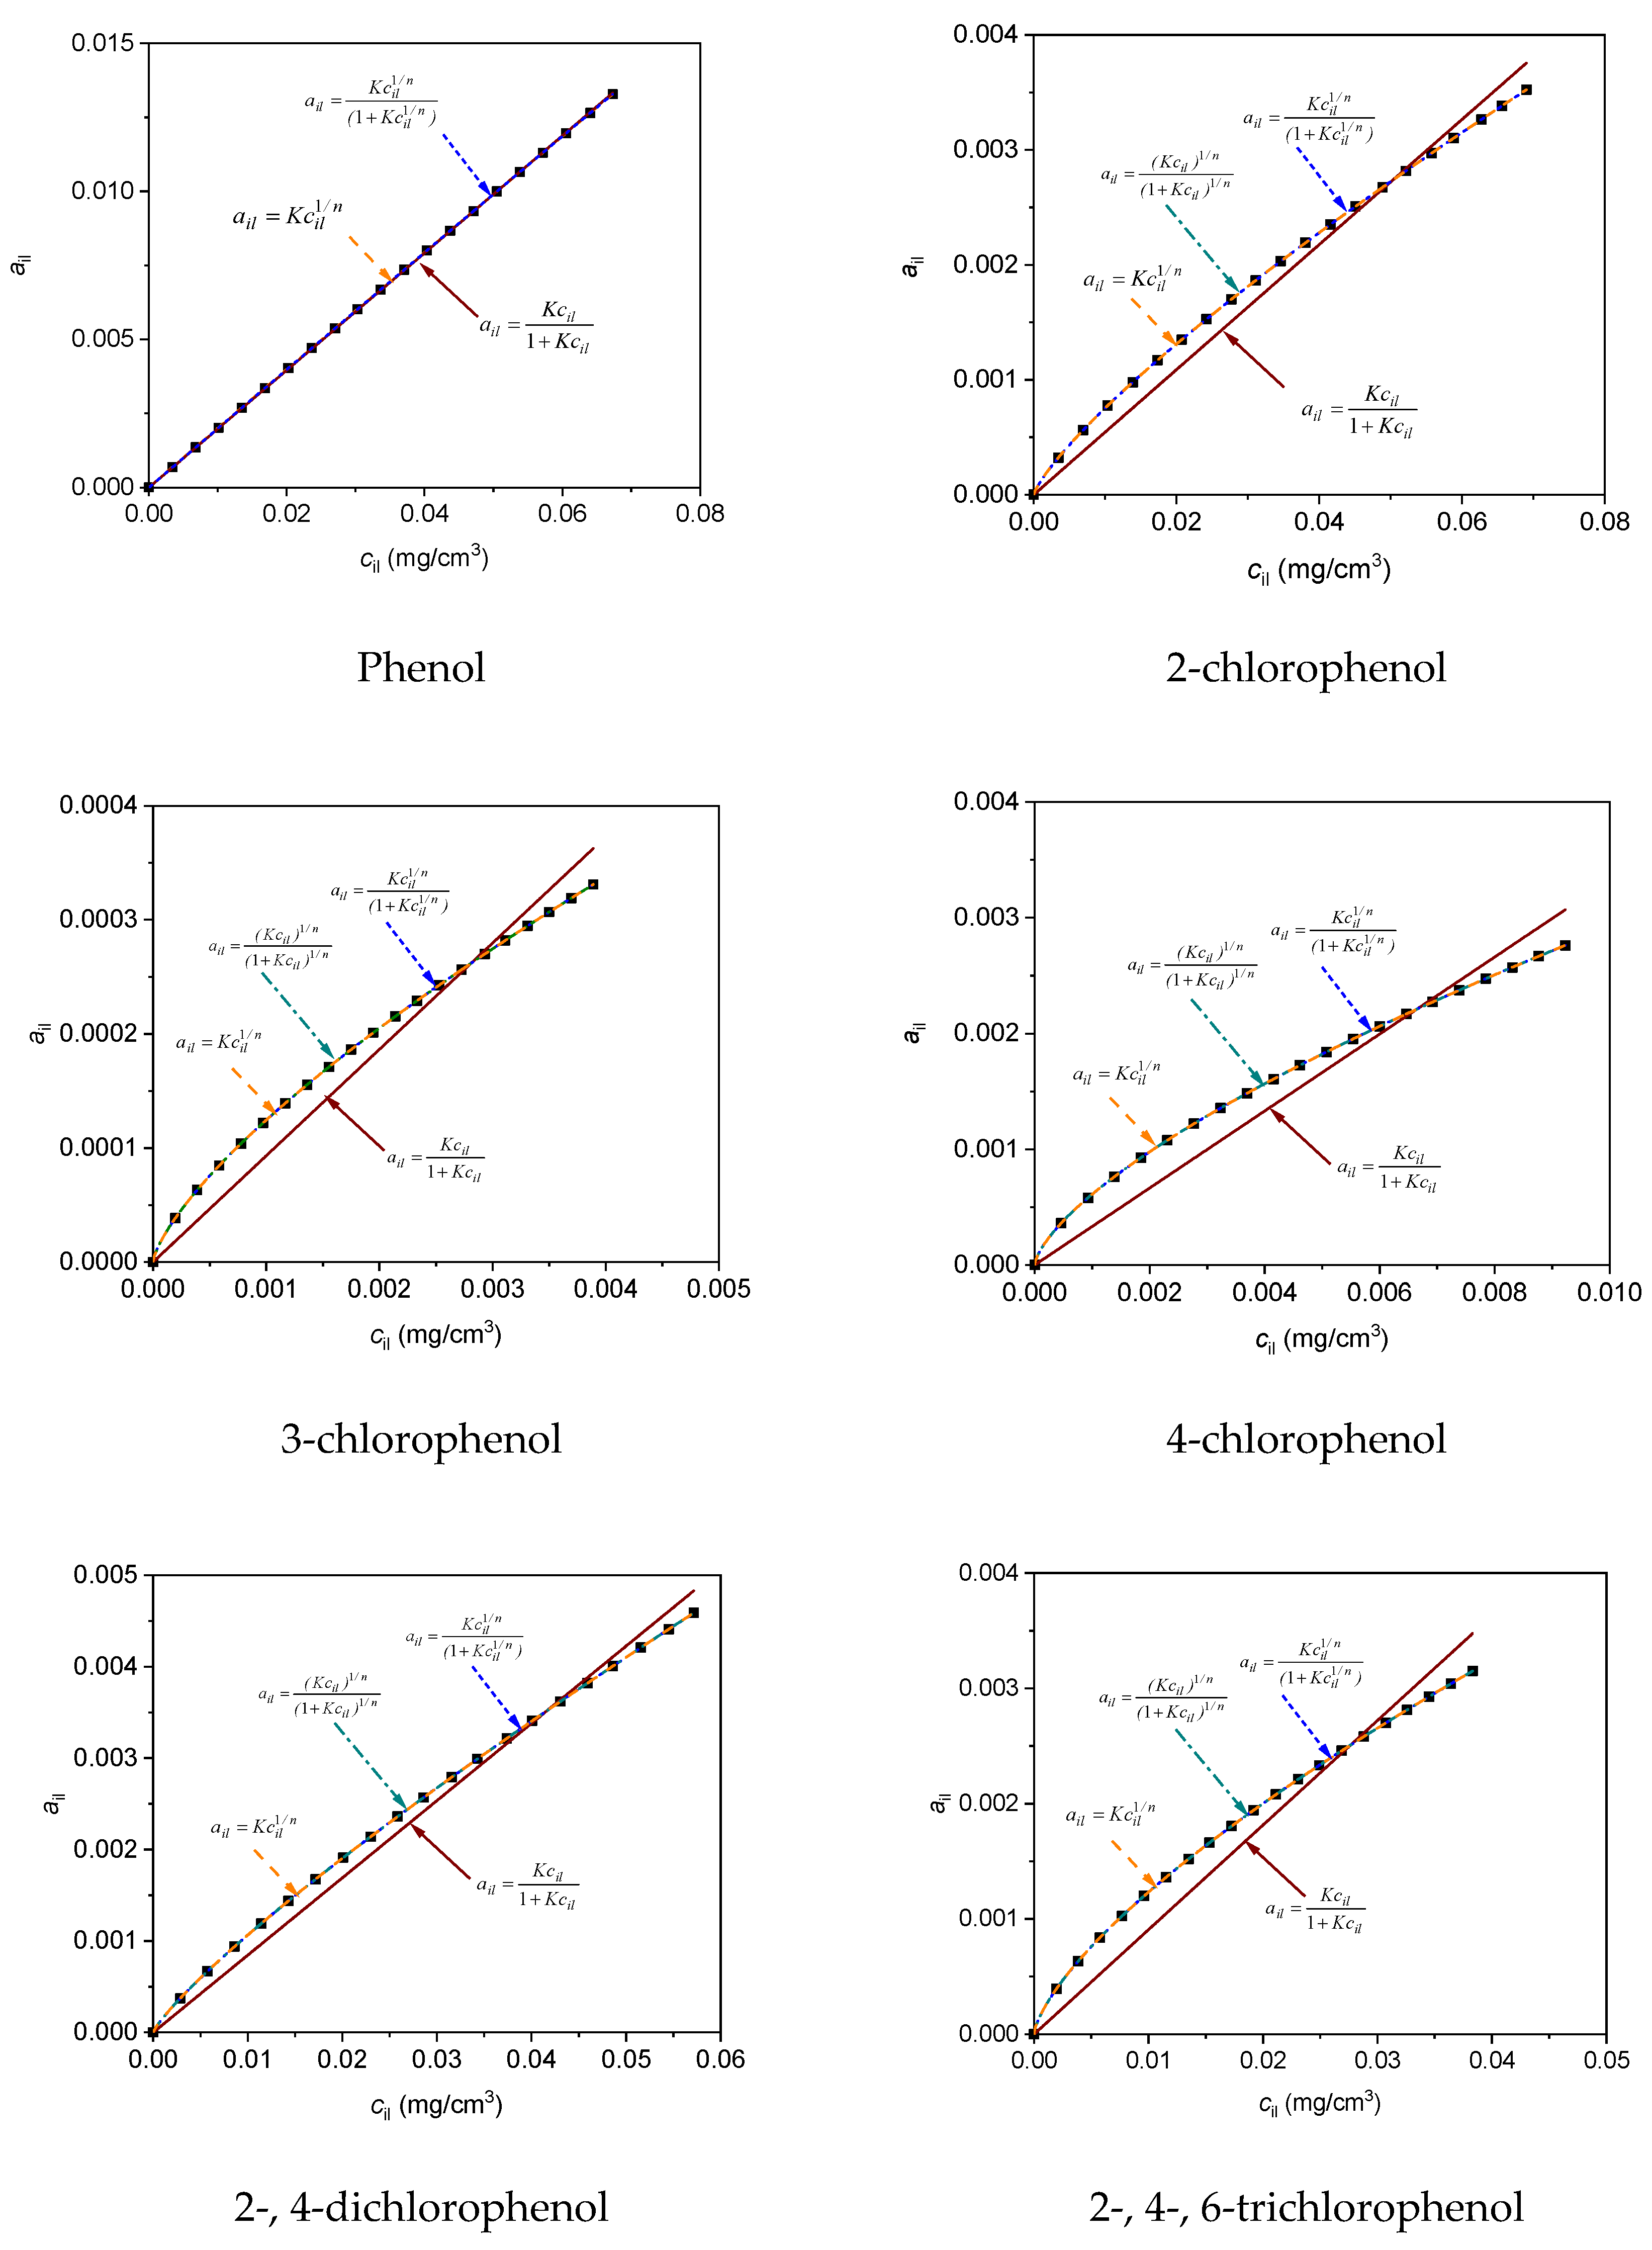
| Number of Equation | Equation | Adsorption Model |
|---|---|---|
| (16) a | one-center adsorption without dissociation | |
| (17) b | n-center adsorption without dissociation | |
| (18) b | n-center adsorption with dissociation | |
| (19) b | Freundlich adsorption |
| Number of Equation | (16) | (17) | (18) | (19) |
|---|---|---|---|---|
| Phenol | ||||
| Adsorption Equilibrium Constant K | 0.098 | 0.201 | - | 0.193 |
| Error | 0.0586 | 0.06529 | - | 0.0263 |
| Coefficient n | 1.09 | - | 0.99 | |
| Error | - | 0.0043 | - | 0.0458 |
| Chi-Square Minimization | 4.46 × 10⁻⁸ | 3.34 × 10⁻¹⁰ | - | 2.90 × 10⁻⁹ |
| Regression Coefficient | 0.9745 | 0.9999 | - | 0.9879 |
| 2-chlorophenol | ||||
| Adsorption Equilibrium Constant K | 0.027 | 0.030 | 0.040 | 0.025 |
| Error | 0.0043 | 0.0041 | 0.0231 | 0.0741 |
| Coefficient n | - | 1.25 | 1.18 | 1.25 |
| Error | - | 0.0087 | 0.034 | 0.0928 |
| Chi-Square Minimization | 5.39 × 10⁻⁷ | 2.35 × 10⁻¹⁰ | 1.46 × 10⁻⁸ | 1.29 × 10⁻⁸ |
| Regression Coefficient | 0.9762 | 0.9999 | 0.9235 | 0.9829 |
| 3-chlorophenol | ||||
| Adsorption Equilibrium Constant K | 0.046 | 0.018 | 0.004 | 0.017 |
| Error | 0.0003 | 0.0009 | 0.0034 | 0.0819 |
| Coefficient n | - | 1.39 | 1.39 | 1.39 |
| Error | - | 0.0007 | 0.098 | 0.0824 |
| Chi-Square Minimization | 5.44 × 10⁻⁸ | 4.77 × 10⁻⁹ | 9.16 × 10⁻⁷ | 5.28 × 10⁻⁶ |
| Regression Coefficient | 0.9463 | 0.9998 | 0.9526 | 0.9833 |
| 4-chlorophenol | ||||
| Adsorption Equilibrium Constant K | 0.016 | 0.067 | 0.019 | 0.066 |
| Error | 0.0043 | 0.0024 | 0.0086 | 0.0342 |
| Coefficient n | - | 1.47 | 1.47 | 1.47 |
| Error | - | 0.0011 | 0.068 | 0.0674 |
| Chi-Square Minimization | 4.90 × 10⁻⁸ | 3.21 × 10⁻¹⁰ | 8.19 × 10⁻⁷ | 6.78 × 10⁻⁸ |
| Regression Coefficient | 0.9233 | 0.9997 | 0.9832 | 0.9752 |
| 2-, 4-dichlorophenol | ||||
| Adsorption Equilibrium Constant K | 0.042 | 0.051 | 0.028 | 0.050 |
| Error | 0.0054 | 0.0015 | 0.0018 | 0.0280 |
| Coefficient n | - | 1.19 | 1.20 | 1.20 |
| Error | - | 0.0017 | 0.0821 | 0.0215 |
| Chi-Square Minimization | 2.47 × 10⁻⁸ | 1.15 × 10⁻¹⁰ | 1.87 × 10⁻⁶ | 5.18 × 10⁻⁸ |
| Regression Coefficient | 0.9871 | 0.9989 | 0.9643 | 0.9869 |
| 2-, 4-, 6-trichlorophenol | ||||
| Adsorption Equilibrium Constant K | 0.045 | 0.031 | 0.006 | 0.031 |
| Error | 0.0014 | 0.0023 | 0.0054 | 0.0305 |
| Coefficient n | - | 1.42 | 1.45 | 1.42 |
| Error | - | 0.0063 | 0.0653 | 0.0116 |
| Chi-Square Minimization | 5.34 × 10⁻⁸ | 1.18 × 10⁻¹⁰ | 1.07 × 10⁻⁷ | 3.67 × 10⁻⁸ |
| Regression Coefficient | 0.9352 | 0.9975 | 0.9876 | 0.9874 |
| Adsorbate | PH | 2CPH | 3CPH | 4CPH | 24DCPH | 246TCPH |
|---|---|---|---|---|---|---|
| T (K) | K (cm3∙mg−1)1/n | |||||
| 298 | 0.201 | 0.031 | 0.018 | 0.067 | 0.051 | 0.031 |
| 303 | 0.184 | 0.025 | 0.014 | 0.055 | 0.041 | 0.025 |
| 313 | 0.160 | 0.019 | 0.011 | 0.043 | 0.030 | 0.021 |
| Adsorbate | PH | 2CPH | 3CPH | 4CPH | 24DCPH | 246TCPH |
|---|---|---|---|---|---|---|
| Adsorption Enthaply ΔHa (kJ∙mol−1) | −11.6 | −23.3 | −26.3 | −22.9 | −26.1 | −18.4 |
| Standard Adsorption Entropy (J∙mol−1K−1) | −25.7 | −49.3 | −54.8 | −53.3 | −63.9 | −32.8 |
| Standard Entropy a (J∙mol−1K−1) | 143.2 | 187.4 | 160.2 | 163.3 | 183.1 | 122.8 |
| Boudart’s rules b | ||||||
| < 0 | −6.2 < 0 | −12.8 < 0 | −13.2 < 0 | −12.8 < 0 | −15.5 < 0 | −7.8 < 0 |
| < | |−6.2| < 34.3 | |−12.8| < 44.8 | |−13.2| < 38.3 | |−12.8| < 39.1 | |−15.5| < 43.8 | |−7.8| < 29.4 |
| Adsorbate | PH | 2CPH | 3CPH | 4CPH | 24DCPH | 246TCPH |
|---|---|---|---|---|---|---|
| T (K) | a (mg∙g−1) | |||||
| 298 | 34.5 | 18.6 | 8.1 | 11.8 | 6.9 | 3.8 |
| 303 | 29.8 | 14.3 | 7.9 | 10.2 | 6.4 | 3.6 |
| 313 | 17.6 | 12.9 | 7.1 | 9.3 | 6.2 | 3.3 |
© 2020 by the authors. Licensee MDPI, Basel, Switzerland. This article is an open access article distributed under the terms and conditions of the Creative Commons Attribution (CC BY) license (http://creativecommons.org/licenses/by/4.0/).
Share and Cite
Słomkiewicz, P.; Szczepanik, B.; Czaplicka, M. Adsorption of Phenol and Chlorophenols by HDTMA Modified Halloysite Nanotubes. Materials 2020, 13, 3309. https://doi.org/10.3390/ma13153309
Słomkiewicz P, Szczepanik B, Czaplicka M. Adsorption of Phenol and Chlorophenols by HDTMA Modified Halloysite Nanotubes. Materials. 2020; 13(15):3309. https://doi.org/10.3390/ma13153309
Chicago/Turabian StyleSłomkiewicz, Piotr, Beata Szczepanik, and Marianna Czaplicka. 2020. "Adsorption of Phenol and Chlorophenols by HDTMA Modified Halloysite Nanotubes" Materials 13, no. 15: 3309. https://doi.org/10.3390/ma13153309
APA StyleSłomkiewicz, P., Szczepanik, B., & Czaplicka, M. (2020). Adsorption of Phenol and Chlorophenols by HDTMA Modified Halloysite Nanotubes. Materials, 13(15), 3309. https://doi.org/10.3390/ma13153309