Abstract
This paper presents a systematic framework to evaluate the performance of conservation voltage reduction (CVR) by determining suitable substations for CVR in operations planning. Existing CVR planning practice generally only focuses on the energy saving aspect without taking other underlying attributes into account, i.e., network topology and reduced voltage effects on other substations. To secure the desired operating reserve and avoid any adverse impacts, these attributes should be considered for implementing CVR more effectively. This research develops a practical decision-making framework based on the analytic hierarchy process (AHP) to quantify several of the aforementioned attributes. Candidate substations for CVR deployment are prioritized such that performances are compared in terms of power transfer distribution factor (PTDF), voltage sensitivity factor (VSF), and CVR factor. In addition, to meet a specified reserve requirement, an integer programming approach is adopted to select potential substations for CVR implementations. Case studies for a Korean electric power system under diverse operating conditions are performed to demonstrate the effectiveness of the proposed method.
1. Introduction
Conservation voltage reduction (CVR) has been implemented by many electric power utilities for decades as a practical method to decrease peak demand and save energy by lowering the voltage level on distribution systems in a controlled manner [1]. CVR helps secure operating reserve especially during peak times or in emergencies. The economic and environmental effects of CVR are worth mentioning [2,3,4]. Electric energy efficiency programs on distribution systems such as CVR and demand response (DR) have been developed to improve energy efficiency, reliability, and security [5,6]. CVR should be non-intrusive to the utility customers, and it needs to be coordinated with the DR program; CVR should be implemented before DR in peak times or emergencies caused by unexpected generation trip or sudden load increase [7].
It is noteworthy that many utilities have recently evaluated their CVR performance through numerous commissions and strategies as well as the technical and economic benefits of peak demand reduction and energy savings [1,2,3,4,5,6,8,9,10,11,12,13,14,15,16,17,18,19,20,21,22]. The Pacific Northwest National Laboratory (PNNL) reported that the CVR on a national level in the U.S. can be extrapolated to be 3.04% reduction in annual energy consumption [17]. The study in [2] achieved 1.2% energy reduction, 1.2% peak demand, and 0.5% economic savings for a voltage reduction of 2.25% in New York City networks. The study in [18] revealed that the CVR in the Korea electric power system may lead to 0.36%∼0.79% load reduction per 1% voltage reduction. The IEEE Smart Distribution Working Group (SDWG) has the established Distribution Management System Task Force (DMSTF) and Volt-Var Control Task Force (VVTF) to improve energy efficiency using various techniques for monitoring, managing, and controlling the electrical distribution system such as the CVR and Volt-Var Optimization (VVO) [23]. With the increasing penetration of distributed generation (DG), it now becomes critical to harmoniously integrate the CVR in the VVO with DG controls in order to maintain the voltage level within acceptable limits [24].
Despite the numerous studies on the benefits of CVR and the success stories mentioned earlier, the CVR performance is often debated because it depends on numerous utility-specific factors, including voltage dependency of customer loads and network topology. This paper is, however, motivated to improve the existing practice of CVR planning. It is often based on a fixed planning case and focuses on demand reduction without investigating other critical aspects of CVR, for example its impacts on actually secured operating reserves and voltage profiles of the adjacent buses, which will be detailed in this paper. It is thus desired to develop a practical framework for evaluating the CVR performance in operations, which can be integrated into existing energy management systems (EMS). Changes in, for example, network topology and loading conditions can be reflected in the study to provide more reliable and predictable CVR performance in conjunction with the network security analysis that EMS performs at every operating period; the desired CVR performance can be specified. Note also that multiple criteria in the decision-making process often lead to inconsistent solutions. Priorities of these multiple criteria may also change in grid operations. In case of emergency and considering the natural and physical constraints of the CVR, it is not desired to deploy CVR more than necessary.
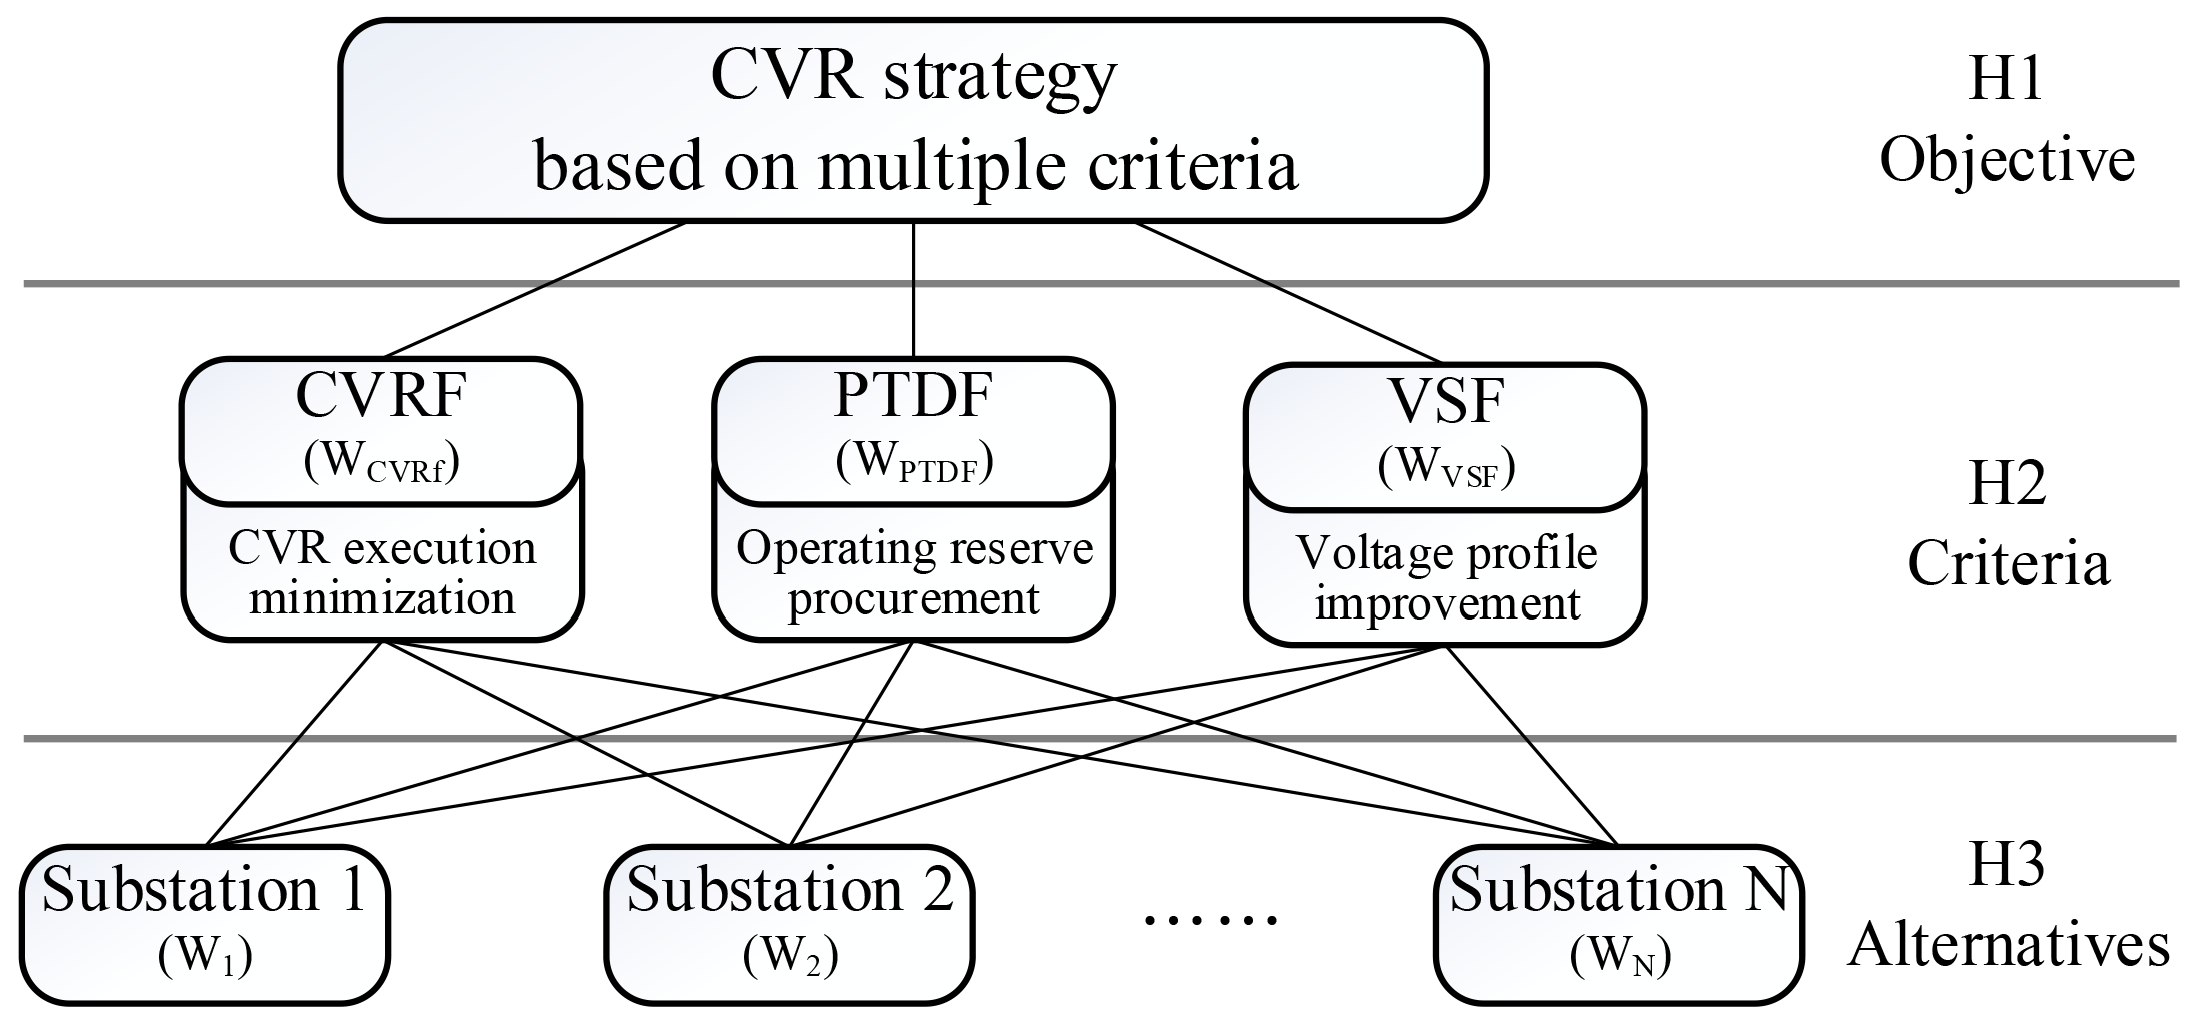
This research thus develops a framework for planning CVR based on the analytic hierarchy process (AHP) [25,26,27,
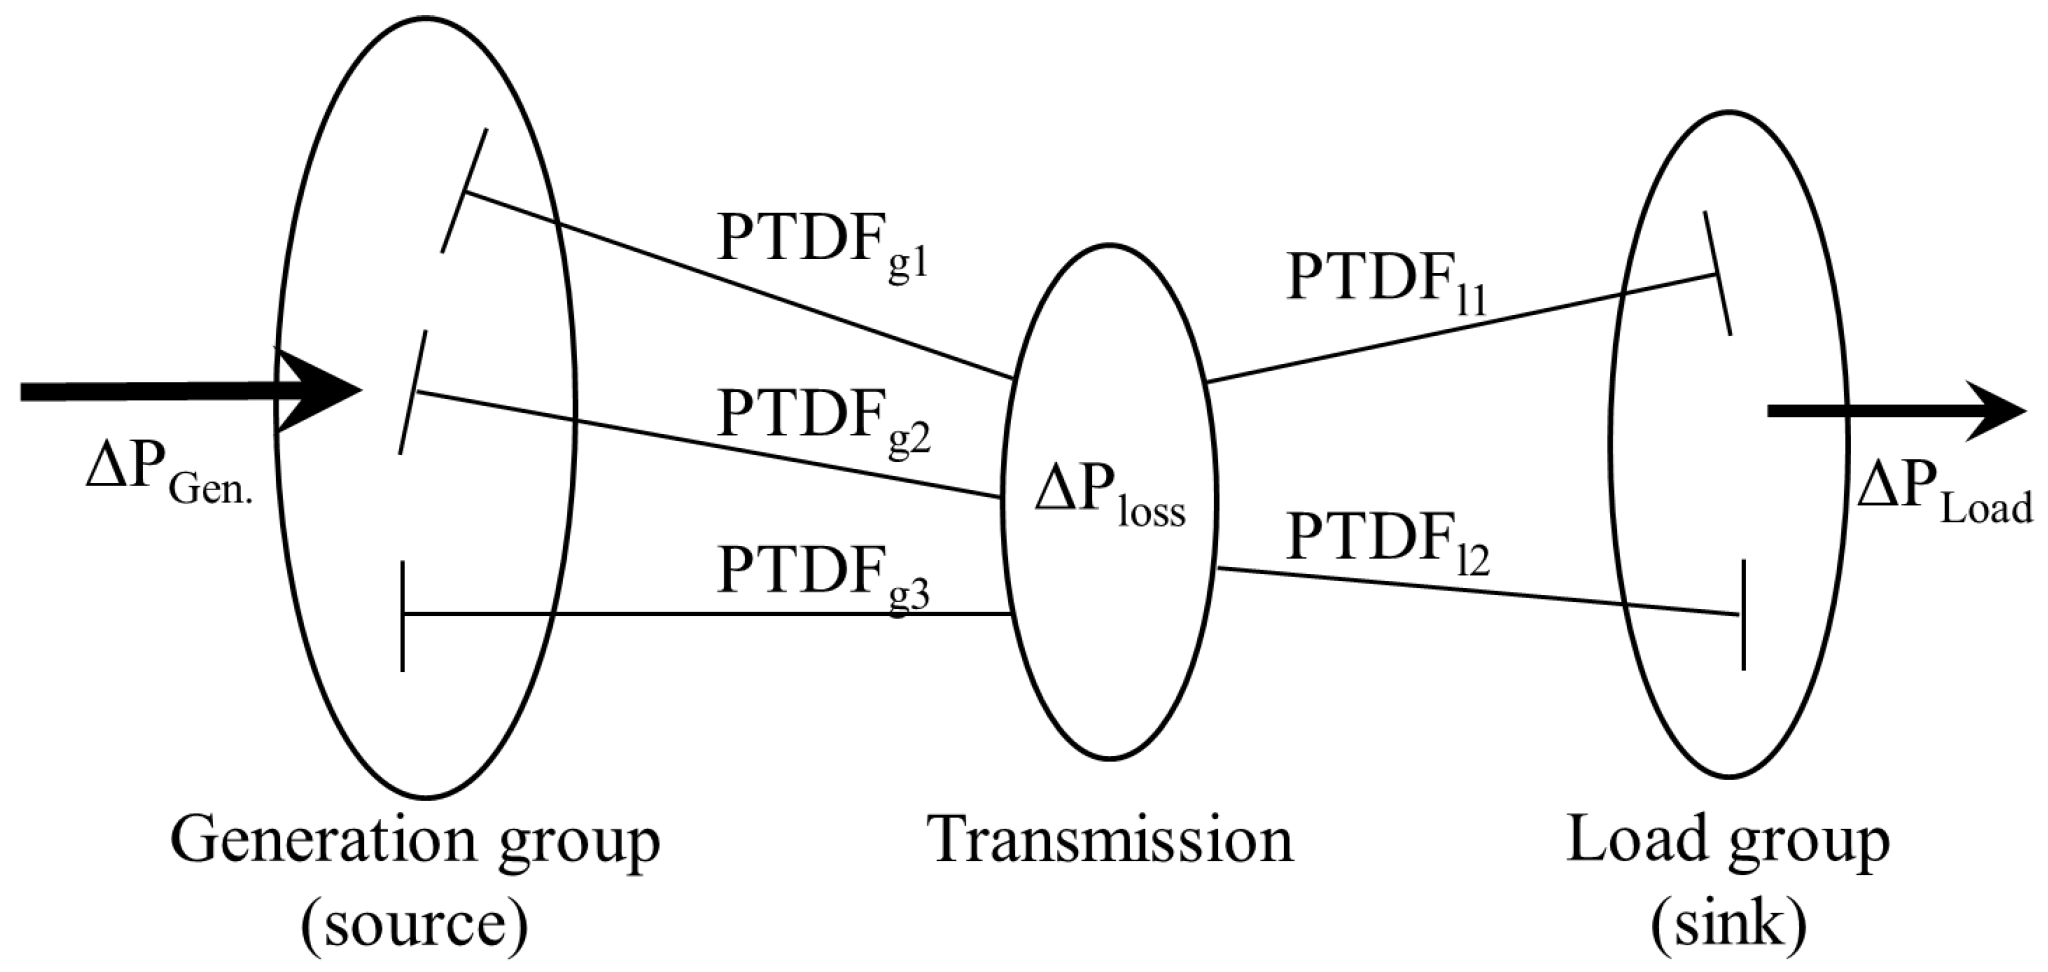
28] to systematically handle multiple criteria, rank the options based on grid conditions, and optimally select feeders or substations at a particular operating time. The effect of CVR, such as the power transfer distribution factor (PTDF) [29,30] and voltage sensitivity factor (VSF) [31] on the network, on top of CVR factor (CVRf), are incorporated in the framework criteria. The system-wide effect of the CVR can finally be analyzed. 
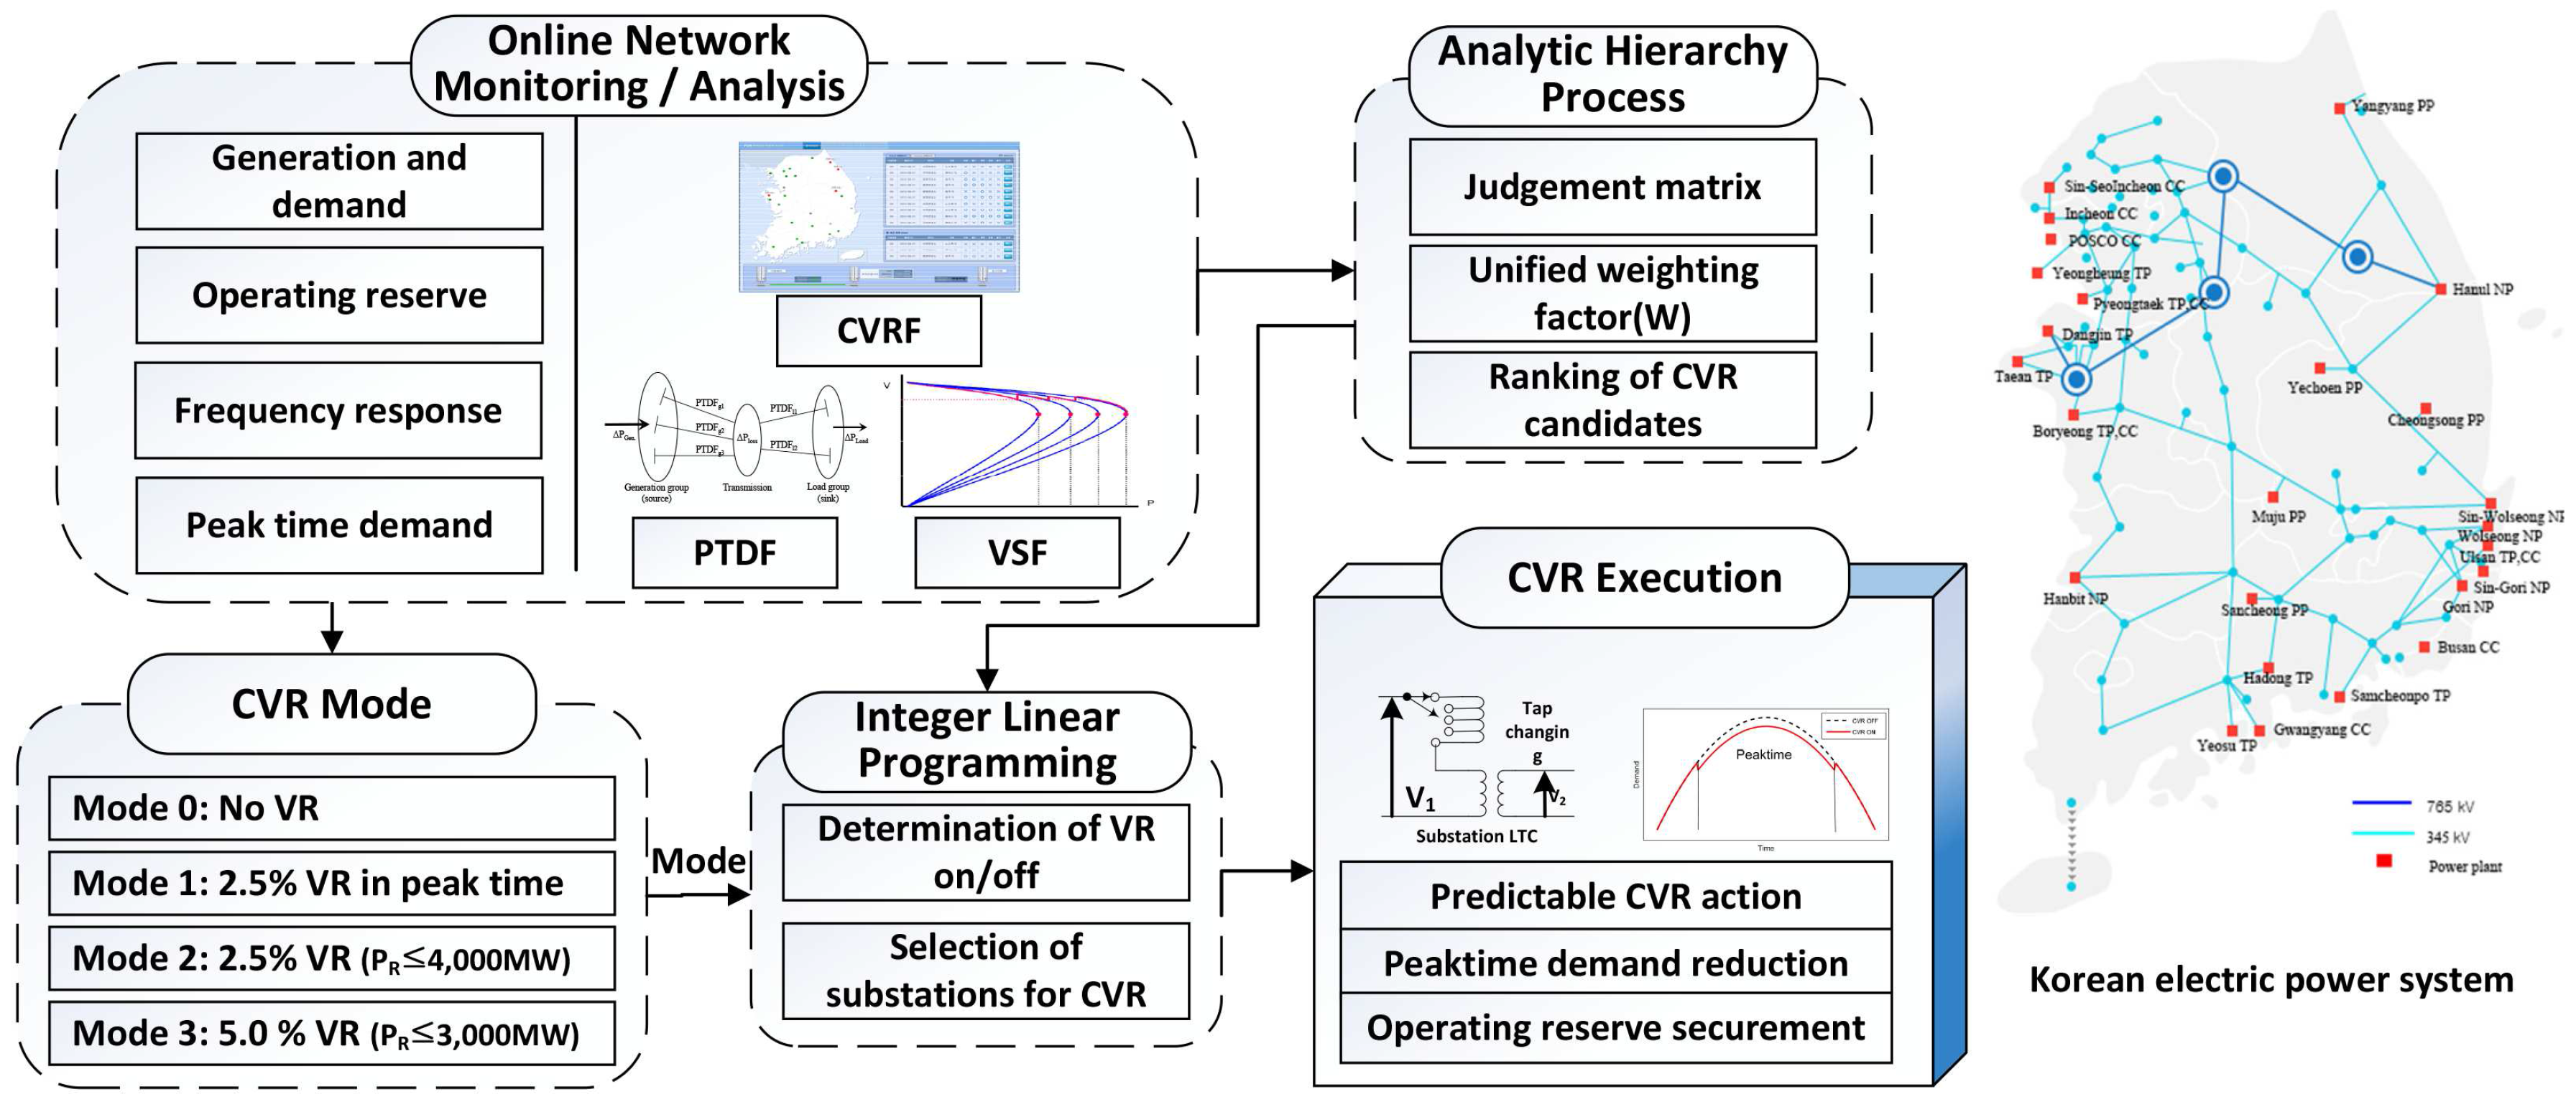
Figure 1 illustrates the proposed framework and its application to the Korean electric power system.
Figure 1.
A proposed framework for the Korean electric power system.
It is still extremely challenging to identify the load characteristics in operations planning. This research, however, envisions that a reasonably accurate identification of load dependency on the feed voltage should be achievable through on-going data gathering and analysis efforts [2,19], and parameters of the load model can be obtained and validated through field measurement. The CVRf can then be calculated based on the load model, reflecting the voltage dependency of the load. A field-validated load model should be essential for subsequent network security analysis as well.
This paper is organized as follows: Section 2 provides a useful background of the CVR. The application of AHP for CVR planning is presented in Section 3. Section 4 presents the optimal selection of the substations for CVR execution using integer linear programming (ILP). Section 5 and Section 6 show case studies for demonstrating the effectiveness of the proposed CVR followed by concluding remarks in Section 7.
2. A Preliminary Network Analysis of CVR
2.1. Conservation Voltage Reduction
The effect of CVR at each substation can be understood from the CVRf as defined below:
where is the change in load consumption and is the voltage reduction.
The CVRf indicates the demand reduction and varies with time and season due to the change in the load composition, i.e., its voltage dependency. Therefore, it is quite important to develop an accurate load model at each substation for successfully assessing CVRf and subsequent network analysis. A simple yet practical ZIP model for evaluating the CVR performance is used [2,4,17]. The ZIP model represents the constant impedance (Z), constant current (I), and constant power (P) characteristics of the load at each substation:
where and are the active and reactive power at nominal voltage , respectively, and the coefficients for the real power (, , ) and reactive power (, , ) are percentages of the load, which are constant impedance, constant current, and constant power, respectively. The sum of coefficients for real power and reactive power is one.
Estimation of CVRf from the ZIP Model
The CVRf can be easily derived from the ZIP model parameters. The load variation due to voltage reduction in estimating the CVRf is calculated as follows [18]:
where and represent and , respectively, and denotes the voltage variation that can be derived by . Therefore, the load variation can be expressed as follows:
where is negligible and can be ignored for simplicity.
Consequently, CVRf per unit (p.u.) based on the ZIP load model at each substation k can be calculated as follows:
The actual CVRf is then derived from Equation (6):
where is the nominal power and is the voltage variation at substation k. Then, the total amount of reduced load by CVR deployed N substations can be calculated as:
The desired total power reduction can be achieved by selecting the available substations and controlling the voltage level based on the previously calculated CVRf at each substation.
2.2. Power Transfer Distribution Factor
As is well understood, CVR helps secure operating reserve, but it depends on the substations where the CVR is deployed, which is often neglected in existing practice.
The PTDF well represents the incremental effect of power transfer from generators (source) to loads (sink) on a line flow, i.e., the sensitivity of the flow on each transmission line as shown below:
where i, j, and l are the source, sink, and line index, respectively. is the power transfer from source i to sink j, and is the change in the power flow on line l. The source includes all generators, and the sink includes the individual CVR candidate or all CVR candidates in each area.
The PTDF based on the DC power flow method cannot, however, reflect the change in generation caused by the reduction in sink. This work thus employs AC-PTDF to calculate the change in generation; this method considers the full Jacobian and transmission loss [32]. Figure 2 shows the AC-PTDF concept when a specified amount of power is injected at the source and withdrawn at the sink. The change in the total generation can be calculated using the power reduction of the CVR candidates as follows:
where represents the percentage of line flow from the source to all transmission lines, and represents the percentage of line flow from all transmission lines to the sink. denotes the transmission loss. It represents how CVR at particular buses secures the operating reserve.
Figure 2.
AC-PTDF with power injection at source and power withdrawal at sink.
2.3. Voltage Sensitivity Factor
Demand reduction can relieve congestion and help improve the overall voltage profile in the neighboring power system. The VSF defined below is useful for investigating this effect:
where i, j, and k are the source, sink, and bus index, respectively; is the power transfer from source i to j; and is the change in the voltage magnitude at bus k associated with power transfer .
Higher VSF indicates the voltage weak bus(or area), the smaller change in load power, and the larger change in voltage magnitude. The overall voltage improvement due to the CVR is evaluated using the following index:
where g and l are the source including all generators and the sink including the loads, respectively. is the number of buses in the transmission system.
3. AHP for CVR
This section presents the AHP-based algorithm to select substations for CVR deployment based on the multi-criteria discussed earlier: CVRf, PTDF, and VSF. The hierarchy model for the proposed CVR is illustrated in Figure 3.
Figure 3.
Hierarchy model of the proposed CVR strategy.
3.1. Overview of AHP
AHP is a decision-making technique for analyzing complex decisions based on a hierarchical structure. The priority of alternatives in each criterion can be evaluated by judgment and comparison of a series of pairs of factors using the ratio scale method, i.e., a judgment matrix.
The steps of the AHP algorithm are described as follows [25,26,27,28]:
- Set up a hierarchy model, including the decision objective (H1), criteria (H2) for assessing the alternatives, and alternatives (H3).
- Create a judgment matrix for each criterion. The value of the elements in the judgment matrix reflects the relative importance between every pair of factors, as listed in Table 1. Judgment matrix can be formulated as follows:where , which is an element of judgment matrix , represents the relative importance of the i-th alternative compared with the j-th alternative.
Table 1. Intensity scale of importance. - Calculate the maximal eigenvector of each judgment matrix for weighting factors. Two approximate approaches such as root and sum methods are in general adopted to determine the weighting factors for computational efficiency [26]. This research adopts the sum method because it is simple and intuitive. The steps of the sum method are summarized as follows:
- Normalize every column in the judgment matrix. The judgment matrix is transformed into a matrix in which each column is a normalized form
- Add the elements of each row in matrix
- Normalizing the vectorTherefore, the eigenvector of the judgment matrix can be obtained as follows:As a result, the substation with a large weighting factor has high priority for CVR execution.
- Make the final hierarchy ranking.
The objective of this research (H1) is to establish CVR strategy. The criterion hierarchy (H2) includes three criteria, namely, CVRf, PTDF, and VSF to select suitable alternatives (H3), as depicted in Figure 3.
3.2. Unified Weighting Factor
Judgment matrices are formed based on the CVRf, PTDF, and VSF analyses. PTDF and VSF are studied according to the targeted area, whereas CVRfs are obtained from all substations. The elements of the judgment matrix (relative importance) are determined by the difference in the magnitude between two certain areas or substations. According to the network condition and operator’s judgment, weighting factors in the criterion hierarchy (H2) can be adjusted. The unified weighting factor of substation k with hierarchy in the criteria and alternatives is obtained as follows:
where is the weighting factor of CVRf, PTDF, and VSF in the criterion hierarchy (H2), and is the weighting factor reflecting the CVRf, PTDF, and VSF of the alternative hierarchy (H3). The unified weighting factor prioritizes the substations for CVR deployment based on these three factors. Then, voltage reduction is implemented for the substations from a substation with high weighting factor in a descending order.
4. Determination of Candidate Substations
After identifying the order of the candidate locations, we refine the selection to meet the specified reserve requirement by applying ILP. Using the weighting factors obtained from Section 3, an objective function subject to the constraints for CVR at time t is formulated as follows:
where is the unified weighting factor from the results of AHP through analysis of CVRf, PTDF, and VSF. indicates whether substation k participates in the CVR or not; it takes either 0 or 1. could initially be set to 0. denotes the value of the voltage reduction, which can be 2.5% or 5.0%, according to a two-step voltage reduction. The voltage magnitude of all buses is supposed to meet the specified voltage range: the most frequent set values are 0.95 and 1.05 for and , respectively. The emergency voltage range may significantly differ among utilities and their operating conditions. denotes the desired power reduction by the CVR action at that time. Accordingly, the optimization problem in Equation (18) effectively searches for the CVR action on the order of the weighting factor.
5. Test System
To demonstrate the efficacy of the proposed method, a series of simulation studies using the Power System Simulator for Engineering (PSS/e)s was conducted for this research [33].
Simulation was done using an example case, namely, “savnw” in PSS/e. The total generation and load of the case are 3258.7 MW/964.2 MVAR and 3200.0 MW/1950 MVAR, respectively, with six generators and seven loads. This test case is modified by creating a new distribution transformer and a new load bus; each load at bus 153, 154, 203, 205, 3005, and 3008 is moved to new distribution buses, and the original load bus and a new distribution bus are connected through a distribution transformer. The new load bus numbers are designated as 1531, 1541, 1542, 2031, 2051, 30051, and 30081.
Suppose there is an operating case for reducing the load by 50 MW. A detailed flowchart of the proposed CVR plan is detailed in Figure 1. First, sensitivity analysis that includes CVRf, PTDF, and VSF calculation of network data is conducted. Second, the weighting factors of the substations are calculated and prioritized using AHP. Finally, the substations for CVR deployment are selected using ILP with the desired amount of power reduction.
5.1. CVRf for the Test System
The CVRf can be calculated by Equation (6), and the coefficients of the ZIP load model are arbitrarily allocated to each load as listed in Table 2 for this test system. Higher priority is given to a larger CVRf. The CVRf at bus 2051 is the highest because the load is dominant. Nevertheless, the load can be pushed down in the priority list because of load composition. For example, whereas the load at bus 1541 is larger than the one at bus 2031, the CVRf of bus 2031 is higher than that at bus 1541 because the load at bus 2031 has a large coefficient for the constant impedance. A judgment matrix for the CVRf is thus built as expressed in Equation (19).
Table 2.
ZIP coefficients, CVR factor, and priority.
5.2. PTDF for the Test System
The generation reduction amount for 100 MW reduction at each load bus is calculated through PTDF analysis, as listed in Table 3. The generation reduction is the largest at buses 1541 and 1542 and the smallest at bus 30051, which means that reduction at buses 1541 and 1542 can obtain more operating reserve than that in the other cases. Therefore, the load bus with a larger value for PTDF is given a higher priority for CVR. The effect of load reduction on the generation reduction appears insignificant for this small test case, which is different from the case for bulk power systems. A judgment matrix for the PTDF can be built as shown in Equation (20).
Table 3.
Change in generation based on PTDF study and priority.
5.3. VSF for the Test System
The VSFs for all buses are calculated by power reduction at each load bus. Table 4 lists the average increment in the voltage magnitude for 100 MW reduction at each load bus. The value of the average VSF is the highest when demand at bus 30081 is reduced and is the lowest at bus 2051. The effect of the overall voltage profile improvement can be maximized when CVR is conducted at the load bus with highest sensitivity factor, i.e., 30081. A judgment matrix for the VSF is thus formulated as shown in Equation (20).
Table 4.
Average value of VSF and priority.
5.4. AHP and ILP for the Test System
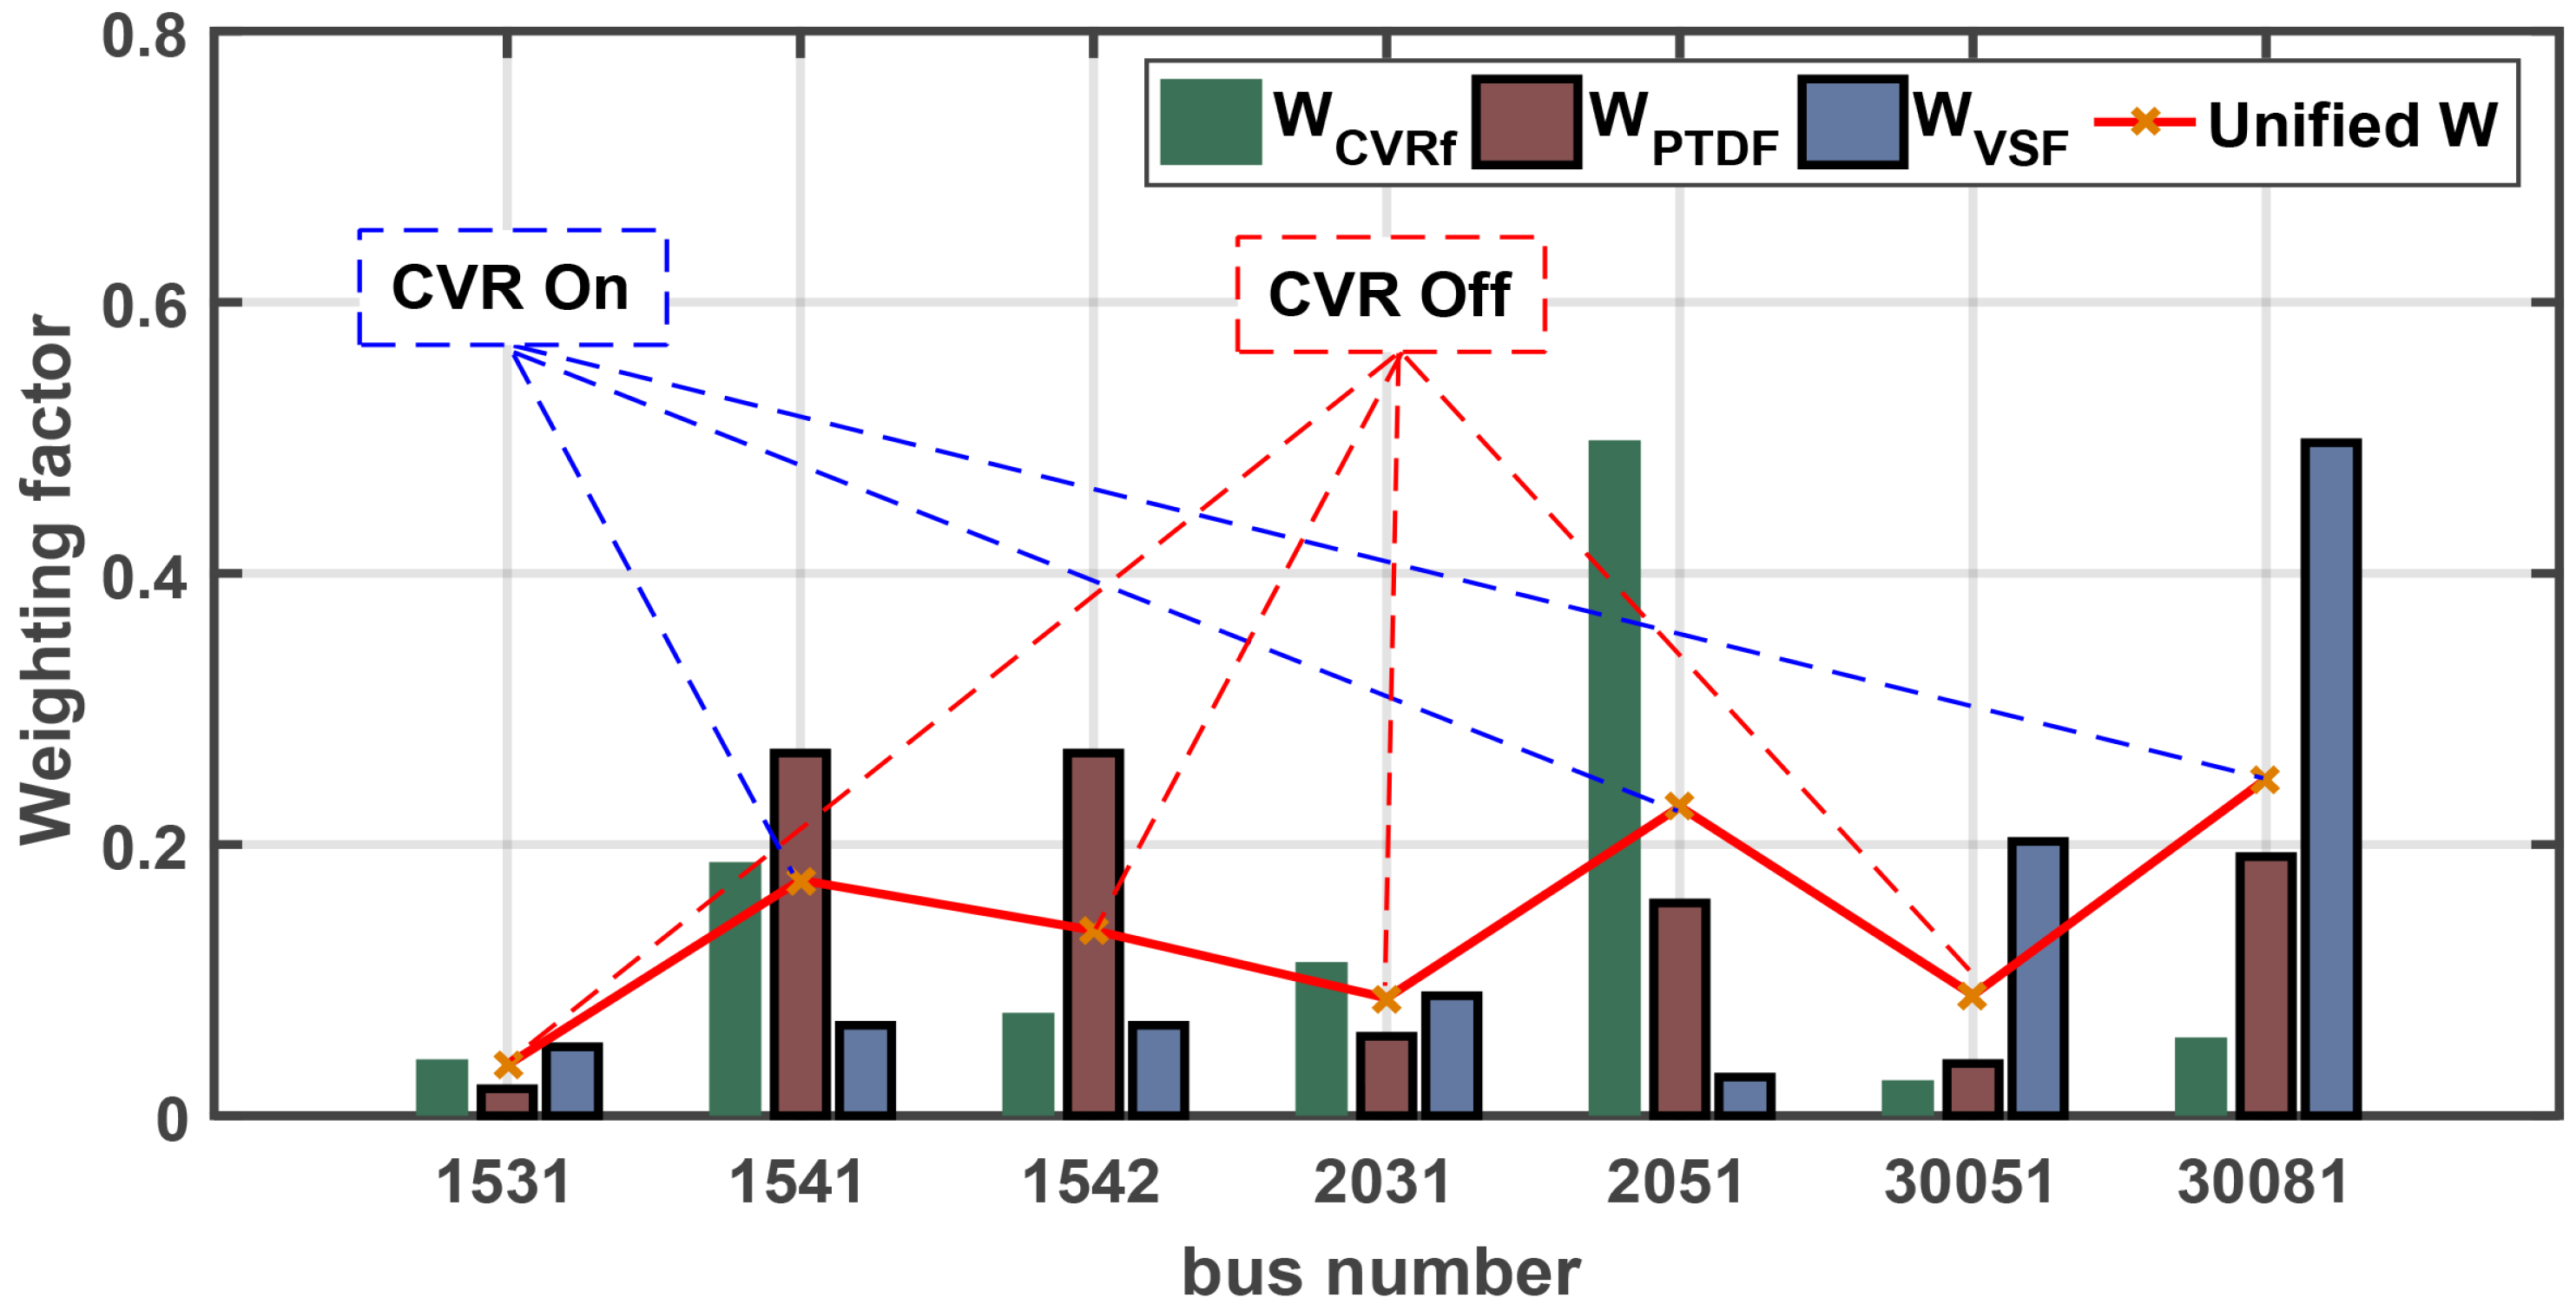
The weighting factors are calculated by integrating judgment matrices for three factors in Equations (19)–(21), which are listed in Table 5 and shown in Figure 4. High priority is given to a large value of unified W. Bus 30081 is the highest priority for the CVR, whereas bus 1531 is the lowest priority. As a result, the three substations at buses 1541, 2051, and 30081 are chosen for the CVR using Equation (18) to achieve the target load reduction of 50 MW. It is assumed that the three factors have equal importance for the test system. The weighting factors should adapt to changes in the network condition or the purpose of CVR execution. The impact of different weighting factors on the system performance will be investigated in the next section.
Table 5.
Weighting factors for each factor and unified weighting factors obtained from AHP.
Figure 4.
Weighting factors and unified weighting factors.
5.5. Results
Table 6 presents the results of the CVR action on the test system. When the amount of target load reduction is 50 MW, CVR is implemented at those selected substations as listed in Table 5. The total load is reduced by 51.67 MW, whereas the total generation reduction is 55.33 MW after CVR. The voltage profile of the whole system has been improved by 0.0048 pu.
Table 6.
Results of CVR simulation.
6. CVR for the Korean Electric Power System
6.1. Effect of CVR on the Network
Many utilities, including Korea Electric Power Corporation (KEPCO), adopts a two-step voltage reduction at 2.5% and 5.0%. It is needed to calculate the maximum demand reduction at each CVR step using the CVRf. The coefficients of the ZIP model are assumed to be calculated and assigned to all substations, and the CVRfs are calculated by Equation (5). Table 7 lists the number of 154/22.9 kV distribution substations, total demands, and potential load reduction via CVR for all substations in each area of the Korean power system. It also provides the arithmetic sum of the load reduction by area for 2.5% and 5.0% reduction of voltage; 844 MW and 1660 MW, respectively.
Table 7.
Expected load reduction due to CVR deployment in the Korean power system by area.
6.2. Simulation Scenarios
This section evaluates the performance of the proposed approach using the summer peak case of Korea in 2013, where the total generation is 78,900 MW/20,438 MVAR and the total load is 77,577 MW/29,653 MVAR. The CVR is deployed to those 655 distribution substations presented in Table 7. The large industrial loads are excluded from the CVR candidates based on the utility practice while other small and medium sized industrial loads are incorporated in the load model connected to those 655 substations. The PTDF and VSF are studied for each area to mitigate computational burden. The load model parameters are assumed to accurately characterize the CVR behavior of each area. It is worth noting that availability of field-validated accurate load models is critical for successful and reliable operation. For example, a measurement-based load modeling tool has been developed in Korea since 2014 with a vision to identify and validate the model parameters. It has been observed that the CVR does not perform as designed for 2.5% or 5.0% voltage reduction due to technical issues in the distribution system such as tap operation and voltage regulation. The on-going efforts for accurate load modeling helps reduce this uncertainty. The framework allows for modifying the voltage reduction steps as shown in Equation (18), which may be used to incorporate actual voltage reduction based on the actual performance.
Suppose that we need to secure 400 MW by CVR. The conventional strategy may deploy CVR in all distribution substations as long as they are qualified and available for CVR: 2.5% voltage reduction in the whole system may result unnecessarily in over 800 MW reduction as seen from Table 7. The proposed approach, however, can help successfully decrease the demand by 400 MW. It can examine various aspects of CVR with different weighting factors as listed in Table 8.
Table 8.
Various cases with different weighting factors of H2.
6.3. Results
Table 9 presents various cases for 2.5% voltage reduction by incorporating a combination of factors. Note the effects of weighting factors in terms of the number of substations for CVR, total active and reactive power generation, and the total system loss.
Table 9.
CVR Results for the Korean electric power system.
Table 9 shows that all cases achieve the goal of securing operating reserve of more than 400 MW through CVR by 400 MW. In particular, case 1 equally treats all factors. It is worth mentioning that the present study is not to find the best weights but to explore various case studies. Either one or two factors among three could be treated with higher weights as in other cases at the discretion of operations planners. If the CVRf is considered, such as in cases 1, 3, 4, and 5, the number of CVR substations for the specified requirement is smaller than those in the other cases. Especially, case 5 including only CVRf meets the requirement of 400 MW with the fewest CVR actions.
The PTDF affects the total active power reduction and system loss, and the VSF is related to the total reactive power reduction and system loss. In cases 1, 2, 4, and 6, the PTDF appears to be less influential because the priorities of the substations overlap between the PTDF and VSF; the VSF helps enhance the operating reserve by increasing the system efficiency, similar to what the PTDF does. When the VSF is considered, remarkable performance in terms of total generation of reactive power and system loss due to network voltage profile improvement is obtained, such as those in cases 1, 2, 3, and 7. The results of case 5, which do not consider both the PTDF and VSF presents the worst performance in terms of the total active/reactive power generation and system loss.
Figure 5 demonstrates the change of network due to the CVR action according to each area and cases compared with the base case. Figure 5a shows the number of CVR operations, demand reduction, and the active/reactive power generation in each each area, and Figure 5b shows the voltage spread in the transmission system according to each area compared with the base case. It is interesting to observe the various effects of CVR on the grid under different operating cases. The proposed framework facilitates the study process, and helps make an informed decision on the CVR.
Figure 5.
Changes in P, Q (a) and V (b) after CVR deployment by area compared with a basecase.
7. Conclusions
This paper has presented a practical method for planning CVR on a transmission system based on AHP. The actual operating reserves obtained through the CVR, impact on adjacent bus voltage profile, as well as demand reduction are incorporated as multiple criteria and traded-off in selecting the substations or feeders for optimal CVR performance. Unlike existing practice based on the CVRf only, the proposed method naturally conducts network impact analysis, and identifies potentially conflicting factors. Our optimization framework allows selection of the minimal number of substations, which helps save the substations for the next CVR execution, especially during an emergency. Numerous case studies of the Korea electric power system demonstrated that the proposed method excels in achieving the desired results by changing the relative importance among the factors and deriving priority scales. The weighting factors of criteria can be adjusted to the primary purpose of CVR, e.g., to relieve the congestion or to improve the voltage profile of certain areas as shown in Figure 5.
The study framework provides a practical decision-support tool in operations; it evaluates the CVR as part of the EMS applications for the changing network topology and loading conditions, as shown in Figure 1. It also incorporates other important utility-specific factors than the aforementioned three or can even ignore some of the criteria as the grid evolves. It thus can help design and deploy the CVR more reliably and predictably, which is particularly beneficial in coordinating various Volt-Var control options in practice. High accuracy of CVRf or voltage dependency of the load model at a particular operating time is assumed in this study, which may not be the case in today’s operation. Albeit it is very challenging to quantify these factors in practice, it is plausible that the on-going data gathering and analysis would improve the overall accuracy. Our future work includes investigating the regulatory, economical, and technical requirements for CVR implementations.
Acknowledgments
This research was supported by Basic Science Research Program through the National Research Foundation of Korea(NRF) funded by the Ministry of Education, Science and Technology (No. 2016R1D1A1B03930582). This work was supported by the Yonsei University Research Fund Joint International Project Development Fund (JIPDF) Supporting Program of 2016 (project No.: 2016-12-0046).
Author Contributions
Kyungsung An has developed the study framework, conducted simulation studies, and written the paper with the support of Hao Jan Liu under supervision of the corresponding author, Kyeon Hur. Hao Zhu and Zhao Yang Dong helped improve the theoretical aspects and practicality of this study.
Conflicts of Interest
The authors declare no conflict of interest.
References
- Scalley, B.; Kasten, D. The Effects of Distribution Voltage Reduction on Power and Energy Consumption. IEEE Trans. Educ. 1981, 24, 210–216. [Google Scholar] [CrossRef]
- Diaz-Aguilo, M.; Sandraz, J.; Macwan, R.; de Leon, F.; Czarkowski, D.; Comack, C.; Wang, D. Field-validated load model for the analysis of CVR in distribution secondary networks: Energy conservation. IEEE Trans. Power Deliv. 2013, 28, 2428–2436. [Google Scholar] [CrossRef]
- Pinney, D. Costs and Benefits of Conservation Voltage Reduction; Technical Report DE-OE0000222; NRECA: Arlington, VA, USA, 2014. [Google Scholar]
- Le, B.; Cañizares, C.A.; Bhattacharya, K. Incentive Design for Voltage Optimization Programs for Industrial Loads. IEEE Trans. Smart Grid 2015, 6, 1865–1873. [Google Scholar] [CrossRef]
- Kirshner, D. Implementation of conservation voltage reduction at commonwealth Edison. IEEE Trans. Power Syst. 1990, 5, 1178–1182. [Google Scholar] [CrossRef]
- Sandraz, J.; Macwan, R.; Diaz-Aguil, M.; McClelland, J.; de Leon, F.; Czarkowski, D.; Comack, C. Energy and economic impacts of the application of CVR in heavily meshed secondary distribution networks. IEEE Trans. Power Deliv. 2014, 29, 1692–1700. [Google Scholar] [CrossRef]
- PJM. PJM Manual 13-Emergency Operations; PJM: Valley Forge, PA, USA, 2015. [Google Scholar]
- Preiss, R.; Warnock, V. Impact of voltage reduction on energy and demand. IEEE Trans. Power Appar. Syst. 1978, 97, 1665–1671. [Google Scholar] [CrossRef]
- Warnock, V.; Kirkpatrick, T. Impact of voltage reduction on energy and demand: Phase II. IEEE Trans. Power Syst. 1986, 1, 92–95. [Google Scholar] [CrossRef]
- Erickson, J.; Gilligan, S. The effects of voltage reduction on distribution. IEEE Trans. Power App. Syst. 1982, 101, 2014–2018. [Google Scholar] [CrossRef]
- Lauria, D. Conservation voltage reduction (CVR) at Northeast utilities. IEEE Trans. Power Deliv. 1987, 2, 1186–1191. [Google Scholar] [CrossRef]
- Steese, J.D. Assessment of Conservation Voltage Reduction Applicable in the BPA Service Region; Technical Report; Bonneville Power Administration: Portland, OR, USA, 1987.
- Dwyer, A.; Nielsen, R.E.; Stangl, J.; Markushevich, N.S. Load to voltage dependency tests at B.C. Hydro. IEEE Trans. Power Syst. 1995, 10, 709–715. [Google Scholar] [CrossRef]
- Short, T.A.; Mee, R.W. Voltage Reduction Field Trials on Distributions Circuits. In Proceedings of the 2012 IEEE PES Transmission and Distribution Conference and Exposition (T&D), Orlando, FL, USA, 7–10 May 2012; pp. 1–6.
- Lefebvre, S.; Gaba, G.; Ba, A.O.; Asber, D.; Ricard, A.; Perreault, C.; Chartrand, D. Measuring the Efficiency of Voltage Reduction at Hydro-Quebec Distribution. In Proceedings of the 2008 IEEE Power and Energy Society General Meeting-Conversion and Delivery of Electrical Energy in the 21st Century, Pittsburgh, PA, USA, 20–24 July 2008; pp. 1–7.
- Shin, J.H.; Nam, S.C.; Song, J.Y.; Lee, J.G.; Han, S.W.; Ko, B.K.; An, Y.H.; Kim, T.K.; Lee, B.J.; Baek, S.M. Field Implementation of Voltage Management System (VMS) into Jeju Power System in Korea. J. Electr. Eng. Technol. 2015, 10, 719–728. [Google Scholar] [CrossRef]
- Schneider, K.; Fuller, J.; Tuffner, F.; Singh, R. Evaluation of Conservation Voltage Reduction (CVR) on a National Level; Technical Report; Pacific Northwest National Laboratory: Richland, WA, USA, 2010.
- Nam, S.R.; Kang, S.H.; Lee, J.H.; Ahn, S.J.; Choi, J.H. Evaluation of the effects of nationwide conservation voltage reduction on peak-load shaving using SOMAS data. Energies 2013, 6, 6322–6334. [Google Scholar] [CrossRef]
- Wang, Z.; Wang, J. Time-varying stochastic assessment of conservation voltage reduction based on load modeling. IEEE Trans. Power Syst. 2014, 29, 2121–2328. [Google Scholar] [CrossRef]
- Nam, S.R.; Kang, S.H.; Lee, J.H.; Choi, J.H.; Ahn, S.J. EMS-data-based load modeling to evaluate the effect of conservation voltage reduction at a national level. Energies 2013, 6, 3692–3705. [Google Scholar] [CrossRef]
- Wang, Z.; Begovic, M.; Wang, J. Analysis of conservation voltage reduction effects based on multistage SVR and stochastic process. IEEE Trans. Smart Grid 2014, 5, 431–439. [Google Scholar] [CrossRef]
- Liu, H.J.; Macwan, R.; Alexander, N.; Zhu, H. A Methodology to Analyze Conservation Voltage Reduction Performance Using Field Test Data. In Proceedings of the 2014 IEEE International Conference on Smart Grid Communications (SmartGridComm), Venice, Italy, 3–6 November 2014; pp. 529–534.
- IEEE Smart Distribution Working Group. Available online: http://grouper.ieee.org/groups/td/dist/da/ (accessed on 14 December 2016).
- Wang, Z.; Wang, J. Review on implementation and assessment of conservation voltage reduction. IEEE Trans. Power Syst. 2014, 29, 1306–1315. [Google Scholar] [CrossRef]
- Saaty, T.L. The Analytic Hierarchy Process; McGraw Hill: New York, NY, USA, 1980. [Google Scholar]
- Zhu, J.Z. Optimization of Power System Operation; IEEE Press-Wiley: Piscataway, NJ, USA, 2009. [Google Scholar]
- Kim, D.M.; Kim, J.O. Design of emergency demand response program using analytic hierarchy process. IEEE Trans. Smart Grid 2012, 3, 635–644. [Google Scholar]
- Dodgson, J.; Spackman, M.; Pearman, A.; Phillips, L. DTLR Multi-Criteria Analysis Manual; Technical Report; National Economic Research Associates: New York, NY, USA, 2000. [Google Scholar]
- Wood, A.J.; Wollenbergy, B.F.; Sheble, G.B. Power Generation, Operation, and Control; Wiley: Hoboken, NJ, USA, 1984. [Google Scholar]
- Cheng, X.; Overbye, T.J. PTDF-based power system equivalents. IEEE Trans. Power Syst. 2005, 20, 1868–1876. [Google Scholar] [CrossRef]
- Kabir, M.N.; Mishra, Y.; Ledwich, G.; Dong, Z.Y.; Wong, K.P. Coordinated Control of Grid-Connected Photovoltaic Reactive Power and Battery Energy Storage Systems to Improve the Voltage Profile of a Residential Distribution Feeder. IEEE Trans. Ind. Inform. 2014, 10, 967–977. [Google Scholar] [CrossRef]
- Kumar, A.; Srivastava, S.C. AC power transfer distribution factors for allocating power transactions in a deregulated market. IEEE Power Eng. Rev. 2002, 22, 42–43. [Google Scholar] [CrossRef]
- PSS/E. Available online: http://www.siemens.com/pss-e (accessed on 14 December 2016).
© 2016 by the authors; licensee MDPI, Basel, Switzerland. This article is an open access article distributed under the terms and conditions of the Creative Commons Attribution (CC-BY) license (http://creativecommons.org/licenses/by/4.0/).