1. Introduction
Urban morphology has been pointed out as one of the influencing factors with regard to the energy performance of cities from several points of view, including mobility [
1], outdoor microclimate [
2,
3,
4] and building energy behavior [
5,
6]. In the search for efficient urban forms, increasing physical density of settlements has been recurrently proposed as a suitable strategy because of its potential for reducing transport and land use [
7]. However, in this compact city model, characteristic of Mediterranean cities, ensuring adequate solar access to buildings and public spaces may sometimes become a problematic issue [
8,
9].
In order to understand the multiplicity of energy phenomena overlapping at urban contexts, it is helpful to describe urban form using geometric parameters which can be correlated to certain energy behaviors [
10]. Due to the extreme heterogeneity of urban textures, this approach requires the development of simplified urban models, with the level of detail as a critical factor.
The urban canyon is a model widely used in energy studies. It is conceived as a geometric abstraction of the basic urban space composed of two parallel rows of buildings and the ground surface between them [
11]. The key component of its attractiveness lies in its simplicity, since its geometric layout may be described by just two parameters: its axis orientation and its cross-sectional dimensions (width W; height H). This aspect ratio (W/H) is, in fact, an intuitive way of characterizing the occlusion of an urban fabric, but it represents only the obstructions located in a single direction (the vertical one). Canyon morphology has also been described quantifying the total amount of visible sky from a particular point, using other parameters such as sky view factor (SVF) [
12,
13] or sky factor (SF) [
14]. Although these descriptors are based on a multidirectional approach, they provide only a rough idea of the obstacles existing in the horizontal direction.
The urban canyon model and the aforementioned geometrical parameters, commonly used for urban climatology purposes (e.g., wind patterns [
15], urban heat island [
16], and radiative exchanges [
17]), have been also intensively applied to the study of solar access in buildings [
18,
19,
20,
21,
22,
23]. In spite of the undeniable usefulness of the canyon concept, modelizing streets as limitless rectangular troughs overlooks the 3D-complexity of urban tissues, essential for a better comprehension of urban energy exchanges [
24,
25,
26,
27]. In that sense, street intersections have so far received little attention in solar energy studies, unlike in wind flow investigations [
28,
29], despite being distinctive components of any fabric [
30,
31,
32]. Depending on the design of crossings, the solar performance of urban fabrics may differ substantially, even though they are characterized by the same aspect ratio.
It can be stated that tissues with higher horizontal discontinuity also have a higher solar potential as a result of the reduction of the obstructions in the vicinity of intersections. However, no systematic assessment of the extent of this “crossing effect” has been conducted yet. Some questions arise in this regard. How far from the corner does the presence of a street junction affect? How meaningful is its contribution to solar radiation availability of urban tissues? Moreover, how significant is the deviation when solar analyses are conducted using simplified models that disregard intersections?
This paper addresses the issue of urban solar potential focusing on the role of street crossings in contrast to the widespread endless canyon approach. The specific aim of this research is to assess the impact of urban fabric discontinuities on solar access in dense Mediterranean environments, exploring the amount of direct radiation impinging over facades. This assessment is conducted on abstract models to draw energy-related conclusions exportable at a fabric scale.
2. Method
The method developed for the present study aims to assess the contribution of urban intersections to solar availability over façades in dense urban environment from a twofold perspective. On one hand, local effects on available radiation are analyzed depending on the distance to the corner. On the other hand, energy consequences of intersections are addressed at a street scale, focusing not only on changes in the amount of the radiation collected but also in its distribution. The influence of the urban fabric discontinuity on solar access is quantitatively evaluated through energy simulations as a basis for a subsequent qualitative discussion.
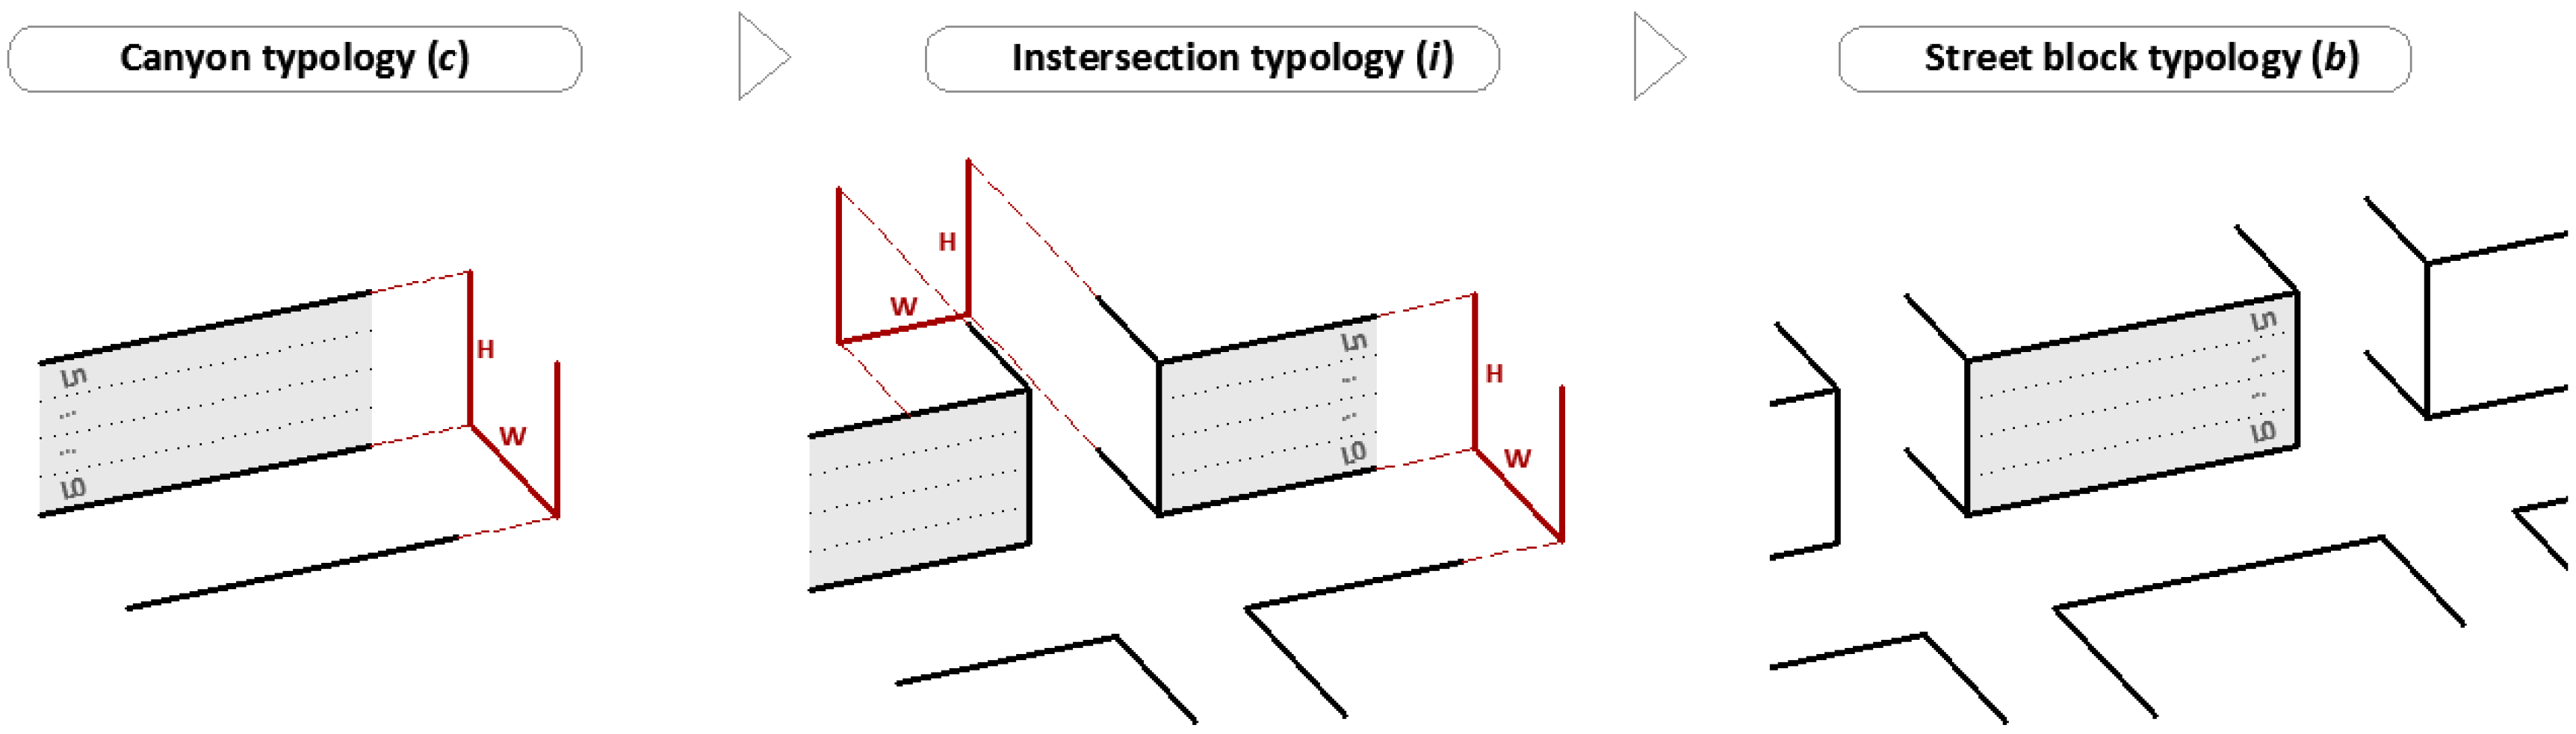
The methodological approach of this study, developed for Mediterranean locations, was built upon the comparison between urban models including and ignoring intersections in terms of solar energy received over façades. Models have been defined as abstract urban typologies in order to ensure the exportability of the analysis methodology. For this research, three geometric typologies were selected corresponding to the essential elements of design of any urban tissue (
Figure 1): urban canyon (c), intersection (i), and street blocks (b). Accordingly, a three-step comparative analysis was carried out. In this paper, firstly, radiation results obtained for endless canyon models are presented as the baseline for comparisons with the rest of types. Secondly, the deviation from the canyon case introduced by intersection is evaluated. Finally, the influence of crossings on results for blocks is discussed.
In this study, solar energy received over façades was assessed through a single parameter: direct solar radiation, the most significant component of sunlight for Mediterranean climates (e.g., in Barcelona city, direct contribution is between 62% and 72% of the monthly global solar radiation [
33]).
Direct radiation was evaluated in terms of energy potential, i.e., considering a completely clear sky. Results were hence interpreted as the maximum direct radiation that a certain wall surface may receive under idealized conditions during a specific time period (kWh/m2). This approach provides radiation data strictly based on the geometry of the scene, suitable for the comparative purpose of the present study, though these values are an approximation of the actual ones.
Simulations were run on winter and summer solstice days in order to obtain a characteristic behavior under the extreme solar scenarios for each typological model (canyon, intersection, and block). Models were evaluated for several façade orientations, since radiation significantly differs depending on the direction the vertical surface is facing.
All calculations were conducted using Heliodon 2, a computer tool designed to visualise and calculate spatial and temporal distribution of solar radiation on urban and architectural models [
34]. A general overview of the software is outlined below.
For a settled location, the software simulates the sun position as a latitude-and-time-dependent function. Once the geometry is modeled, the tool performs a sky visibility analysis from each point of the model considering the obstructions of the environment. These sky openings are correlated with the sun paths for each point to compute its sun exposure, using an isochronal projection [
35].
In Heliodon 2, direct and diffuse components of sunlight were separately assessed. As regards direct radiation calculations, a cloudless sky was assumed during the whole year. For solar flux calculations, Heliodon takes into account the thickness of the atmosphere and therefore the latitude, the altitude, and the sun height [
35]. Further details on the irradiation model and calculation assumptions can be found in [
36].
Heliodon provides graphical and numerical information about the received radiation (kWh/m2) by integrating the solar flux in intervals defined by the user (year, season, month, hour, day). According to the user’s preferences, radiation results can be obtained as punctual or cumulative values over surfaces, reporting average values if required.
Heliodon also allows the user to adjust spatial and time resolution for radiation calculation. For this research, time steps for calculation were fixed in 15 s, and surfaces were discretized by a regular mesh with a 0.2 m width. These settings represent a good compromise between accuracy of results and computational costs given the scale of the model and the aim of the study.
Finally, it should be noticed that, as the main focus of this research is on the impact of the fabric morphology on solar access, energy consequences inextricably linked to its material properties or the presence of non-built elements have not been taken into consideration. Accordingly, reflections from neighboring surfaces were disregarded, and solar obstructions due to vegetation were not considered, thus obtaining radiation values in line with the maximum direct solar energy available.
3. Description of the Case Study
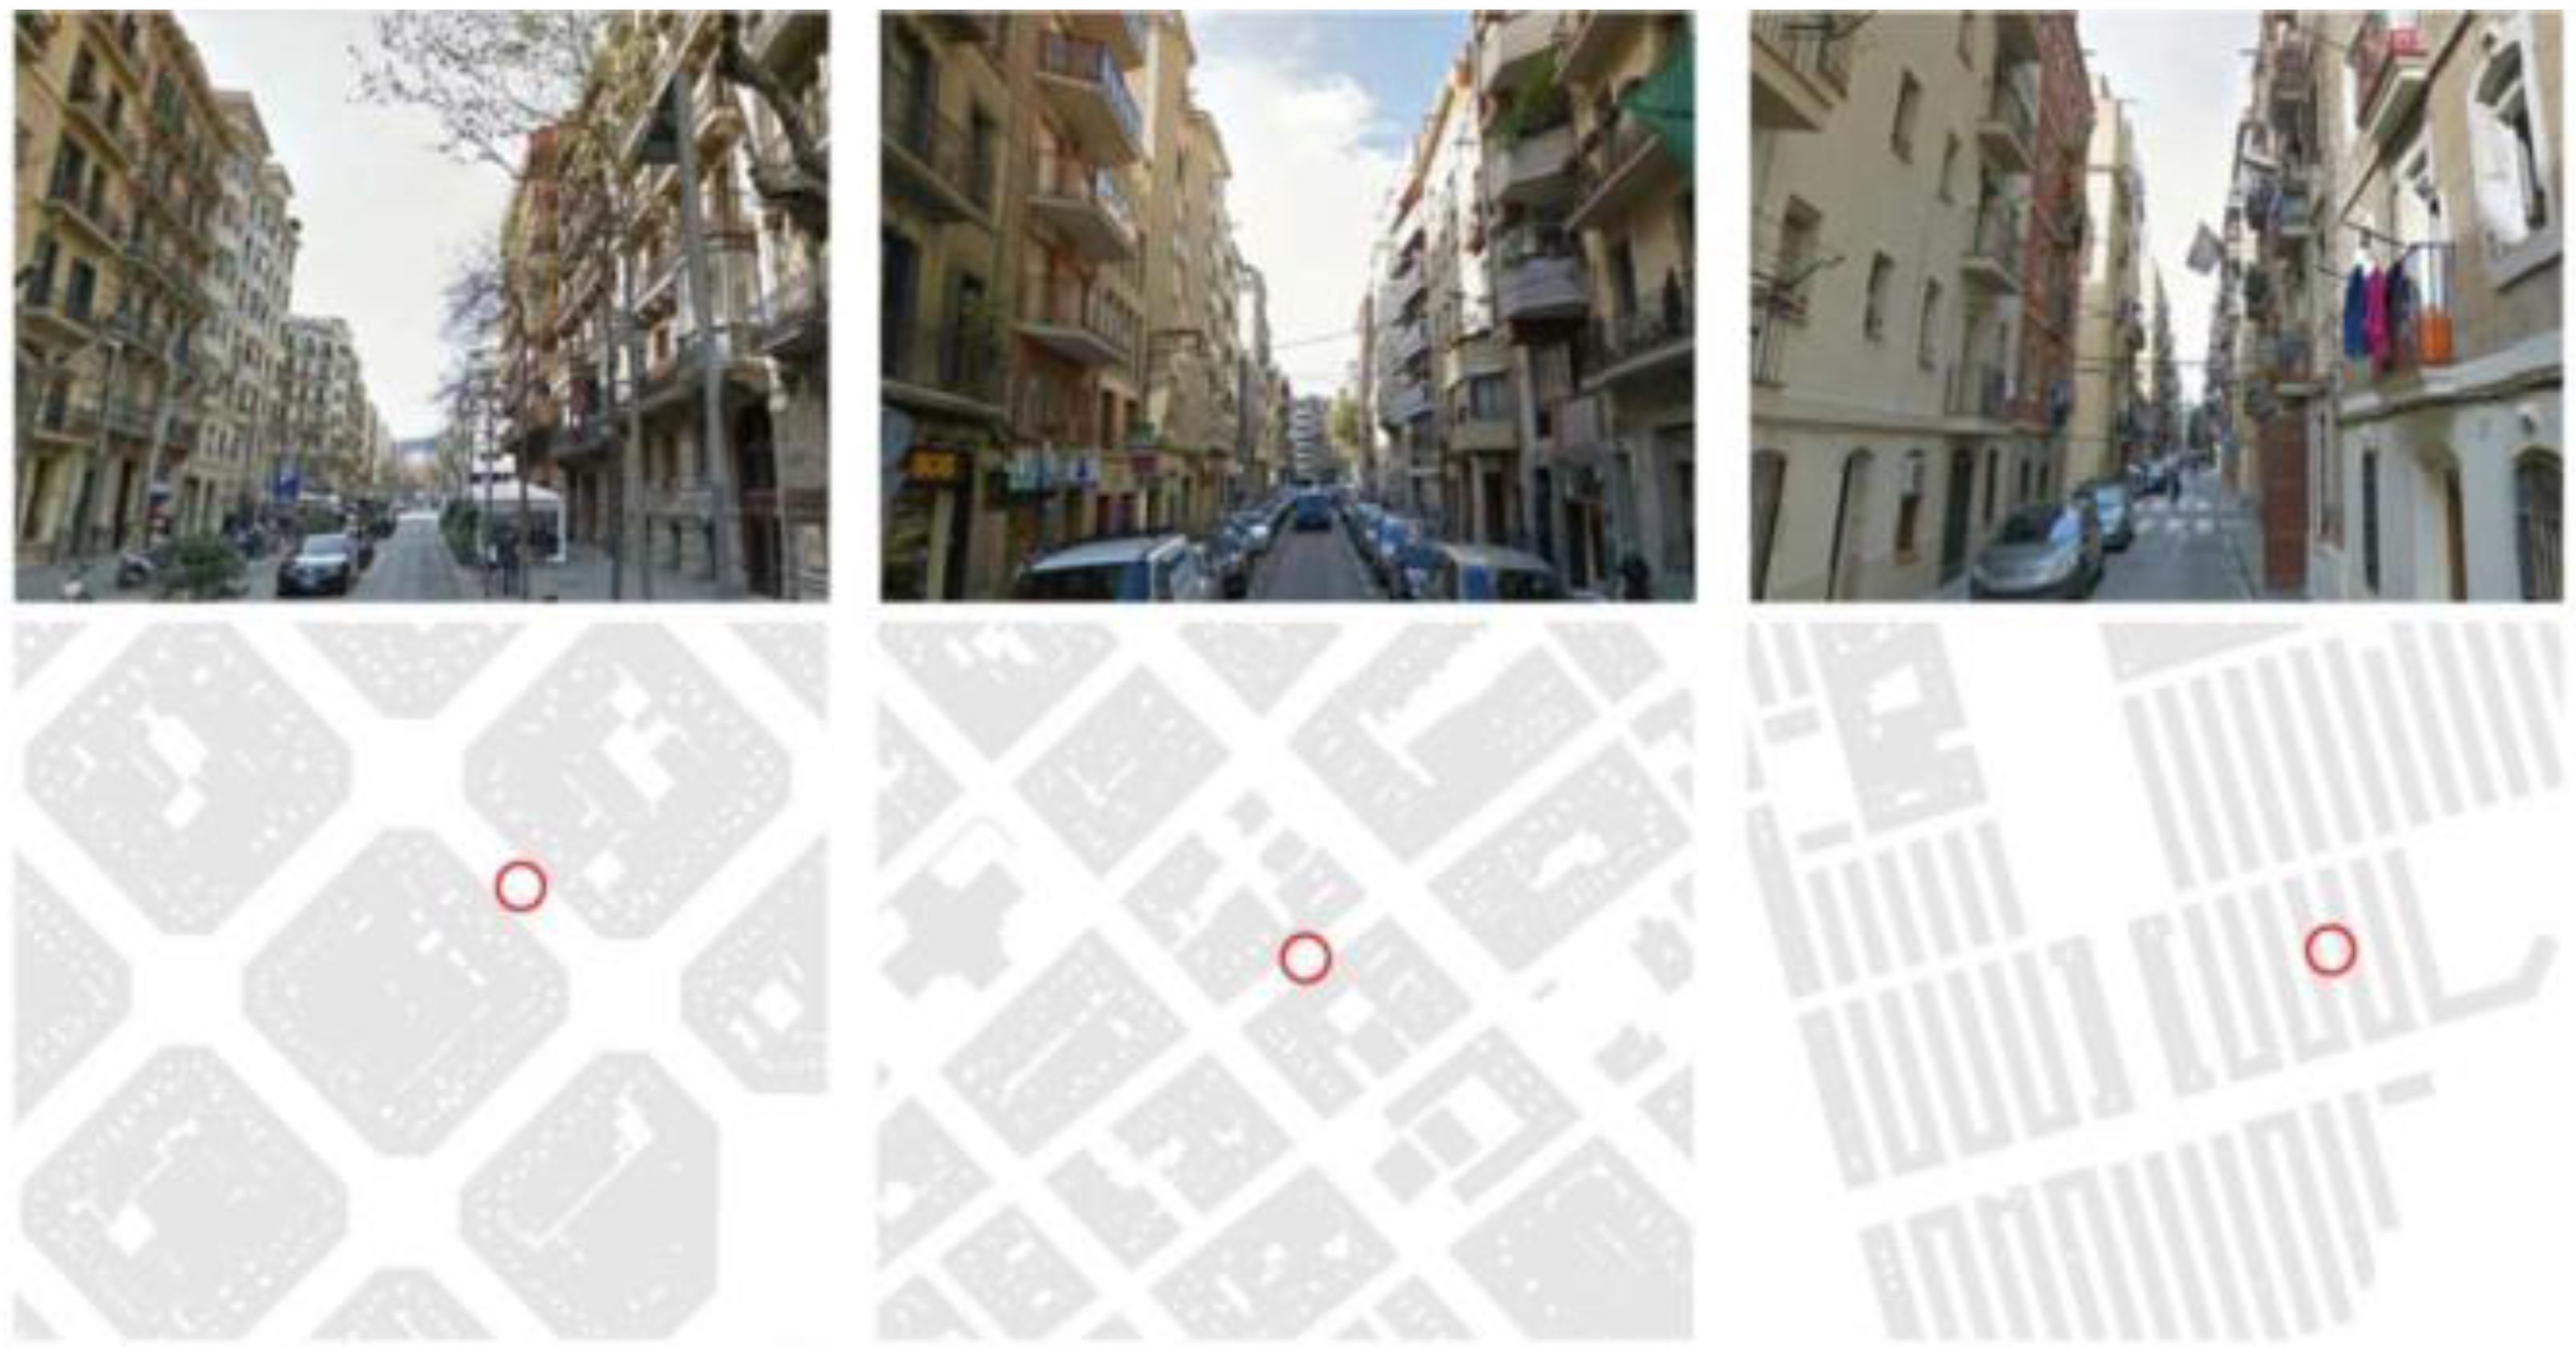
The “crossing effect” was assessed for a mid-latitude location corresponding to the city of Barcelona (41° N), as an example of a dense Mediterranean urban environment. In Barcelona, like in most Mediterranean settlements, the traditional arrangement of built-up volumes highlights the street canyon as one of the main form givers of compact urban tissues [
37] (
Figure 2).
Study models for the canyon (c), intersection (i), and street block (b) typologies were built upon typical fabric dimensions of compact neighborhoods in Barcelona. A perpendicular intersection was chosen for the case study because it represents the most basic layout for a street junction, and it can be recurrently found in a wide number of city plans. An individualized analysis of typological models with an increasing degree of urban compactness was performed to assess the contribution of urban discontinuities to the solar potential.
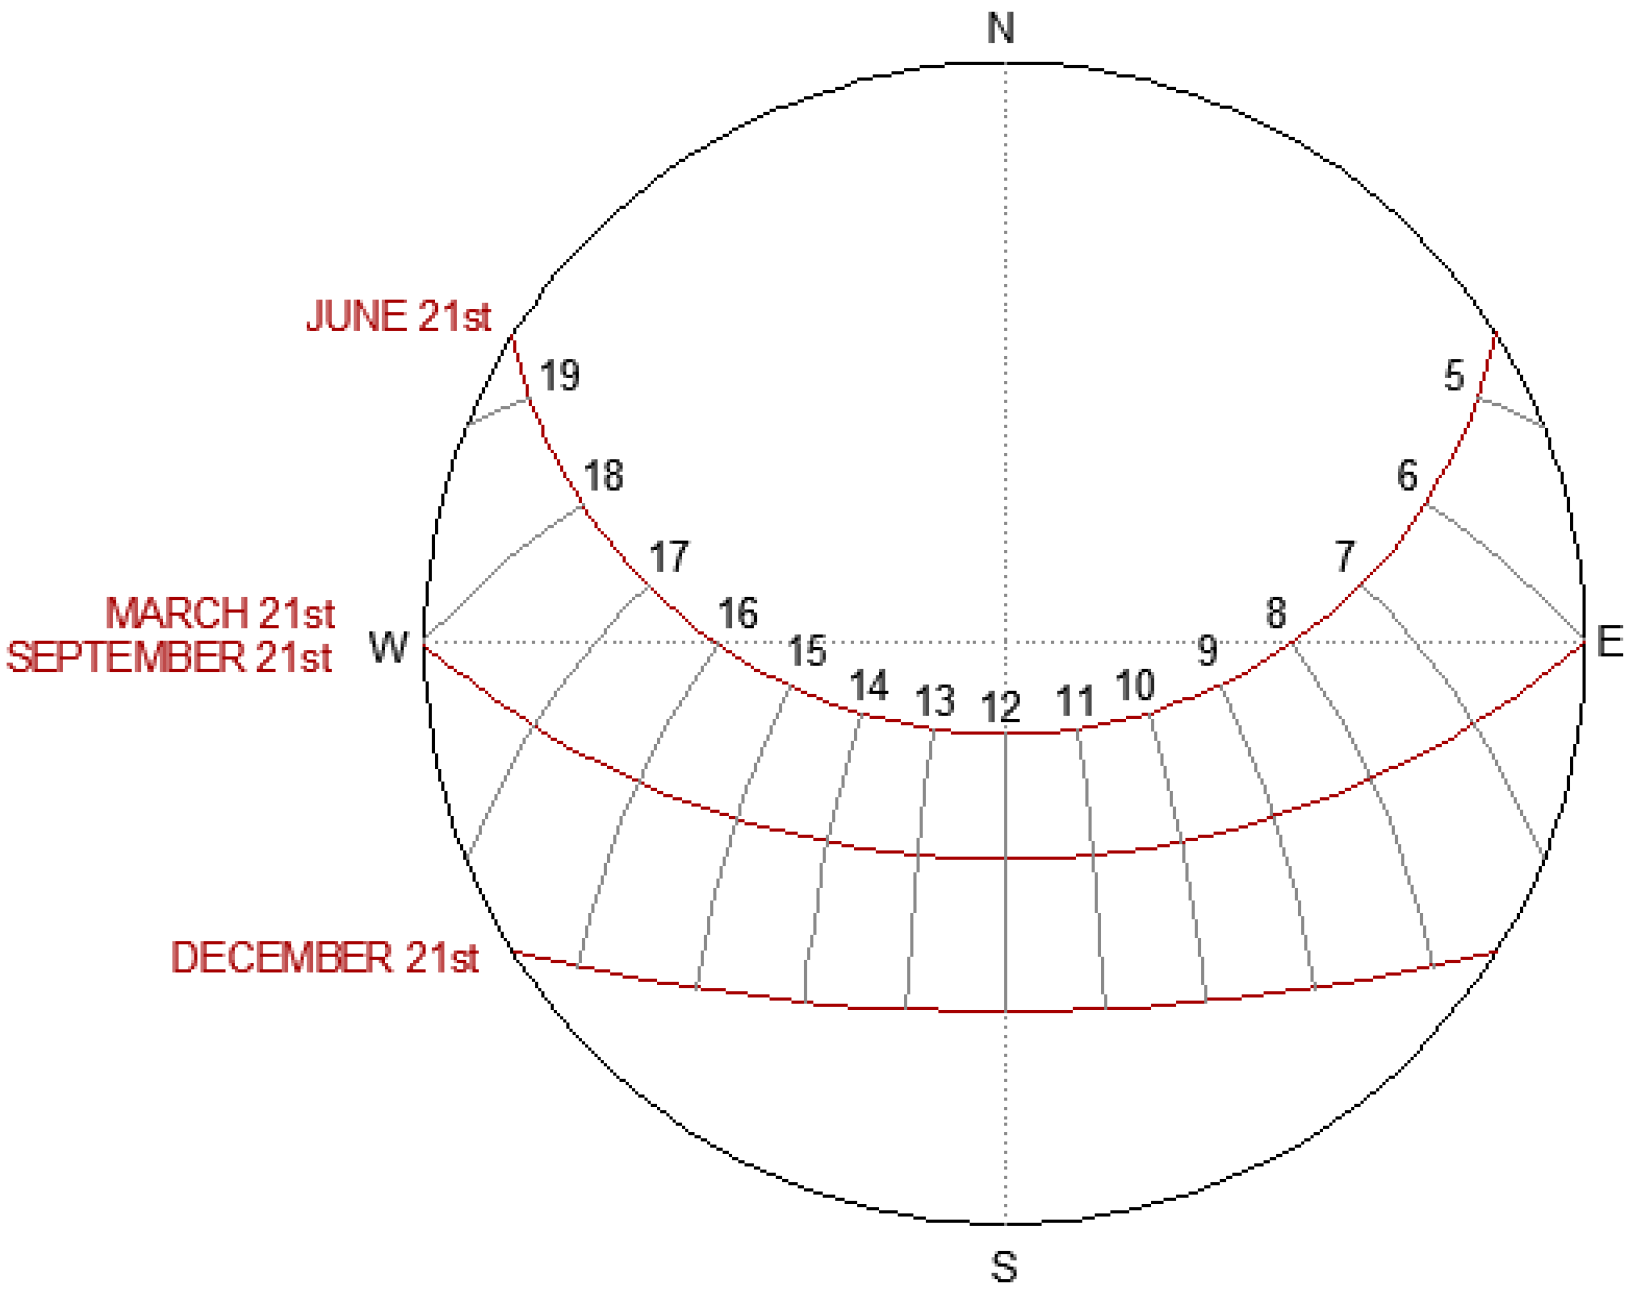
Energy consequences in all models were addressed for façades facing eight orientations (N, NE, E, SE, S, SW, W, and NW). Direct radiation (kWh/m
2 per day) was computed over façades for the winter solstice (21 December) and the summer solstice (21 June), when sun elevation reached its minimum and maximum, respectively (
Figure 3).
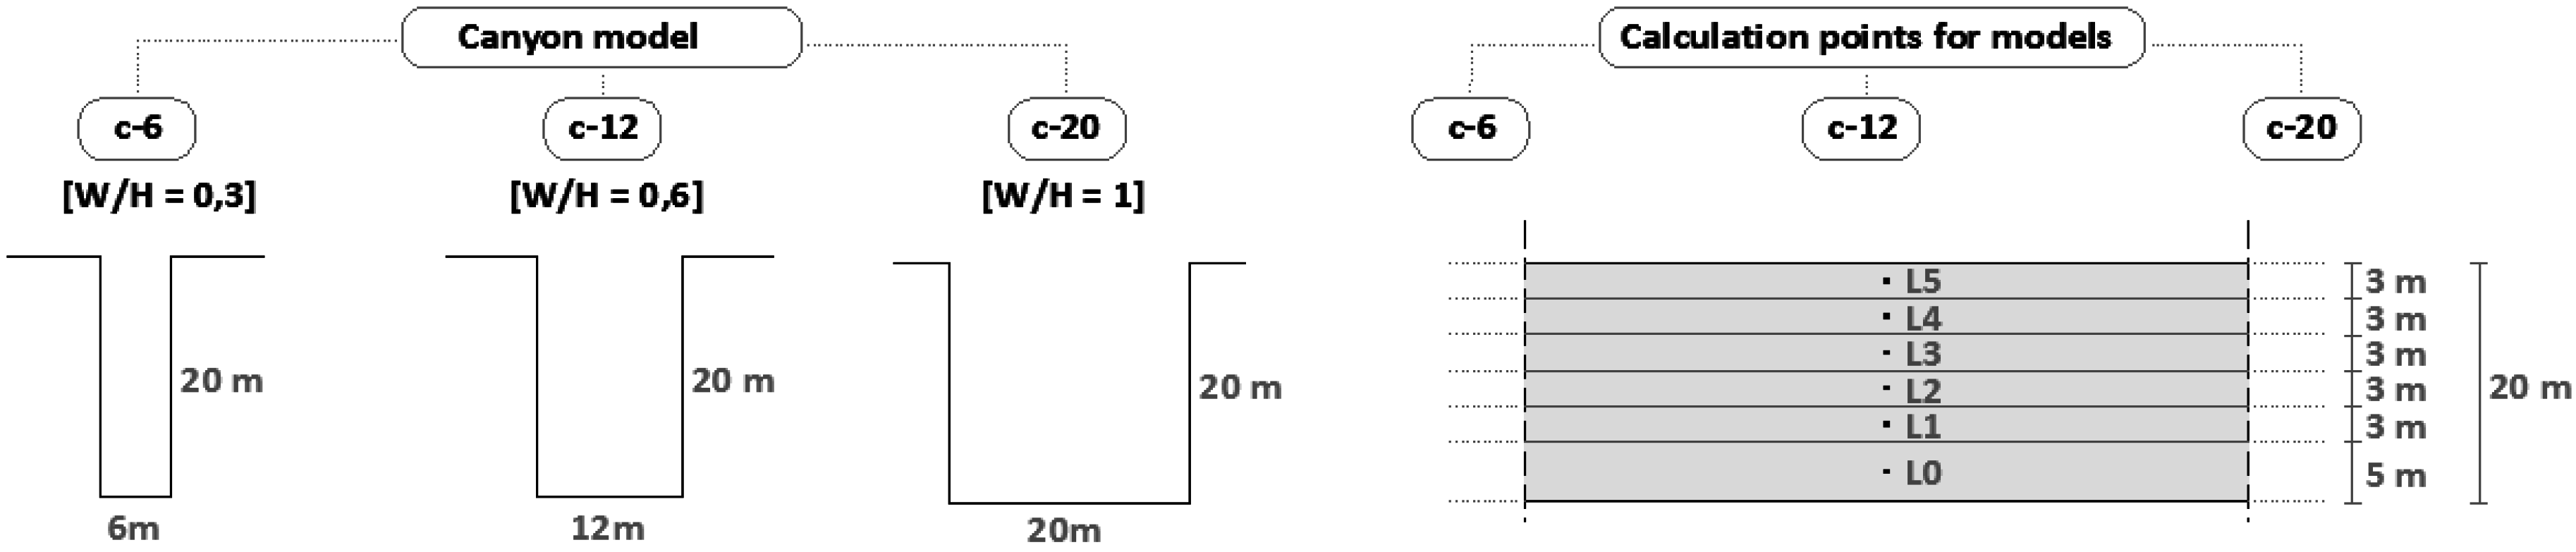
The specific geometric layout of the three canyon models selected for this research (c-6; c-12; c-20) is provided in
Figure 4. Canyon models are characterized by an aspect ratio (W/H) of 0,3 in the c-6 model, 0,6 in the c-12 model, and 1 in the c-20 model. Calculation points (L0–L5) have been defined along a vertical column over the façade at midpoint of each level.
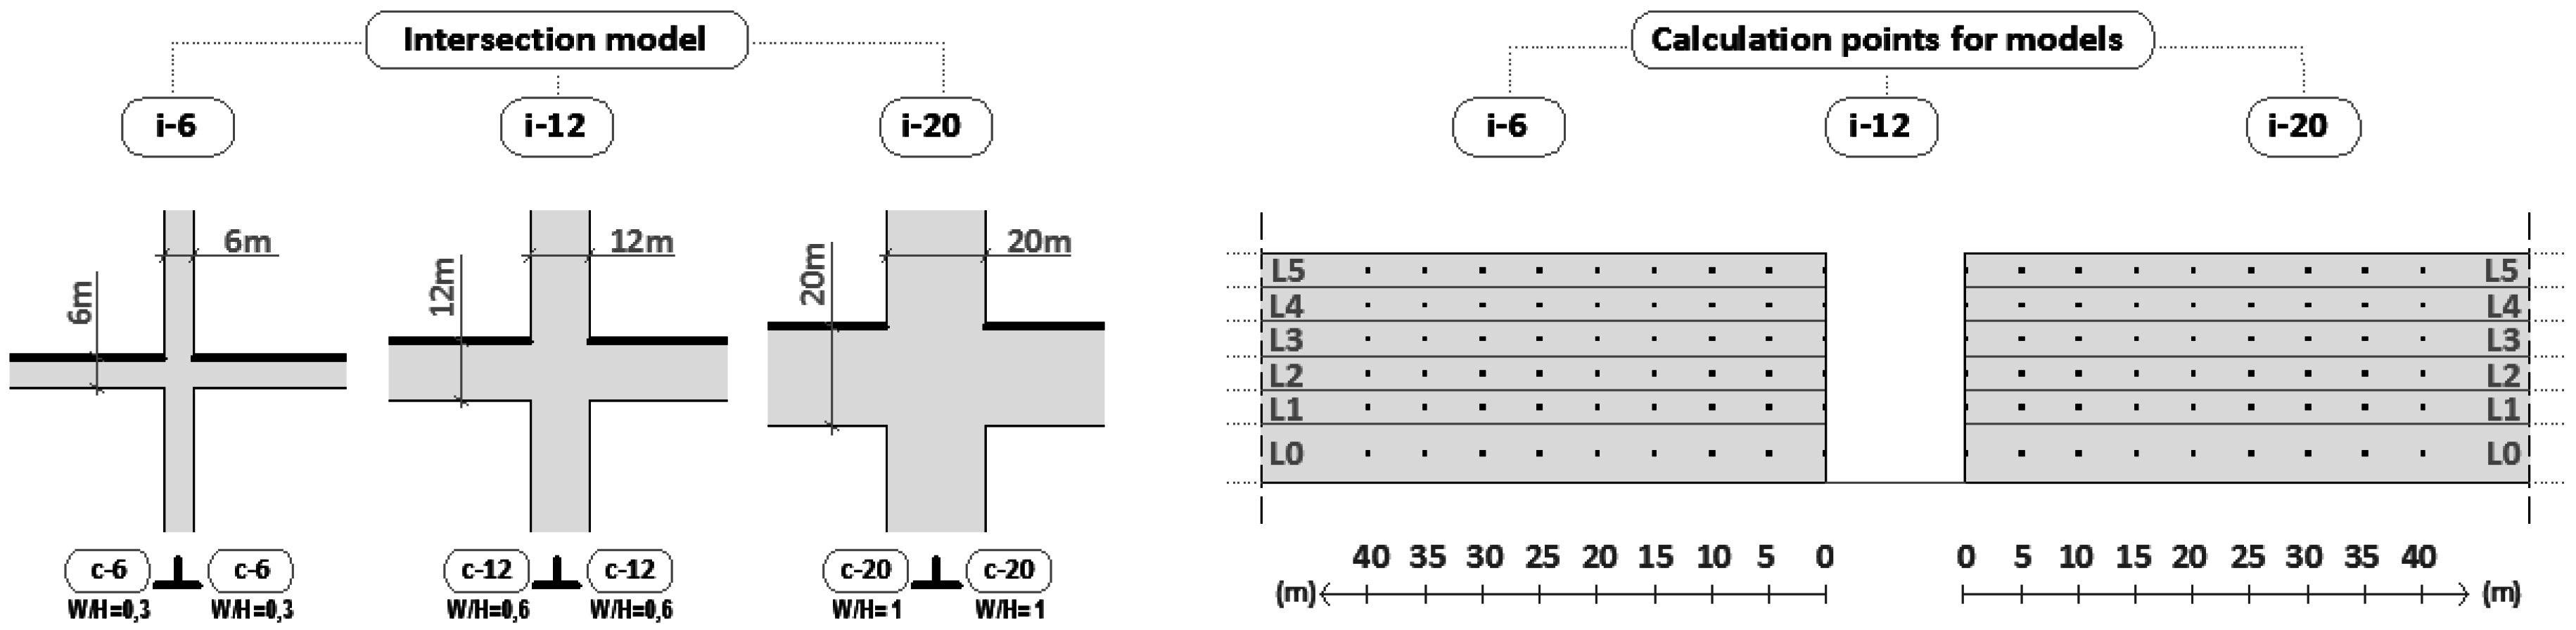
In order to assess the effects of street crossings on solar access, three intersection models (i-6; i-12; i-20) were defined based on the aforementioned canyon models (
Figure 5). These intersection models were assumed here as semi-infinite 3D-structures, conceived as a perpendicular junction of two identical endless canyons. Calculation points were located on the nodes of the grid formed by rows at the midline of each floor level (L0–L5) and columns every 5 m starting from the corner edge (0–40 m).
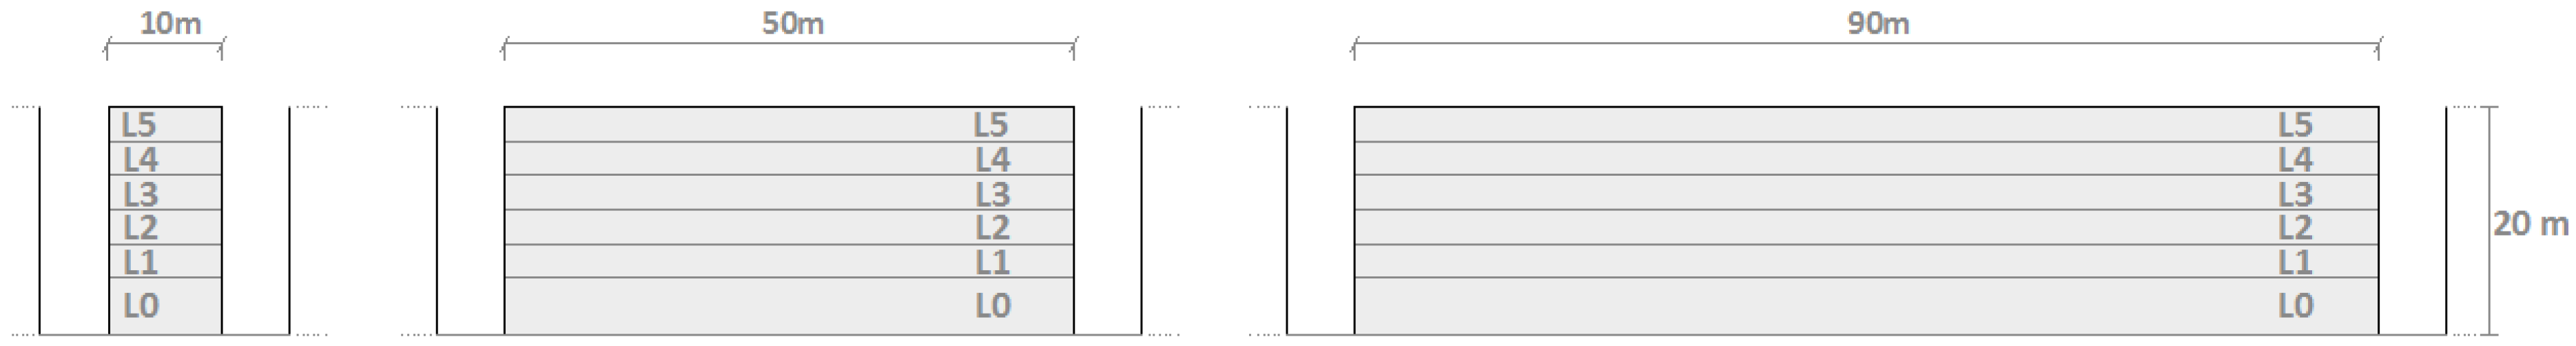
Contrasting to the boundless nature of the canyon and intersection models, a block typology was created by fixing a specific longitudinal length as depicted in
Figure 6. Three block models were defined with a street length of 10 m (b-10 model), 50 m (b-50 model), and 90 m (b-90 model). Radiation calculations were conducted on surfaces at each level. Blocks were considered as a part of urban tissues where crossings correspond to the i-6, i-12 and i-20 models.
4. Results and Discussion
4.1. Urban Canyon Baseline
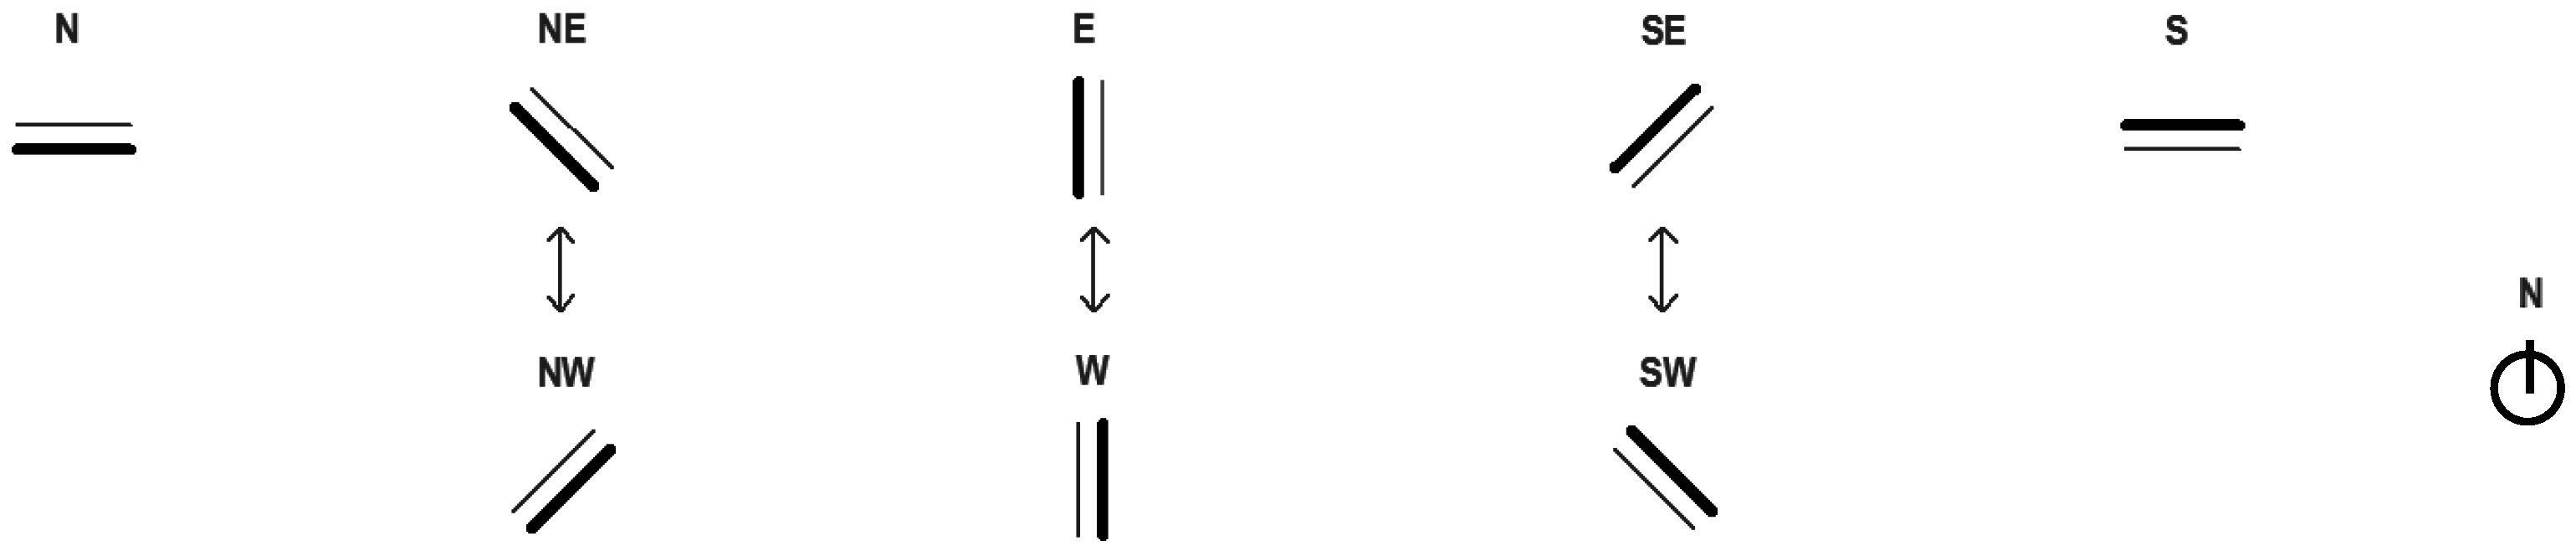
The amount of direct solar radiation impinging on the selected points of the canyon models was calculated on solstice days for eight façade orientations. Notice that, in this study, orientations referred to the direction towards which the façade faced (
Figure 7). For instance, the expression “south façade” would allude to the southern-facing wall.
As representative values of the global performance of each façade, direct radiation values on levels L0 (min) and L5 (max) of the canyon models are presented in
Table 1 for winter and in
Table 2 for summer.
The maximum solar potential was detected on the south façade for the winter solstice (2,8 kWh/m2 per day) and on the east or west one for the summer case (2,7 kWh/m2 per day). In general, the narrower the street and the lower the sun elevation were, the more significant radiation differences could be found between the highest and lowest level.
On summer solstice, changes in radiation between extreme levels (L0 and L5) were more remarkable on those façades with an east or west component, whereas, in the winter case, stronger variations are linked to the south component as a result of lower sun positions.
4.2. Deviation Introduced by Intersections
The interruption of the archetypic endless canyon by an intersection allowed an increase in the amount of visible sky; the higher, the closer to the corner. Nevertheless, more visible sky did not always result in higher direct solar gains. This only happened when the unobstructed sky area matched the sun path.
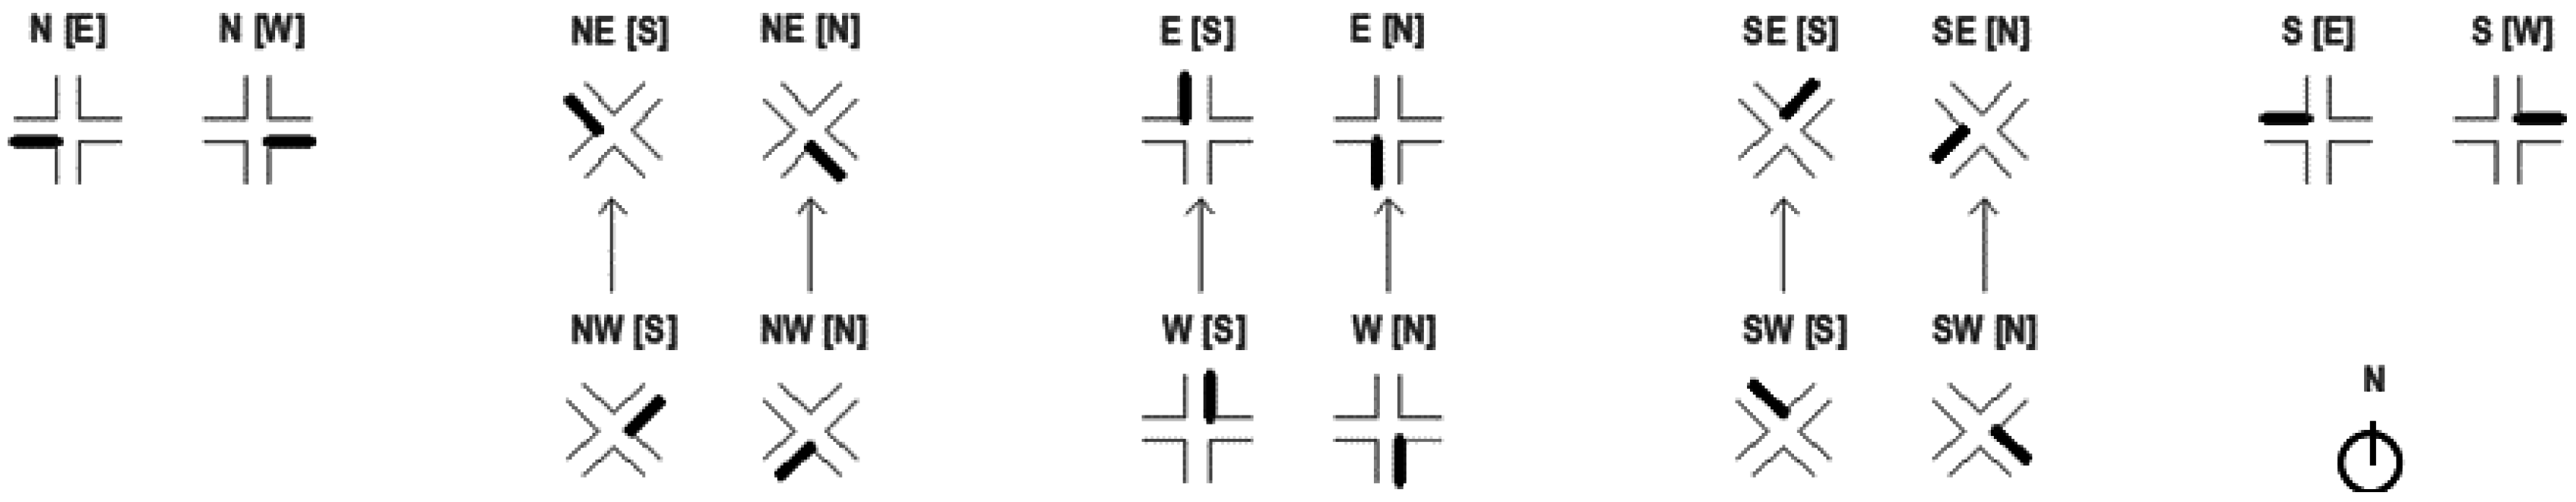
Another noteworthy aspect to consider in the solar analysis of the crossing is the relative position between the street discontinuity and the point assessed. Uneven radiation effects were detected on both sides of an intersection for the same façade orientation, except for north and south façades (due to the sun path symmetry about the north-south axis).
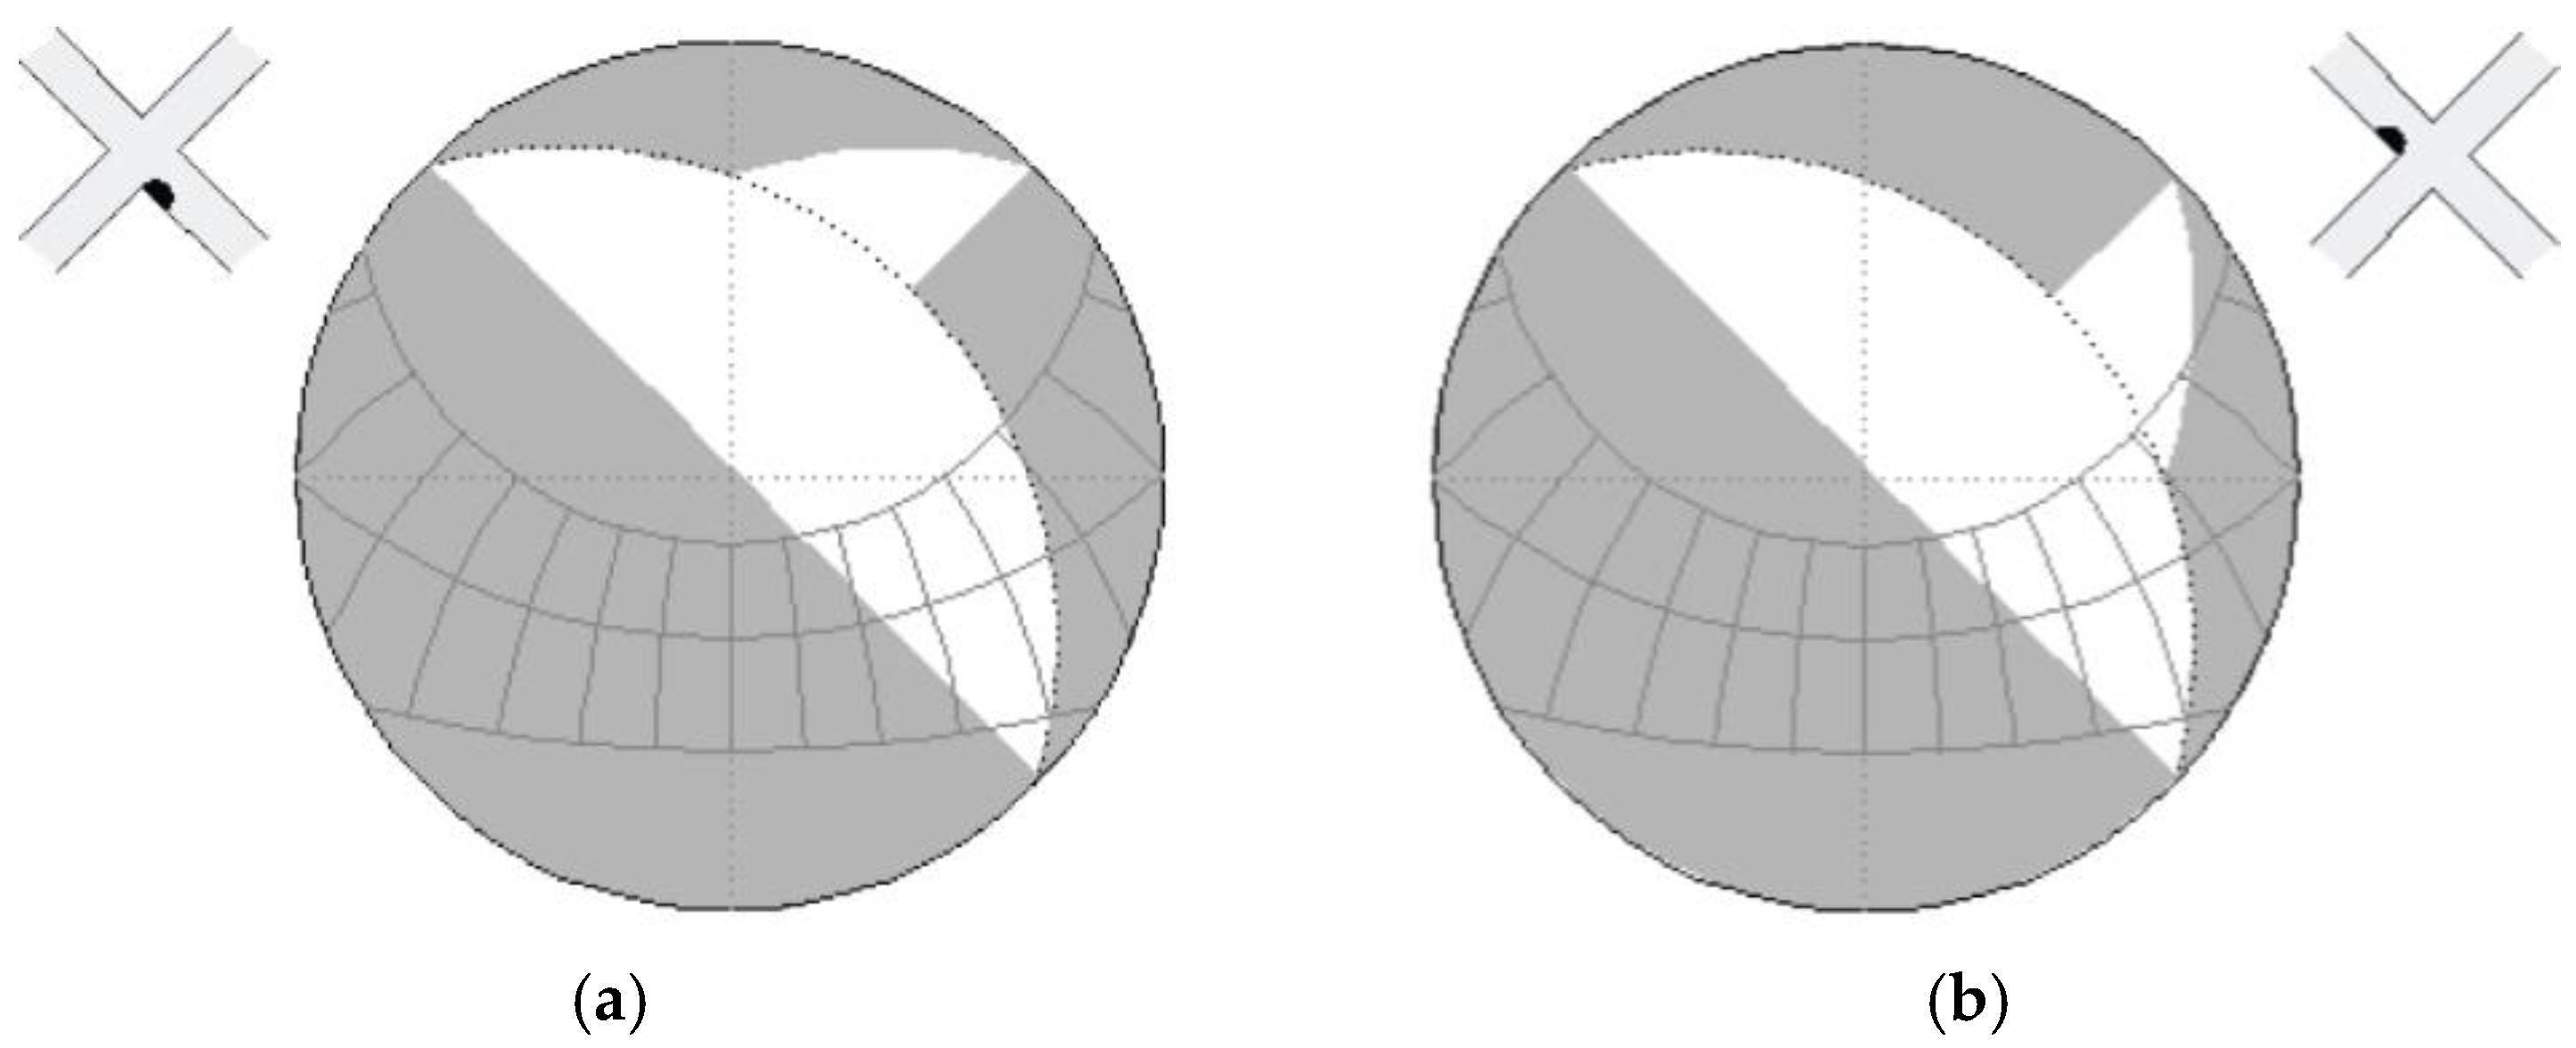
This non-symmetrical condition is illustrated through the example of the NE façade belonging to the intersection i-20 model (
Figure 8).
Diagrams in
Figure 8 reflect how the presence of a crossing may or may not lead to an increase in sunlight hours depending on the side of intersection. In this case, only the façade fraction where the street interruption was placed further south experienced changes (
Figure 8b). The visible sky area added by the intersection gap matches the sun path in
Figure 8b, resulting in an increase in the received sunlight hours compared to the canyon case. In
Figure 8a, on the contrary, any growth in the visible sky due to the crossing takes place over a sky area which is not crossed by the sun.
The energy-related consequences of this asymmetry are shown in
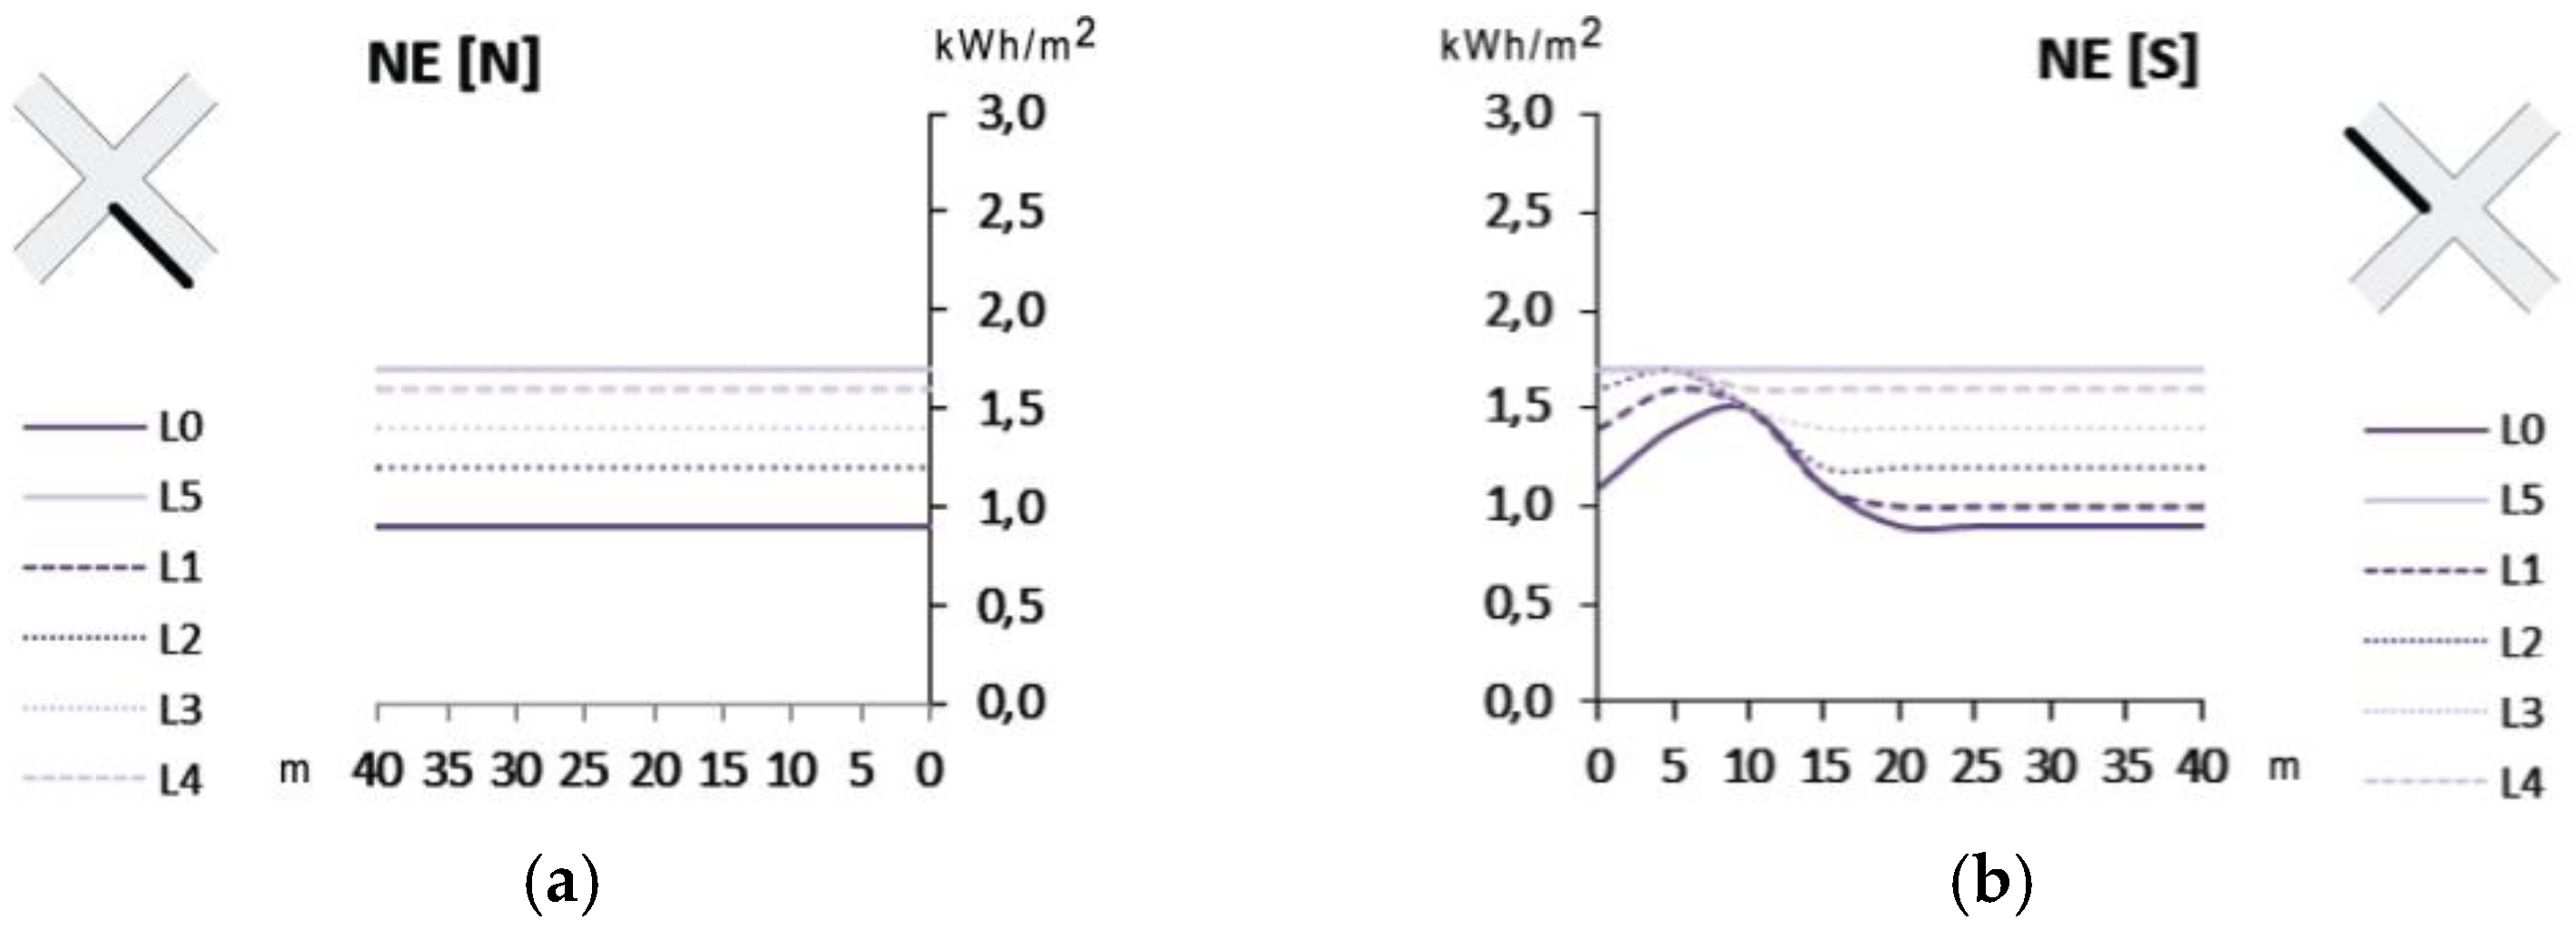
Figure 9 for the NE orientation on the summer solstice day. At one side of the intersection (NE-corner S), the amount of direct radiation was modified by the street discontinuity up to a distance of 20 m from the corner, whereas at the other one it remained unchanged (NE-corner N).
Given the importance of the relative position of the corner edge, a specific nomenclature was developed and used for the comparative analysis of the crossing effect depending on the orientation below (
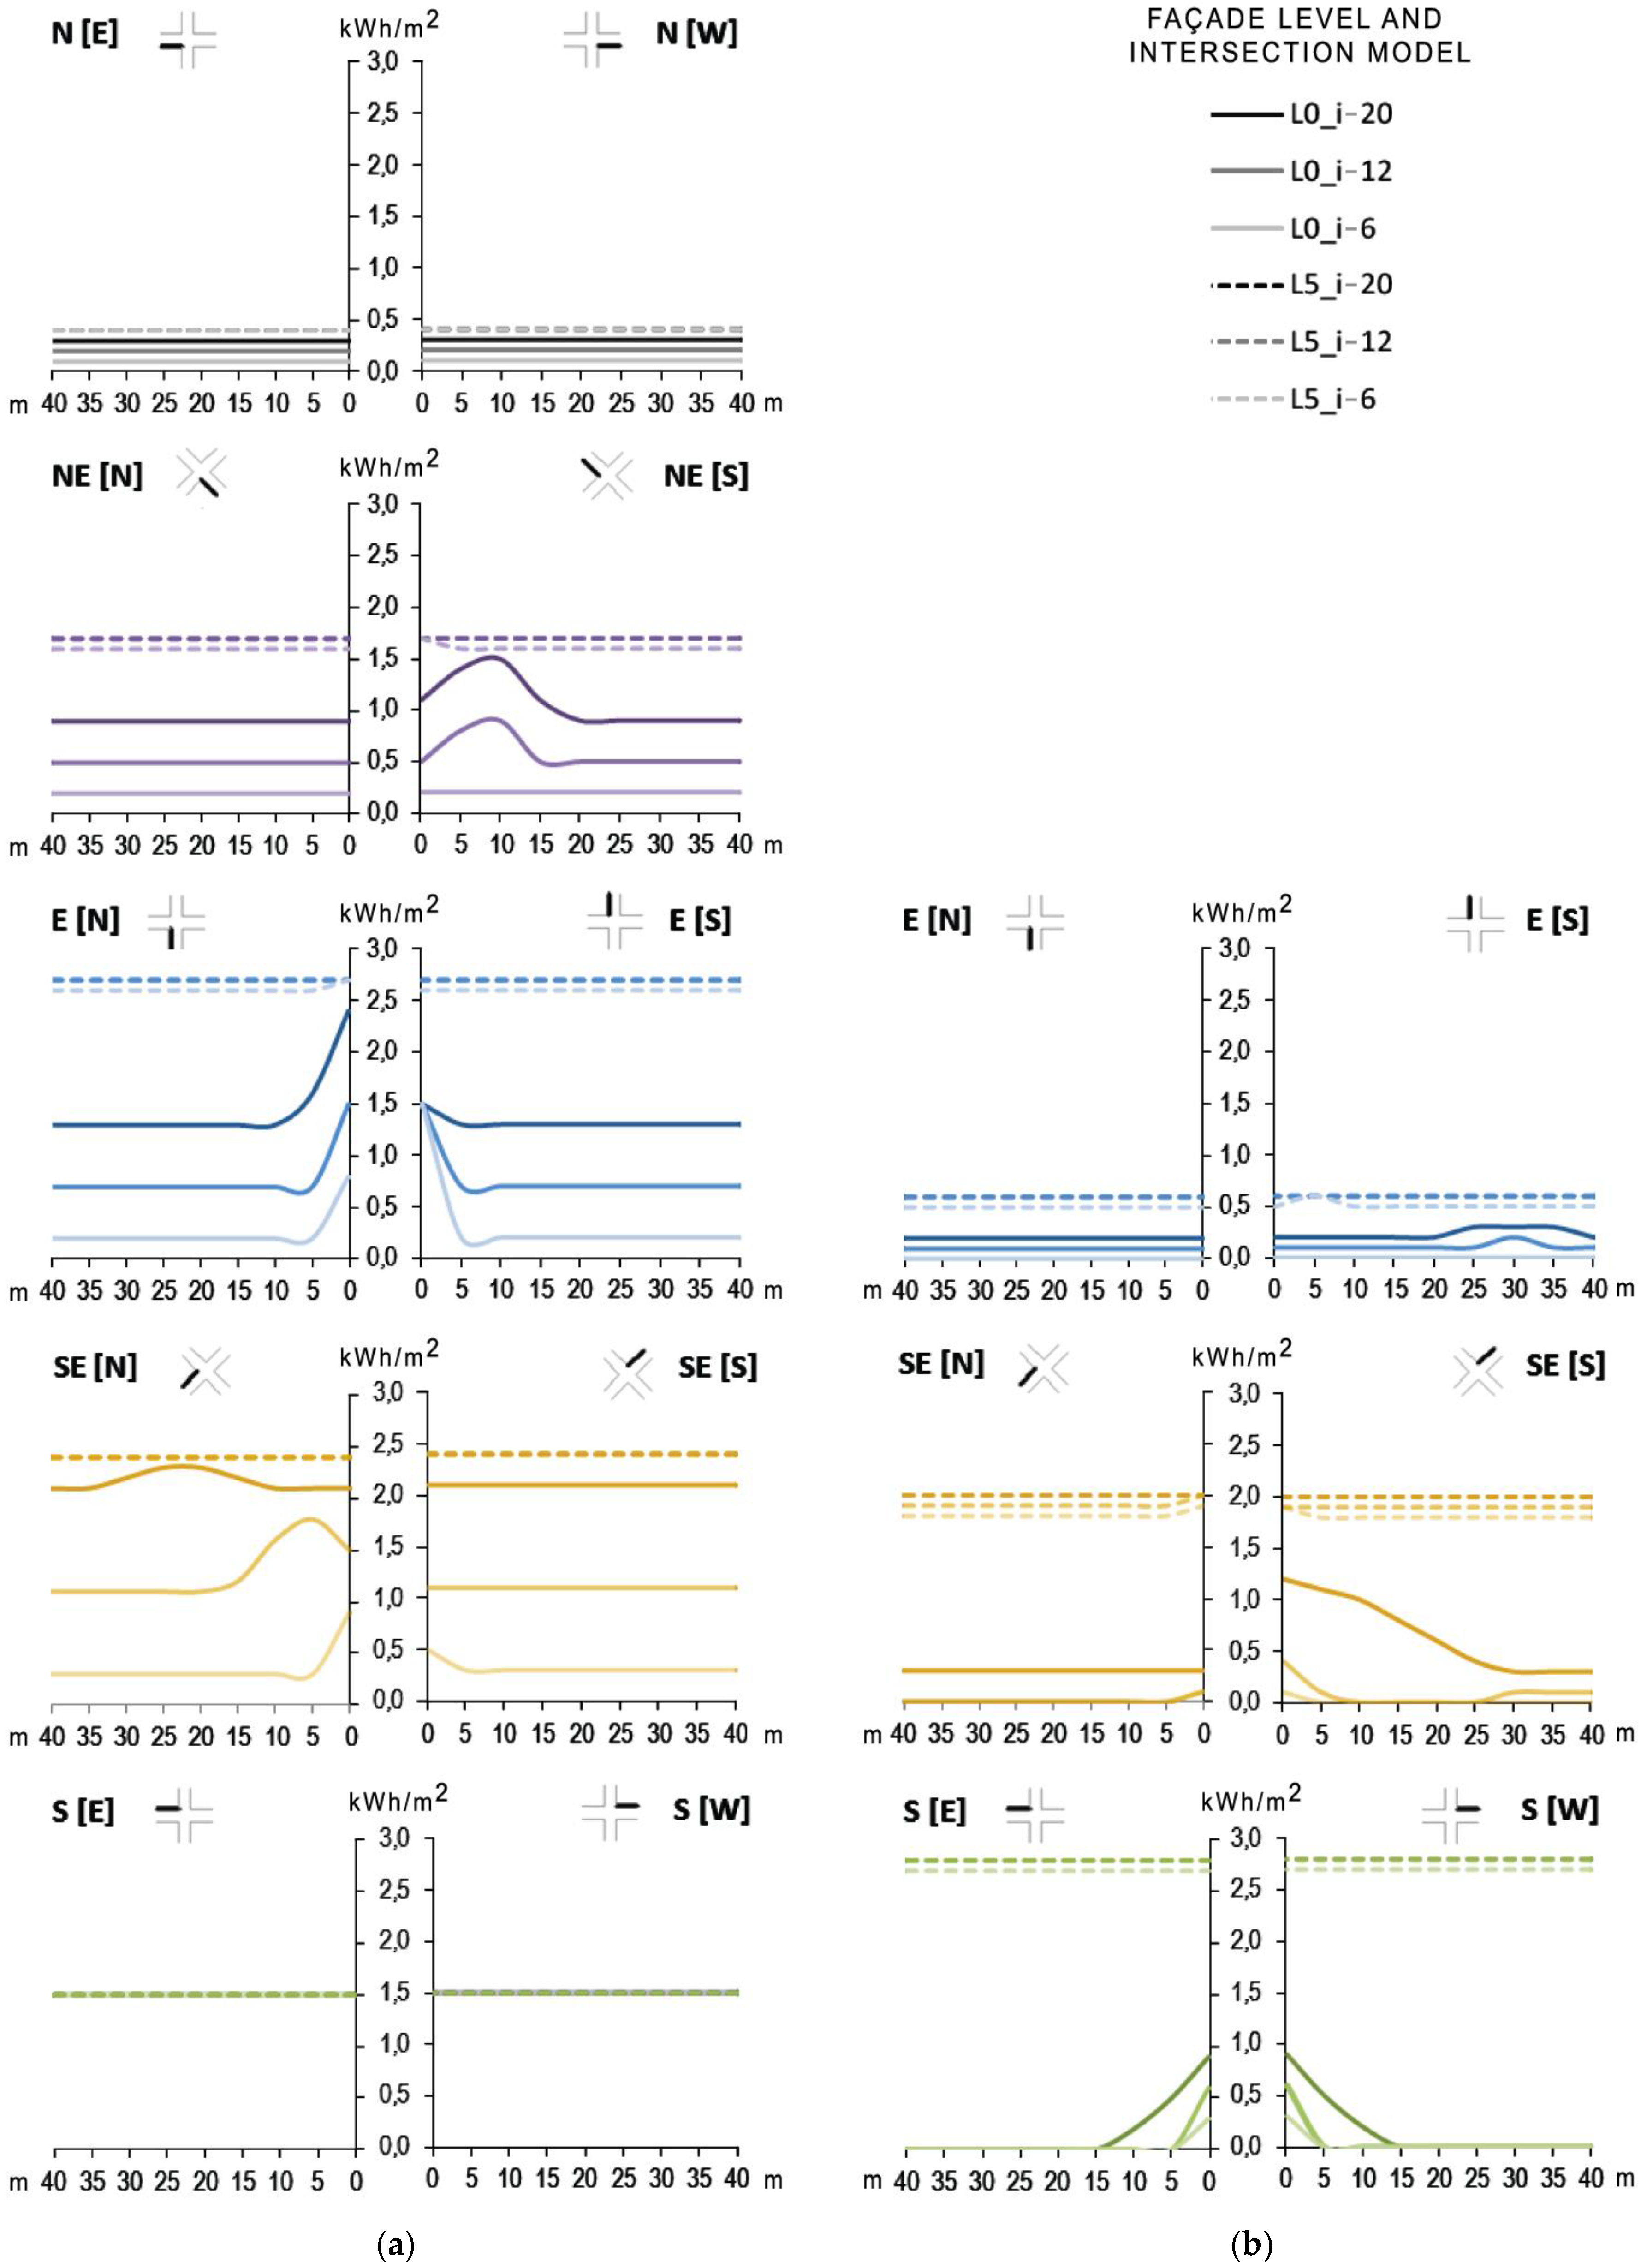
Figure 10). Direct radiation patterns were plotted individually for each side of the intersection at a growing distance from the corner edge on both solstices (
Figure 11). Radiation values on extreme levels (L0 and L5) have been graphically represented for the three intersection models.
On the winter solstice, results show that the presence of a street junction leads to an increase in solar potential for all sunlit surfaces at this time of year. The most significant increment—in quantity and extent—occurred on SE/SW [S] surfaces, especially for wider models (up to 1,30 kWh/m2 per day for i-20). In the case of south façades, the crossing contribution can be also meaningful in value (e.g., L0 might receive up to a third of the radiation on L5 at the corner in the i-20 model), though negligible effects (<0,20 kWh/m2 per day) were detected beyond 20 m for all models. Regarding east and west surfaces, the crossing introduced slight radiation increases in absolute terms (up to 0,20 kWh/m2 per day for i-20), while in relative terms they might be representative.
On the summer solstice, north and south facades remained unaffected by the crossing, whereas the rest of the orientations experienced significant energy variations. In the presence of a crossing, both sides on the intersection on E/W façades experienced changes in radiation (an increase by up to 1,30 kWh/m2 per day). On the contrary, only one side was affected for NE/NW and SE/SW orientations, although these effects extended up to greater distances from the corner (up to 35 m).
A maximum extent of the crossing was defined for each intersection model. Noticeable increases in radiation (≥0,20 kWh/m2 per day) were computed up to a maximum distance of 5, 20, and 25 m from the corner for the i-6, i-12 and i-20 models, respectively. These lengths correspond to a distance equivalent to 0,90 D, 0,90 D, and 0,25 D, D being the diagonal of the cross section of the canyon ().
4.3. Street Blocks Type Models
The deviation in relative terms between results for the theoretical endless canyon and blocks with a specified length is presented in
Table 3 and
Table 4 for the summer and winter solstices, respectively.
The disparity in radiation results between both cases is more remarkable on the winter solstice than on the summer one, due to the possibility of additional solar contributions due to crossings with lower sun elevations. As far as summer is concerned, for blocks larger than 50 m in length, the effect of discontinuities on radiation was barely noticeable (<5%) for most orientations, whereas, in winter, the radiation increased by at least 5%, even for the largest block analyzed here.
The smaller the block length was, the more significant contribution was computed, compared with the canyon model. Specifically, the radiation computed for the b-10 block could increase by up to 67% of that accounted for the canyon model.
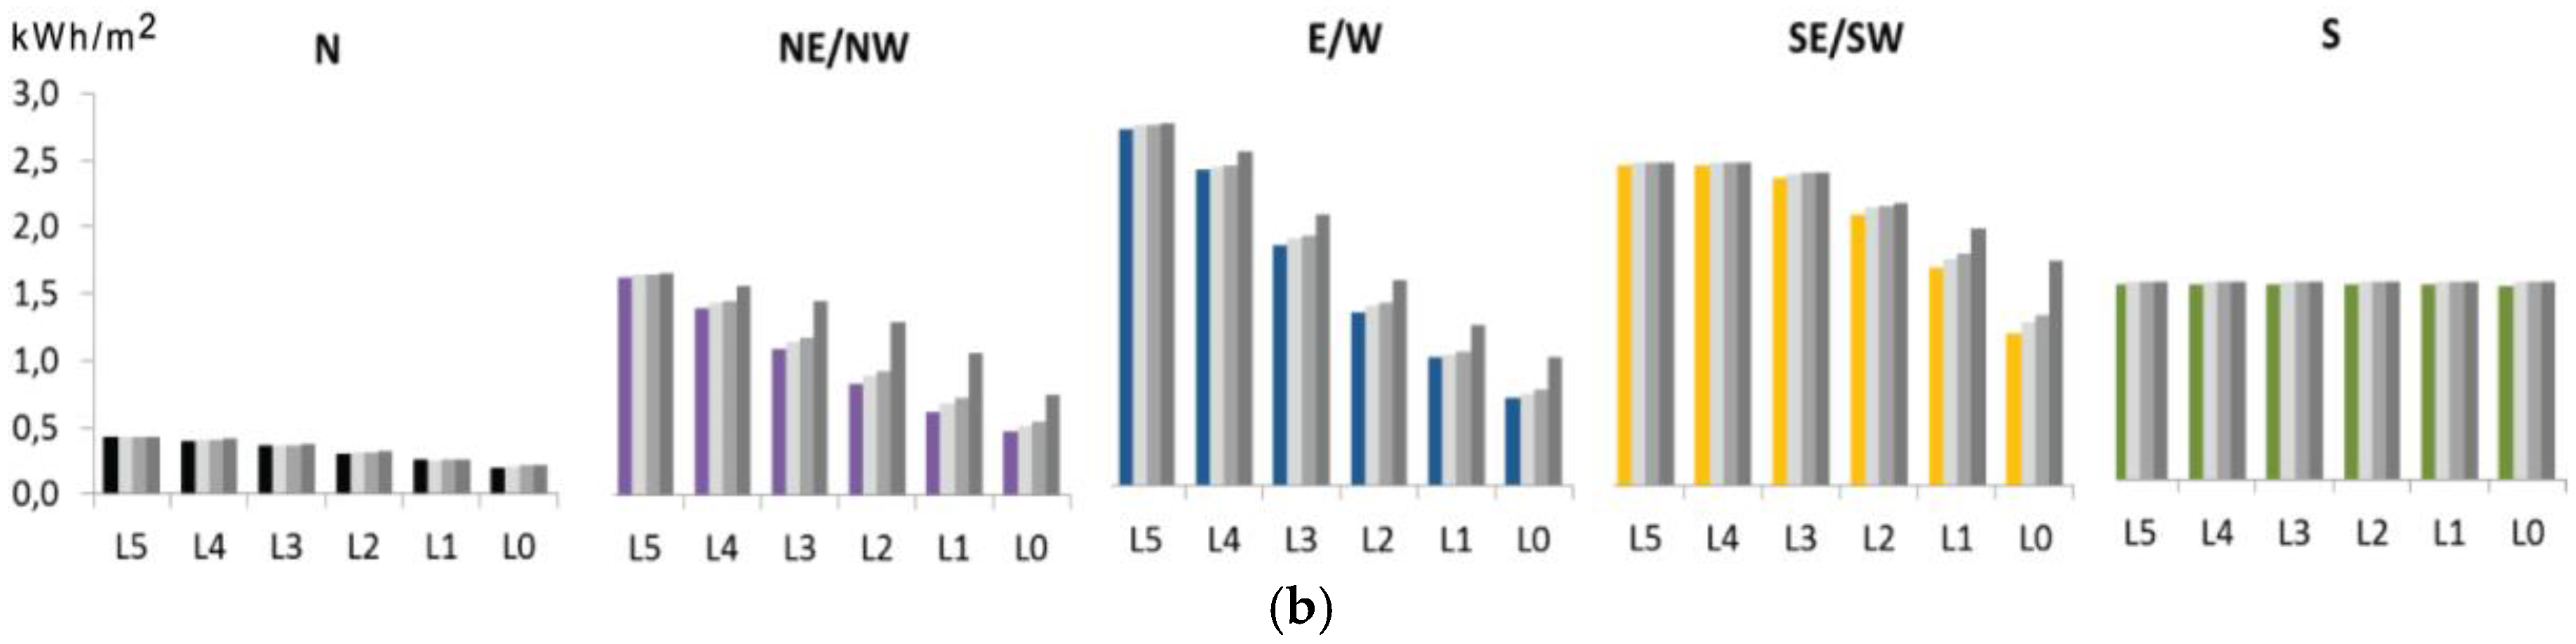
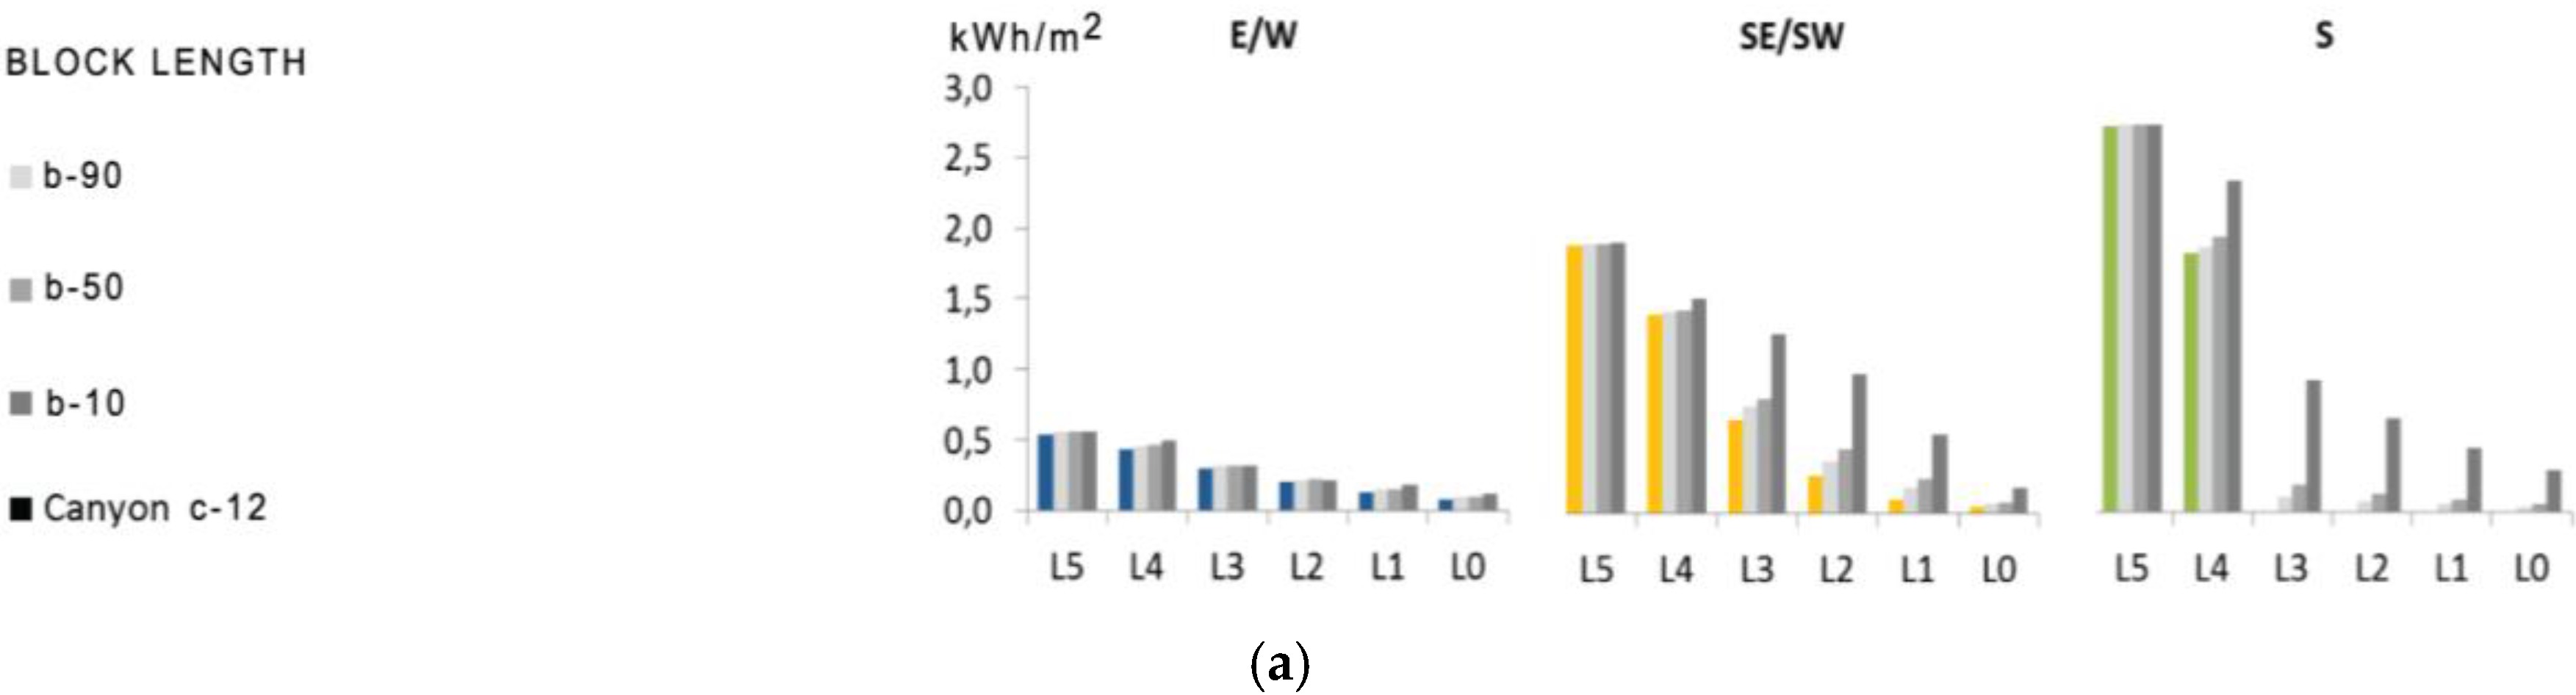
To complete the study, the crossing effect regarding to the level was analyzed. Results indicate that the main increases in direct radiation occur in lower levels. As an example, radiation values accounted on each level for the i-12 model on both solstices are shown in
Figure 12. In winter, the most remarkable effects were detected on street blocks facing south, on the b-10 model, and on lower levels. As far as summer is concerned, the most remarkable effects were also detected on the b-10 model, but for a different orientation: NE/NW.
5. Conclusions
In this paper, the effects of street discontinuities on façade solar access are assessed for narrow canyons, typical of Mediterranean cities. The novelty of the present work lies in the fact that the role played by intersections on solar availability is discussed in order to explore the deviation from the canyon case, It has been assessed whether or not taking intersections into account can be significant in terms of received radiation depending on urban morphology and distance to the corner. This analysis was conducted by comparing the solar performance of the endless canyon to other typological models with a specific length, using the amount of direct solar radiation received over façades as an indicator.
At a local scale, results of this work show that the intensity and extent of the “crossing effect” depend not only on façade orientation, degree of obstruction, and time of year, but also on the relative position between intersection gap and the assessed point. As a consequence, uneven radiation patterns were detected on each side of the intersection.
The presence of a street junction leads to an increase in vertical solar potential that is more significant on those surfaces facing SE or SW for the winter solstice (+1,3 kWh/m2 per day) and those ones facing east or west for the summer solstice (+1,1 kWh/m2 per day). As a geometrical approximation for narrow environments, for those where the street width W ≤ the height H, (i.e., W/H ≤ 1), it can be said that the “crossing effect” is almost negligible (<0,2 kWh/m2 per day) beyond a maximum distance from the corner of 0,9·D, being .
At a block scale, it has been found that solar energy analysis over façades disregarding intersections leads to deviations up to 67%, 16%, and 9% for 10, 50 and 90-meter-length blocks, respectively, in winter. In the summer case, as a result of higher sun elevations, discrepancies in radiation results between canyon and block models are noteworthy only for the shortest block assessed. Hence, block results support the horizontal limit suggested by the local study of intersections here developed. The 50-meter length (or a 2·D length) can be considered a reference distance beyond which the effects of horizontal discontinuities begin to dilute in global results at a fabric scale.
For a Mediterranean climate with hot summers and mild winters, intersections have a positive global impact over urban surfaces facing south, since solar collection is increased in winter and not in summer. On the contrary, urban discontinuities have an adverse effect over east and west façades, as its contribution in winter is negligible, whereas the summer one can be significant. For other locations, further assessments should be carried out in order to incorporate its climatic considerations (e.g., latitude and the diffuse component) and characteristic street morphologies.
The contribution of this investigation is to provide indicative values about the distance from the corner beyond which the changes in solar radiation due to the crossing can be considered negligible and, accordingly, the endless canyon assumption sufficiently accurate. This information may provide general guidance for a more efficient discretization of urban surfaces in solar access analysis by differentiating areas requiring uneven degrees of calculation detail. Thus, this work contributes to a better understanding of the solar performance of cities, providing additional insights which can be useful in urban planning when designing new neighborhoods or refurbishing existing ones.


