Abstract
With the trend towards offshore and larger-scale wind turbines, the increase in blade size makes the trade-off between structural optimization and economic feasibility more critical. To address this issue, this study focuses on the IEA 15 MW offshore wind turbine and investigates the influence of stiffness distribution on its dynamic response, based on the frameworks of multi-body dynamics, the co-rotational beam method, and the free vortex wake method. Results show that blade mid-span stiffness has the most significant influence on system performance. Reducing flapwise bending stiffness increases mean flapwise displacement by 53.8%. This greatly raises the risk of structural damage. Power output is most sensitive to torsional stiffness. Lowering torsional stiffness reduces mean power by 6.9%. This significantly impacts the economic benefits of wind farms. This study contributes to optimizing the structure of large wind turbine blades, enhancing their reliability, and improving cost-effectiveness.
1. Introduction
1.1. Challenges in the Development of Offshore Wind Turbines
With the gradual saturation of onshore renewable energy potential, and the global energy strategy is pivoting toward marine resources, among which offshore wind power is the most technologically mature and commercially viable option [1,2,3]. The development and utilization of offshore wind power can not only effectively optimize the energy supply structure but also significantly enhance energy security, providing a crucial pathway to address the global energy crisis and combat climate change challenges [4]. However, as offshore wind turbines evolve toward larger scales, their structural design must strike an optimal balance between safety and cost-effectiveness.
Industry projections from the Global Wind Energy Council (GWEC) indicate that rotor diameters are expected to reach 350 m by 2030 [5]. The increasing scale of wind turbines has substantially elevated manufacturing and installation costs [6]. The increase in the scale of wind turbines not only raises the manufacturing and installation costs but also makes the geometric nonlinear effect of the super-long flexible blades more prominent [7]. The dynamic responses of offshore wind turbines remain difficult to predict accurately, owing to complex environmental conditions and strong nonlinear aero-structural coupling effects [8].
1.2. Overview of Recent Research
With growing attention to the dynamics of wind turbines, the importance of blades has become increasingly prominent. As the core components for capturing wind energy and bearing loads, their dynamic response exerts a profound impact on the overall performance of the system. Thus, the adoption of high-precision calculation methods is important for studying the nonlinear response of long, flexible blades. The comparison of the accuracy and efficiency of different numerical methods is shown in Figure 1. Although the integrated Computational Fluid Dynamics (CFD) and Computational Structural Dynamics (CSD) enable high-precision analysis of fluid–structure interaction [9,10,11], its substantial computational cost limits the feasibility of large-scale parametric studies [12]. In contrast, the coupled Blade Element Momentum Theory (BEMT) and Geometrically Exact Beam Theory (GEBT) significantly enhances computational efficiency through model simplification [13,14]. However, its inherent limitation in capturing vortex evolution in the flow field leads to the loss of critical flow information. The Free Vortex Wake Method (FVWM), by combining the vortex model and the wake model, can effectively capture the evolution of vortices in the flow field, and its computational cost is significantly lower than that of CFD [15,16]. However, the complexity of GEBT entails significant computational resources when combined with FVWM. The Co-rotational Beam Method (CRBM) [17] serves as an effective alternative nonlinear finite element approach. By introducing a co-rotational coordinate system to decouple nonlinearities, it substantially enhances computational efficiency, making its integration with FVWM feasible. CRBM accommodates a complete 6×6 stiffness matrix [18], enabling the capture of nonlinear deformations in different directions of the blade, thereby meeting the accuracy requirements for analyzing cross-sectional stiffness variations of blades.
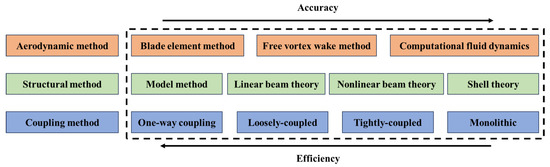
Figure 1.
Comparison of the accuracy and efficiency of different numerical methods.
Based on the above simulation methods, scholars have conducted extensive research in the field of wind turbines.Regarding studies on wind turbine aerodynamic characteristics, by developing passive flow control techniques using winglets and trailing-edge flaps, Abdelghany and Farghany enabled significant improvements in stall characteristics and aerodynamic performance of wind turbine blades [19,20]. Qian [21] investigated the wake recovery of tandem wind turbines using the shear stress transport-partially averaged Navier–Stokes turbulence model. The free vortex wake method has been widely applied. Chen [22] used the free vortex wake method to analyze the aerodynamic characteristics of coaxial dual-rotor wind turbines and studied the mutual influence between the front and rear wind wheels. Shaler [23] compared the prediction results of the free vortex wake method with the experimental values under different yaw angles and free flow velocities. The results show that the free vortex wake method is an effective tool for improving the optimization of wind farms. For the dynamic response analysis of the wind turbines, Lu [24] used a scaled-down model for aeroelastic wind tunnel experiments on wind turbines and proposed an effective root reaction force method for predicting the flutter boundary based on the blade tip displacement and root load of large wind turbine blades. Qian [25] systematically investigated the influence of control parameters on the aeroelastic stability of wind turbine blades using a multi-body dynamics approach. Their results demonstrate that selecting appropriate yaw and pitch angles can significantly improve the turbine’s aeroelastic stability. As the flexibility of blades gradually increases, more and more scholars have begun to study the influence of blade structural characteristics on the dynamic response of blades. Huang [26] employed a fluid–structure interaction method to conduct a coupled aeroelastic analysis of the NREL 5MW wind turbine. The results indicate that the blades reduce aerodynamic loads and alter wake characteristics through deformation, with these effects becoming more pronounced as wind speed increases. Lee [27] employed a coupled CFD/CSD approach to analyze the fluid–structure interaction of a full wind turbine under various wind conditions, validating its superior computational accuracy through comparison with experimental data and BEM theory. Wang [28] compared the coupled deformation and stress distribution of different blade structures using a bidirectional fluid–structure interaction method. The results demonstrate that shell structure blades with webs exhibit optimal performance. Shakya [29] conducted a comparative study of flutter limits in different megawatt-scale wind turbines using nonlinear time-domain aeroelastic analysis and parametric research. The findings reveal that geometric nonlinearity significantly influences the flutter performance of the blades. Jeong [30] used a fluid–structure interaction method to study the effect of the center of mass on flutter performance, indicating that shifting the center of mass toward the trailing edge reduces the flutter speed limit. Hayat [31] increased the flutter critical speed of the rotor by adjusting ply orientations, confirming that the use of lighter and stiffer carbon fiber materials can enhance the flutter performance of blades.
1.3. Research Gap and Motivation
To clarify the positioning and innovations of this study, the main differences between the present work and existing studies are summarized as follows:
The nonlinear effects of blades are complex and result from the coupling of aerodynamic and structural interactions. Previous research has primarily focused on structural nonlinearities, often employing BEMT to calculate aerodynamic forces, which tends to overlook critical information in the flow field [32]. While coupled CFD and CSD methods can effectively reveal the mechanisms of fluid–structure interaction, their substantial computational resource demands limit their applicability in large-scale simulations. This study innovatively couples FVWM with CRBM, significantly improving computational efficiency while ensuring physical accuracy, thereby effectively capturing the nonlinear response in fluid–structure interaction.
The influence mechanism of blade stiffness on the response of wind turbine system is not limited to adjusting the stiffness magnitude. While previous studies have predominantly focused on the influence of stiffness variations on the dynamic response of the system [33], the crucial role of stiffness distribution along the blade span has often been overlooked. This study systematically investigates for the first time the mechanism of influence of different spanwise stiffness distributions on the dynamic response of wind turbines, conducting quantitative analyses that provide a new scientific perspective for blade structural optimization.
With the trend of wind turbines becoming increasingly offshore and larger in size, the complex working environments and multi-degree-of-freedom coupled responses make it challenging to accurately predict their dynamic behavior. Notably, the nonlinear effects of long, flexible blades are significant, and the nonlinear influence of blade stiffness on the dynamic response of wind turbines has been relatively understudied. Previous studies have primarily focused on changes in a specific stiffness magnitude, with limited attention paid to the impact of stiffness distribution. To this end, this paper establishes a precise and efficient simulation framework, thoroughly revealing the nonlinear influence patterns of stiffness distribution on wind turbine system responses, and providing direct and effective theoretical support for blade design and engineering applications.
1.4. Arrangement of This Work
This paper proceeds as follows. First, the dynamic analysis methods and the study model are introduced. Then, detailed comparisons are made with experimental results and findings from the literature, and the aeroelastic dynamic model is comparatively validated under both normal and extreme operating conditions. Furthermore, the influence of spanwise stiffness distribution on the dynamic response of the wind turbine is quantitatively analyzed under both steady and turbulent wind conditions. Finally, the conclusions drawn from the study are summarized.
2. Model Description and Methodology
2.1. The IEA 15 MW Wind Turbine
Based on a multi-body dynamics framework, this study develops a comprehensive wind turbine dynamic model to solve for its dynamic response. In this model, aerodynamic loads are simulated using the free-vortex wake method, which is capable of capturing unsteady flow behavior and wake vortex evolution in the flow field; meanwhile, the geometrically nonlinear large deformations of the blades are described via the co-rotational beam formulation, which accurately addresses finite rotations and large-displacement problems. The IEA 15 MW monopile wind turbine [34] is selected as the numerical simulation model in this study. The integrated dynamic model includes the wind turbine superstructure and the support substructure. To concentrate on the dynamic structural characteristics of the rotor and blades, the motion response of the support substructure is neglected by constraining its degrees of freedom. The key design parameters of the wind turbine are shown in Figure 2. As shown in Figure 3, the cross-sectional stiffness of the blade varies along its span. The blade has a mass of 65,250 kg and utilizes the FFA-W3 airfoil series, with first-order flapwise and edgewise natural frequencies of 0.555 Hz and 0.642 Hz, respectively. In analyses focusing on rotor response, constraining the substructure allows the complex offshore wind turbine system to be reasonably simplified into a more tractable “fixed-foundation-tower-rotor” system. This simplification is applicable to normal operating conditions where hydrodynamic effects are not considered.
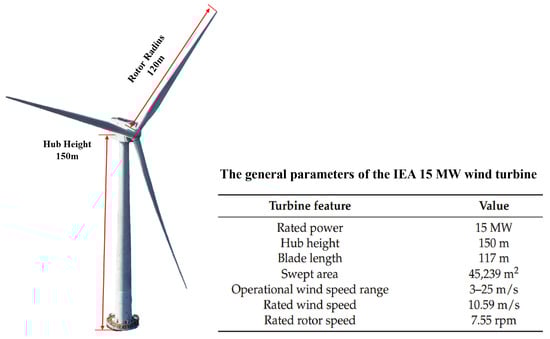
Figure 2.
Schematic diagram of IEA 15 MW wind turbine scale.
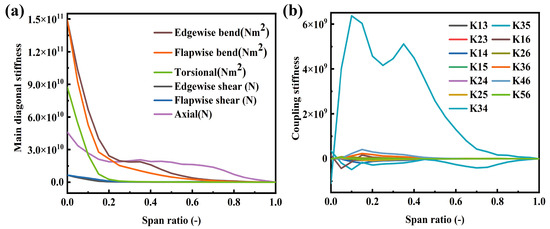
Figure 3.
Schematic diagram of blade cross-sectional stiffness distribution along the span: (a) main diagonal stiffness (b) coupling stiffness.
2.2. Free Vortex Wake Method
The free vortex wake method is a numerical approach for rotor aerodynamic analysis based on potential flow theory. Its core idea is to accurately simulate the spatiotemporal evolution of wind turbine blade wake by using a series of vortex filaments that evolve with the flow field. Compared to traditional blade element momentum theory, it significantly reduces reliance on empirical correction models and accounts for the influence of vortices in the flow, thereby improving prediction accuracy under complex operating conditions. Due to the simplified vortex model, its demand for computational resources is much lower than computational fluid dynamics. Thus, the free-vortex wake method is an effective approach for solving aerodynamic loads on large flexible blades. This method consists of two components: a lift model and a wake model. According to Prandtl lifting-line theory, the blade is modeled as a series of bound vortex filaments distributed along the quarter-chord line. The wake vortex model is composed of trailing vortex filaments and shed vortex filaments, which significantly enhances the capability to capture the three-dimensional unsteady flow field around a wind turbine. Both the lifting-line model and the wake model are illustrated in Figure 4.
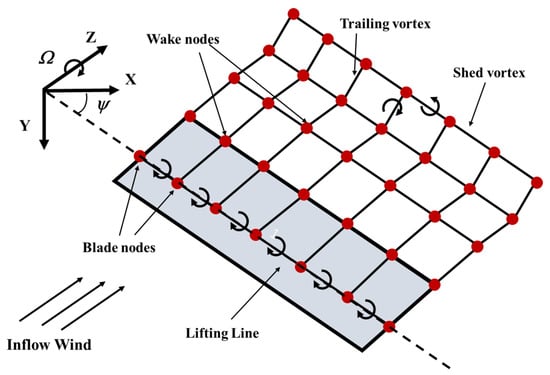
Figure 4.
Schematic diagram of the free vortex wake model.
The blade is discretized into several spanwise segments, and the circulation strength of cross section is solved by the local aerodynamic conditions and the Kutta–Joukowski theory.
where represents the circulation of vortex filament at blade section i, c denotes the length of chord, corresponds to the airfoil lift coefficient, and W denotes the resultant velocity. In this paper, the blade is divided into 30 segments, a quantity chosen to balance computational efficiency and accuracy. After the vortex line is dragged out of the blade and moves downstream, the wake area can be divided into near wake and far wake. The near-wake is simulated by the vortex surface, which consists of trailing vortex and shedding vortex. At the interface between the near wake and the far wake, the near wake vortex surface is rolled up into a concentrated tip vortex, forming a simplified helical far wake model. The partial differential form of the governing equation of vortex filament can be written as:
where is the azimuth angle of the blade, and is the wake life angle. is the inflow wind speed, and is the induced velocity. The wake region is divided into near-wake and far-wake regions. The near-wake, which has a significant influence on the control points, is typically represented using discrete vortex elements, while the far-wake is modeled as concentrated tip vortex filaments. The induced velocity at control points due to these vortex filaments is computed using the Biot–Savart law.
when the distance becomes sufficiently small, a singularity issue arises, which impedes the convergence of the solution. The singularity problem is usually solved by using the vortex core model. Based on the original model [35], Vatistas [36] constructed a vortex model considering the influence of turbulence and provided the expression of the induced velocity.
among them, both and n are turbulence proportionality constants, where the relationship between them is defined as . Based on the literature [37], is assigned the empirical average value of 0.653. The vortex core radius, denoted by , is a critical parameter in vortex simulations that directly governs the distribution of induced velocity within the flow field. Bhagwat [38] introduced a new expression for the vortex core radius that accounts for both eddy viscosity and dissipation effects, where the radius varies with the wake age angle.
in this formulation, denotes the vortex core radius when the wake age angle is zero, represents the vortex viscosity parameter, defined as a function of the vortex Reynolds number to model the enhanced vorticity diffusion rate of the tip vortex, and corresponds to the rotational velocity of the rotor.
According to the principles of fluid dynamics, wind turbine wakes exhibit significant velocity deficit and radial expansion. This flow behavior results in the stretching of vortex structures as they convect downstream, leading to continuous elongation of vortex elements. Under the assumption of incompressible flow and in accordance with Helmholtz’s vorticity conservation theorem, the axial stretching of vortex elements necessarily accompanies a reduction in their cross-sectional area, thereby causing a contraction of the vortex core radius. Thus, the expression for the effective vortex core radius is given by:
where denotes the linear strain of the vortex element. The wake solution is computed using a time-stepping method, implemented as a three-step and third-order predictor corrector format (D3PC). The time-stepping method is inherently capable of capturing the unsteady characteristics of a wake because it explicitly follows the physical evolution of time in its solution. The wake region division and the time-stepping method are described in detail in the literature [39].
2.3. Co-Rotational Beam Method
At present, the blades of wind turbines are longer and thinner, and the nonlinear effect is becoming more and more obvious. The traditional linear beam model cannot meet the engineering requirements. GEBT directly adopts precise and nonlinear geometric descriptions, significantly enhancing its computational accuracy, but it also brings about the problem of low computational efficiency. To accurately capture the nonlinear displacement response of large-scale wind turbine blades while maintaining high computational efficiency, this study adopts the co-rotational beam method. It decomposes the overall motion of an element into rigid-body motion within the co-rotational framework and elastic deformation in the local coordinate system. All geometric nonlinearities are encapsulated in the transformation matrix between the local and global coordinate systems. This is also the key to its efficiency in handling nonlinear problems. As shown in Figure 5, the beam elements deform in the local coordinate system after the blade is discretized. is the global coordinate system, which serves as the fixed reference frame throughout the motion analysis. is the initial local coordinate system, where the beam element is in its undeformed state. and are related through the rotation matrix . represent the displacement vector of the beam element in the global coordinate system. In the global coordinate system, the displacement vector of each node in a beam element consists of three translational and three rotational displacements. Since the axis of the local coordinate system coincides with the straight line connecting the nodes, the nodes only have axial displacements and rotational displacements.
where and represent the translation and rotation of the node, respectively. And the subscripts g and l denote the global and local coordinate system, respectively. The subscripts 1 and 2 represent the two nodes of the beam element, each of which has six degrees of freedom.
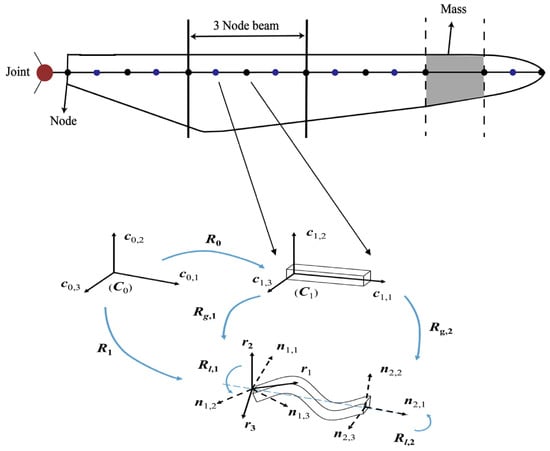
Figure 5.
Schematic diagram of blade discretization and co-rotating coordinate system.
The orientation of the rigid rotation of the local coordinate system within the global coordinate system is defined by the orthogonal matrix . The detailed derivation of the matrix can be found in reference [40].
(i = 1, 2; j = 1, 2, 3) denotes the nodal rotation vector in the local coordinate system and can be expressed as:
Thus, the local rotational matrix can be obtained:
Local rotation vector can be expressed as:
The displacement vector of the beam element in the local coordinate system can be expressed as:
where denotes the transformation matrix, which can express the local displacement vector in the global coordinate system. Since the virtual work is equal in both the local and global coordinate systems, the expression of the global stiffness matrix can be derived.
where transformation operators and can map the local internal force vector and the local stiffness matrix to the global coordinate system [41,42]. The first term on the right-hand side of the equation represents the material stiffness matrix, while the second term corresponds to the geometric stiffness matrix. To account for tapered cross-sections and anisotropic material properties in the local stiffness formulation, the section stiffness matrix must be introduced. This matrix is a symmetric matrix encompassing all nodal stiffness components, defined as:
The lateral degrees of freedom and bending degrees of freedom adopt Hermite shape function, while the axial deformation and rotational degrees of freedom adopt linear shape function. The displacement and strain vectors of a node are expressed as:
where is the shear strain of Timoshenko beam. Therefor, the total strain energy in the unit can be expressed by the cross-sectional stiffness matrix and the strain vector as:
where is the displacement vector matrix of the beam element. Therefore, local stiffness matrix can be expressed as:
where represents the strain-displacement matrix incorporating both shape functions and boundary conditions. The detailed derivation can be found in [43].
2.4. Aeroelastic Dynamics Process
Figure 6 illustrates the complete computational workflow for the aeroelastic response of the blade at each time step. The aeroelastic response calculation process can be divided into two parts: aerodynamic computation and structural dynamics solving.
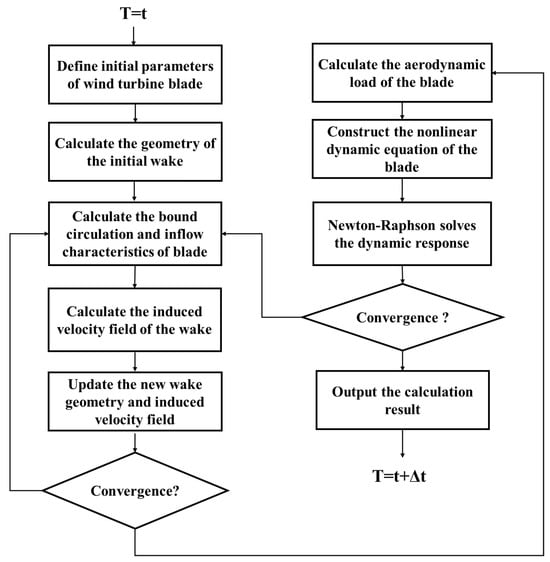
Figure 6.
Schematic diagram of the aeroelastic response process.
Specifically, initial blade parameters are first defined and an initial wake composed of regular helical lines is generated. Subsequently, the vortex circulation distribution is calculated based on the inflow characteristics. This distribution is used within the vortex model to compute the induced velocities at the wake nodes. The wake geometry and induced velocity field are updated by stepping through azimuth angles. Convergence is determined based on the geometric residual of the wake geometry. After converged, the aerodynamic loads are calculated and applied to blade elements. The process then proceeds to the structural dynamics solving stage. Nonlinear dynamic equations of the blade elements are constructed based on their mass and stiffness matrices, and the Newton-Raphson method is employed to iteratively solve for dynamic response of the blade at the current time step until the force residual falls within the preset tolerance. This response result is fed back to the aerodynamic computation to update the loads. After completing the current time step, the process advances to the next time step and continues cycling until the total simulation time requirement is met.
3. Validation of Dynamic Model
3.1. Validation of Aerodynamic Model
First, the aerodynamic model was validated. Taking the NREL Phase VI wind turbine as the research object, the thrust and torque of the rotor under different wind speeds were calculated. The parameters of the wind turbine and the detailed setup of the operating conditions can be found in the literature [44]. The calculated results are shown in Figure 7. The free-vortex wake method shows good agreement with the experimental data. However, due to its foundation in potential flow theory, the method systematically overestimates the rotor torque. The simplified vortex model cannot accurately capture three-dimensional viscous effects, leading to an under-prediction of the rotor thrust. When the wind speed exceeds 10 m/s, some deviations occur due to the influence of dynamic stall and three-dimensional rotational effects, but the overall agreement remains satisfactory.
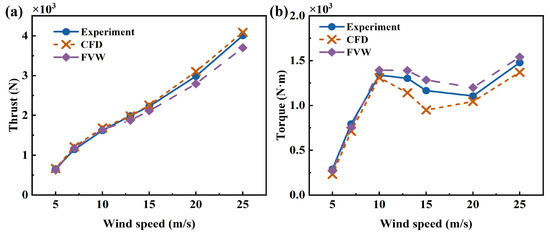
Figure 7.
Comparison of aerodynamic characteristics of wind turbine at different wind speeds: (a) Thrust, (b) Torque.
3.2. Validation of Structural Dynamics Model
To mitigate the risk of tower damage arising from large deformations of wind turbine blades, modern blade designs commonly incorporate a pre-bent configuration. In this study, a bending-torsion coupled beam model accounting for initial pre-bending is selected as the research subject to validate the structural dynamics model. The schematic representation of the beam model is illustrated in Figure 8. The bending-torsion coupling effect is introduced by setting , with the elastic modulus of GPa. A concentrated load of 300 N is applied at the free end of the cantilevered beam. The six-degree-of-freedom displacements of the beam are computed and compared with reference results from the literature [40,43]. The comparative results are presented in Table 1. The calculation results exhibit a high degree of consistency with those reported in the literature, with a maximum deviation of less than . This demonstrates that the structural dynamics model proposed in this study is capable of accurately predicting blade displacement.
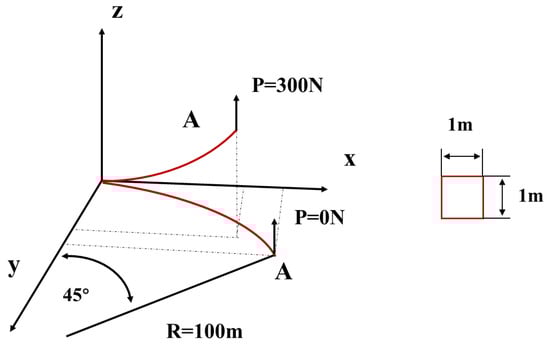
Figure 8.
Schematic diagram of anisotropic pre-bent cantilever beam.

Table 1.
Comparison of beam displacement results.
3.3. Validation of Aeroelastic Dynamics Model
The aeroelastic behavior of the IEA 15 MW wind turbine under normal and extreme conditions was simulated to assess the predictive performance of the proposed aeroelastic dynamic model. The results of the model were systematically compared against the simulations from the open-source aeroelastic simulation platform OpenFAST. OpenFAST is a widely used aeroelastic simulation platform in the wind turbine industry. It integrates BEMT with GEBT. While BEMT achieves sufficient accuracy for most engineering applications when coupled with corrective models, its inherent limitations prevent it from capturing vortex evolution within the flow field. GEBT demonstrates superior accuracy in handling nonlinear problems and has consequently been extensively adopted in high-fidelity simulations. The parameters of extreme working conditions were prescribed following IEC-61400 standard [45].
The initial validation was conducted under steady wind conditions with a wind speed of 13 m/s and an initial rotor speed of 4.5 rpm. At this wind speed, the control module actively stabilizes the aeroelastic response of the wind turbine by adjusting the pitch angle, thereby enabling a more comprehensive comparison of the complete aeroelastic response model. The active control strategy has corresponding adjustment methods in different wind speed intervals, and detailed descriptions of this method are available in the literature [34]. Figure 9 compares the dynamic response results of the wind turbine. The predictions from the present model show a close match with the OpenFAST results. The power output shows a minor deviation of only 0.3%. The maximum displacement deviation remains within 6%, and the flapwise root moment deviation is below 2%. Overall, the comparative results under steady wind condition indicate a strong match between the refer data and the present model.
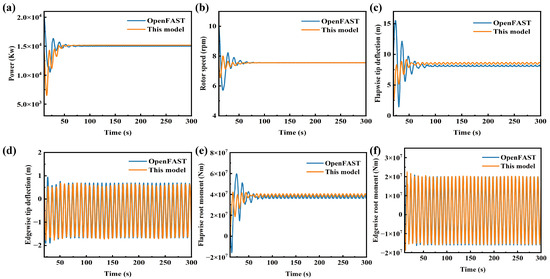
Figure 9.
Assessment of key dynamic responses under steady wind conditions: (a) power, (b) rotor speed, (c) flapwise tip deflection, (d) edgewise tip deflection, (e) flapwise root moment, (f) edgewise root moment.
Wind turbines are also subject to extreme wind conditions during actual operation. In accordance with the IEC-61400 standard, extreme turbulence model and extreme gust conditions were selected for comparative validation with OpenFAST. All validations were performed under rated wind speed, rated rotor speed and zero pitch angle operating conditions, with the control system decoupled. Under these settings, deformation and load responses of the rotor are only influenced by the incoming wind, allowing for pure model-to-model verification. A comparison of wind turbine deformation and load responses under extreme gust conditions is presented in Figure 10. Due to the absence of influence from the control system, the deformation and load of the blade present a symmetrical phenomenon. During the stage of wind speed decline, the deformation and load of the blade in the flapwise direction are the smallest. However, its influence on the edgewise direction is relatively small. When the wind speed reaches the maximum value, there will be significant changes in the deformation and load of the edgewise direction. The results indicate that the computational outcomes of the model developed in this study are slightly lower than those obtained from OpenFAST. Due to theoretical discrepancies, deviations are observed in the calculated blade twist angles, which subsequently affect the angle of attack and lead to differences in the computed aerodynamic loads on the blades. These discrepancies ultimately contribute to variations in the predicted displacements and loads. Following the abrupt change in wind speed, the maximum deviation in flapwise displacement is 0.52 m, while the maximum deviation in loads remains within 5%. Figure 11 provides a further comparison of the wind turbine’s dynamic response under extreme turbulence conditions. Under these conditions, the deviations in blade deformation and loads are reduced, with the maximum deviation in the mean flapwise displacement not exceeding 3%, indicating good agreement between the results. In extreme turbulence conditions, inertial forces dominate the structural loads, whereas the strong transient and high-disturbance characteristics of extreme coherent gust conditions tend to amplify methodological discrepancies. BEMT is based on the quasi-steady assumption and cannot capture the realistic, dynamic airflow processes, while its calculations for transient responses rely on corrections from empirical models. Therefore, it tends to amplify the load impact under abrupt changes in wind speed. And the differences in beam theory methods lead to deviations in the calculation of torsion angles, thus there are differences in the calculation results of the aeroelastic response of wind turbines. CRMT can precisely capture the nonlinear response of long blades. However, due to the use of approximate substitution in local deformation, its accuracy under complex conditions is slightly lower than that of the GEBT, which is strictly accurate in kinematic description. Overall, the model demonstrates good agreement with OpenFAST in predicting both deformation and load responses.
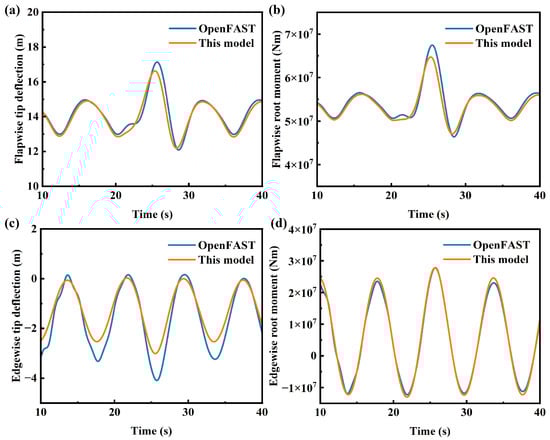
Figure 10.
Comparison of dynamic responses of wind turbine under extreme gust wind condition: (a) flapwise tip deflection, (b) edgewise tip deflection, (c) flapwise root moment, (d) edgewise root moment.
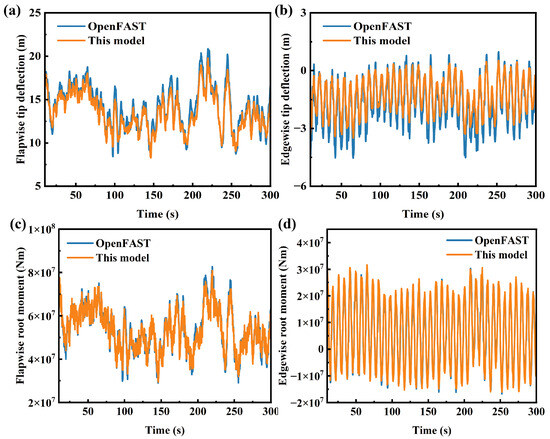
Figure 11.
Evaluation of key dynamic parameters under extreme gust conditions: (a) flapwise tip deflection, (b) edgewise tip deflection, (c) flapwise root moment, (d) edgewise root moment.
4. Results and Discussion
This section aims to analyze the influence of blade spanwise stiffness distribution on the aeroelastic response characteristics of the wind turbine system. By introducing a deviation factor, the impact of stiffness variations at different spanwise positions on system performance is quantitatively assessed, thereby enabling optimized stiffness distribution design to reduce structural costs while meeting safety requirements. Different simulation step sizes were compared, and the results are shown in Figure 12. It can be seen that when the simulation step size reaches 0.05 s, the results are highly consistent. A too small calculation step size will greatly increase the computational load. Therefore, the calculation step size is selected as 0.05 s. To eliminate interference from wind speed fluctuations, a steady wind condition of 13 m/s is adopted for numerical simulations. For result analysis, stable operational data after 100 s are selected for processing to effectively avoid transient effects of the system. The same active proportional integral control strategy is maintained across all cases to ensure comparability of the results. Subsequently, the influence of torsional stiffness distribution was mainly studied. To obtain a more reliable conclusion, a turbulent wind of 13 m/s was selected for simulation, with a turbulence degree of 18.892%.
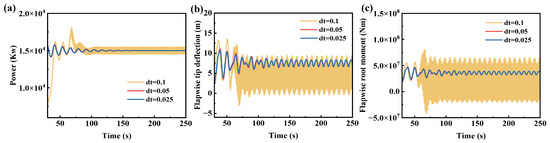
Figure 12.
Comparison of aeroelastic response of wind turbines under different simulation step sizes: (a) power, (b) flapwise tip deflection, (c) flapwise root moment.
4.1. Simulation Settings
The section stiffness matrix plays a crucial role in the dynamic response analysis of blades. The section stiffness matrix is divided into the main diagonal stiffness and the coupling term stiffness. This work mainly studies the sensitive terms in the main diagonal stiffness. The main diagonal stiffness term includes the flap bending stiffness, blade edge bending stiffness and torsional stiffness, which directly affect the force-induced deformation behavior of the blade and have a greater impact on the critical response of the wind turbine. Therefore, this work focuses on the above-mentioned stiffness terms and explores their influence on the aerodynamic response of the blade at different extension positions.
Through parametric research, the influence of stiffness distribution on the aeroelastic response of blades was systematically evaluated. This work mainly studies the influence of different stiffness distributions on the dynamic response of wind turbine blades, and thus the single-variable method is adopted. The coefficient governing stiffness variation is set as a fixed value, and the study is conducted by varying the stiffness at different spanwise locations. To amplify the impact of the stiffness variation, the stiffness term under study is set to of the reference value, while other system parameters remain unchanged. This guaranteed that the observed changes resulted only from the altered stiffness distribution. Reducing the stiffness term to a reference of 0.1 is not intended to simulate any specific manufacturing defects, material degradation, or actual design, but rather serves as a tool for parameter sensitivity research to deeply understand the influence mechanism and trend of this stiffness parameter on the overall behavior of the system. Through extreme adjustments, the dominant influence of the stiffness distribution on the key responses can be clearly revealed. The following equation defines this adjustment:
where i denotes the position of the stiffness term, while and represent the stiffness term for the baseline model and the simulation model, respectively. The subscript i indicates the position of the coefficient in the stiffness matrix. Positions 4, 5, and 6 in the sectional stiffness matrix correspond to the edgewise bending stiffness, flapwise bending stiffness, and torsional stiffness, respectively. To study the influence of stiffness variation along blade extension length on the dynamic characteristics of wind turbines, the blades were divided into 10 cross-sections along the extension direction, and the stiffness of different cross-sections was scaled according to Equation (19). This sectional division defines the locations for stiffness variation and is independent of the blade discretization in the nonlinear beam model. The choice of 10 segments represents a trade-off between computational quantities and result resolution. The cross-sectional position range is taken as 0.3 R–0.9 R (where R is the blade length). This range is crucial for the aerodynamic performance, structural load and cost-effectiveness of wind turbine blades and is the focus of research.
4.2. The Effect of Stiffness at Different Span Positions on Dynamic Response
To better visualize the impact of stiffness distribution on turbine performance, three blade spanwise locations with significant impact were selected for time-domain results comparison with the reference model, based on the computational results. However, the influence of different stiffness terms on the dynamic response varies considerably at the same position. Therefore, for different stiffness terms, different positions of the blade are selected and compared with the reference model. In subsequent representations, ED stands for extreme deviation and MD stands for mean deviation. ED and MD are statistically analyzed based on data from 100 s later. The deviation is calculated as follows:
where is the reference value and is the calculated result.
The blade pitch angle critically determines the aerodynamic performance and dynamic response of wind turbines, including key indicators like power output. As show in Figure 13, flapwise bending stiffness has a minor effect on the mean pitch angle but markedly increases pitch angle fluctuations at the 0.5 R section, which in turn moderately impacts power output. In contrast, edgewise bending stiffness shows limited influence on the mean pitch angle yet helps reduce pitch angle fluctuations. Among all stiffness parameters, torsional stiffness exhibits the most pronounced effect on pitch angle. A reduction in torsional stiffness at 0.5 R leads to the pitch angle approaching zero, resulting in a larger angle of attack and consequently degraded aerodynamic performance of the blade. Therefore, in lightweight blade design, it is essential to maintain adequate torsional stiffness and flapwise bending stiffness around the 0.5 R region, while appropriately reducing edgewise bending stiffness can contribute to improved aerodynamic efficiency.
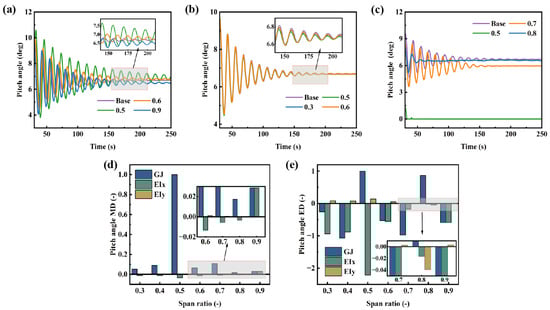
Figure 13.
Pitch angle under different stiffness distributions: (a) flapwise bending stiffness, (b) edgewise bending stiffness, (c) torsional stiffness, (d) deviation of the mean pitch angle, (e) deviation of the extreme pitch angle.
The effect of various stiffness terms along spanwise of the blade on output power is shown in Figure 14. The impact of flapwise bending stiffness and torsional stiffness on power aligns with their effects on pitch angle variation. However, at the 0.5 R, a reduction in torsional stiffness decreases the mean pitch angle and also causes a notable drop in mean power. This indicates that the variation of torsional stiffness has a significant impact on the setting of the control strategy. Reducing torsional stiffness increases the wind speed corresponding to the rated power. When adjusting the torsional stiffness, the control strategy needs to be adjusted accordingly to ensure the normal operation of the wind turbine. Decreasing the edgewise bending stiffness in the mid-span section of the blade reduces the extreme value of the power response, with the most pronounced effect observed at the 0.5 R. Except for the torsional stiffness at the 0.5 R, variations in the other two stiffness components have a negligible impact on the mean power, with mean deviations on the order of . Reducing the torsional stiffness at 0.5 R will lead to a 6.9% decrease in the average output power and a significant increase in the frequency of power fluctuations, thereby seriously compromising the economic efficiency of the wind farm. However, they significantly affect the extreme value of power. The flapwise bending stiffness results in a maximum power extreme value deviation of −2.43, significantly increasing power fluctuations and leading to unstable power output. In severe cases, this can compromise grid security and power quality across the entire wind farm. Therefore, from the perspective of wind turbine aerodynamic performance, during lightweight blade design, attention should be paid to variations in torsional stiffness from the mid-span to the blade tip, with particular focus on stiffness changes at the 0.5 R. Furthermore, appropriately reducing the edgewise bending stiffness in the mid-span section can enhance the aerodynamic performance of the wind turbine.
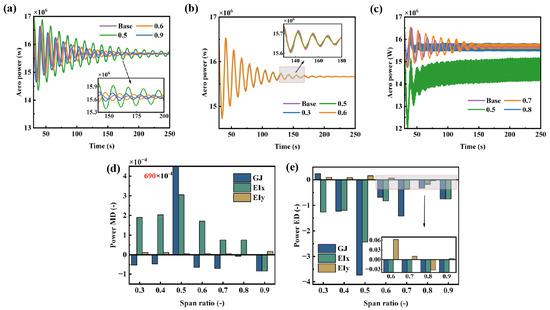
Figure 14.
Power under different stiffness distributions: (a) flapwise bending stiffness, (b) edgewise bending stiffness, (c) torsional stiffness, (d) deviation of the mean power, (e) deviation of the extreme power.
In the aeroelastic analysis of wind turbine blades, the tip twist angle is a critical parameter. It directly characterizes the final result of the torsional deformation of the entire blade structure under complex loading conditions. Figure 15 illustrates the influence of varying stiffness along the blade span on the tip twist angle. The edgewise bending stiffness shows a negligible influence on the mean twist angle. However, its reduction leads to a decrease in the extreme values of the twist angle, with a maximum deviation of 0.23 observed at the 0.6 R position. In contrast, the effect of flapwise bending stiffness is significant. Reducing the flapwise bending stiffness generally decreases the tip twist angle, except at the blade tip where the opposite occurs, and the effect is more pronounced. Blade bend-twist coupling non-uniformly alters the angle of attack in different regions through a dynamic aeroelastic feedback process. Reducing the flapwise bending stiffness increases blade flapwise deformation, while the specific layup design of composite structures induces additional torsional deformation, thereby directly changing the geometric angle between the airfoil chord line and the local inflow. In the blade root region, the airfoil pitching effect under large deformation dominates the change in angle of attack, significantly impacting fatigue loads. In the mid-span region, the bend-twist coupling effect is most pronounced, and the dynamic adjustment of the angle of attack is key to triggering aeroelastic instability. In the blade tip region, the relatively low torsional stiffness makes the aeroelastic torsion more sensitive. When the angle of attack undergoes rapid changes, it is prone to induce negative effects from aeroelastic coupling, thereby amplifying variations in the blade tip twist angle. Therefore, bend-twist coupling essentially establishes a real-time, closed-loop interaction chain of “structural deformation angle of attack adjustment aerodynamic force redistribution” across different blade regions, profoundly influencing the overall dynamic response and stability of the turbine. Bend-twist coupling modifies the angle of attack through the interaction between blade bending and torsional deformation, varying across different regions. In key sensitive regions such as 0.5 R and 0.8 R, a reduction in torsional stiffness triggers significant torsional vibrations, directly altering the local twist angle and thus substantially affecting the angle of attack. Particularly in the 0.8 R region, which serves as the core for aerodynamic force generation, bend-twist coupling reduces the frequency of critical modes, induces large-amplitude oscillations on the primary lifting surface, and excites strong negative aerodynamic damping. This leads to severe fluctuations in the angle of attack and exacerbates aerodynamic instability. In the blade tip region (0.9 R), torsional deformation induced by bend-twist coupling promotes changes in the angle of attack. However, due to the susceptibility of this region to flow separation, reduced local stiffness advances separation, weakening the sensitivity of aerodynamic forces to changes in the angle of attack. This results in a negative bend-twist coupling phenomenon, where the blade actively twists toward a reduced twist angle to alleviate loads. Therefore, bend-twist coupling significantly alters the distribution and dynamic characteristics of the angle of attack across various regions through complex interactions between structural deformation and aerodynamic responses.
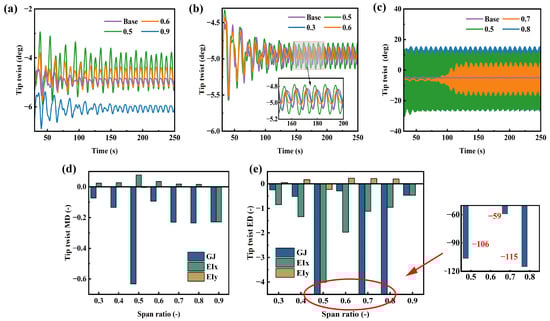
Figure 15.
Tip twist under different stiffness distributions: (a) flapwise bending stiffness, (b) edgewise bending stiffness, (c) torsional stiffness, (d) deviation of the mean tip twist, (e) deviation of the extreme tip twist.
Reducing the flapwise bending stiffness significantly increases the extreme values of the twist angle, with the most substantial impact observed at the 0.5 R, where the deviation in the extreme value is −4.02. However, the torsional stiffness has a more notable effect on the extreme values of the twist angle. At the 0.8 R, reducing the torsional stiffness leads to a deviation in the extreme value as high as −115. The variation in torsional stiffness directly affects the tip torsion angle response. Since the mid-span to tip region is the core area for aerodynamic force generation, reducing torsional stiffness induces significant torsional deformation. The tip twist angle of the blade changes from approximately stable to significant vibration, resulting in a huge deviation in the extreme value of the twist angle. Torsional stiffness changes most critically influence the blade at 0.5 R and 0.8 R, triggering immediate large-amplitude torsional oscillations, unlike the energy accumulation phase at 0.7 R. These are key sensitivity regions. There is a huge difference in torsional stiffness variation between 0.8 R and 0.9 R, and this is because the contribution of the 0.9 R region to the overall mode is relatively small, and the effect of stiffness variation is localized. The blade tip region is prone to flow separation, and a reduction in local torsional stiffness leads to earlier flow separation, weakening the sensitivity of aerodynamic forces to changes in the angle of attack. This results in a negative bending-torsion coupling phenomenon, where the blade tip actively reduces loads through structural deformation. When the blade experiences flapping displacement, this phenomenon causes the blade tip region to twist toward a reduced twist angle. In contrast, the 0.8 R region is where the strain energy of the first-order torsion and bending-torsion coupling modes is highest, and it is also a critical area for generating aerodynamic forces. Reducing the stiffness in this region significantly lowers the frequency of key modes and induces substantial oscillations on the primary lifting surface, thereby exciting strong negative aerodynamic damping. This leads to a sharp increase in amplitude instability and a rise in oscillation frequency.
After reducing the edgewise bending stiffness, the extreme values of blade tip torsion decrease at the 0.5 R and 0.7 R positions but increase at the 0.6 R position. This is primarily due to the combined effects of edgewise bending-torsion coupling and changes in the modal shape. The reduction in edgewise bending stiffness alters the overall dynamic characteristics of the blade, particularly affecting the shape and frequency of the edgewise modes. Near the 0.5 R and 0.7 R positions, the decreased stiffness weakens the coupling effect of edgewise deformation on torsion in these areas, thereby reducing the torsional excitation transmitted to the blade tip. However, near the 0.6 R position, which likely lies within a deformation-sensitive region of a specific edgewise mode, the change in stiffness induces significant local modal reshaping. This enhances the coupling transmission from bending deformation to torsion, resulting in an increased contribution of this location to blade tip torsion. Overall, appropriately reducing the edgewise bending stiffness, except at the 0.6 R position, not only reduces the amplitude of blade tip torsion but also lowers manufacturing costs. The tip torsion angle results from aeroelastic blade deformation. By coupling with the pitch angle, it modifies the effective angle of attack. During normal operation of the wind turbine, the pitch angle is adjusted through an active proportional integral control strategy to ensure that the wind turbine maintains its rated output power. The adjustment of torsional stiffness significantly influences the pitch angle through blade torsion, which also affects the configuration of the control strategy. Therefore, blade design must adequately account for the influence of torsional deformation, with particular attention paid to the stiffness design in sensitive regions to avoid aeroelastic dynamics instability or increased loads.
In recent years, the large-scale and lightweight design of wind turbine blades has become an inevitable trend for enhancing the efficiency of wind energy capture and reducing costs. However, this trend poses significant challenges to the structural dynamic behavior of blades. As the blade length increases and the material decreases, its structural flexibility significantly increases, leading to intensified various deformations under aerodynamic loads. Tip displacement is a concentrated manifestation of the deformation response of a blade under load and is a key parameter for evaluating the dynamic response of the overall blade structure. Figure 16 illustrates the influence of stiffness variations at different spanwise positions on the blade tip flapwise displacement. A reduction in torsional stiffness leads to a significant amplification of the extreme tip deflection on flapwise, which aligns with its observed effect on the tip twist angle. Obviously, the sensitive area of the tip twist is also applicable to the tip flapwise displacement. The intense twist oscillation leads to a significant increase in the oscillation displacement vibration frequency, which will cause severe fatigue damage to the blades. While the mean displacement increases at the 0.5 R, it decreases at radial positions of 0.7 R and 0.9 R. This demonstrates a strongly nonlinear relationship between the spanwise distribution of torsional stiffness and the dynamic response of the wind turbine. Reducing torsional stiffness at these specific locations can induce negative bend-twist coupling, which mitigates aerodynamic loads by increasing elastic twist. The influence of edgewise bending stiffness on the tip flapwise displacement is negligible. In contrast, the effect of flapwise bending stiffness is more prominent. Reducing flapwise bending stiffness significantly increases the mean flapwise displacement, with a maximum mean deviation of −0.538. This indicates a 53.8% increase in the mean tip deflection, which significantly raises potential risks to structural safety. Unlike at other positions, the mean deviation in flapwise displacement at the 0.9 R is positive. This can be explained by the inherent bend-twist coupling behavior at this region, which amplifies the tip torsional deformation and consequently compensates the pitch angle variation resulting from the stiffness change. Flapwise bending stiffness and torsional stiffness significantly modulate the blade’s displacement response through bend-twist coupling effects, while edgewise bending stiffness, due to its orthogonal action relative to the flapwise plane, primarily influences the system’s torsional deformation and in-plane dynamic characteristics through edgewise-twist coupling, with minimal cross-coupling effects on flapwise displacement.
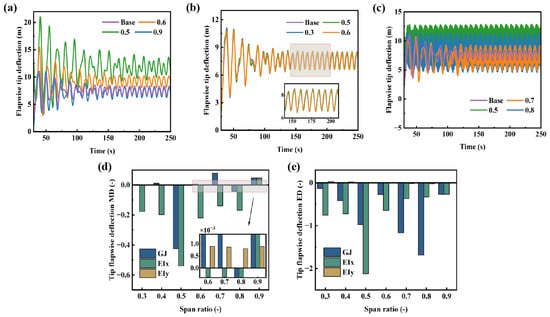
Figure 16.
Flapwise tip deflection under different stiffness distributions: (a) flapwise bending stiffness, (b) edgewise bending stiffness, (c) torsional stiffness, (d) deviation of the mean flapwise tip deflection, (e) deviation of the extreme flapwise tip deflection.
The elastic deformation of wind turbine blades reshapes the load environment of the blades. Lightweight design, while pursuing weight reduction, may also lower the rigidity of the blades, which imposes increasingly strict requirements on the loads that the blades bear. At present, relevant research mainly focuses on the load at the root of wind turbine blades. Therefore, this section concentrates on the root moment of wind turbine blades. The analysis of moments is typically related to blade fatigue analysis. The fatigue life of a blade is determined by the complete characteristics of the dynamic load spectrum, including the mean value, amplitude, cycle count, and stress concentration. As shown in Figure 17, reducing the torsional stiffness at the blade mid-span significantly increases both the mean and extreme values of the root bending moment. This means that the baseline stress level and the stress amplitude of the fatigue load cycles are substantially elevated, leading to an exponential increase in cumulative fatigue damage. Furthermore, the increased oscillation frequency significantly raises the number of stress amplitude cycles, accelerating the initiation and propagation of micro-cracks. This seriously affects the service life of the blades. The edgewise bending stiffness only has a minor influence on the extreme values of the bending moment. Reducing the flapwise bending stiffness decreases the mean of flapwise root moment. This is because reducing stiffness increases blade flexibility, allowing the blade to alter the angle of attack through geometric deformation, thereby reducing the mean of moment. However, this also leads to a slight increase in the extreme values of root moment. On the premise of ensuring the safe operation of the wind turbine, the flapwise bending stiffness can be appropriately reduced to decrease the flapwise root moment, thereby enhancing blade safety. However, this will lead to increased blade displacement, raising the risk of blade-tower collision. It is crucial to maintain the torsional stiffness in the mid-span region of the blade, as this area significantly influences both blade displacement and loads. Therefore, the design process must find an optimal balance among aerodynamic performance, structural loads, cost, and reliability.
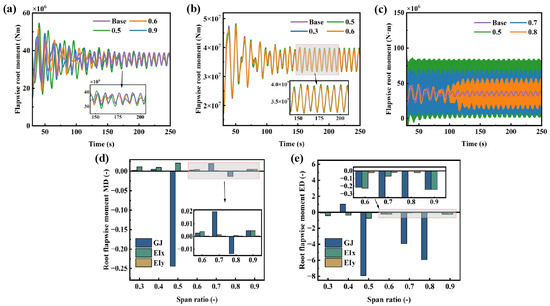
Figure 17.
Flapwise root moment under different stiffness distributions: (a) flapwise bending stiffness, (b) edgewise bending stiffness, (c) torsional stiffness, (d) deviation of the mean flapwise root moment, (e) deviation of the extreme flapwise root moment.
Table 2 and Table 3 describe the mean and extreme value deviations of the influence of different torsional stiffness distributions on the dynamic response of wind turbines, respectively.
Table 2.
Mean deviation of wind turbine dynamic response under different torsional stiffness distributions.
Table 3.
Extreme deviation of wind turbine dynamic response under different torsional stiffness distributions.
Based on the aforementioned analysis, a comprehensive evaluation was conducted by integrating three key performance indicators: power output, tip flapwise displacement, and root flapwise bending moment. With structural safety as the primary constraint, both displacement and load were assigned weights of 0.4, while power output was weighted at 0.2. Figure 18 illustrates the influence of stiffness distribution on the wind turbine’s dynamic response. Both flapwise bending stiffness and torsional stiffness exhibit the most pronounced impact on the mean response at the 0.5 R section. Reducing flapwise bending stiffness in the root and mid-span regions increases the mean response, though its effect on response fluctuations remains relatively limited. In contrast, torsional stiffness significantly affects response fluctuations in the mid-span and tip regions, while its influence is negligible near the root. At the 0.9 R section, flapwise bending stiffness and torsional stiffness demonstrate similar tendencies: both reduce the mean response but amplify response fluctuations. Conversely, adjustments in edgewise bending stiffness have minimal impact on the overall system response, allowing for its appropriate reduction to facilitate lightweight structural design optimization.
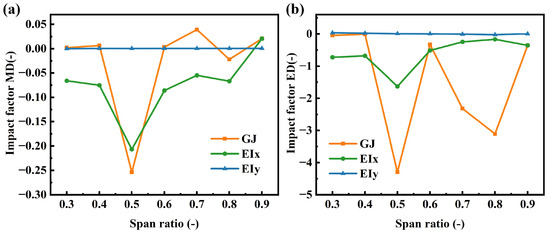
Figure 18.
Impact of different stiffness configurations on wind turbine dynamic response evaluated through weight statistics: (a) mean deviation, (b) extreme deviation.
Based on the aforementioned research, it was found that the distribution of torsional stiffness along the blade has the greatest impact on wind turbine performance. Considering that the actual operating environment of a wind turbine is not under steady-state conditions, a parametric influence study on torsional stiffness was conducted under turbulent conditions to obtain more reliable conclusions. Figure 19 and Figure 20 respectively describe the time-domain results and response deviations of wind turbines under different torsional stiffness distributions. In a turbulent environment, the influence of torsional stiffness distribution on wind turbine performance is similar to that under steady-state conditions: stiffness variations in the mid-span and tip regions significantly affect the dynamic response. Due to the fluctuations in dynamic response caused by turbulent wind, the results for extreme deviations show some differences. Except at the 0.9 R location, reducing torsional stiffness decreases the extreme values of power fluctuations, which is opposite to the conclusion under steady-state conditions. This indicates that under actual operating conditions, reducing torsional stiffness decreases the mean output power but also reduces the fluctuation amplitude of the output power. At this point, the pitch angle is zero, meaning that reducing torsional stiffness delays the correspondence between the wind turbine’s rated power and wind speed. The influence of torsional stiffness on the extreme values of the pitch angle also changes significantly: under all spanwise distributions, reducing torsional stiffness decreases the extreme deviation of the pitch angle, which corresponds to the behavior of the output power. Changes in torsional stiffness at 0.5 R still lead to an increase in both the mean and extreme values of the flapwise root bending moment. To ensure structural safety, the strength of torsional stiffness at this location must be guaranteed during blade optimization design. Unlike the loads, although the mean tip flapwise displacement increases, its fluctuation amplitude decreases significantly, which is important for reducing blade fatigue damage.
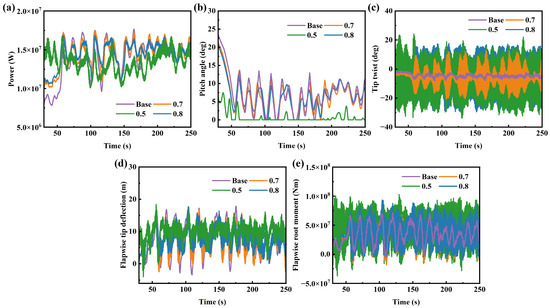
Figure 19.
Dynamic responses of wind turbines under different stiffness distributions: (a) power, (b) pitch angle, (c) tip twist, (d) flapwise tip deflection, (e) flapwise root moment.
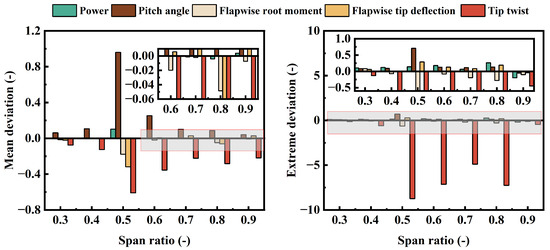
Figure 20.
Deviation of wind turbine response results under different stiffness distributions: (a) power, (b) pitch angle, (c) tip twist, (d) flapwise tip deflection, (e) flapwise root moment.
4.3. Limitations and Future Work
This paper systematically investigates the influence of stiffness distribution on the dynamic response of wind turbines. While it provides important insights for the structural optimization of wind turbine blades, certain limitations remain. Future work will focus on expanding the scope of research, establishing a comprehensive evaluation framework, and systematically addressing the current shortcomings in light of practical engineering needs.
The present study has only examined the influence of the distribution of key stiffness terms along the main diagonal. Subsequent work will concentrate on the impact of the complete blade cross-sectional stiffness distribution on the wind turbine system response. Combined with parametric studies on stiffness variation, this will comprehensively reflect the influence of stiffness on the dynamic response of wind turbines, offering more complete and profound guidance for blade structural optimization.
To simplify calculations, the current work neglects the hydrodynamic effects on the tower base, although this is reasonable for a monopile wind turbine. For such turbines, hydrodynamics do affect the system response through the tower base. Future research will select a floating wind turbine as the study object and consider the coupling effects between the six-degree-of-freedom motion of the floater and the blades.
This study theoretically analyzes the influence of blade stiffness distribution on the dynamic response of wind turbines under different inflow conditions but does not address practical engineering applications. Work is currently underway to obtain the complete cross-sectional stiffness matrix of blades through composite material layup. Integrating theory with practical engineering requirements, the aim is to develop stiffness adjustment strategies that balance structural safety and economic efficiency under various conditions.
5. Conclusions
This study establishes a high-fidelity simulation framework for large-scale wind turbines by coupling multi-body dynamics, free vortex wake theory, and co-rotational beam theory. This framework efficiently captures the geometrically nonlinear large deformations of highly flexible blades under unsteady aerodynamic loads, providing a reliable tool for conducting extensive parametric studies and in-depth sensitivity analyses of stiffness distribution. The model’s accuracy and reliability were validated through comparisons with results from the open-source aeroelastic simulation platform OpenFAST under both normal and extreme operating conditions. Using this model, the study systematically investigates the impact of stiffness distribution on the dynamic response of wind turbines, offers quantitative analysis, and reveals several key findings:
The influence of stiffness exhibits strong nonlinear and coupled characteristics. Different stiffness components (flapwise, edgewise, and torsional) and different stiffness distributions affect the system through distinct mechanisms. Torsional stiffness most severely impacts the fluctuation of the tip torsion angle and, through bend-twist coupling, significantly influences flapwise displacement and bending moment. Flapwise bending stiffness primarily affects the tip flapwise displacement, while the influence of edgewise stiffness is relatively minor. The blade sections at 0.5 R, 0.7 R, and 0.8 R are highly sensitive regions where torsional stiffness notably affects the turbine’s dynamic response. During blade design, reinforcing the torsional stiffness in these sensitive areas can effectively enhance the blade’s aeroelastic stability and reduce fatigue damage.
The blade section at the 0.5 R spanwise location and its torsional stiffness are the most critical factors influencing the system response. The 0.5 R region is the core area for aerodynamic loading, and changes in its torsional stiffness are significantly amplified through a feedback loop of “aerodynamic-elastic torsion” coupling. Reducing the torsional stiffness in the blade’s mid-section severely degrades aerodynamic performance and sharply increases structural loads, posing a serious threat to the operational safety and structural integrity of the wind turbine. Due to the interaction between blade torsion and pitch angle, the torsional stiffness in this region also has an important influence on the setting of control strategies.
The influence patterns of torsional stiffness distribution on the wind turbine’s dynamic response are largely consistent between turbulent and steady-state wind conditions. However, dynamic fluctuations induced by turbulent excitation and the hysteresis of pitch control lead to a reduction in the extreme deviations of power and pitch angle when torsional stiffness is decreased. This confirms the reliability of the conclusions drawn from steady-state simulations in this work. Therefore, structural optimization of the blade must balance changes in stiffness distribution, with particular focus on the strength of high-sensitivity regions and torsional stiffness, to ensure the normal operation of the wind turbine. Within safety limits, appropriately reducing the edgewise bending stiffness can lower the response in loads and displacements.
In summary, the development of offshore wind turbines is advancing rapidly. On one hand, their design must balance economic benefits with structural safety to achieve cost reduction and efficiency gains. On the other hand, ensuring the load-bearing capacity of the blade structure must be treated as the technical core. This study investigates the influence of stiffness adjustments at different spanwise locations on the dynamic response of wind turbines, revealing a complex nonlinear coupling relationship between stiffness distribution and turbine response. The findings provide practical engineering guidance for blade stiffness optimization, contributing to enhanced structural efficiency of blades while ensuring the safe operation of wind turbines. Our future work will focus on gaining deeper insights into the complex aeroelastic behavior of large wind turbine blades. A central goal is to decipher the key mechanisms governing the bidirectional coupling and mutual excitation between the unsteady vortex wake and the flexible blade structure. This research will provide the essential theoretical foundation for the development of next-generation designs for ultra-long, flexible blades.
Author Contributions
B.Z.: Methodology, Writing—original draft, Writing—review and editing; X.Q.: Supervision, Writing—review and editing; B.W.: Methodology, Visualization; Y.H.: Visualization, Data Curation; Z.G.: Conceptualization, Supervision; T.W.: Methodology, Supervision; S.L.: Supervision, Writing—review and editing; Y.L.: Methodology, Supervision. All authors have read and agreed to the published version of the manuscript.
Funding
This research was supported by the International (Regional) Cooperation and Exchange Program of National Natural Science Foundation of China (No. 12561160086), Joint Fund of National Natural Science Foundation of China under Grant (No. U24A20196), National Natural Science Foundation of China (No. 12302301), Shantou University Scientific Research Initiation Grant (No. NTF24029T), China Postdoctoral Science Foundation (No. 2023M742229), and National Key Research and Development Program of China (No. 2023YFB4203100).
Data Availability Statement
The original contributions presented in this study are included in the article. Further inquiries can be directed to the corresponding author.
Conflicts of Interest
The authors declare no conflicts of interest.
Nomenclature
| Roman Symbols | Definition | Units |
| Circulation of vortex filament | /s | |
| c | Chord length | m |
| W | Resultant velocity | m/s |
| r | Distance between point and vortex element | m |
| Vortex core radius | m | |
| Wake age angle | rad | |
| Angular velocity | rad/s | |
| u | Displacement | m |
| Rotation angle | rad | |
| B | Transformation matrix | |
| Local stiffness matrix | ||
| Global stiffness matrix | ||
| GWEC | Global Wind Energy Council | |
| CFD | Computational Fluid Dynamics | |
| CSD | Computational Structural Dynamics | |
| BEMT | Blade Element Momentum Theory | |
| GEBT | Geometrically Exact Beam Theory | |
| CRBM | Co-rotational Beam Method | |
| FVWM | Free Vortex Wake Method |
References
- Hassan, Q.; Viktor, P.; Al-Musawi, T.J.; Ali, B.M.; Algburi, S.; Alzoubi, H.M.; Al-Jiboory, A.K.; Sameen, A.Z.; Salman, H.M.; Jaszczur, M. The renewable energy role in the global energy Transformations. Renew. Energy Focus 2024, 48, 100545. [Google Scholar] [CrossRef]
- Liu, Y.; Li, Y.; He, F.; Wang, H. Comparison study of tidal stream and wave energy technology development between China and some Western Countries. Renew. Sustain. Energy Rev. 2017, 76, 701–716. [Google Scholar] [CrossRef]
- Jung, C.; Sander, L.; Schindler, D. Future global offshore wind energy under climate change and advanced wind turbine technology. Energy Convers. Manag. 2024, 321, 119075. [Google Scholar] [CrossRef]
- Akhtar, N.; Geyer, B.; Schrum, C. Larger wind turbines as a solution to reduce environmental impacts. Sci. Rep. 2024, 14, 6608. [Google Scholar] [CrossRef]
- Global Wind Energy Council. Global Offshore Wind Report 2020; GWEC: Brussels, Belgium, 2020; Volume 19, pp. 10–12. [Google Scholar]
- Donnelly, O.; Carroll, J.; Howland, M. Analysing the cost impact of failure rates for the next generation of offshore wind turbines. Wind Energy 2024, 27, 695–710. [Google Scholar] [CrossRef]
- Wang, Z.; Hu, J.; Wang, Y.; Yang, M.; Zhou, B.; Yuan, Y.; Jin, P.; Chen, Y. Nonlinear aeroelastic performance in 5MW and 15MW wind turbine blades using intrinsic geometrically exact method. Renew. Energy 2025, 256, 124581. [Google Scholar] [CrossRef]
- Ortolani, A.; Persico, G.; Drofelnik, J.; Jackson, A.; Campobasso, M.S. High-fidelity calculation of floating offshore wind turbines under pitching motion. In Turbo Expo: Power for Land, Sea, and Air; American Society of Mechanical Engineers: New York, NY, USA, 2020; Volume 84249, p. V012T42A012. [Google Scholar]
- Shourangiz-Haghighi, A.; Haghnegahdar, M.A.; Wang, L.; Mussetta, M.; Kolios, A.; Lander, M. State of the art in the optimisation of wind turbine performance using CFD. Arch. Comput. Methods Eng. 2020, 27, 413–431. [Google Scholar] [CrossRef]
- Hulbert, G.M. Time finite element methods for structural dynamics. Int. J. Numer. Methods Eng. 1992, 33, 307–331. [Google Scholar] [CrossRef]
- Guo, T.; Lu, Z.; Tang, D.; Wang, T.; Dong, L. A CFD/CSD model for aeroelastic calculations of large-scale wind turbines. Sci. China Technol. Sci. 2013, 56, 205–211. [Google Scholar] [CrossRef]
- Yu, D.O.; Kwon, O.J. Predicting wind turbine blade loads and aeroelastic response using a coupled CFD–CSD method. Renew. Energy 2014, 70, 184–196. [Google Scholar] [CrossRef]
- Sun, Z.; Chen, J.; Shen, W.Z.; Zhu, W.J. Improved blade element momentum theory for wind turbine aerodynamic computations. Renew. Energy 2016, 96, 824–831. [Google Scholar] [CrossRef]
- Wang, L.; Liu, X.; Renevier, N.; Stables, M.; Hall, G.M. Nonlinear aeroelastic modelling for wind turbine blades based on blade element momentum theory and geometrically exact beam theory. Energy 2014, 76, 487–501. [Google Scholar] [CrossRef]
- Frassoldati, G.; Giansante, R.; Bernardini, G.; Gennaretti, M. Unsteady Lifting-Line Free-Wake Aerodynamic Modeling for Morphing Wings. Aerospace 2024, 11, 745. [Google Scholar] [CrossRef]
- Xu, B.; Wang, T.; Yuan, Y.; Zhao, Z.; Liu, H. A simplified free vortex wake model of wind turbines for axial steady conditions. Appl. Sci. 2018, 8, 866. [Google Scholar] [CrossRef]
- Liang, L.; Deng, J. A novel geometric nonlinear analysis method for planar beam structures based on co-rotation and substructure method. J. Phys. Conf. Ser. 2023, 2553, 012030. [Google Scholar] [CrossRef]
- Moon, H.; Cho, H.; Theodossiades, S.; Kim, T. Development of an anisotropic co-rotational beam model including variable cross-section. Mech. Adv. Mater. Struct. 2023, 30, 423–436. [Google Scholar] [CrossRef]
- Abdelghany, E.S.; Sarhan, H.H.; Alahmadi, R.; Farghaly, M.B. Study the effect of winglet height length on the aerodynamic performance of horizontal axis wind turbines using computational investigation. Energies 2023, 16, 5138. [Google Scholar] [CrossRef]
- Farghaly, M.B.; Abdelghany, E. Study the effect of trailing edge flap deflection on horizontal axis wind turbine performance using computational investigation. Int. J. Renew. Energy Res. 2022, 12, 1942–1953. [Google Scholar] [CrossRef]
- Qian, Y.; Sun, Y.; Liu, Z.; Zhang, Y.; Wang, T. Wake recovery dynamics in tandem tidal turbines. Phys. Fluids 2025, 37, 065107. [Google Scholar] [CrossRef]
- Chen, J.; Shen, X.; Li, X.; Ye, Z.; Guo, X. Modeling of Self and Mutual Inductions between Front and Rear Rotors of Coaxial Dual-Rotor Wind Turbines. Renew. Energy 2025, 257, 124694. [Google Scholar] [CrossRef]
- Shaler, K.; Kecskemety, K.M.; McNamara, J.J. Benchmarking of a free vortex wake model for prediction of wake interactions. Renew. Energy 2019, 136, 607–620. [Google Scholar] [CrossRef]
- Lu, M.m.; Ke, S.t.; Wu, H.x.; Gao, M.e.; Tian, W.x.; Wang, H. A novel forecasting method of flutter critical wind speed for the 15 MW wind turbine blade based on aeroelastic wind tunnel test. J. Wind. Eng. Ind. Aerodyn. 2022, 230, 105195. [Google Scholar] [CrossRef]
- Qian, X.; Zhang, B.; Gao, Z.; Wang, T.; Zhang, L.; Li, Y. Flutter limit optimization of offshore wind turbine blades considering different control and structural parameters. Ocean. Eng. 2024, 310, 118558. [Google Scholar] [CrossRef]
- Huang, Y.; Yang, X.; Zhao, W.; Wan, D. Aeroelastic analysis of wind turbine under diverse inflow conditions. Ocean. Eng. 2024, 307, 118235. [Google Scholar] [CrossRef]
- Lee, K.; Huque, Z.; Kommalapati, R.; Han, S.E. Fluid-structure interaction analysis of NREL phase VI wind turbine: Aerodynamic force evaluation and structural analysis using FSI analysis. Renew. Energy 2017, 113, 512–531. [Google Scholar] [CrossRef]
- Wang, B.; Li, Y.; Gao, S.; Shen, K.; Zhao, S.; Yao, Y.; Zhou, Z.; Hu, Z.; Zheng, X. Stability analysis of wind turbine blades based on different structural models. J. Mar. Sci. Eng. 2023, 11, 1106. [Google Scholar] [CrossRef]
- Shakya, P.; Sunny, M.R.; Maiti, D.K. Nonlinear flutter analysis of a bend-twist coupled composite wind turbine blade in time domain. Compos. Struct. 2022, 284, 115216. [Google Scholar] [CrossRef]
- Jeong, M.S.; Lee, I.; Yoo, S.J.; Park, K.C. Torsional stiffness effects on the dynamic stability of a horizontal axis wind turbine blade. Energies 2013, 6, 2242–2261. [Google Scholar] [CrossRef]
- Hayat, K.; de Lecea, A.G.M.; Moriones, C.D.; Ha, S.K. Flutter performance of bend–twist coupled large-scale wind turbine blades. J. Sound Vib. 2016, 370, 149–162. [Google Scholar] [CrossRef]
- Wang, F.; Yang, Y.; Zeng, J.; Yang, Y. Research on dynamics of icing wind turbine blade based on geometrically exact beam theory. J. Sound Vib. 2025, 601, 118927. [Google Scholar] [CrossRef]
- Qian, X.; Gao, Z.; He, Y.; Song, L.; Hu, J.; Zhang, L.; Wang, T.; Li, Y. Dynamic response analysis and blade stiffness sensitivity study of large floating offshore wind turbine with coupling effect. Renew. Energy 2025, 255, 123540. [Google Scholar] [CrossRef]
- Gaertner, E.; Rinker, J.; Sethuraman, L.; Zahle, F.; Anderson, B.; Barter, G.E.; Abbas, N.J.; Meng, F.; Bortolotti, P.; Skrzypinski, W.; et al. IEA Wind TCP Task 37: Definition of the IEA 15-Megawatt Offshore Reference Wind Turbine; Technical Report; National Renewable Energy Lab. (NREL): Golden, CO, USA, 2020. [Google Scholar]
- Leishman, J.G.; Bhagwat, M.J.; Bagai, A. Free-vortex filament methods for the analysis of helicopter rotor wakes. J. Aircr. 2002, 39, 759–775. [Google Scholar] [CrossRef]
- Vatistas, G.H. Simple model for turbulent tip vortices. J. Aircr. 2006, 43, 1577–1579. [Google Scholar] [CrossRef]
- Xu, B. Study of Wind Turbine Aerodynamic Characteristics Based on Vortex Wake Methods. Ph.D. Thesis, Nanjing University of Aeronautics and Astronautics, Nanjing, China, 2013. [Google Scholar]
- Bhagwat, M.J.; Leishman, J.G. Correlation of helicopter rotor tip vortex measurements. AIAA J. 2000, 38, 301–308. [Google Scholar] [CrossRef]
- Xu, B.; Wang, T.; Yuan, Y.; Cao, J. Unsteady aerodynamic analysis for offshore floating wind turbines under different wind conditions. Philos. Trans. R. Soc. A Math. Phys. Eng. Sci. 2015, 373, 20140080. [Google Scholar] [CrossRef] [PubMed]
- Moon, H.; Cho, H.; Theodossiades, S.; Kim, T. Development of three-dimensional co-rotational beam model for nonlinear dynamic analysis of highly flexible slender composite blades. Mech. Adv. Mater. Struct. 2023, 30, 1943–1954. [Google Scholar] [CrossRef]
- Pacoste, C.; Eriksson, A. Beam elements in instability problems. Comput. Methods Appl. Mech. Eng. 1997, 144, 163–197. [Google Scholar] [CrossRef]
- Battini, J.M. Co-Rotational Beam Elements in Instability Problems. Ph.D. Thesis, KTH, Stockholm, Sweden, 2002. [Google Scholar]
- Stäblein, A.; Hansen, M.H. Timoshenko beam element with anisotropic cross-sectional properties. In ECCOMAS Congress 2016: VII European Congress on Computational Methods in Applied Sciences and Engineering; National Technical University of Athens: Athens, Greece, 2016. [Google Scholar]
- Hand, M.M.; Simms, D.; Fingersh, L.; Jager, D.; Cotrell, J.; Schreck, S.; Larwood, S. Unsteady Aerodynamics Experiment Phase VI: Wind Tunnel Test Configurations and Available Data Campaigns; Technical report; National Renewable Energy Lab. (NREL): Golden, CO, USA, 2001. [Google Scholar]
- IEC 61400-1; Wind Turbine-Part 1-Design Requirements. International Electrotechnical Commission: Geneva, Switzerland, 2005.


Disclaimer/Publisher’s Note: The statements, opinions and data contained in all publications are solely those of the individual author(s) and contributor(s) and not of MDPI and/or the editor(s). MDPI and/or the editor(s) disclaim responsibility for any injury to people or property resulting from any ideas, methods, instructions or products referred to in the content. |
© 2025 by the authors. Licensee MDPI, Basel, Switzerland. This article is an open access article distributed under the terms and conditions of the Creative Commons Attribution (CC BY) license.