Abstract
This research addresses the challenge of a voltage increase on 0.4 kV power distribution lines with high photovoltaic solar plants penetration. Connecting a large number of photovoltaic solar plants to power distribution lines causes a significant voltage rise, which leads to the automatic shutdown of these plants in emergency mode. This seriously hinders the use of solar energy. PV solar plant inverters use reactive power generation or consumption technology to regulate the voltage level, but it is effective only when the line X/R ratio is sufficient. This publication proposes an innovative and easily implemented method for voltage rise mitigation, based on the connection of additional inductive chokes to the power distribution line. The method will expand and fully implement existing voltage regulation measures in already installed PV solar plant inverters, which other methods do not. A methodology for selecting the additional inductance value is presented. Reactive power control methods are compared, and recommendations for the use of methods are presented. An equation is proposed for calculating the coupling point voltage of a PV solar plant inverter using the Q = f(U) diagram. The effectiveness of this method is based on mathematical calculations, simulation, and experimental verification, using typical Lithuanian power distribution lines configurations.
1. Introduction
Typical old power distribution lines were characterized by a unidirectional flow of energy. Electricity was transmitted from power generation to transmission and distribution lines. Nowadays, the influence of photovoltaic (PV) solar power plants has changed the typical flow directions in power systems [1]. However, excessive distributed generation (DG) can cause previously rare problems, such as a voltage rise in power distribution lines and the overloading of power distribution lines [1].
Therefore, in modern power systems, it is important to assess the possibilities of accepting these DGs without exceeding the operational characteristics.
To resolve this conflict, a fair and transparent solution was needed to clearly decide when to accept or to reject new DG integration requests.
The Lithuanian government supports and encourages the deployment of renewable sources in Lithuania. The construction of both large wind and solar power parks and the installation of small solar power plants with a capacity of up to 10 kW in buildings owned by residents is progressing rapidly. By 2025, 160,000 small solar power plants have already been installed in Lithuania, which has a population of 2.9 million, and their number is expected to increase to 300,000 [2]. The total Lithuanian maximum power consumption load is 2175 MW [3], and the solar power plants load connected to the distribution grid is 2025–2400 MW [4], so part of the small power plants is significant in terms of total load. These power plants are connected to 0.4 kV power distribution lines and causes problems related to DG sources. The most common problems are the overloading of power distribution lines and an increase in voltage in power distribution lines.
The following classical methods are used to increase the capacity of power distribution lines:
- Active power limitation;
- Line and cable reinforcement;
- Transformers with automatic tap changer;
- Energy storage;
- Reactive power control [1].
The literature [1] also recommends a voltage level regulation method using induction generators. The induction generator generates the system load by consuming reactive power and compensates for the voltage rise due to active power generation.
The problem of a network overload is identified and solved by strictly regulating the capacity of transformer substations installed in new power plants, as well as limiting the capacity of DG power plants connected to substations. It is more difficult to solve the problems of network voltage increases, because these problems are usually observed already during the operation of power distribution lines. During peak hours, when the amount of energy generated by solar power plants is the highest, they are automatically disconnected due to overvoltages. This automatic disconnection causes significant losses to consumers and reduces the efficiency of PV solar power plants. Overvoltage problems are solved by increasing the capacity of overhead lines (thickening the wires). Such a solution method is expensive and complicated (in the case of a cable network, especially, it causes many problems). Power distribution line operators solve overvoltage problems by switching transformer taps and, thus, reducing the line voltage. However, when PV solar power plants generate less, the voltage in the lines becomes too low and this causes new problems. To solve this problem, attempts have been made to use automatic transformer tap switching in power distribution lines. However, this method is mature and poses other problems. All of this shows that other innovative methods are needed to reduce voltage surges in power distribution lines. These methods are presented in the studies presented below.
A series of studies addresses the challenge of a voltage increase in low voltage power distribution lines with high PV solar plants penetration. The adaptive reactive power control technique is proposed in [5]’s research. However, this method has a number of shortcomings and limitations. Although the adaptive method allows for improved voltage regulation compared to methods based on voltage regulation and a fixed power factor, it can only be applied to newly manufactured inverters and newly installed PV solar plants. The study, presented in [6], proposes a method of voltage control that hybridizes a voltage-oriented Cooperative Partially Observable Markov Decision Process model-based control scheme with a heuristic loss minimization approach. However, this method is characterized by complexities and complications in practical application. In the study presented in [7], a coordinated local var-voltage control method is proposed, which integrates Automatic Voltage Control primary voltage control and divides the control scheme into feeder and station areas, respectively. However, as in previously presented, this method is characterized by complexities and complications in practical application. In the study presented in [8], an asynergetic optimization operation method based on photovoltaic energy and a flexible interconnection device is proposed. However, like the methods presented before, this method is characterized by difficulties in practical application.
Therefore, an efficient and practically easy-to-implement method is needed to solve voltage increase problems. In high-voltage power lines, series compensation is used to increase the line’s capacity. For this, capacitors are connected in series to the line [9]. In the case when a large number of PV solar plants are connected to the power distribution line, the situation is reversed; it is necessary to increase the reactance by connecting inductance in series. The method of additional inductive chokes is proposed in this publication. For practical application, the effectiveness of this method is studied analytically, by MATLAB simulation and experimentally on a laboratory set.
2. Principles of Voltage Control at the Point of Connection of the PV Solar Power Plant to Power Distribution Lines Using Reactive Power
The reactive power method is already used to regulate the voltage in the power distribution lines to which PV solar power plants are connected. When applying this voltage regulation method, the DC to AC converter of the PV solar power plant changes the angle of the output current, thus changing both the reactive power and the voltage at the point of connection to the power distribution lines. Therefore, it is necessary to study how the change in reactive power changes the voltage depending on the parameters of the power distribution lines.
The system under consideration consists of a PV solar plant inverter connected to power distribution lines (Figure 1). The line is connected to the power network through a substation transformer. The substation transformer maintains the line voltage in automatic mode.
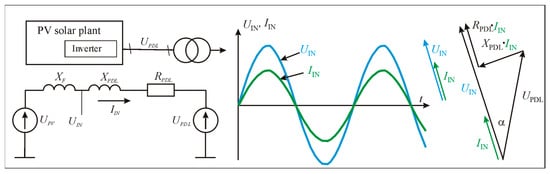
Figure 1.
PV solar plant inverter operation in the case where the current and voltage of power distribution line phases coincide.
If the PV solar plant inverter does not use reactive power regulation, it acts as a current source and delivers current to the system based on the connection point voltage UPDL, so the voltage and current vectors are in phase at the connection point (Figure 1). This results in a voltage vector diagram that is essentially the same as the vector diagram of a synchronous generator operating on power distribution lines.
If there is a need to regulate the reactive power with a PV solar plant inverter, it means operating this inverter as a current source by forming a current vector of the required angle. The internal harmonic filter of the inverter serves as an additional inductance XF. This inductance increases the total equivalent inductance of the network. A reactive current component is obtained, which can be inductive or capacitive.
When the PV solar inverter current vector is rotated clockwise with respect to the voltage of the power distribution lines at inverter connecting point, the current lags the voltage by a negative angle −φ. In this case, the inverter current has an inductive component and the inverter voltage at the point of connection to the power distribution lines increases (Figure 2a).
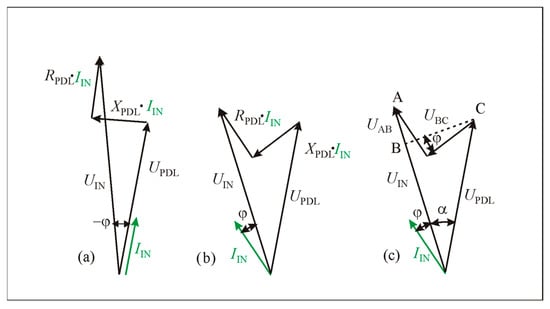
Figure 2.
Voltage at the point of PV solar plant connection to power distribution line regulation by rotating the inverter current vector: (a) inverter voltage increases; (b) inverter voltage decreases; (c) more detail explanation of voltage decreases.
By rotating the PV solar plant inverter current vector counterclockwise by a positive angle φ, a capacitive component appears in the inverter current, and the voltage at the inverter connection point to the power distribution lines decreases (Figure 2b). This result is necessary in order to reduce the voltage at the connection point.
Based on the vector diagram (Figure 2c), it is possible to calculate how the inverter voltage UIN is related to the voltage of the power distribution lines and other parameters. In the vector diagram, after setting aside the additional voltage components UAB and UBC, the PV solar plant inverter voltage is calculated (Figure 2c).
because cosα ≈ 1 for small values of the angle is as follows:
The equation can be given a more conventional form by converting the phase voltages to linear ones, multiplying it by , and then setting cosα to zero. The calculation equation with active and reactive power is obtained:
The equation uses the negative power module QIN generated by the PV solar plant inverter.
The condition when the inverter voltage becomes equal to the power distribution line voltage is expressed by Equation (2) when UAB = 0:
If the power distribution line RPDL is equal to XPDL, then the angle between the PV solar plant inverter voltage and the current φ = 45°. In this case, the reactive power QIN of the PV solar plant inverter must be equal to the active power PIN. In such a situation, the voltage at the point of connection of the PV solar plant inverter to the power distribution lines will be equal to the voltage at the substation and the power transfer from the PV solar plant will take place without any voltage increase.
According to Equation (5), it is obtained that, for effective reactive power compensation, the resistance ratio in power line X/R must be approximately equal to unity. In such a situation, voltage regulation will be maximally effective. Since this ratio is determined by the parameters of the power distribution lines, it is necessary to analyze the situation in the Lithuanian 0.4 kV power network.
3. Inductive and Reactive Impedance Ratios of the Lithuanian 0.4 kV Voltage Network
In order to find out why voltage regulation problems arise in the Lithuanian 0.4 kV distribution network with PV solar plants, it is necessary to investigate the ratio of active and reactive impedances in this network. In Lithuania, 0.4 kV voltage networks, especially in densely populated areas, are mostly cable, while overhead lines are used in rural areas.
A typical 0.4 kV radial network with fairly common parameters is selected for the study. The recommended cable cross-sections according to design regulations should be in the range of 95–240 mm2—a 150 mm2 cable is used quite often. Based on the practice used by the distribution network operator, efforts are made to ensure that the length of cable lines does not exceed 0.5 km due to voltage losses.
Overhead line wires are thinner (on average, 50–70 mm2) and these lines are longer, reaching 1 km in length.
The calculated ratio is XPDL/RPDL = 0.48 for an overhead power distribution line, which is much less than 1. For a cable power distribution line, the ratio is slightly better at XPDL/RPDL = 0.6. If the cross-section of the line wires is smaller, the ratio will be even worse, and the voltage increase situation will improve only with the largest possible cross-section of the power distribution line wires.
4. Calculation of Voltage Losses in Power Distribution Lines When Using Different Reactive Power Regulation Algorithms for PV Solar Plant Inverters
In order to perform voltage loss calculations in power distribution lines with a certain number of PV solar plant inverters, it is necessary to evaluate the dependencies of their reactive power on other parameters that have a direct impact on the calculations. PV solar plant inverters use two types of reactive power generation algorithms:
- Q generation depending on the active power cosφ = f(PIN/PN);
- Q generation depending on the power distribution line voltage QIN = f(UPDL).
In the case of the first method (Figure 3a), the calculations are performed relatively simply: based on the active power PIN generated by the PV solar plant, the corresponding power factor cosφ is calculated from the characteristic. Based on this power factor, QIN is calculated, and then Equation (4) is used.
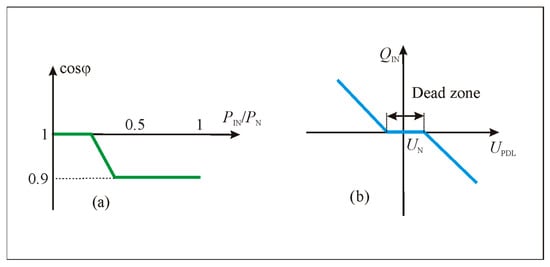
Figure 3.
PV solar plant inverter reactive power regulation characteristics: (a) Method 1 cosφ = f(PIN/PN); and (b) Method 2 QIN = f(UIN).
In the case of the second method (Figure 3b), Equation (4) cannot be used directly. In this case, only the active power PIN is known, while neither the reactive power QIN nor the operating point voltage UIN of the PV solar plant inverter connection point to the power distribution lines is known. However, from the linear part of the diagram presented in Figure 4, the coefficient kQ of the dependence of QIN on UIN can be calculated. Based on this coefficient, the detailed characteristic is constructed.
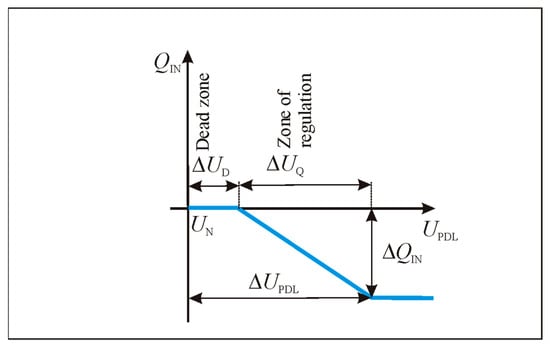
Figure 4.
More detailed regulation characteristics of PV solar plant inverters.
The characteristic presented in Figure 4 has a ΔUD value. When the voltage UIN < UN + ΔUD, reactive power QIN is not generated. The limiting value of UIN is obtained:
Based on (6), the PD value can be calculated from Equation (7):
The calculation is more complicated in the regulation zone, when UIN > UN + ΔUD. This requires another equation. From the linear part of the diagram in Figure 4, the coefficient kQ of the dependence of QIN on UIN can be calculated, and, using this coefficient, the dependence is constructed.
The voltage change across the dead zone is as follows:
By inserting the reactive power Equation (8) into the voltage loss calculation Equation (4), we obtain the following:
The voltage losses are expressed from the equation by moving the terms with ΔUPDL to the left:
This is the final calculation equation—it is valid only when PIN > PD (PD is calculated according to (7)):
One of the possible application cases is obtained when the dead zone is eliminated by introducing ΔUD = 0. This is exactly the case encountered in Lithuanian 0.4 kV power distribution lines (Figure 5). The equation simplifies and is valid for the entire voltage increase range ΔUIN:
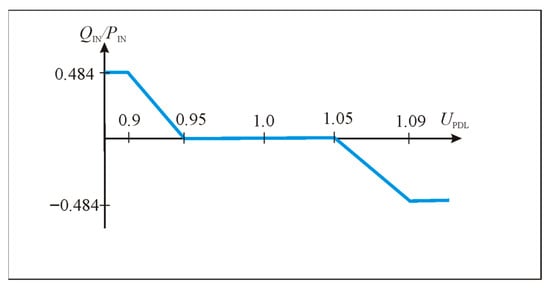
Figure 5.
PV solar plant inverter reactive power–voltage characteristic, recommended by ESO (Lithuanian Energy Distribution Operator) electricity network development strategy [10].
According to this equation, it is possible to calculate the voltage losses—only the inverter’s generated power PIN, the resistances of the power distribution lines, and the coefficient kQ are sufficient.
The value of the coefficient can be found from the dependence of the inverter’s reactive power on the voltage, as shown in Figure 5. If the voltage of the power distribution lines when the PV solar plant inverter is not operating is 0.42 kV, when the inverter increases the voltage, it becomes 0.438 kV. The reactive power becomes −0.484 × PINV. The equation for calculating kQ is obtained by evaluating the nominal power of the PV solar plant inverter PIN:
In order to investigate how the voltage losses of power distribution lines depend on the inverter active power and reactive power control algorithm, the losses of a replacement scheme with one powerful converter connected at the end of the line are investigated. For simplicity, it is assumed that the power distribution lines consist of elements with resistances equal to RPDL = 1 Ω and XPDL = 1 Ω (or XPDL = 0.5 Ω). It is calculated using Equations (6)–(13).
The curve of the first algorithm (Figure 6) shows that, without using reactive power QIN, the voltage at the end of the power distribution line rises to 12% of the nominal, so the permissible loss level in the selected line is exceeded. The curve of the second control algorithm (Figure 6) shows that, by introducing reactive power QIN proportional to active power PIN and setting cosφ = 0.9, the voltage losses drop almost by half to 6%, but the currents and losses in the line should increase significantly. The third option (curve 3 in Figure 6) limits the voltage losses only when they increase by more than 5%, so the currents flow in the line and the power losses are lower. However, it should be noted that such a situation is possible only when the XPDL/RPDL ratio is equal to 1, which was chosen. Changing the XPDL/RPDL ratio to a more realistic 0.5, the situation worsens significantly.
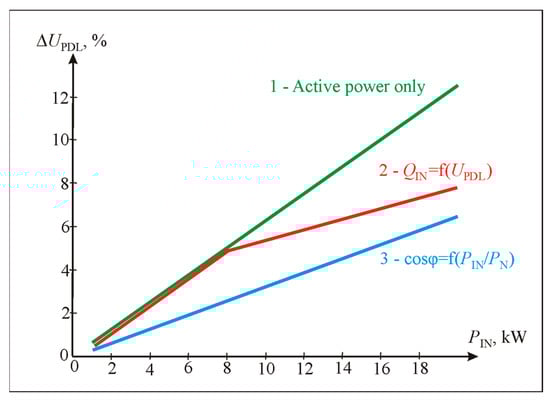
Figure 6.
Dependence of voltage losses on the power of the connected PV solar plant inverter, when power distribution lines RPDL = 1 Ω and XPDL = 1 Ω, using three control algorithms: 1—active power only control, 2—cosφ = f(PIN/PN) control, and 3—Q = f(UPDL) control in case of high line inductance.
When the ratio XPDL/RPDL = 0.5, the compensation of losses is much lower than in the previous case. Curve 1 (Figure 7) is the same as in the previous figure, but curves 2 and 3 show that the losses reach 12% and decrease to 9–10%; i.e., the regulation is relatively small.
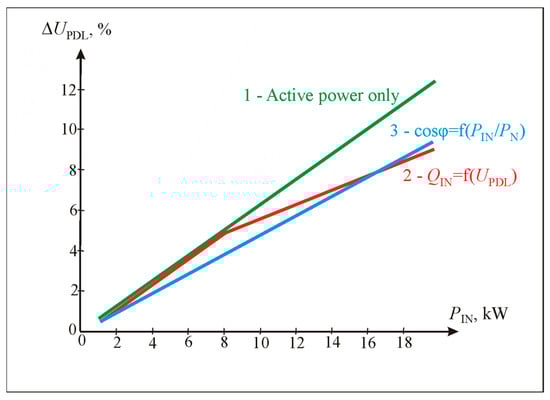
Figure 7.
Dependence of voltage losses on the power of the connected PV solar plant inverter, when power distribution lines RPDL = 1 Ω and XPDL = 0.5 Ω, using three control algorithms: 1—active power only control, 2—cosφ = f(PIN/PN) control, and 3—QIN = f(UPDL) control in case of low line inductance.
In summary, it can be stated that, with a small network inductance (XPDL/RPDL = 0.5), the regulation of reactive power Q by both regulation methods gives similar results, but the voltage experiences a relatively little decrease. With a large network inductance (XPDL/RPDL = 1), obvious differences between the regulation methods are visible; the cosφ control regulation method works much better, and the regulation efficiency obtained is quite high. If voltage increase problems occur in power distribution lines, the cosφ method is used. This shows how great an influence the XPDL of power distribution lines has on voltage losses, and that its artificial increase using additional inductance is expedient.
5. Proposed Power Distribution Line Models with Higher XPDL/RPDL Ratio
If the inductance of real 0.4 kV power distribution lines is too small for effective voltage regulation, the problem of a voltage increase and the influence of the PV solar plant can be solved by connecting an additional inductive choke to the network and, thus, increasing the inductance of the lines. This inductance must be connected in series to the line; the voltage drop in it must be several percent of the nominal voltage at the nominal current.
The real line inductance is evenly distributed in the line as a scattered parameter. The additional choke will not be a scattered line parameter and, therefore, it is necessary to analyze where in the line it is more expedient to connect the choke.
For simplicity, a power distribution line with RPDL >> XPDL is analyzed and an additional inductance XADD is connected to it. The PV solar plant inverter generates so much reactive power that the inverter voltage UIN and the grid voltage UPDL are almost equal. The situation when the inductance is connected at the farthest point of the line to the inverter is shown in Figure 8a. It can be seen that the voltage of the choke on one side of the PV solar plant inverter connection terminals does drop, but, on the other side of the inverter at the end of the line, the voltage remains increased. This can pose a danger to the devices consuming the line energy, so it is necessary to analyze the case when the choke is connected at the beginning of the line right next to the transformer, which is shown in Figure 8b. At the beginning of the line, the voltage behind the inductive choke decreases significantly and this is less dangerous for other devices consuming the line energy than a voltage increase. In addition, a large number of PV solar plant inverters are often connected to the line as a distributed load, so this option is more suitable for solving the named problem.
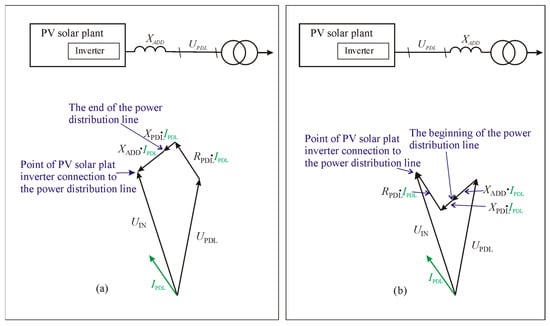
Figure 8.
Power distribution lines with one PV solar plant inverter connected, when the additional inductance choke is turned on (a) at the farthest point of the line, right next to the inverter; and (b) at the beginning of the line, right next to the transformer.
Typically, more than one PV solar plant inverter is connected to the power distribution line, so the power generation can be considered to be distributed. In this case, the inductance choke for the entire line is connected right next to the transformer (Figure 9a).
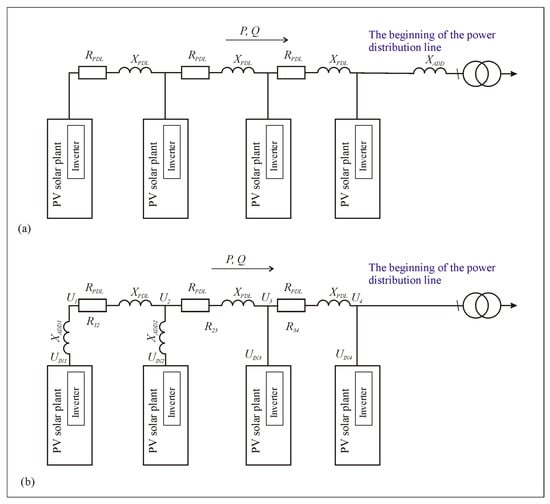
Figure 9.
Power distribution lines with multiple PV solar plant inverters connected as additional inductance chokes include (a) one common choke of higher power at the beginning of the line, right next to the transformer; and (b) smaller-power separate chokes at each inverter at the end of the line for local compensation, at points where voltage increases cause problems.
However, the problem of a voltage increase can also be solved by local compensation, when the additional inductance choke is connected only to the connection points of the most remote PV solar plant inverters. Such a situation is shown in Figure 9b, where the voltage increases above the permissible limits only at the end of the line. In this case, the additional inductance chokes are installed only at the connection points of those PV solar plant inverters where a voltage increase is a relevant problem.
Let us consider the case where the power PIN of the last PV solar plant inverters of the power distribution lines, connected in series with the chokes of the additional inductor, is relatively small compared to the power of the entire electrical network P. Moreover, the resistance between inverters RPDL12 is much smaller than the total resistance of the power distribution lines RPDL, and the additional low-power inductance XADD is much larger than the inductance of the power distribution lines XL. In this case, the approximate voltage value at the connection point of the PV solar plant inverter is as follows:
Thus, we discover that, by adding additional inductance chokes to the circuit, the voltage is reduced at the farthest points of connection of the PV solar plant inverters to the power distribution lines. This prevents emergency disconnections of PV solar plants from power distribution lines due to voltage increases.
The value of the additional inductance is selected according to the power of the converter so that a voltage drop of 5–10% occurs when current flows through it:
6. Simulation of Power Distribution Line Models with Higher XPDL/RPDL Ratio (Additional Inductance Chokes)
In order to study the influence of the additional inductance choke, proposed in Section 5, a distributed generation power distribution line was simulated according to the variants presented in Figure 9. The locations and sizes of the additional inductance choke were changed in the model. According to the Section 3 information and data presented in Table 1, two typical overhead and cable line distribution power networks were simulated.

Table 1.
Parameters of electricity networks that can be considered typical Lithuanian networks.
The MATLAB/Simulink 2024a model was used for the simulation, the structure of which is presented in Figure 10. The model used standard MATLAB/Simulink blocks. The Three-Phase Source and Three-Phase Series RLC Branch blocks were used to simulate the voltage, and ohmic and inductive resistance of the secondary winding of the substation transformer. The Three-Phase Series RLC Branch block was also used to simulate the line section and additional inductance.
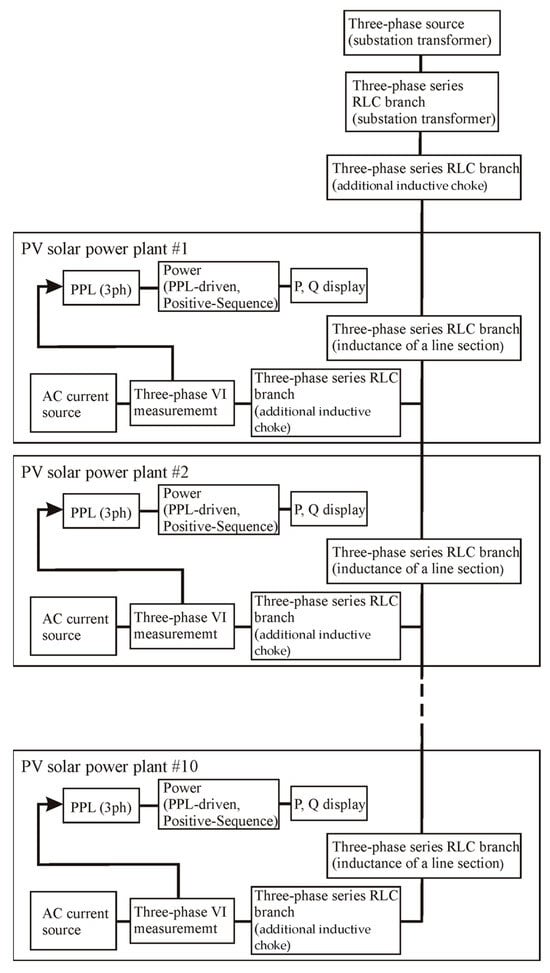
Figure 10.
MATLAB/Simulink model structure.
The standard MATLAB/Simulink blocks were used to simulate the PV solar power plant inverter, which implements an ideal AC current source. The current of these sources was changed depending on the active and reactive power of the PV solar plant. The following blocks were used to calculate these powers based on the current and voltage at the point of connection of the PV solar plant to the power distribution line: Three-Phase V-I Measurement, PLL (3 ph), and Power (PLL-Driven, Positive-Sequence). The Three-Phase V-I Measurement block is used to measure instantaneous three-phase voltages and currents in a circuit. The PLL (3 ph) block models a Phase Lock Loop (PLL) closed-loop control system, which tracks the frequency and phase of a sinusoidal three-phase signal by using an internal frequency oscillator. The control system adjusts the internal oscillator frequency to keep the phases’ difference to 0. The Power (PLL-Driven, Positive-Sequence) block computes the positive-sequence active power P (in watts) and reactive power Q (in vars) of a periodic set of three-phase voltages and currents. To perform this computation, the block first computes the positive sequence of the input voltages and currents with a running window over one cycle of the fundamental frequency.
The first selected model is a 0.5 km long cable. Twenty PV solar plant inverters, each with a power of 10 kW, are connected to it and evenly distributed along the entire length. A total of 200 kW of power is generated. Such power is permissible according to the cable current and transformer power.
The inductance of individual chokes is selected so that the voltage drop in the chokes at the rated current is about 5–10 percent (Equations (14) and (15)). This is related to the permissible voltage drop at the choke switching point. If the PV solar plant inverter power is 10 kVA, its current is 14.4 A, and the inductance of the additional choke is 5 mH, then the voltage drop in the choke is 22.6 V.
The common choke for the power distribution line is selected in a different way. It is selected according to the criterion that the additional inductance would bring the X/R ratio of the lines closer to unity. If the inductance of the tested overhead line is selected to be 1 mH (X = 0.31 Ω), we obtain X/R = (0.31 + 0.25)/0.59 = 0.94. By connecting the additional inductance choke in the middle of the power distribution line, its inductance would be correspondingly lower, that is, 0.5 mH. When simulating the aforementioned power distribution line, it was found that the voltage at the end of the cable line reaches 434 V. This voltage value is permissible according to the voltage level standard. After using reactive power regulation, the voltage decreases to 409 V, which also fully satisfies both the electricity supply operator and the electricity consumer. Therefore, in this case, no additional inductance chokes are required. Therefore, it is necessary to analyze the second case with an overhead line of a longer length and smaller cross-section wire.
The second model chosen is a 1 km overhead line. Ten PV solar plants, each 10 kW, are connected to the power distribution line and placed at equal distances. A total of 100 kW of power is generated. In the model, the PV solar plant inverters are simulated as a current source, and reactive power is obtained by changing the current angle with respect to the voltage of the power distribution line:
- Curve 1 represents the voltage deviation when the angle between the PV solar plant inverter current and the power distribution line voltage is zero degrees and there is no additional inductance in the line;
- Curve 2 represents the voltage deviation when the angle between the PV solar plant inverter current and the power distribution line voltage is 40 degrees and there is no additional inductance in the line;
- Curve 3 represents the voltage deviation when the angle between the PV solar plant inverter current and the power distribution line voltage is 40 degrees and additional inductance L = 0.5 mH is connected in the middle of the line;
- Curve 4 represents the voltage deviation when the angle between the PV solar plant inverter current and the power distribution line voltage is 40 degrees and additional inductances L = 5 mH are connected in series for each inverter.
Figure 11 presents the situation where the deviation exceeds ±40 V or 10 percent. According to curve 1, it can be seen that the voltage deviation level in the line, when the PV solar plant inverters do not generate reactive power, reaches 75 V (well above 40 V), thus significantly exceeding the permissible value of the standard. It should be noted that the line, in this case, is not loaded to the limiting current value. Such a situation is completely unacceptable—reactive power generation is required.
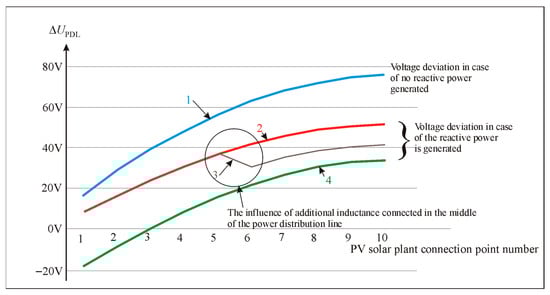
Figure 11.
Voltage deviation in the case:1—voltage without reactive power generation, 2—voltage with reactive power generation, 3—voltage with additional inductance in the middle of line, 4—voltage with additional inductance in the beginning of the line.
Curve 2 shows the situation when PV solar plant inverters regulate reactive power and operate with cos φ = 0.9. This has a positive effect: the voltage deviation at the end of the line increases only to 52 V. But the requirements of the standard are still exceeded. Therefore, additional inductances are required.
Curve 4 shows the situation when PV solar plant inverters regulate reactive power and operate with cos φ = 0.9, and the PV solar plant inverter is connected in series with an additional 5 mH inductance. It can be seen that the voltage deviation at the beginning of the line right next to the transformer is minus 18 volts, and that at the end of the line increases to +32 V. Thus, the voltage deviation remains within the permissible limits of the standard. This shows that the additional inductance in series with the inverters solved the problem. It can also be seen that additional inductances at the beginning of the line are unnecessary, because the voltage obtained is even lower than the nominal.
Curve 3 shows a compromise situation. In this case, the additional inductance is connected in the middle of the line, and not at the beginning and not in series with each PV solar plant inverter. It is clearly visible that, up to the middle of the line, the voltage deviation does not exceed the permissible value. Due to the additional inductance in the middle of the line, the voltage deviation decreases sharply, and then increases again. At the end of the line, the voltage deviation reaches 42 V, so the standard is slightly exceeded. Therefore, this is the case that is proposed for practical use. The additional inductance should be connected to the power distribution line exactly at the point where the voltage deviation reaches the maximum permissible value. This reduces the voltage deviation in the further part of the line. Another advantage also emerges compared to the situation when connecting the inductance at the beginning of the line, or in series with each PV solar plant inverter. When connecting the additional inductance in the middle of the line, less current will flow through it, and the total inductance level is lower.
Practical examples of the application of additional inductances are calculated below.
The example of calculating and selecting the voltage deviation reduction inductance is applied to the power distribution lines shown in Figure 9a. As mentioned earlier, the most suitable case for using additional inductance is shown in Figure 11 curve 3, when an additional L = 0.5 mH inductance is connected in the middle of the line. In practice, such requirements are met by the inductance of the “Schneider” manufacturer, designed to improve the shape of the VFD “Altivar61” input current curve. For practical implementation, two inductances of this manufacturer VW4A4556 (Schneider electric, Pisek, Czeck republic), each with L = 0.3 mH, IN = 100 A, and m = 16 kg, must be connected in series.
The structure shown in Figure 9b and the case shown in Figure 11 curve 2 can be used. In this case, the additional inductance is selected according to the parameters of the PV solar plant inverter. For such a structure, the number of chokes connected is larger, but their inductance is smaller, and a smaller current flows through them. Suppose, at the end of the power distribution line, a 10 kW converter is connected in series with the inverter, and its current is 14.4 A. According to Equation (15), the reactance of the choke must be calculated, in which the voltage drop will be 5%. In this case, X = 0.8 Ω, and L = 2.5 mH, and the simulation was performed with an inductance of 5 mH. According to the current, the choke VW3A4553 of the same manufacturer, (Schneider electric, Pisek, Czeck republic) is selected, with L = 2.0 mH, IN = 16 A, and m = 3.5 kg. The reactance of the choke of this additional inductance for a 50 Hz power network is X = 0.628 Ω. This resistance is insufficient, so two chokes must be connected in series. Using two VW3A4553 chokes, they result in a voltage drop of approximately 8%. This example shows that voltage deviation compensation can be achieved relatively simply, using standard equipment. However, this simulation only shows the static situation in the power distribution lines. In order to verify the dynamic stability of the system, additional research is required. The assessment of dynamic stability is not part of this research.
7. Experimental Study of Voltage Regulation Capabilities of PV-Solar-Plant-Powered Power Distribution Lines with Voltage Rise Mitigation by Additional Inductance Chokes
In order to experimentally investigate the operation of a PV solar plant inverter in a grid with additional inductance, a series of experiments using additional grid inductances was performed. The purpose of such an experimental study was to verify whether this can enhance the reactive power response of the inverter and improve voltage compensation. The experimental verification of the results of Section 6 is quite complicated. This would require sophisticated equipment. A simpler variant—one PV solar power plant—was chosen for experimental verification. Voltage surges and drops in power distribution lines are simulated by reducing and increasing the line voltage with an autotransformer. Such experiments also show the dynamics of the inverter operation when the load or voltage suddenly changes, thus complementing the results of Section 6. The experiment used a 10 kW “Solaredge” inverter with connected photovoltaic cells, a TSGC2-15 type autotransformer (Wenzhou Wosn Electron Technology, Wenzhou, China), a voltage quality analyzer MI 2892 (Metrel, Horjul, Slovenia), and additional inductive chokes. All experimental equipment was connected to the laboratory power distribution lines (Figure 12). It is measured using the regulation function QIN = f(UPDL), when the voltage equal to the nominal reactive power was not generated or consumed. When the voltage was changed by the autotransformer, the voltage change in the power distribution lines was simulated; the regulation function started to work and the reactive power became non-zero.
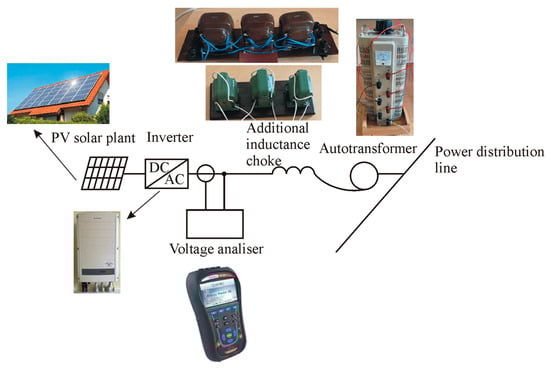
Figure 12.
Experimental set of voltage regulation capabilities.
The parameters of the power distribution lines were measured by the line analyzer MI 3122 and it was determined that the line’s equivalent ohmic resistance RPDL = 0.5 Ω and inductive resistance XPDL = 0.12 Ω. When additional inductance is connected, its parameters are summed with the line parameters.
Four separate experiments were performed under identical conditions, each using different additional inductances:
- -
- Experiment 1: laboratory network without additional inductance (baseline) (XPDL/RPDL = 0.22);
- -
- Experiment 2: additional 1.33 mH inductance used (XADD1 + XPDL/RPDL = 0.6);
- -
- Experiment 3: additional 3.1 mH inductance used (XADD2 + XPDL/RPDL = 1.22);
- -
- Experiment 4: additional 9.42 mH inductance used (XADD3 + XPDL/RPDL = 3.32).
For each experiment, the autotransformer was used to change the voltage (simulating a change in line voltage) from nominal to higher or lower and the response of the PV solar plant inverter was observed. The active power was kept constant throughout the test. This was performed to activate the inverter’s reactive power control functions and to clearly see the inverter’s response. After each transition, the new voltage level was kept constant in order to observe how and when the PV solar plant inverter would start the voltage compensation. Special attention was paid to the time and speed of the reactive power response. The voltage change levels are as follows:
- Voltage reduced from nominal 400 V to 360 V and maintained;
- Voltage increased from nominal 400 V to 430 V and maintained;
The experimental results, presented in Figure 13, show that, when the voltage in the power distribution lines decreases, the voltage at the point of connection of the PV solar plant to the line also decreases at the beginning, but then begins to increase due to the increased reactive power Q. The reactive power Q reaches the same values as the active power P, and, in some cases, even exceeds it. The dependence of the increase in voltage V1–V3 on the additional inductance of the line is clearly visible: if, in experiment (a), the voltage increases by only a couple of volts, then, in experiment (d), the voltage increases so much that it compensates for almost half of the entire initial drop. Thus, the effect of the additional inductance is obvious.
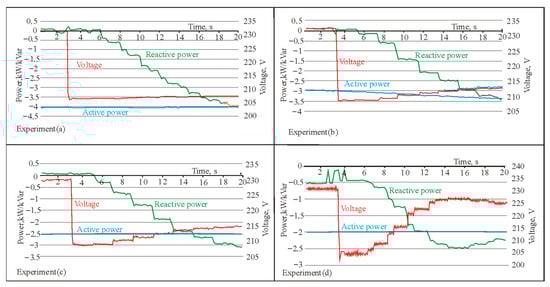
Figure 13.
Experimental verification of the line voltage drop from 400 V to 360 V when the active power of the PV solar plant is constant: (a) test without additional inductance ((XPDL/RPDL) = 0.22); (b) test with 1.33 mH inductance ((XADD1 + XPDL)/RPDL = 0.6); (c) test with 3.1 mH inductance ((XADD2 + XPDL)/RPDL = 1.22); and (d) test with 9.42 mH inductance ((XADD3 + XPDL)/RPDL = 3.32).
A similar situation is obtained when increasing the voltage of the power distribution lines. When the voltage increases, the PV solar plant inverter changes the reactive power while reducing the voltage. The larger the additional inductance is, the more the voltage decreases. When the external inductance is the maximum (Figure 14d), the reactive power and the voltage do not stabilize, and voltage oscillations are visible. When a larger recording interval is selected (up to 60 s), the voltage stabilizes during this time. But to increase the X/R ratio by more than 1 is not necessary, so, in a real situation, instability is unlikely. Thus, the experiment proves that the additional line inductance has a significant influence on the reactive power regulation of the voltage and allows it to maintain the necessary voltage level.
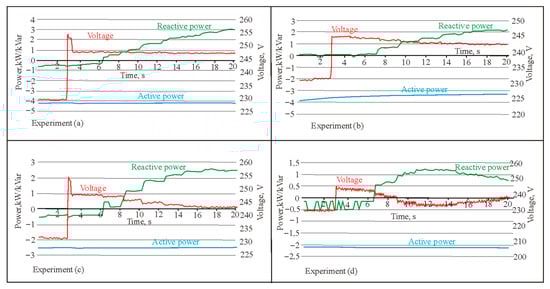
Figure 14.
Experimental verification of the line voltage increase from 400 V to 430 V when the active power of the PV solar plant is constant: (a) test without additional inductance (XPDL/RPDL = 0.22); (b) test with 1.33 mH inductance (X2/RPDL = 0.6); (c) test with 3.1 mH inductance (X3/RPDL = 1.22); and (d) test with 9.42 mH inductance (X4/RPDL = 3.32).
8. Discussion
The results of the study show that long 0.4 kV voltage power distribution lines experience voltage surges caused by low-power household photovoltaic power plants’ inverters. Due to the voltage surge, some inverters are automatically disconnected in emergency mode. PV solar plant power plant inverters have the ability to regulate the voltage by changing the reactive power, but this is not enough due to the inductive and active power distribution line impedance ratio that is too low. For this, it is necessary to connect additional inductance in series to the line to improve this ratio. By doing this, the voltage regulation capabilities increase, PV solar plant inverters can regulate the voltage level, and voltage surges do not pose major problems.
These results also show that the calculation and design of the parameters in power distribution lines must be carried out much more responsibly, necessarily taking into account the possible small distributed generation sources in this network. It is not enough to adhere to the provision that the voltage level, and active and reactive powers will be automatically adjusted by the control algorithms of PV solar plant power plant inverters.
The inductive chokes are manufactured for various purposes with various levels of protection according to the Ingress Protection code. The additional choke that increases the inductance of power distribution lines can be installed not only in the substation room, but also in the middle of the line, on a pole. In this case, a special weatherproof structure is required, ensuring electrical safety, adapted for mounting on a pole. If the voltage rise problem due to the large number of PV solar plants is solved by classical methods, the demand for such inductive chokes is small, and organizing their mass production is unprofitable. If the voltage rise mitigation problem were to be solved by the method proposed in this publication, their mass production could become profitable. However, certification and other issues must be resolved before that.
The proposed method of additional inductance is much simpler and cheaper than the commonly used method of increasing the cross-section of power distribution line wires. However, increasing the cross-section of wires is preparing for another future problem—the connection of electric vehicle charging stations, the number of which will inevitably increase in the power distribution network, which will also require increasing the line capacity.
In higher-power and high-voltage power networks, the inductance increasing method proposed in this publication becomes less necessary. For example, at a voltage of 10 kV and an overhead line wire cross-section of 95 mm2, the X/R ratio of the line is close to 1. Therefore, additional-inductance-increasing chokes are not necessary in this case. A similar situation may exist in a 0.4 kV power distribution line, where a 240 mm2 cable is used. In power distribution lines of a short length, voltage rise mitigation problems are also not relevant.
The inductance-increasing method proposed in this publication can be applied in power networks of various configurations. This is due to the fact that, if a choke connected to the line creates a voltage drop, this voltage drop affects all points of the line located behind the additional choke, regardless of the configuration. Moreover, if necessary, these additional chokes can be used to reduce the voltage individually, in lines connected to specific consumers.
9. Conclusions
The rapid increase in the number of distributed generation sources is causing over-voltage problems in the 0.4 kV power distribution lines. A number of methods are used to mitigate a voltage rise. These are standard methods based on PV active power injection, based on the voltage at common coupling points. An improved method, based on the adaptive reactive power control technique, is also proposed. Despite the fact that this method allows for improved voltage regulation compared to standard methods, it can only be applied to newly manufactured inverters and newly installed PV solar plants.
This publication proposes to artificially increase the X/R ratio of overhead lines to 1, and then the existing reactive power regulators of solar power plants could much more effectively maintain the voltage within the limits set by the standard. It is proposed that we install an additional inductance choke in the middle of the power distribution line. The study showed that, without additional measures, the voltage at the end of the line rises to 472 V (118% UN). Reactive power regulation reduces the voltage to 452 V (113% UN). By connecting a 0.5 mH (≈3%) additional inductance choke in the middle of the line, the voltage at the end of the line drops to 442 V (110% UN), which corresponds to the permissible limits of the standard. After installing the aforementioned additional inductance choke, the X/R ratio of the line increased from 0.48 to 0.69, which was enough to solve the problem of a voltage increase. It is possible to further increase the X/R ratio to 1 or even more, but higher values are not recommended, as, in such a situation, the PV solar plant inverter will operate unstably.
The method proposed in this publication is applicable to relatively long overhead lines (up to 1 km in length). Cable power distribution lines usually have a larger cross-section and shorter length. In these lines, the voltage increase is compensated by the reactive power of the PV solar plant inverter without the additional inductance choke proposed in this publication.
The method of additional inductive chokes allows for mitigating the voltage rise in al-ready installed and operating power distribution lines, leaving PV solar plant inverters controlled by classical methods.
The overvoltage could be avoided by more stringent power restrictions on such sources. However, in order to further increase the use of renewable energy sources, the development of large solar power plants connected to the higher-voltage distribution and transmission network should be encouraged and promoted.
Author Contributions
Conceptualization, G.S.; methodology, G.S.; software, G.P.; validation, G.S. and G.P.; formal analysis, G.S.; investigation, G.P. and G.S.; resources, G.P. and G.S.; writing—original draft preparation, G.P.; writing—review and editing, G.S.; visualization, G.P.; funding acquisition, G.P. All authors have read and agreed to the published version of the manuscript.
Funding
This research was funded by the “Technology and Physics Science Excellence Center” (TiFEC) No. S-A-UEI-23-1, financed by the Research Council of Lithuania. The PV solar plant modules and inverters used in the experimental study were provided by UAB “Energia Futura”.
Data Availability Statement
The original contributions presented in this study are included in the article. Further inquiries can be directed to the corresponding author.
Conflicts of Interest
The authors declare no conflicts of interest.
Abbreviations
The following abbreviations are used in this manuscript:
| DG | Distributed generation |
| PV | Photovoltaic |
| DSOs | Distribution system operators |
| Nomenclature | |
| UIN | PV solar plant inverter voltage at the point of connection to power distribution line |
| UPDL | Voltage of the power distribution line |
| UPDLL | Linear voltage of the power distribution line |
| UINL | PV solar plant inverter linear voltage at the point of connection to power distribution line |
| UN | Rated voltage of system element |
| ΔUD | Deadband voltage of reactive power regulator |
| IIN | Current of the PV solar plant inverter |
| IN | Rated current of system element |
| XPDL | Impedance of the power distribution line |
| RPDL | Resistance of the power distribution line |
| XF | Equivalent impedance of the harmonic filter |
| XADD | Impedance of the additional inductance choke |
| PIN | Inverter’s active power |
| QIN | Inverter’s reactive power |
| PN | Rated power of system element |
| PD | Value of deadband power in Q regulation |
| ΔUPDL | Voltage deviations from the rated voltage of 400 V |
References
- Bollen, M.; Hassan, F.F. Integration of Distributed Generation in the Power System; Wiley-IEEE Press: Piscataway, NJ, USA, 2011; 507p. [Google Scholar]
- ESO (Energy Distribution Operator). Available online: https://www.eso.lt/atsinaujinancios-energetikos-naujienos-gaminanciu-vartotoju-skaicius-toliau-auga-jau-pasieke-beveik-160-tukstanciu/4741 (accessed on 17 November 2025).
- Litgrid National Electricity Demand and Generation. Available online: https://www.litgrid.eu/index.php/power-system/power-system-information/national-electricity-demand-and-generation/3523 (accessed on 17 November 2025).
- Litgrid Generation Capacity. Available online: https://www.litgrid.eu/index.php/power-system/power-system-information/generation-capacity/546 (accessed on 17 November 2025).
- Abo Alwez, M.; Jasni, J.; Wahab, R.; Mohd Radzi, M.A.; Azis, N. Adaptive reactive power control for voltage rise mitigation on distribution network with high photovoltaic penetration. Renew. Sustain. Energy Rev. 2025, 207, 114948. [Google Scholar] [CrossRef]
- Corrêa, H.P.; Vieira, F.H.T. Hybrid cooperative Markov-based method for decentralized voltage control and loss reduction via photovoltaic reactive power support. Electr. Power Syst. Res. 2024, 232, 110398. [Google Scholar] [CrossRef]
- Wang, H.; Chen, Q.; Zhang, L.; Yin, X.; Zhang, Z.; Wei, H.; Chen, X. Research and Engineering Practice of Var-Voltage Control in Primary and Distribution Networks Considering the Reactive Power Regulation Capability of Distributed PV Systems. Energies 2025, 18, 2135. [Google Scholar] [CrossRef]
- Li, Y.; Wang, J.; Zhang, Z.; Xu, W.; Wu, M.; Niu, G. Study of Synergetic Optimization Operation for Distribution Network Considering Multiple Reactive Power Output Modes of Photovoltaics and Different Port Numbers of Flexible Interconnection Devices. Appl. Sci. 2025, 15, 2923. [Google Scholar] [CrossRef]
- Grigsby, L.L. The Electric Power Engineering Handbook; CRC Press: Boca Raton, FL, USA; IEEE Press: Piscataway, NJ, USA, 1998. [Google Scholar]
- ESO. Energy Distribution Operator Technical Requirements for Contractors. Available online: https://www.eso.lt/partneriams/partneriams-rangovams/elektros-darbu-rangovams-ir-tiekejams/techniniai-reikalavimai/4216 (accessed on 15 November 2025).
Disclaimer/Publisher’s Note: The statements, opinions and data contained in all publications are solely those of the individual author(s) and contributor(s) and not of MDPI and/or the editor(s). MDPI and/or the editor(s) disclaim responsibility for any injury to people or property resulting from any ideas, methods, instructions or products referred to in the content. |
© 2025 by the authors. Licensee MDPI, Basel, Switzerland. This article is an open access article distributed under the terms and conditions of the Creative Commons Attribution (CC BY) license.