Article

CFD Analysis of the Influence of Some Intake Port Aerodynamic Modification into in-Cylinder Flow Processes and Flame Propagation in the Combustion Chamber of a Spark Ignition IC Engine


by
Zoran Masoničić
1,*,
Radivoje Pešić
2,
Aleksandar Davinić
2,
Slobodan Savić
2,
Ivan Lazović
1 and
Siniša Dragutinović
1
1
Institute of Nuclear Sciences “Vinča”, University of Belgrade, M. Petrovića Alasa 12-14, 11351 Belgrade, Serbia
2
Faculty of Engineering, University of Kragujevac, Sestre Janjić 6, 34000 Kragujevac, Serbia
*
Author to whom correspondence should be addressed.
Energies 2026, 19(1), 229; https://doi.org/10.3390/en19010229
Submission received: 3 December 2025 / Revised: 25 December 2025 / Accepted: 29 December 2025 / Published: 31 December 2025
(This article belongs to the Section I2: Energy and Combustion Science)

Abstract

It has long been known that inlet port geometry plays a crucial role in regulating in-cylinder flow processes, significantly affecting combustion efficiency and engine emissions. This paper elucidates the effects of an intake port geometry modification, specifically the implementation of a novel moving deflector to intensify tangential intake flow, on fluid flow patterns, combustion stage, and exhaust emissions in a spark-ignited internal combustion engine. The analysis was performed using multi-dimensional numerical modeling of reactive flow, where the numerical domain was extended to the complete intake system to explicitly encompass the modification. The numerical model was validated against experimental data, showing excellent agreement, with differences in peak in-cylinder pressure and peak rate of heat release (RHR) kept below 3% and the moment of peak pressure being nearly identical to the experimental results. During the induction stroke, the effects of implemented modification through intensification of intake jet were clearly legible, pursued by deflection of smaller side vortices in the vicinity of the bottom dead-center. During compression, the attenuation of the effects of the earlier established macro flow was encountered and some negative effects of the increased intake jet were elucidated. During combustion the existence of “flame dominated fluid flow” controlled primarily by turbulence diffusion was encountered. Negative effects on exhaust emissions were elucidated as well. As the combustion process in spark ignition internal combustion engines is primarily controlled by turbulent diffusion, proper identification of influential types of organized flows is a challenging but very important task. The advantages offered by the application of numerical modeling in these situations are clear.

1. Introduction

In-cylinder charge motion is considered one of the most important factors influencing turbulence intensity, combustion rate, and overall engine performance [1]. In general, in-cylinder charge motion is characterized by three common types of organized flow. Two are rotational, while the third is radial. The first type of organized flow, known as swirl motion, is rotational flow with the axis of rotation parallel to the cylinder axis. Experimental evidence [2] suggests that during the compression stroke, swirl motion approaches solid body rotation and can therefore be modeled accordingly. As a result, conservation of angular momentum applies to swirl. During compression, as the volume decreases, the vortex filament reduces its length and, due to the conservation of angular momentum, spins up, promoting rotation on a larger scale. This phenomenon is referred to in the literature as the “spin-up effect” [3].
The second type of organized flow, tumble motion, is also rotational flow with the axis of rotation perpendicular to the cylinder axis. In the case of tumble motion, the situation is less obvious, but it can also be presumed that, like swirl, tumble acts as a rotational solid body with conserved angular momentum. Based on this assumption, well-formed tumble motion during the compression stroke leads to high-intensity, large-scale turbulent motion prior to ignition timing, resulting in a reduction in the flame kernel formation period and faster flame front propagation. Bearing in mind that swirl motion represents higher mean kinetic energy, while tumble motion represents higher turbulence kinetic energy [4], the above imposes the conclusion that a fluid flow pattern accompanied by well-formed, high-intensity tumble motion during the compression stroke is highly desirable.
The third type of coherent motion, squish motion, is radial flow directed towards the center-line of the cylinder. Squish induces new motion located in the axial plane, which is associated with high shear stresses. Consequently, effects on turbulence generation and flame propagation can be observed. In the case of a geometrical configuration with a flat piston crown, squish motion is rarely encountered.
While experimental techniques are often constrained by the high costs of their application and limited in-cylinder accessibility [5], Computational Fluid Dynamics (CFD) provides a detailed, cost-effective alternative for research and industrial optimization. The primary objective of CFD is to obtain satisfying results while minimizing numerical errors, with research-focused applications prioritizing algorithmic accuracy [6]. However, the predictive reliability of CFD remains limited by three factors: the inadequate formulation of complex in-cylinder phenomena such as turbulent diffusivity and chemical reaction rates, the ongoing development of numerical methods for solving large systems of partial differential equations and the constraints of computational resources on spatial and temporal resolution [7]. Despite these necessary simplifications, CFD remains an essential tool for identifying pathways to optimize energy efficiency and reduce emissions.
It is well-established through extensive studies that an in-cylinder fluid flow pattern is characterized by high complexity and a fully three-dimensional structure. It comprises a large number of vortices that differ dimensionally and structurally. Furthermore, the turbulence generated by the intake jet attenuates relatively quickly during the compression stroke, as a result of energy conservation, yielding negative effects on the combustion process. A comprehensive overview of the influence of swirl, tumble, and squish flows on combustion characteristics and emissions is precisely summarized in [2], providing a critical baseline for current engine research. Despite these extensive findings, the potential for enhancing turbulence through discrete aerodynamic deflectors implemented in numerical mesh as new moving object has received limited attention primarily due to the significant computational complexity and mesh-handling challenges they impose. The main objective of this work is to investigate whether an aerodynamic modification of the intake port geometry, achieved through the implementation of a specially designed deflector to intensify tangential intake flow, can enhance in-cylinder turbulent flow and preserve the kinetic energy of the intake jet during compression. Furthermore, the study quantitatively evaluates the impact of this modification on the combustion stage, exhaust emissions, and overall engine characteristics. The results presented also clearly highlight the necessity of properly identifying the influential type or types of coherent flow for a given combustion chamber geometry. The novelty of this research lies in the following three aspects:
  • The application of an experimentally validated 3D CFD model to analyze the effects of a targeted aerodynamic modification;
  • The extension of the numerical domain to the complete intake system, explicitly including valve-port geometry and intake jet turbulence;
  • The implementation of a new moving object (deflector) within the numerical mesh to simulate the effect of a variable intake channel cross-section.

2. Methods

2.1. Experimental Setup

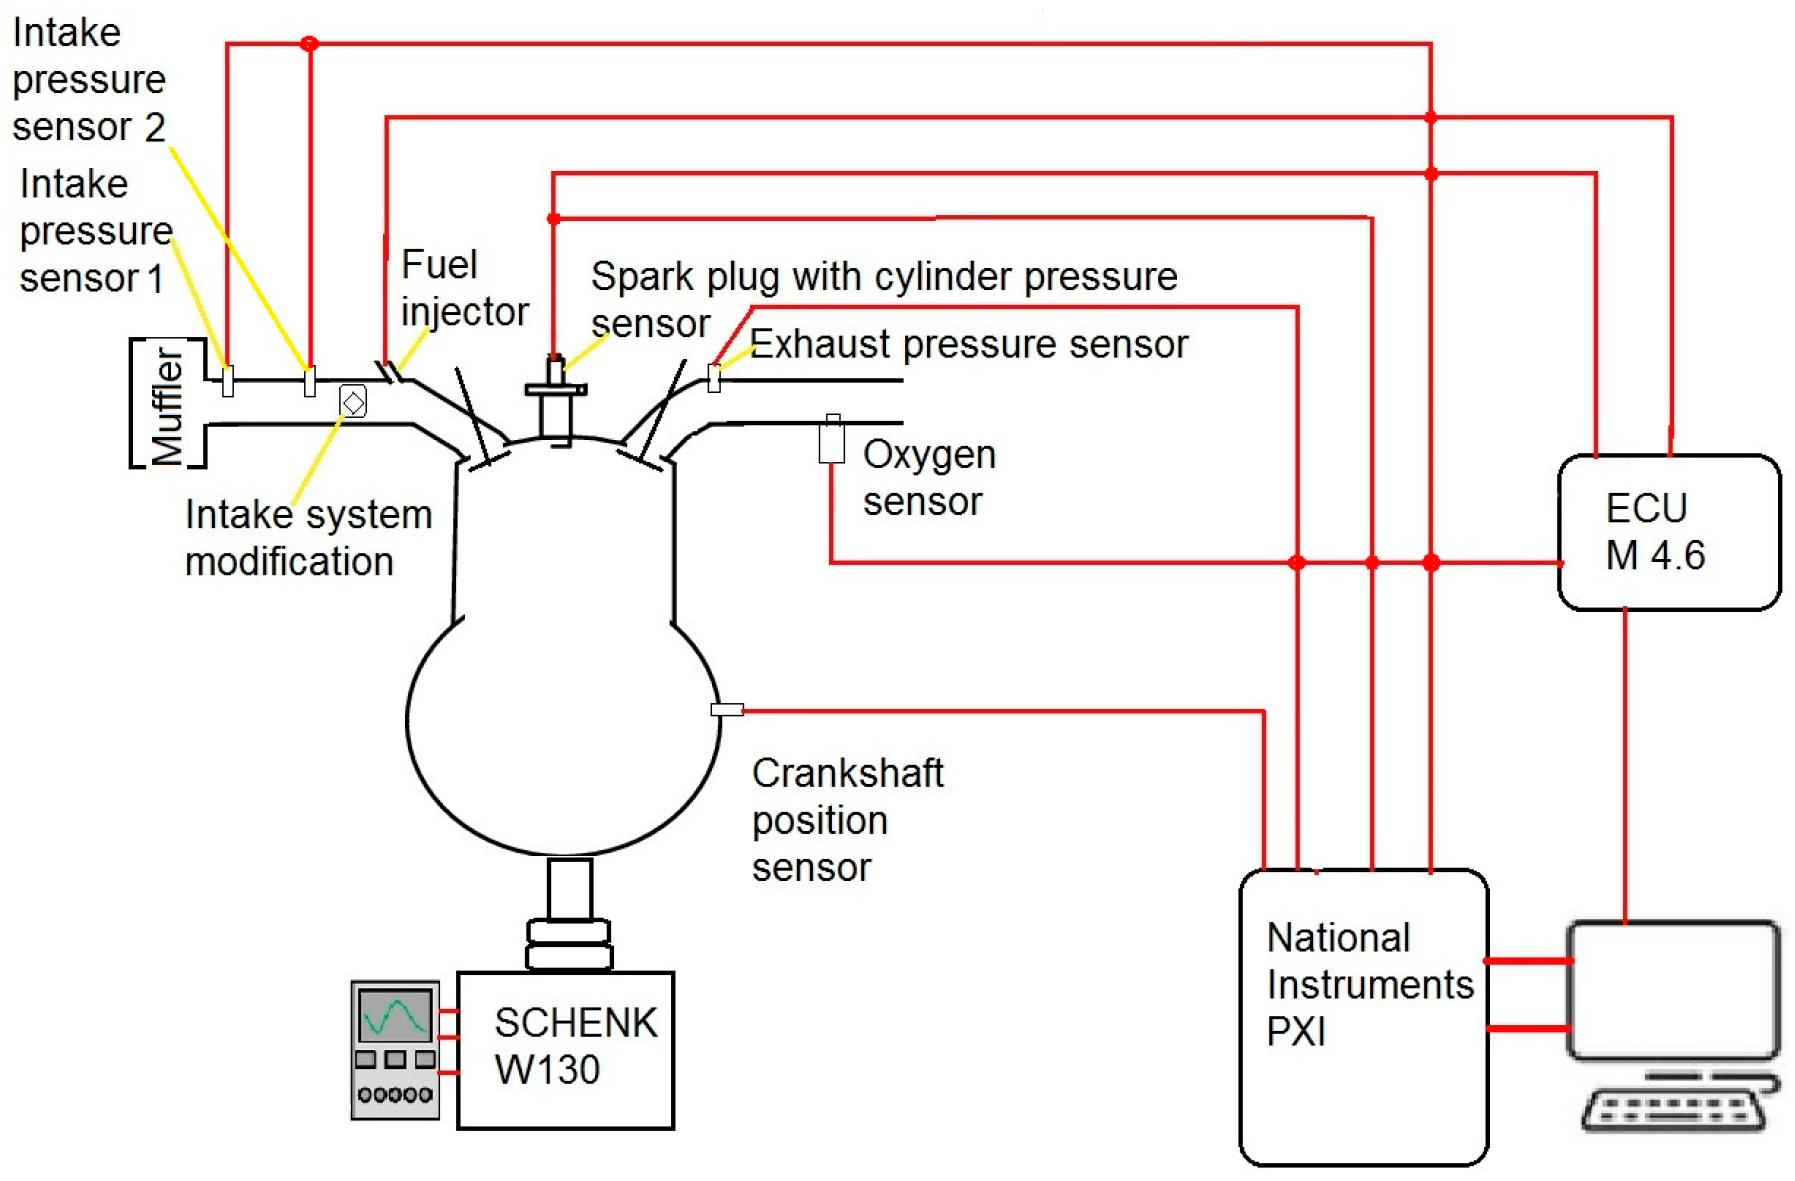
The impact of intake port aerodynamic modifications on fluid flow patterns, combustion, and exhaust emissions was experimentally evaluated in a two-valve spark ignition engine equipped with a specially developed additional element-deflector in the intake manifold. Deflectors integrated into each intake pipe allow for the modification of the fluid flow cross-section. The schematic of the experimental setup is illustrated in Figure 1, and the technical specifications of the test engine are summarized in Table 1. In the figure, the yellow lines serve as indicators connecting the component labels to the experimental setup, while the red lines represent the functional interconnections and signal flow between the components.
The test bench has been organized around the Eddy-current engine dynamometer SCHENCK W130 (Carl Schenck AG, Darmstadt, Germany) with an incorporated load cell. The data acquisition system is based on National Instrument PXI (National Instruments, Austin, TX, USA) platform and consists of the following:
  • PXI 1042 chassis with integrated power supply unit;
  • PXI 8186 controller based on Intel Pentium 4 processor;
  • PXI 6123S multifunction data acquisition module with simultaneous sampling;
  • PXI 6229M data acquisition module;
  • PXI 4070 DMM digital multimeter;
  • Burr-Brown INA 103 (Burr Brown, Tucson, AZ, USA) instrumentation amplifier with MSGA 41 amplifier module.
Experimental measurements were conducted under full-load operating conditions across a speed range of 2000 to 6000 rpm. Furthermore, part-load operating points were investigated between 2500 and 3500 rpm. At partial loads, the engine operated with a stoichiometric mixture under active closed-loop control using a universal oxygen sensor and programmable ECU to ensure stable air–fuel ratio. The part-load point at 3300 rpm was selected as the representative case for further numerical analysis, as the implemented intake system modification specifically targeted flow enhancement under these conditions. For experimental purposes, the test engine was equipped with a modified intake system featuring a nominal pipe diameter of 26 mm and a total length of 370 mm.
The focus of the experimental measures was to determine in-cylinder pressure as a function of the crank angle. For that purpose, the KISTLER 6117 (Kistler Group, Winterthur, Switzerland) piezo-electric pressure transducer is used accompanied with an inductive crank angle sensor with a resolution of 3° CA. The pressure on two different locations in the intake system was measured as well.
In addition to the in-cylinder and intake system pressure trace, other important engine parameters such as engine momentum, fuel consumption, and oil and cooling liquid temperatures as well as pressure in the exhaust system were measured.
At each operating point, 50 consecutive cycles were captured in order to evaluate cyclic variability. The study involved the analysis of individual cycles as well as the “mean cycle” which was calculated as the average of the 50-cycle sequence.

2.2. Numerical Model

The analysis of in-cylinder flow patterns and flame propagation is fundamental to multi-dimensional numerical modeling of reactive flows. This approach is particularly significant as it remains the only technique capable of explicitly incorporating the complex valve-port geometry [8]. The physical domain under consideration is shown in Figure 2 and Figure 3.
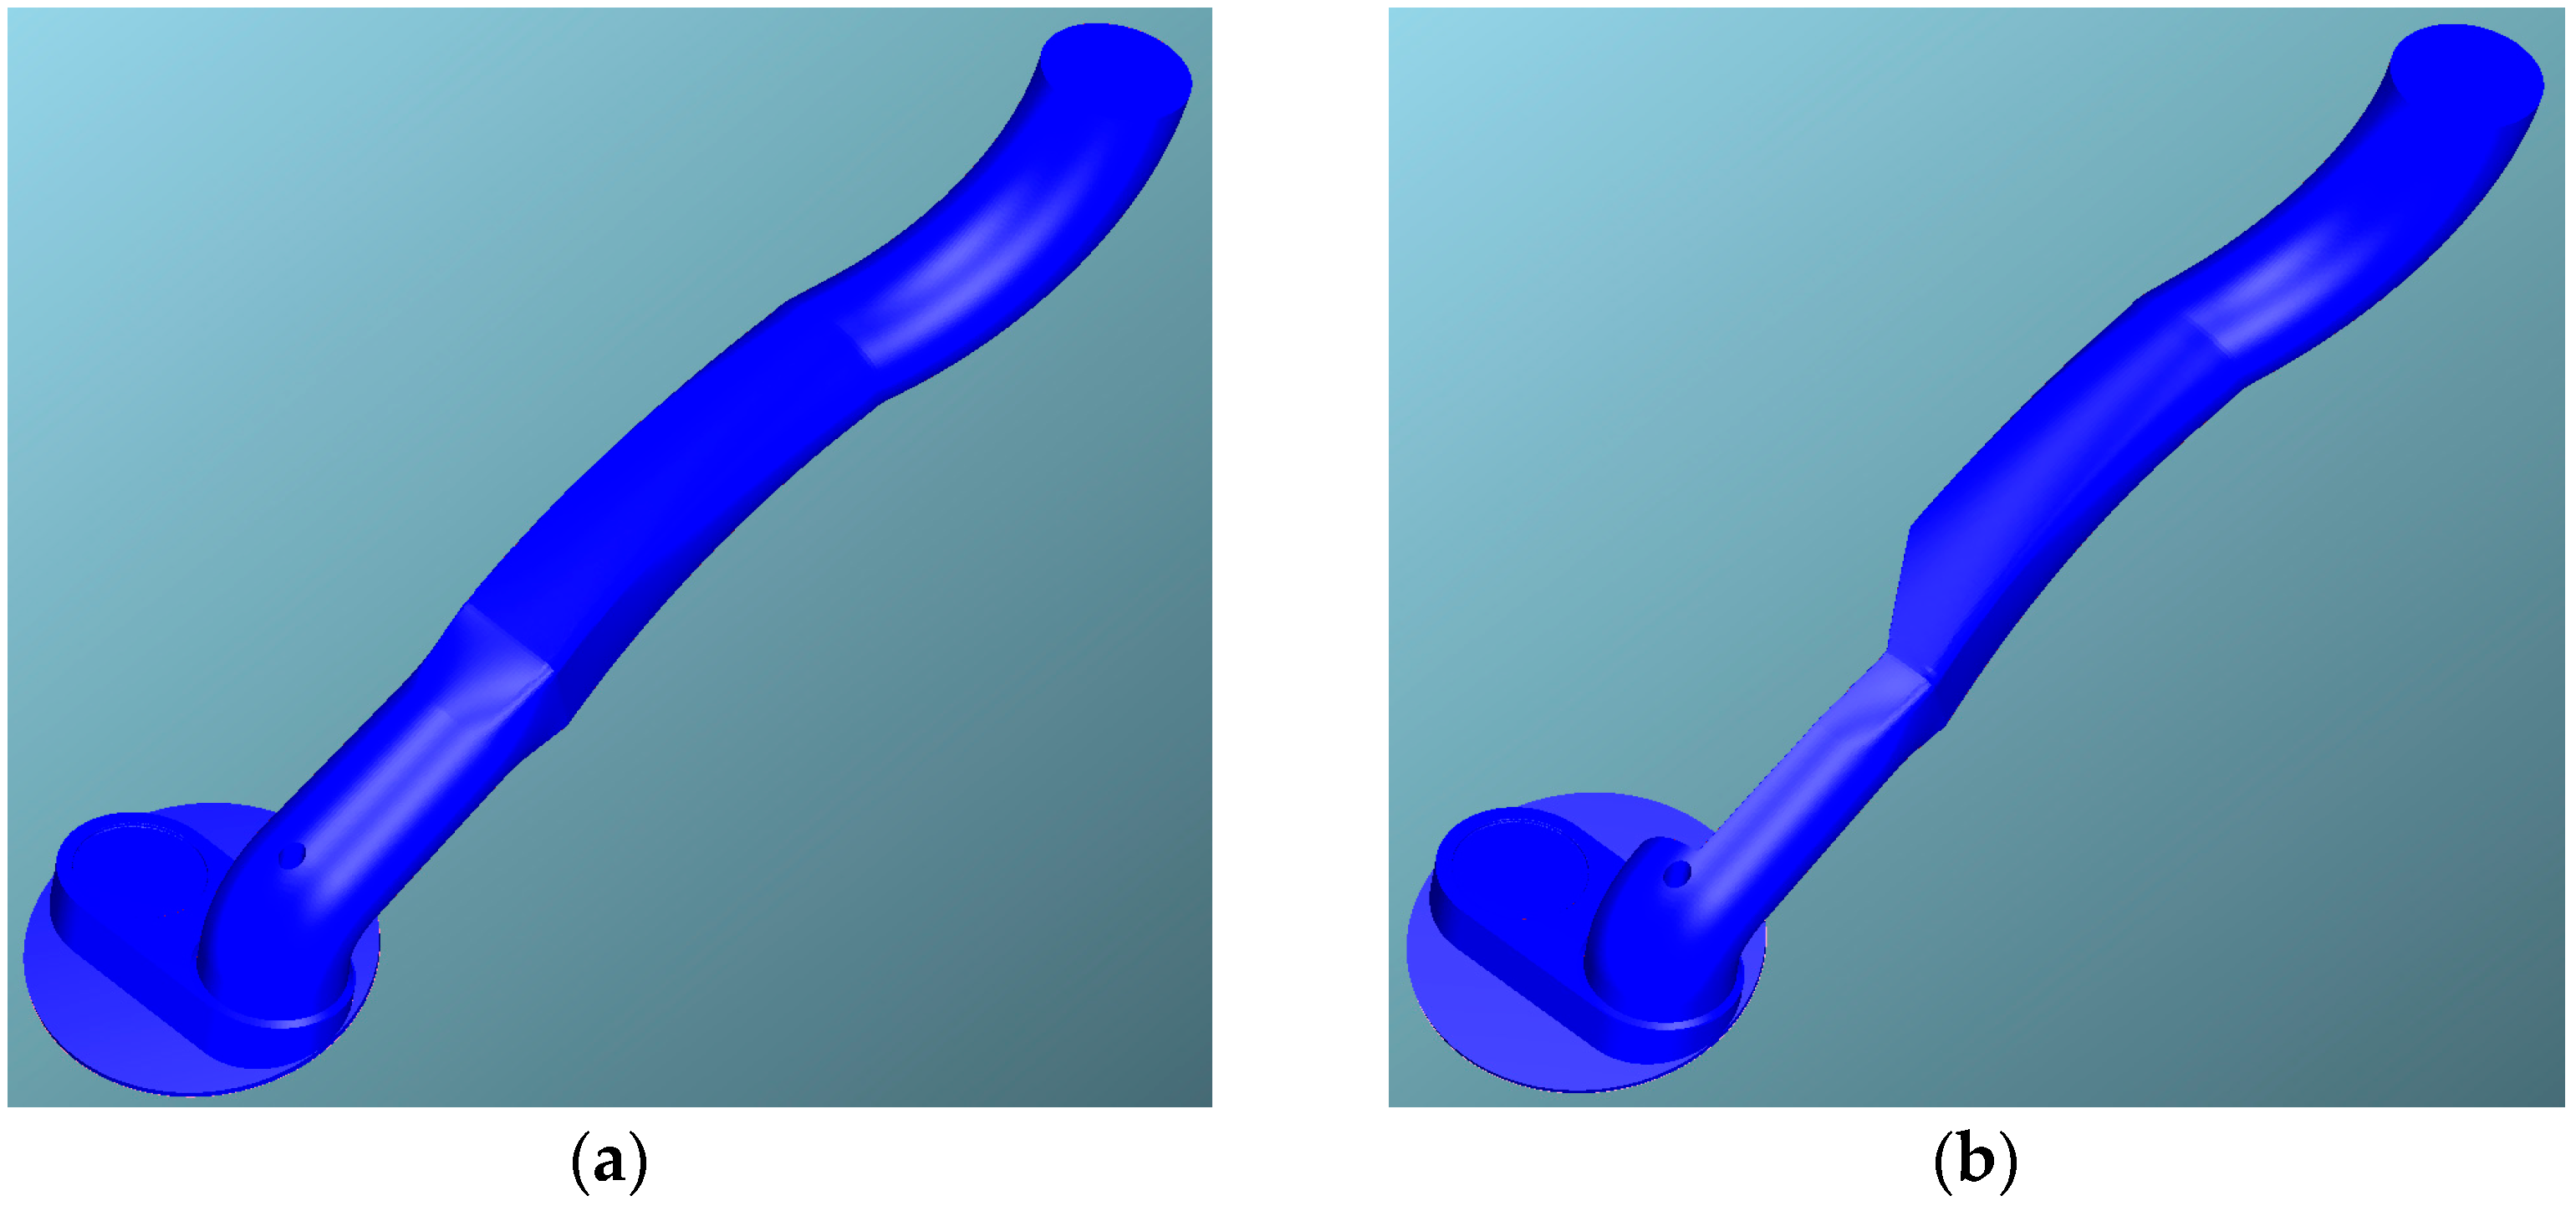
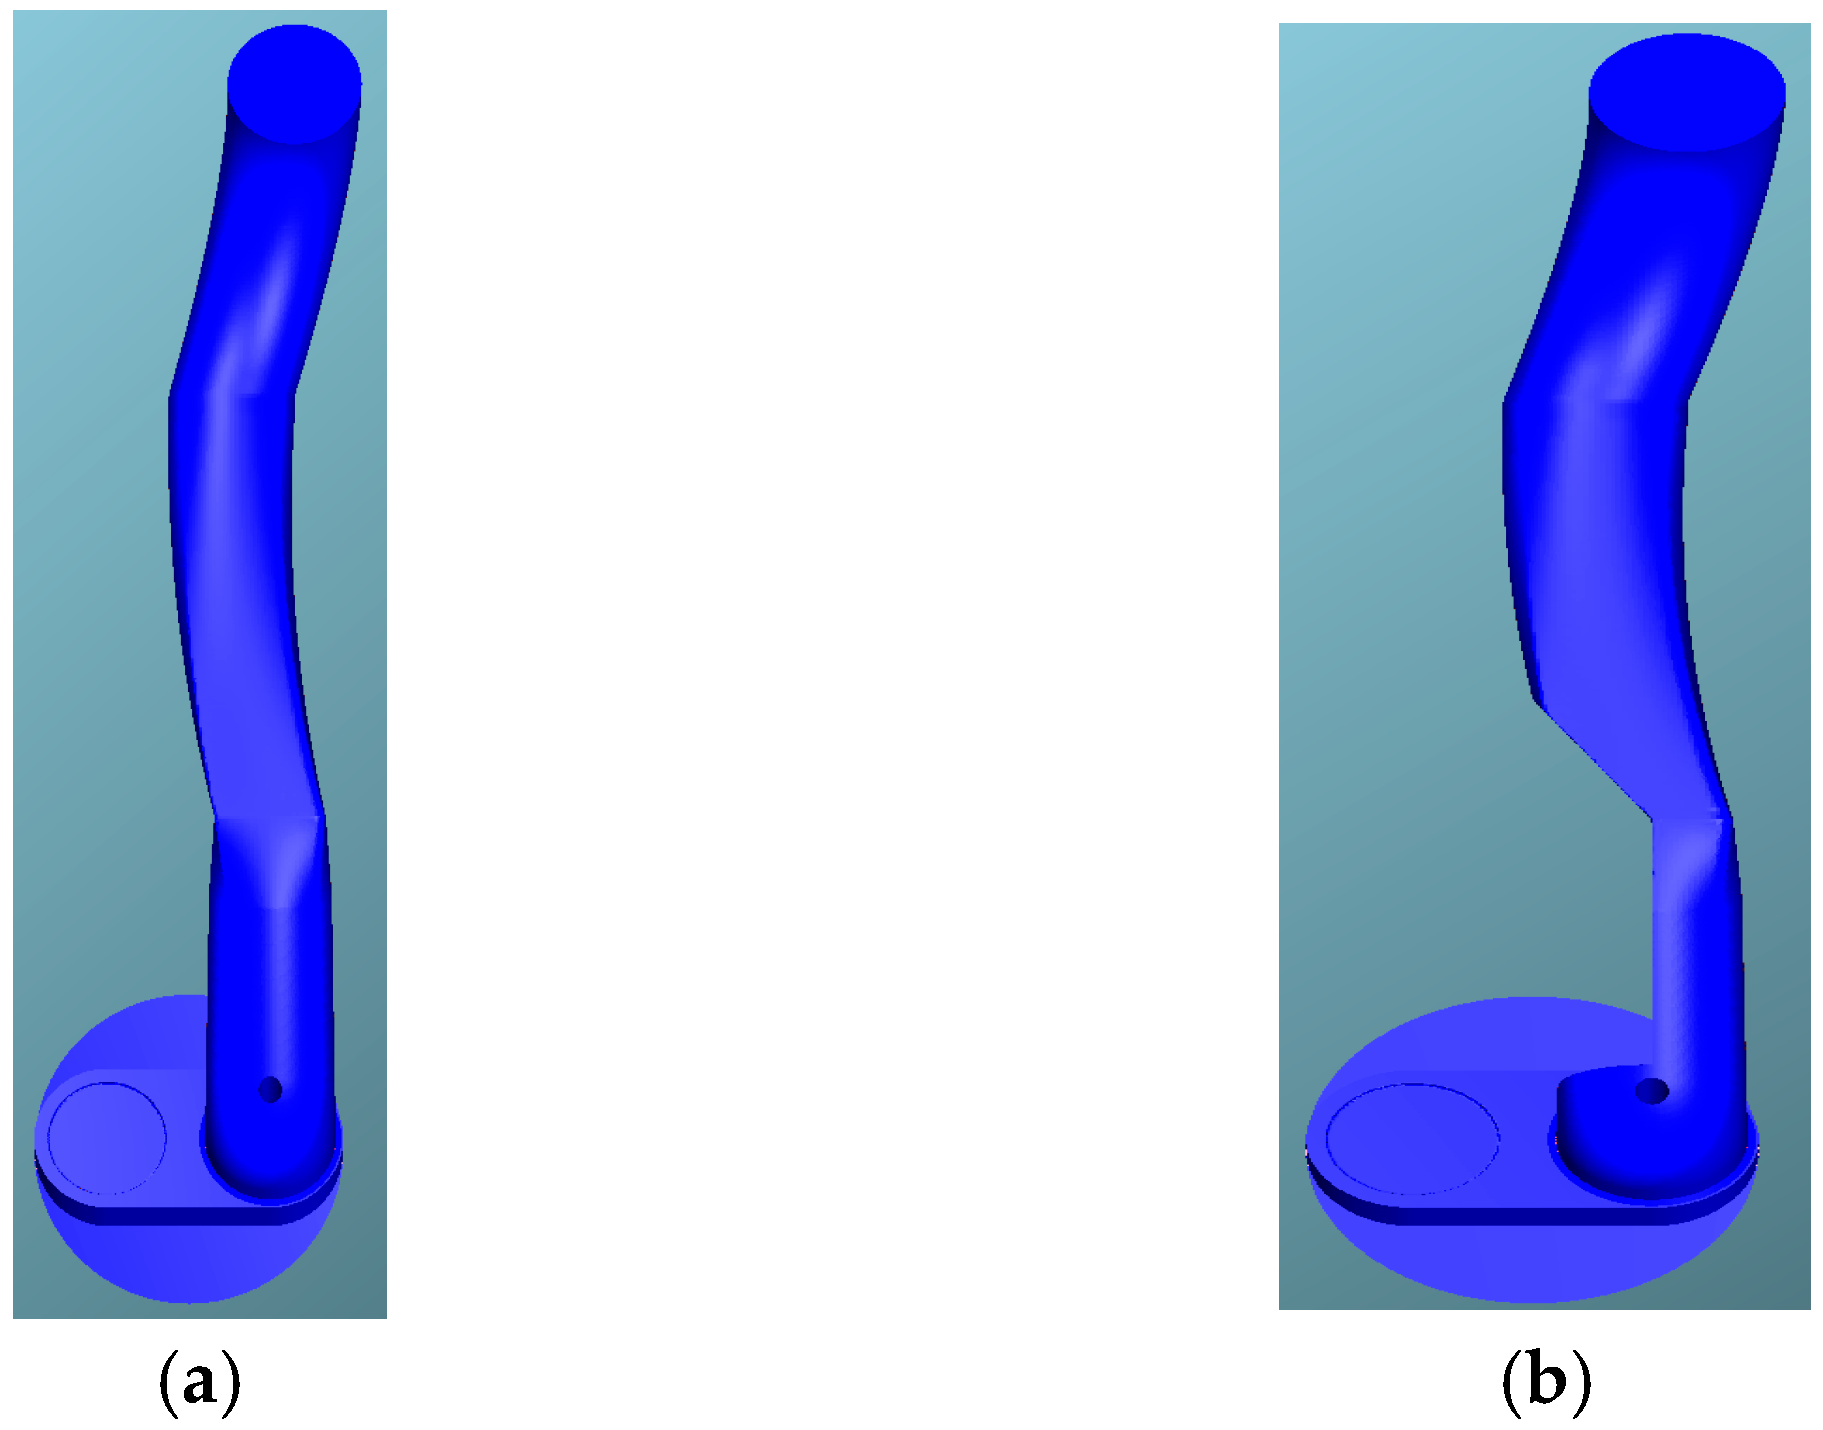
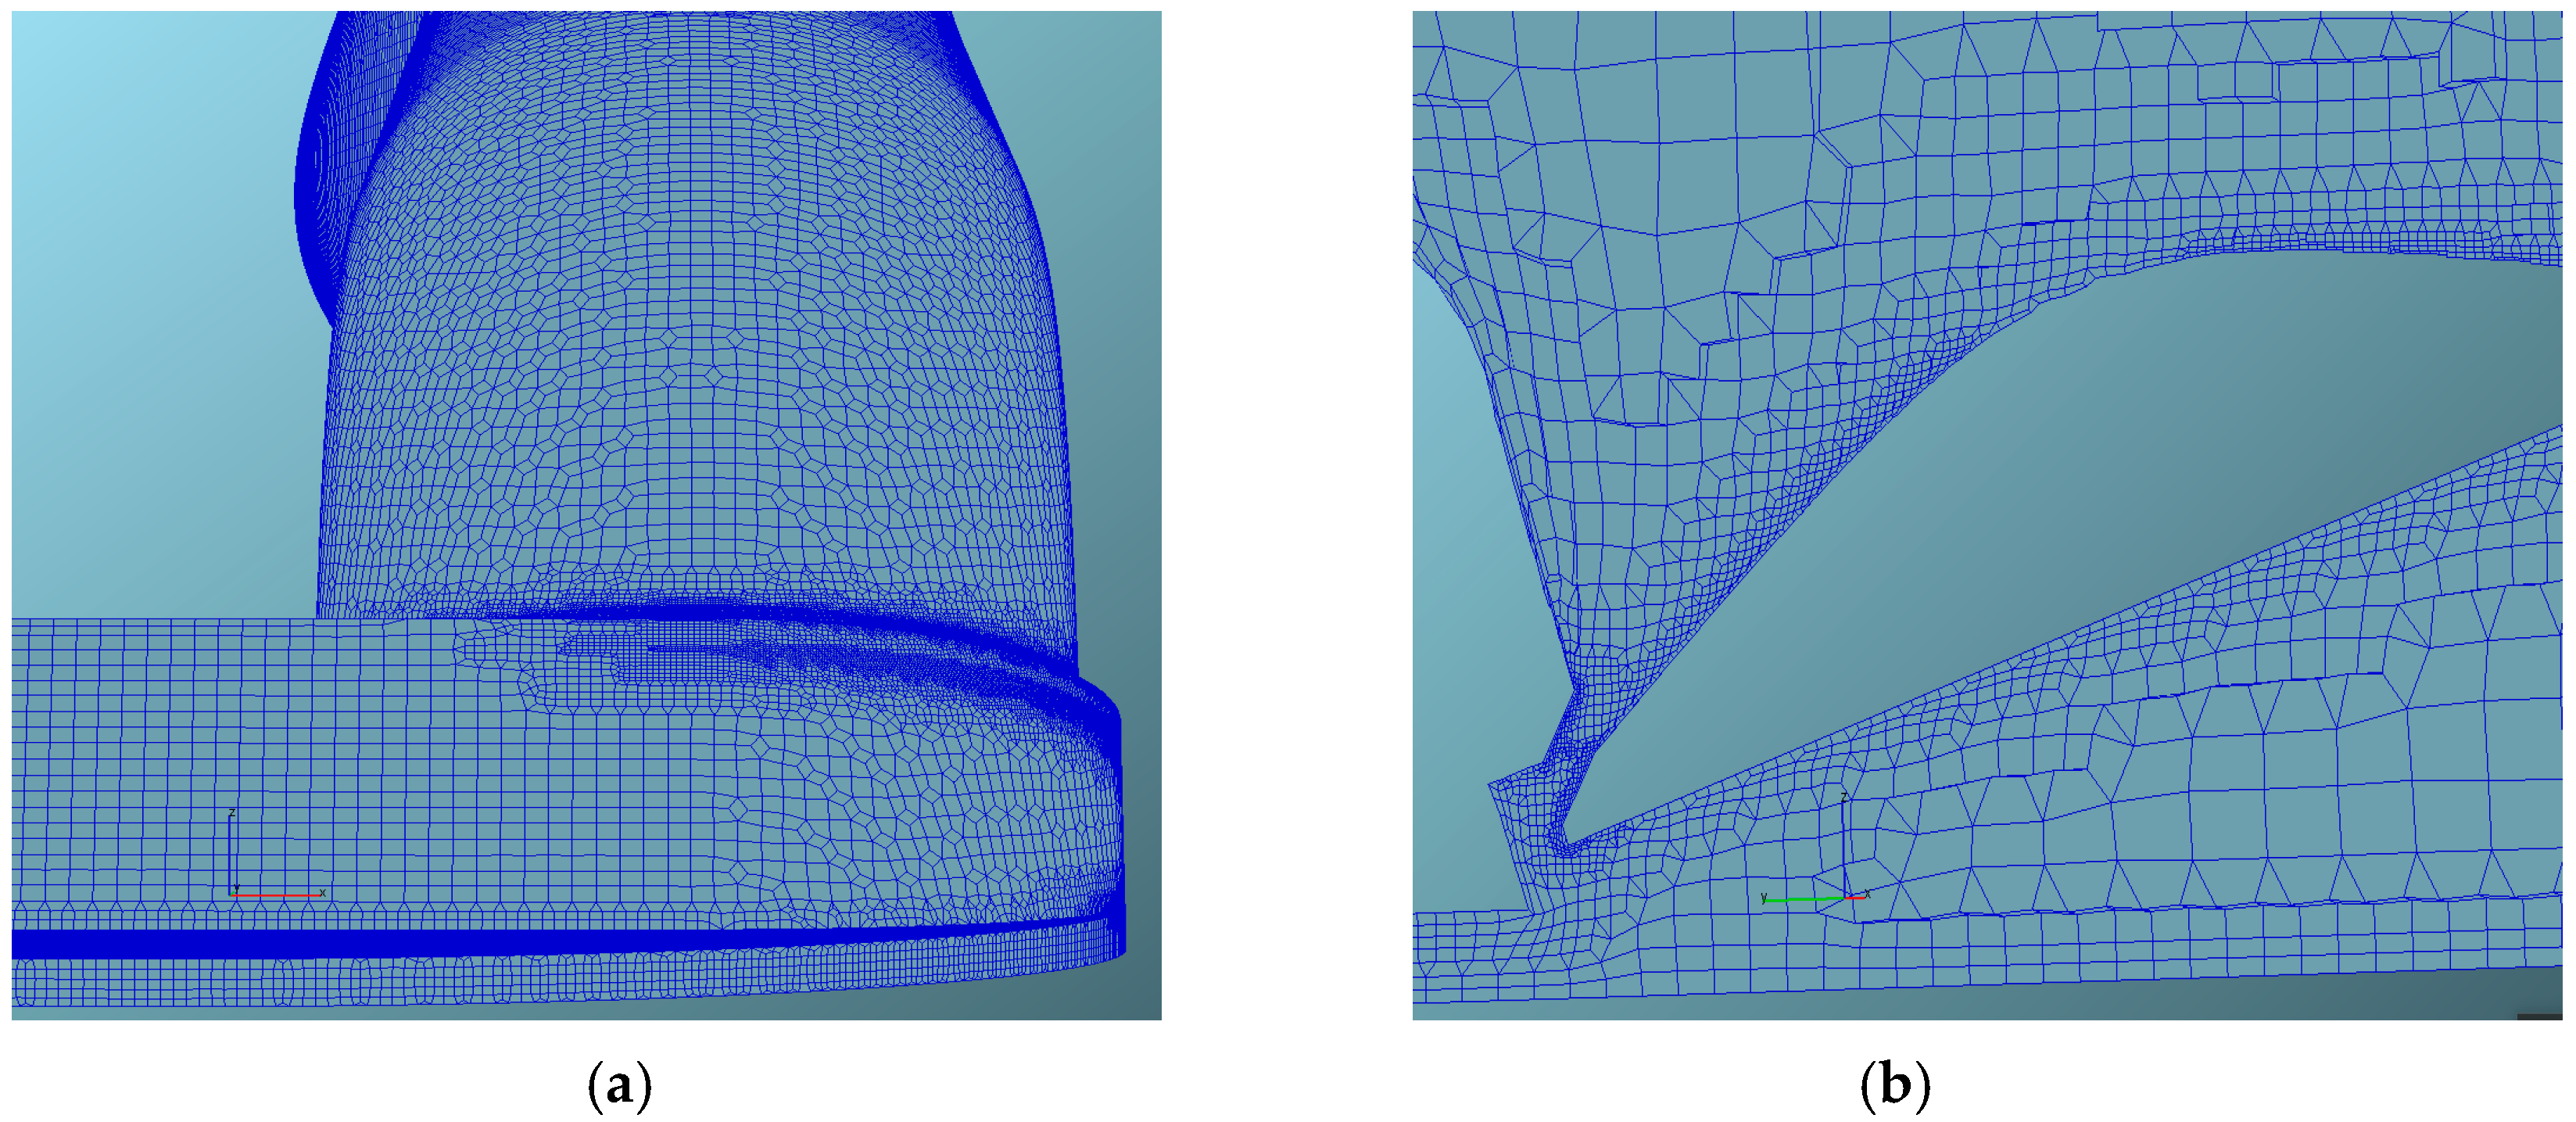
The figures illustrate that the intake system modification consists of a specially designed deflector which, when closed, obstructs half of the intake channel’s cross-sectional area. The main idea behind this modification is to improve cylinder charge through intensification of tangential intake flow. It is assumed that intensification of tangential intake flow yields to in-cylinder turbulence motion increase, especially at low and medium working regimes, with direct positive effects on combustion rate, exhaust emissions, and overall engine performances. In the case of high working regimes, this deflector is placed in the open position, thus enabling as little flow resistance as possible and full utilization of available intake channel flow section. Further in the text, the designation “TO” will be used in the case with the open deflector, i.e., without it, while the designation “TC” refers to the situation with the closed deflector. Detailed views of the, selected parts of numerical mesh (detail of intake port and intake valve) are given in Figure 4.

2.3. Computional Method and Case Specification

The combustion chamber under consideration is a well-known “pent-roof” combustion chamber with two tilted valves. Numerical analyses were performed for a premixed stoichiometric air–fuel mixture at a partial load operating point of 3300 rpm. The physical domain was discretized using a fine, block-structured numerical mesh, with the cell count varying between 350,000 and 1,200,000 depending on the position of the moving boundaries utilizing the AVL FIRE™ code ver. 2017 [9]. The calculations were carried out for two positions of the baffle located in the intake pipe. The numerical solution method of the full 3D integral form of the conservation equations governing the unsteady, turbulent motion of reactive mixture is based on the fully conservative finite-volume approach. All dependent variables, momentum, pressure, density, etc., were evaluated in the cell center. Integral approximations were obtained by the second-order midpoint rule while the second-order linear approximation is used for the values at cell face. For the approximation of convective and diffusion terms in governing equations, the second-order differencing schemes, CDS and MINMOD, were employed as well.
Numerical simulations were performed using the standard species transport model available in the software.
The initial intake and cylinder pressure and temperature were defined based on experimental measurements at the beginning of the intake stroke. The mixture temperature was assumed to be 320 K, while the initial pressure was set to ambient conditions corrected for intake system pressure losses. The inlet boundary condition was defined at the entrance of the intake pipe, coinciding with the location of the pressure sensor. The outlet boundary condition was positioned at the exhaust port exit within the cylinder head. The boundary conditions employed for this study are summarized in Table 2 and were kept identical for both cases under consideration.

2.3.1. Turbulence Modeling

For the sake of turbulence modeling, the k-ε model based on the Boussinesq assumption is a common choice, particularly with moving boundaries, due to its numerical robustness, simplicity, and acceptable accuracy [10]. However, this Eddy Viscosity/Diffusivity model assumes isotropic turbulence and neglects spectral dynamics, which is particularly noticeable in strongly non-homogeneous inner regions at a viscous length or the Kolmogorov’s scale [11]. Although the usage of a “damping function” can yield good agreement with experimental data in particular cases, the model is still fundamentally incorrect and the attempt to correct it by introducing an arbitrary function is rather unattractive. An alternative is found in the υ 2 ¯ f model based on the introduction of an additional velocity scale (wall-normal) υ 2 ¯ and elliptic relaxation concept to sensitize it to the inviscid wall blocking effect. The concept is known as Durbin’s elliptic relaxation concept. The primary disadvantage of this approach is the requirement for large values at the first near-wall grid point. The k-ζ-f model, proposed in 2004 and implemented in this study, solves the transport equation for the velocity scales ratio ( ζ = υ 2 ¯ / k ), providing enhanced numerical stability and a more accurate reproduction of the turbulence kinetic energy production term [12].

2.3.2. Combustion Modeling

The internal combustion engine chamber represents a very complex physical and chemical system in which two basic phenomena—fluid flow and chemical reactions—intertwine. The proper evaluation of the effects among these phenomena is of prime importance. In the domain of numerical simulation of chemical kinetic processes, proper determination of mean chemical reaction rates represents the main problem [13]. While detailed kinetic mechanisms offer comprehensive insights, their computational demands for engineering applications are often prohibitive. Over the years, different combustion models, beside the detailed kinetics mechanisms, were developed and, more or less, successfully tested in different situations. This study employs the Extended Coherent Flame Model (ECFM) representing the evolution of the laminar flamelet concept [14,15]. This concept is based on the assumption that chemical reactions during combustion take place only in the very thin layer separating fresh and burnt mixtures, with fast thermal decomposition preventing unburnt fuel from remaining in high-temperature zones [16]. Although this assumption is particularly applicable in the case of premixed combustion it exhibits great deficiencies in cases of large-scale mixture stratification. To address deficiencies in stratified mixture cases where local gas properties deviate from statistical averages, this implementation adopts a conditional averaging technique to define the fresh gas state [17]. Furthermore, a two-equation model determines fuel mass fraction variance and dissipation. The chemical kinetics are accounted for using a reduced reaction mechanism [13,18], which involves 22 species and 21 reactions integrated into the ECFM framework.

2.3.3. Ignition Modeling

Numerical simulations, particularly in the case of IC engine simulations, often employ rather simple phenomenological ignition models for initiation of spark plug combustion. Those models are based on artificial energy deposition in a specified space location and time moment. In this way, only one flame kernel is developed and its characteristics do not correspond to an actual situation, electrical circuit, and thermochemistry properties of the mixture quite well. Numerical simulations presented in this paper employ the Arc and Kernel Tracking Ignition Model (AKTIM) [19]. This approach accurately captures the early combustion stage by integrating effects from charge stratification, electrical circuit characteristics, heat losses, and turbulence. The AKTIM framework comprises four integrated sub-models [20]. The first sub-model accounts for the secondary electrical circuit, specifically the glow phase, which represents the primary energy transfer period. The other two phases, breakdown and arc phase, are neglected. The second sub-model represents the spark as a series of Lagrangian particles equally spaced between electrodes and transported by the mean flow field, enabling the simulation of arc curvature and multiple breakdowns. The third component, based on the Discrete Particle Ignition Kernel (DPIK) model [21], utilizes marker particles to track potential flame kernels; these are initially treated as spherical under laminar-dominant conditions before accounting for surface distortion due to turbulent fluctuations. Finally, the spark plug geometry is represented by a mesh-independent set of discrete particles. The main advantage of this description is that there is no need for remeshing the spark plug while the perturbation of mean flow field in the zone of the spark gap can still be accounted for.

2.3.4. Exhaust Emission Modeling

The ECFM appertains to a group of quasi-global combustion models but unlike some other models of this group, it is based on a two-step chemistry mechanism for the fuel conversion. This chemistry mechanism can be expressed in terms of two irreversible fuel oxidation reactions, as follows:
C n H m O k +   [ n + m 4 k 2 ] O 2 n C O 2 +   m 2 H 2 O
C n H m O k +   [ n 2 k 2 ] O 2 n C O +   m 2 H 2
In the above formulas, n, m, and k represent the number of carbon, hydrogen, and oxygen atoms, respectively. The second formula in this mechanism is implemented in order to more precisely represent the formation of C O and H 2 , especially in the case of near stoichiometric and fuel rich conditions. In the case of fuel lean conditions, their formation and, hence, the second formula can be neglected. The chemistry mechanism represented by the aforementioned formulas is pursued by six fast reversible equations represented by the Meintjes–Morgan mechanism [22]:
N 2 2 N
O 2 2 O
H 2 2 H
O 2 + H 2 2 O H
O 2 + 2 C O 2 C O 2
O 2 + 2 H 2 O 4 O H
The third part of the chemistry mechanism is the nitric oxide formation mechanism represented by the extended Zeldovich scheme, as follows [23]:
N 2 + O N O + N
N + O 2 N O + O
N + O H N O + H

3. Results and Discussion

3.1. Mesh Sensitivity Study

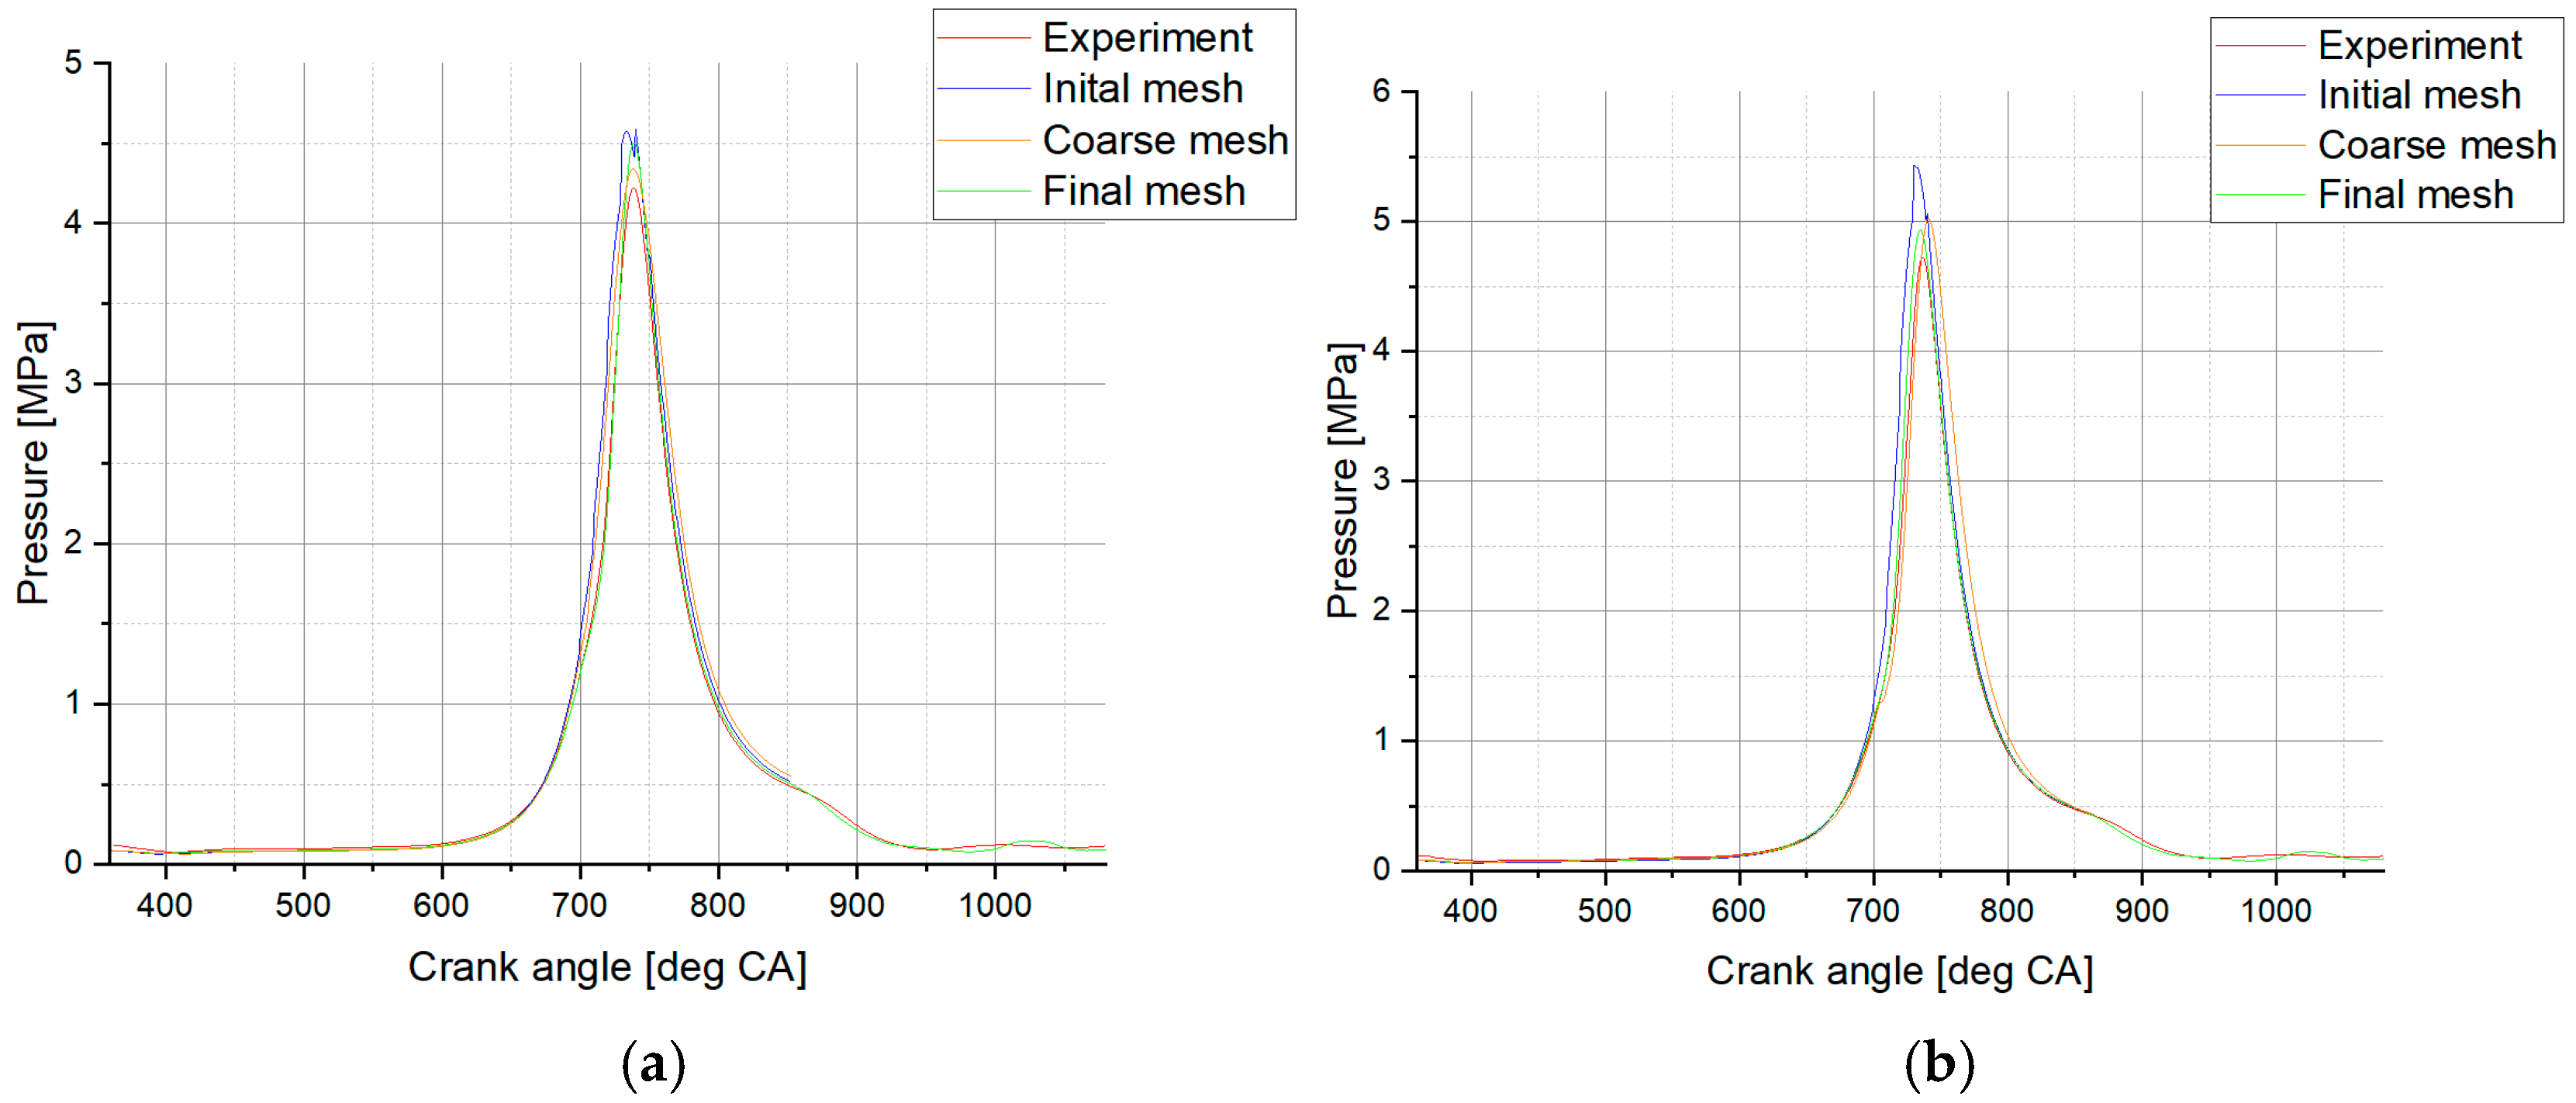
An essential aspect of any numerical simulation is to ensure that the results obtained do not depend on the resolution of the numerical grid used for discretizing the physical domain. Accordingly, a mesh sensitivity analysis was conducted, and the results are presented in Figure 5 for both cases under consideration.
After setting the initial cell size limits and defining refinement zones, including basic mesh quality criteria, an initial block-structured network consisting of 215,000 to 845,000 cells was generated. From the in-cylinder pressure trace results for the unmodified intake system, good agreement between numerical and experimental results was observed during the intake and compression stroke. However, during combustion, due to the existence of high gradients, the differences became clearly noticeable. Moreover, at the peak pressure moment, the numerical results differed significantly from the experimental data. During the expansion stroke, good agreement was observed until the beginning of the exhaust stroke, when, again due to the large velocity gradient in the exhaust valve zone, the convergence of the calculations was disturbed. A similar situation was observed for the modified intake system. Despite the current differences in maximum pressure, a variation in pressure near top dead-center was also observed in this case, which was not confirmed by experimental data.
Further adjustments to cell size limits and refinement zones resulted in a coarse mesh ranging from 265,000 to 950,000 cells. Although pressure trace variations were not observed, the pressure trend during the second half of the compression stroke deviated significantly from experimental data, and convergence issues at the beginning of the exhaust stroke persisted. Similar discrepancies occurred with the closed baffle configuration, leading to the rejection of these meshes in favor of a new remeshing strategy. Through iterative optimization, both globally across the entire numerical domain and locally in the refinement zones, and implementing more rigorous mesh quality criteria, the final mesh consisting of 350,000 to 1,200,000 cells was obtained. In the case of the final mesh, more accurate in-cylinder pressure traces were achieved. These refinements significantly minimized grid sensitivity, ensuring that subsequent validation against experimental data was free from discretization errors, thereby enhancing the reliability of the study.

3.2. Model Validation

3.2.1. In-Cylinder Pressure and Heat Release Analysis

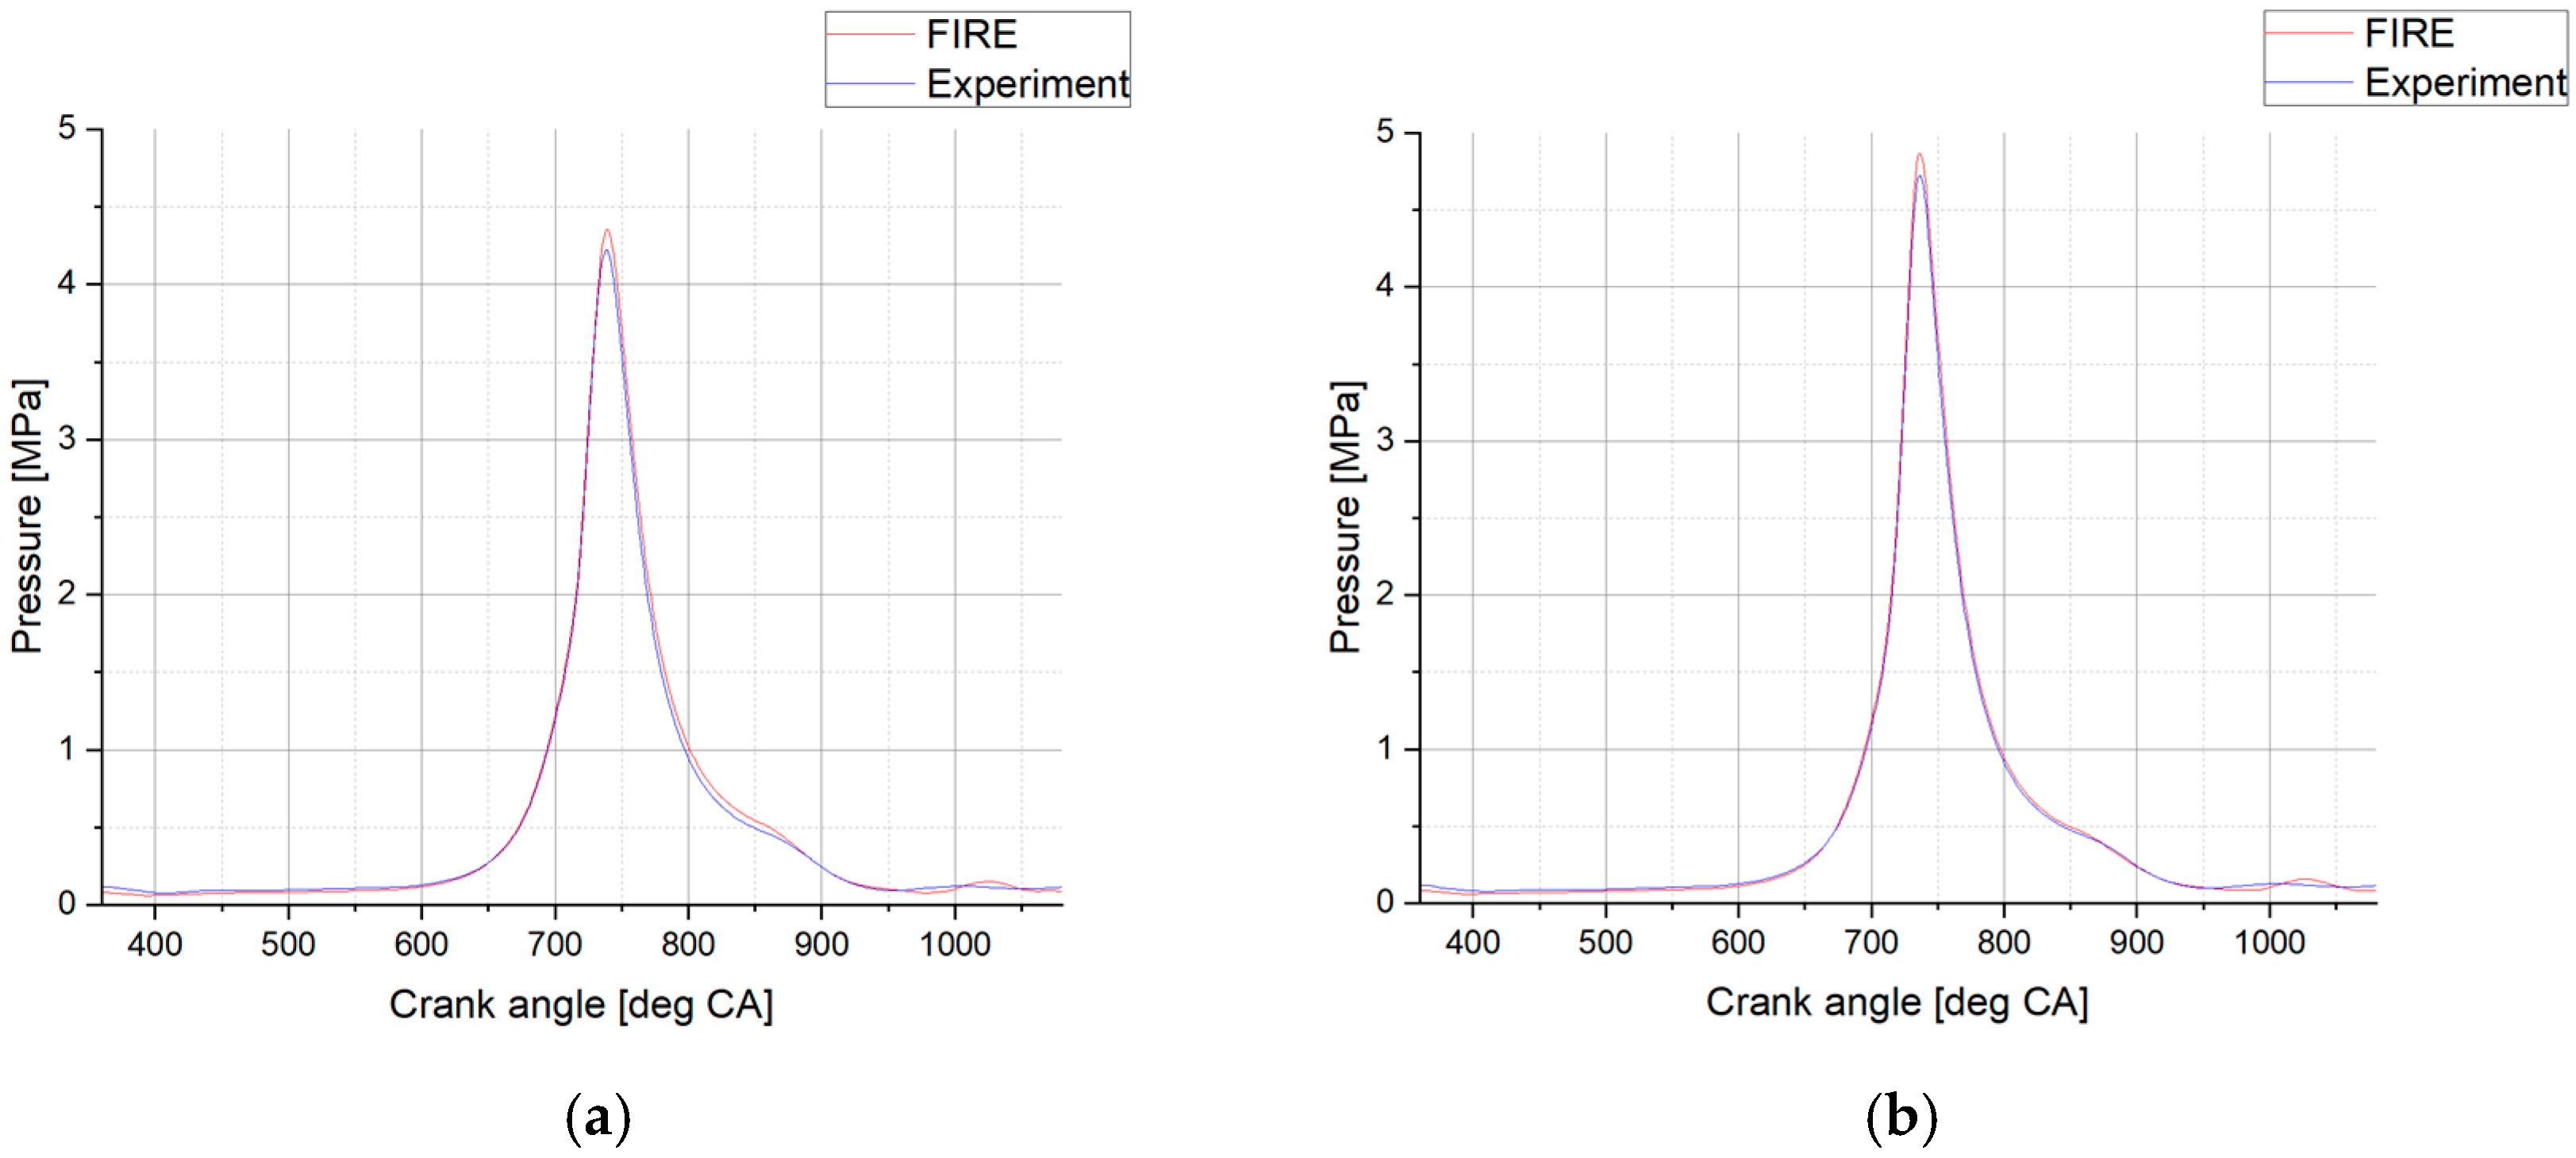
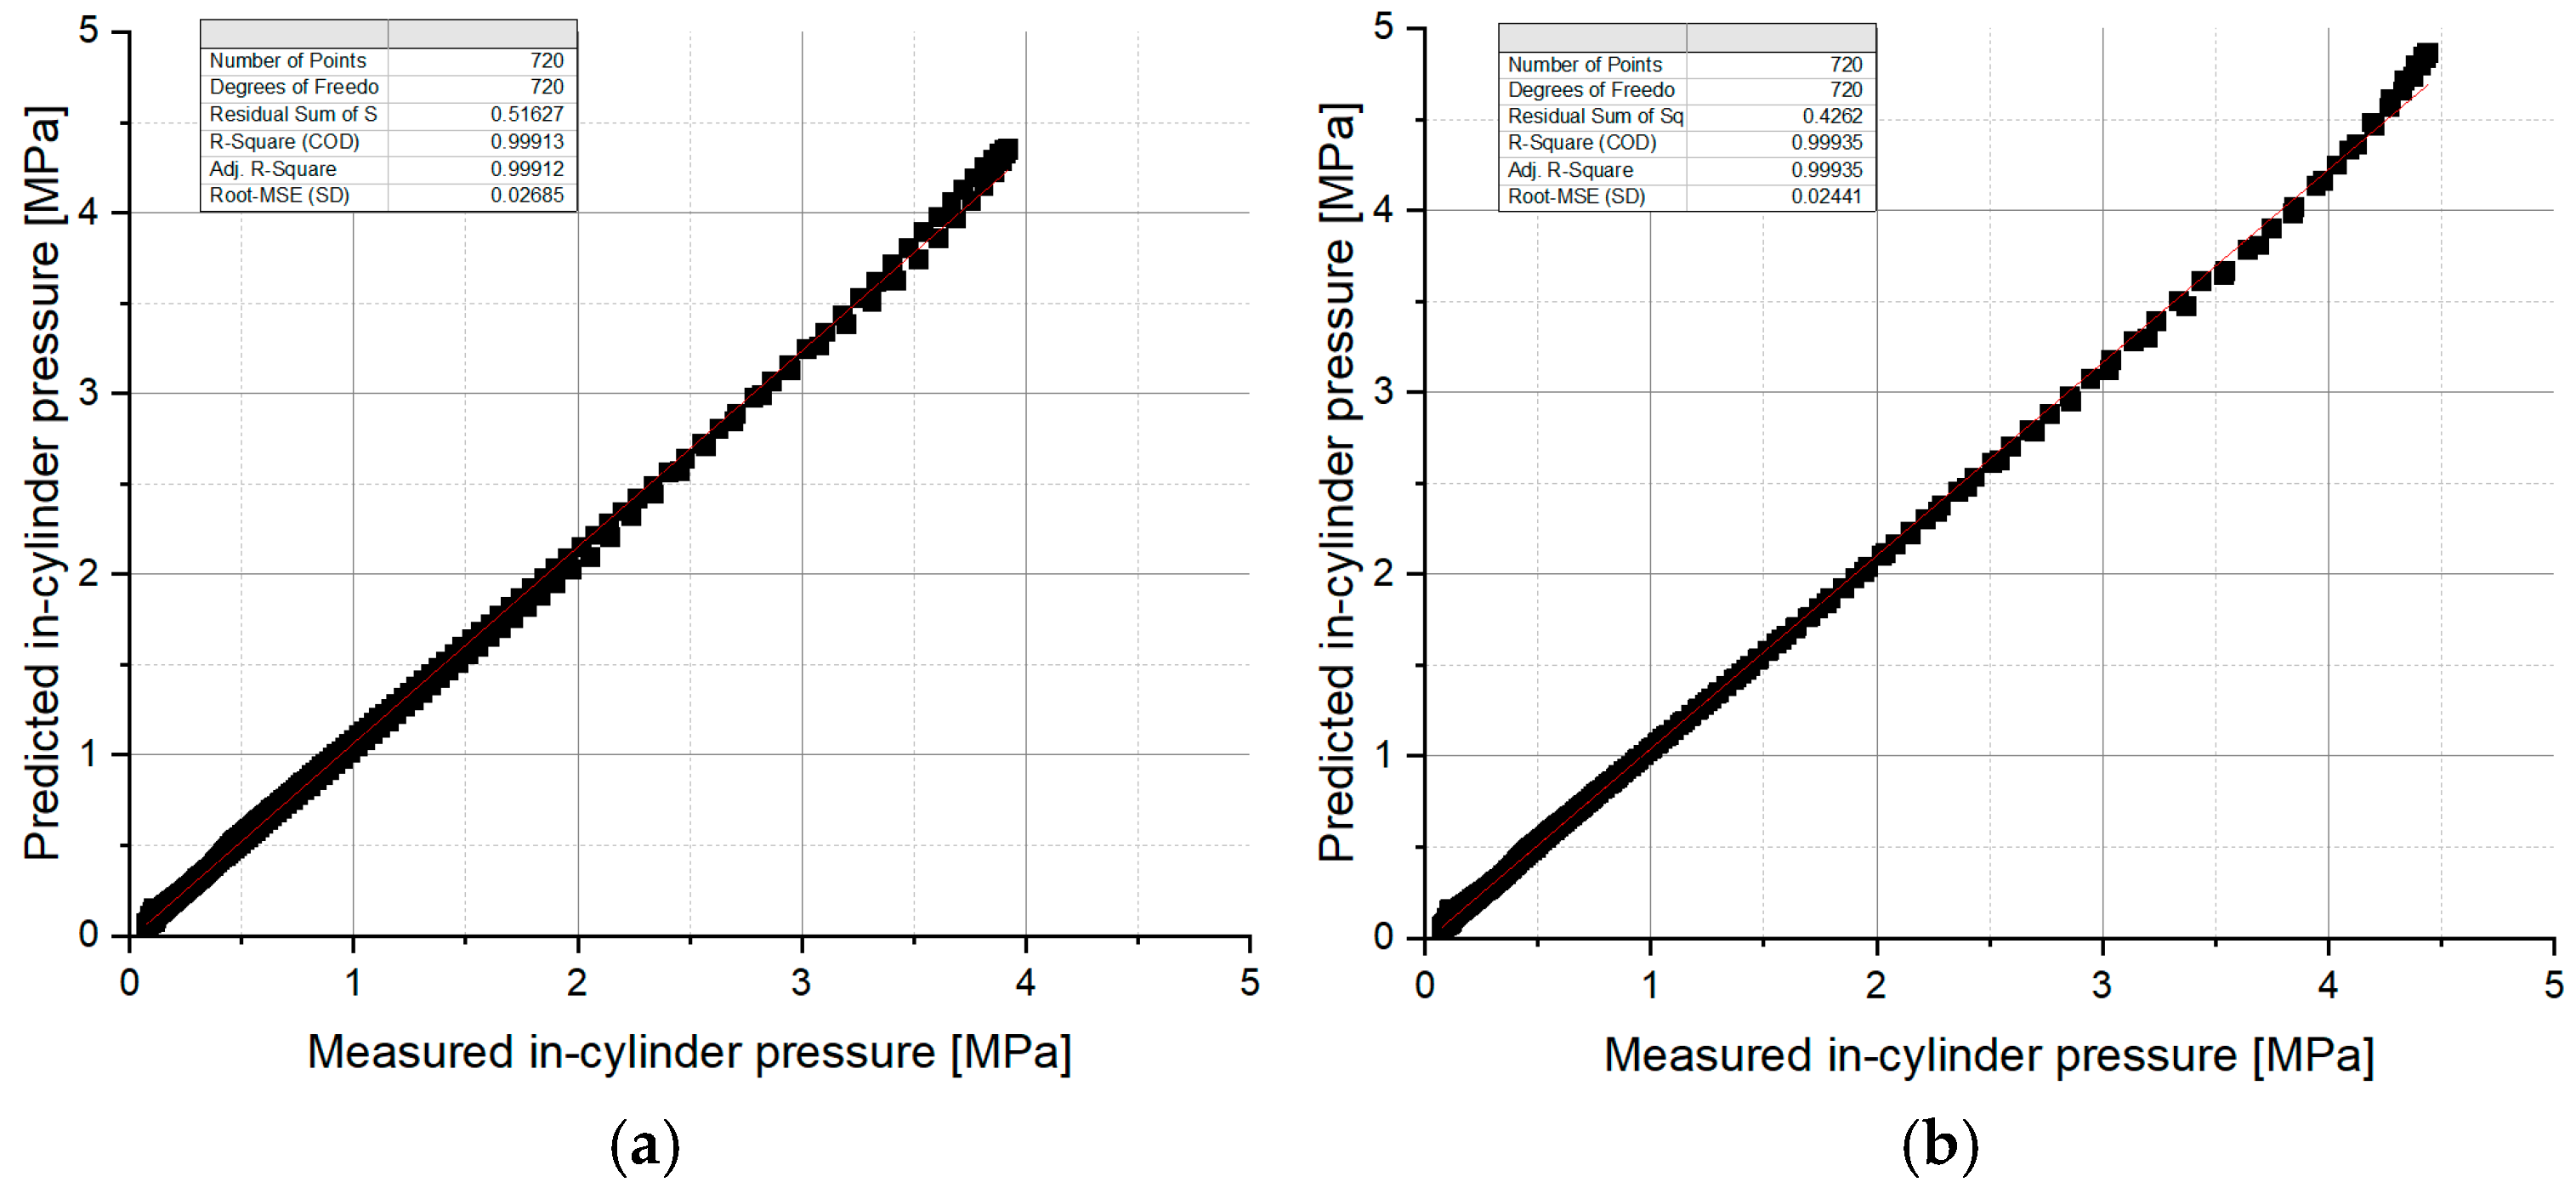
The comparison of experimental and numerical results in terms of in-cylinder pressure trace quantified through Root Mean Square Error (RMSE) analysis, for both cases under consideration, is shown in Figure 6 and Figure 7.
From the diagrams presented, it can be clearly seen that the differences in peak pressure values were rather small, below 3%, while the peak pressure moment deviation was below 2° CA. Ignition delay period as well as ignition duration, observed in terms of pressure gradient, showed good agreement with experimental data. More rigorous quantitative analysis, by RMS error calculation, indicated very good prediction capabilities of the numerical model used, in terms of in-cylinder pressure trace.
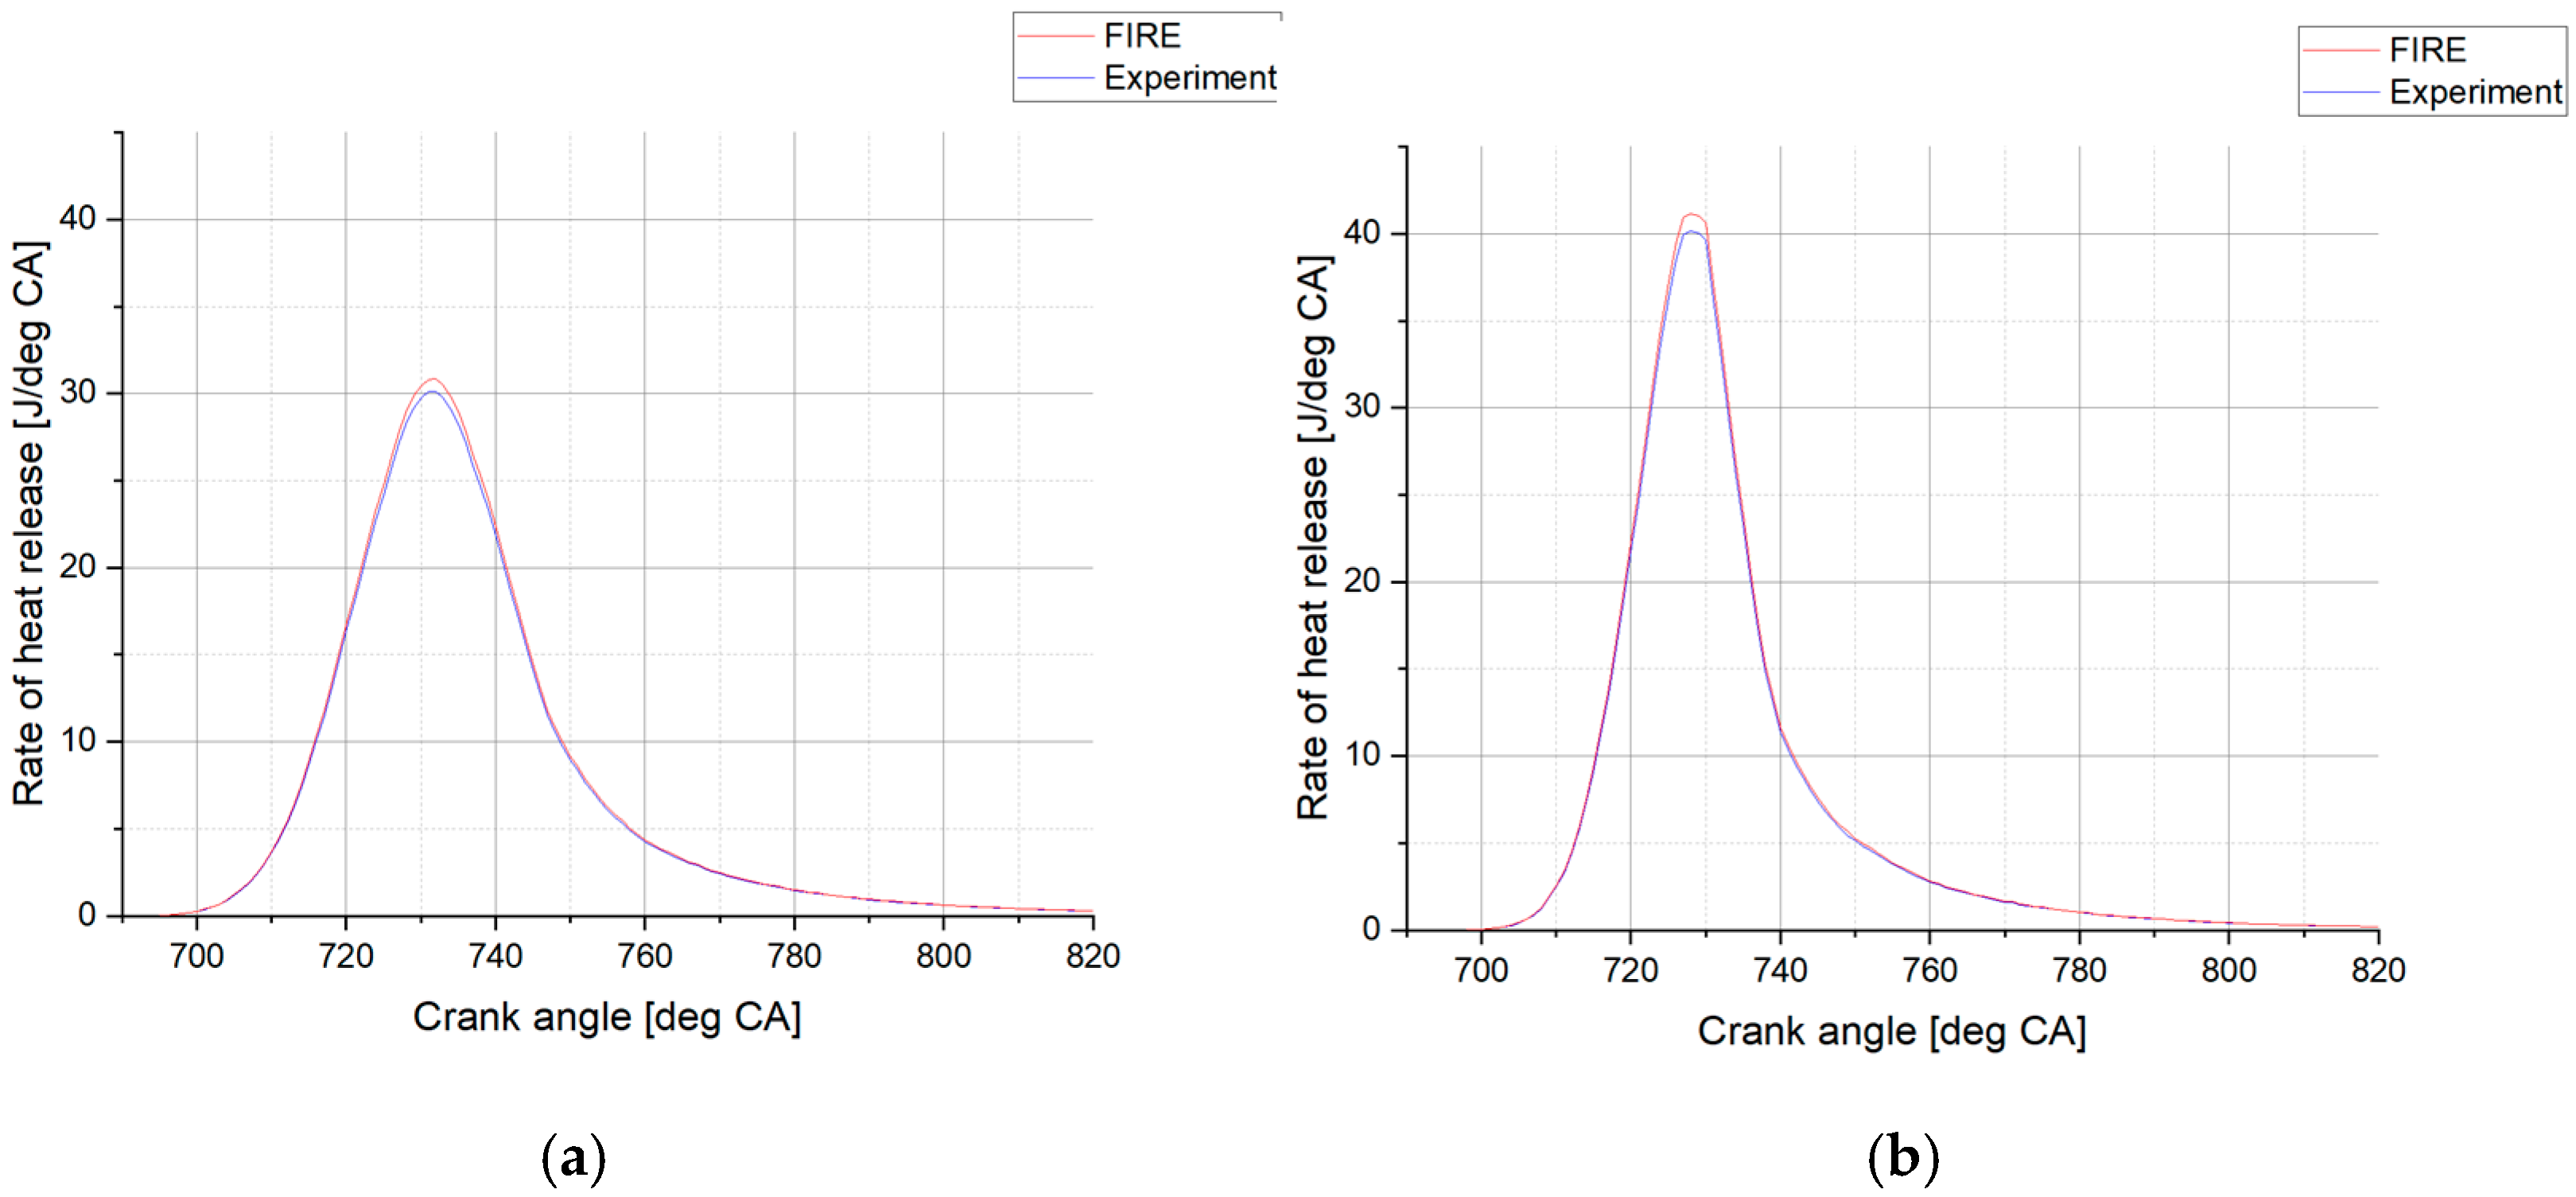
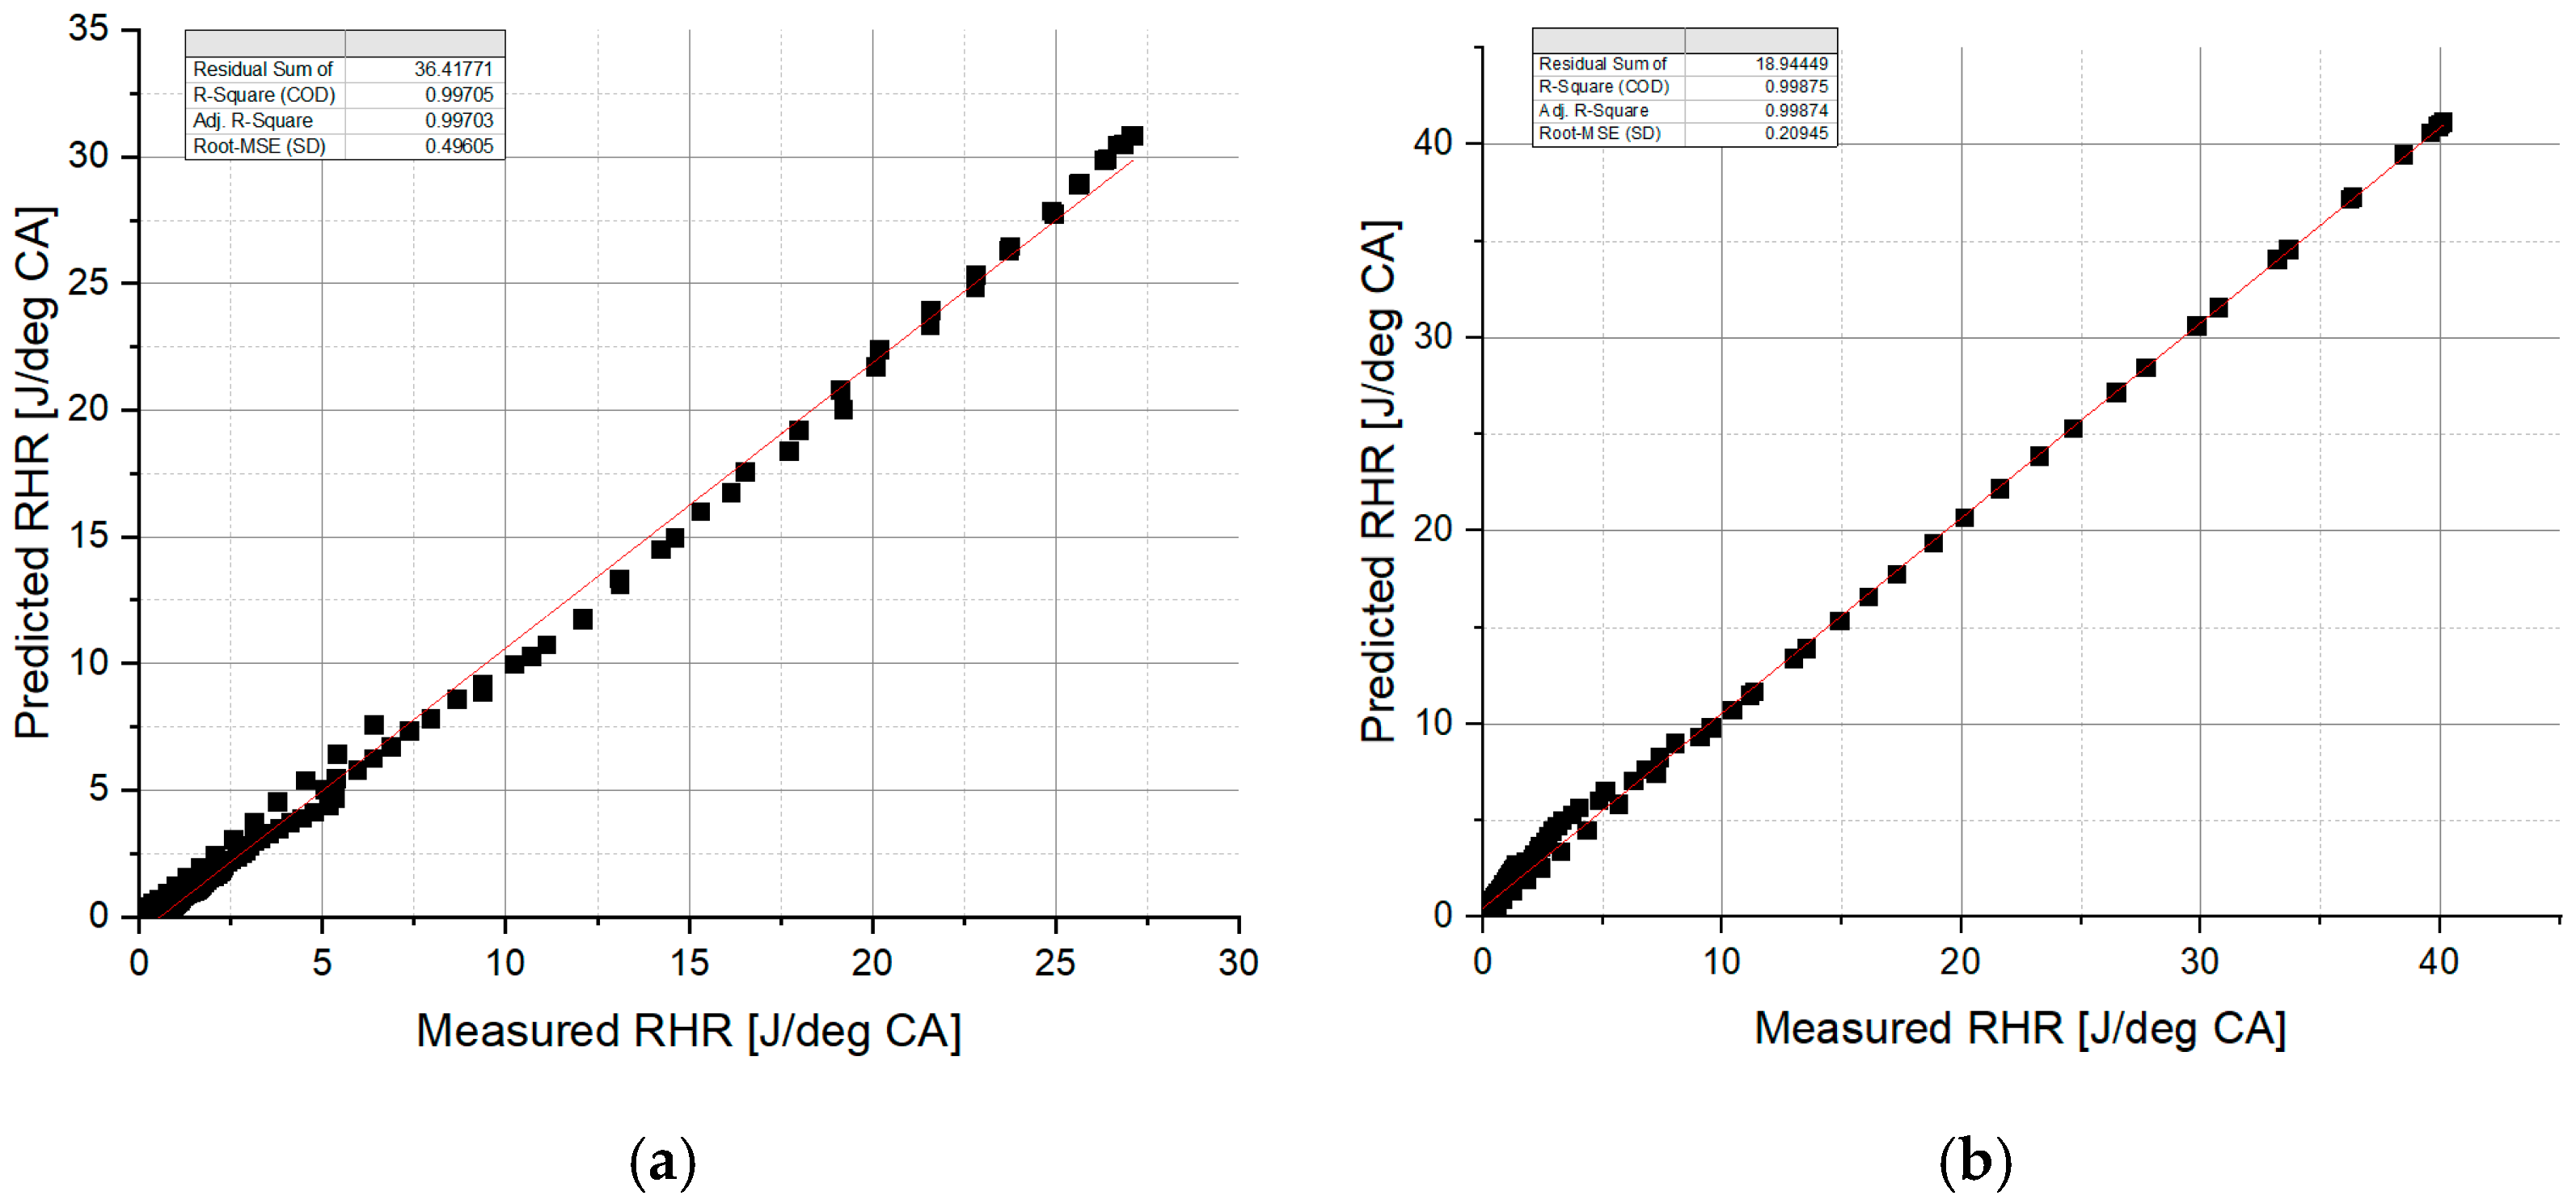
For the sake of the of heat release, the procedure described in [24] is employed and the obtained results accompanied with RMS error analysis are shown in Figure 8 and Figure 9.
The aforementioned conclusions remain valid, considering that the deviation between the experimental and numerical data remained below 3% while the peak heat release moment deviation was below 2° CA. In addition, the pressure rise encountered with the closed baffle configuration exhibited an accelerated rate of heat release. The RMSE analysis showed slightly increased values; however, they remain at an acceptable level.
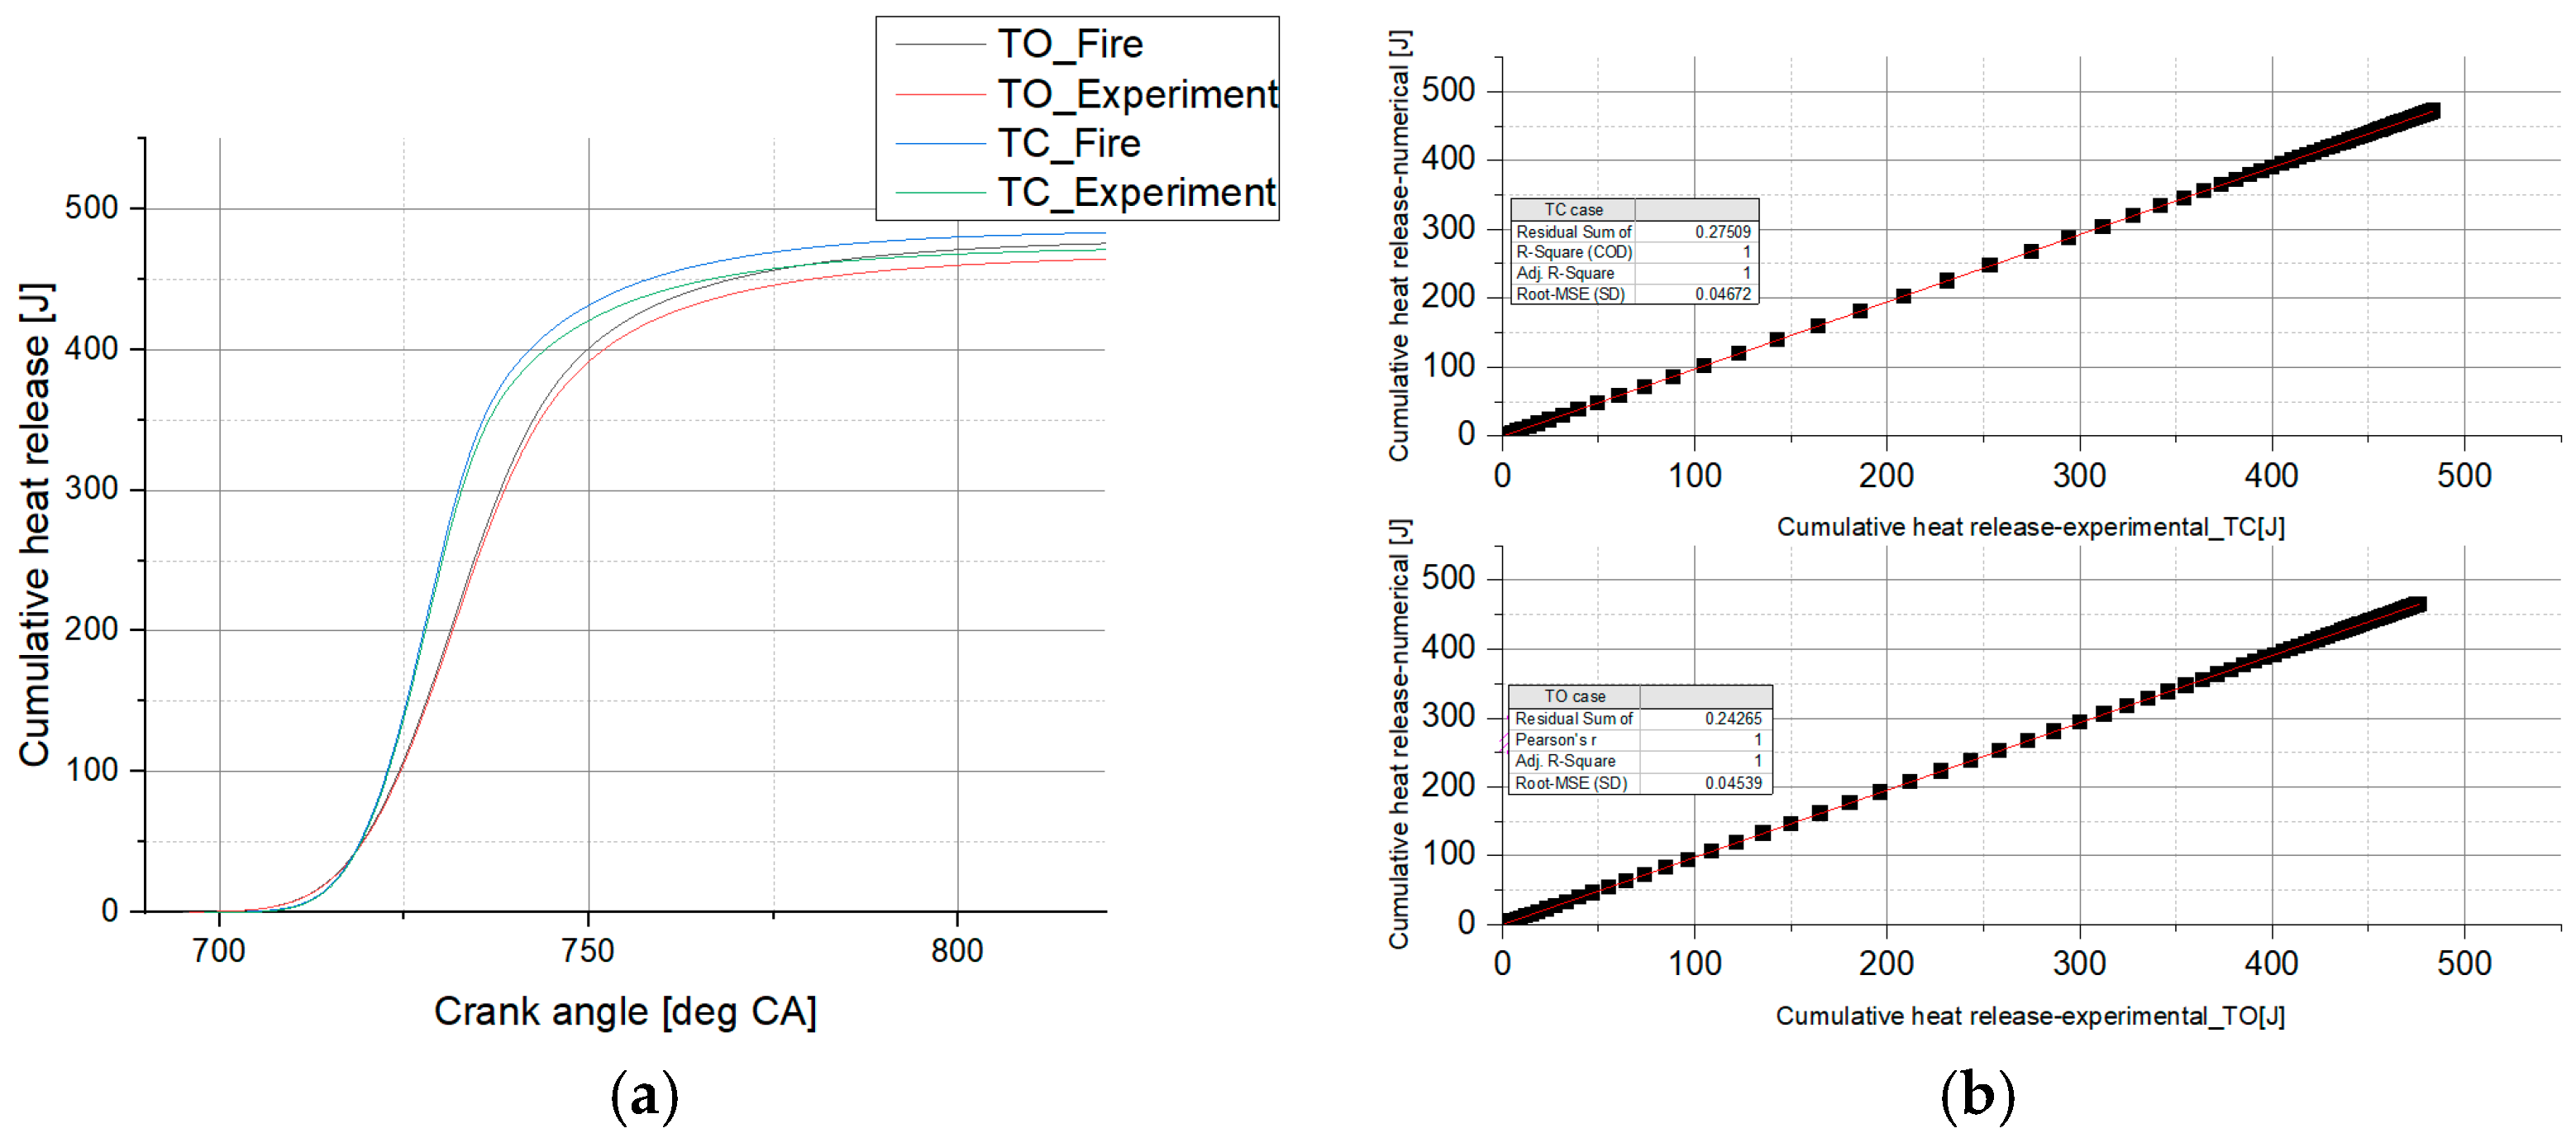
Figure 10 presents the cumulative heat release diagram accompanied by the RMSE analysis. For the sake of better visualization, all cumulative heat release curves are displayed together.
Cumulative heat release was incorporated into the validation procedure by numerically integrating the rate of heat release (RHR) curve shown in Figure 6, enabling quantitative analysis of combustion phasing and its impact on power output.
The quantitative validation of the combustion model was extended by analyzing the combustion phasing using the Mass Fraction Burned (MFB) methodology. The following characteristic crank angles were obtained:
  • MFB10, representing the early combustion phase, occurs at approximately 362° ATDC for the baseline configuration, while an earlier onset at 358° ATDC is observed for the modified intake system (TC);
  • MFB50 (CA50), corresponding to the middle of the combustion process, is reached at 375° ATDC for the unmodified case (TO) and 369° ATDC for the modified configuration (TC);
  • MFB90, indicating the end of combustion, is identified at 394° ATDC for the baseline (TO) and 383° ATDC for the modified intake system (TC).
The maximum deviation between simulated and experimental values for all combustion phasing indicators remains below 2° CA, confirming the model’s capability to accurately predict flame propagation and combustion timing. Moreover, the close agreement in MFB10, MFB50, and MFB90 values demonstrates that both early flame development as well as main combustion phase are well-captured numerically.
Therefore, it can be concluded that the proposed numerical model accurately predicts the in-cylinder process under study and is suitable for further research.

3.2.2. Comparison of Engine Output Characteristics

The numerical simulations as well as experimental measurements were conducted at 3300 rpm under stoichiometric conditions.
Brake mean effective pressure (BMEP), derived from dynamometer measurements, decreased by 2.5%, falling from 0.816 MPa in the baseline configuration (TO) to 0.795 MPa in the modified setup (TC). A similar 2.5% reduction was observed in the indicated mean effective pressure (IMEP). The numerical model showed strong consistency with experimental data, as the deviation in IMEP remained below 5% for both cases (1.012 vs. 0.966 MPa for baseline (TO) and 0.988 vs. 0.941 MPa for modified (TC)). Furthermore, the indicated efficiency, calculated using an air–fuel ratio of 14.7 kg/kg and a lower calorific value of 43,500 kJ/kg, exhibited a decrease of approximately 1.5%, shifting from 36.28% to 35.74%.

3.3. Numerical Results and Discussion

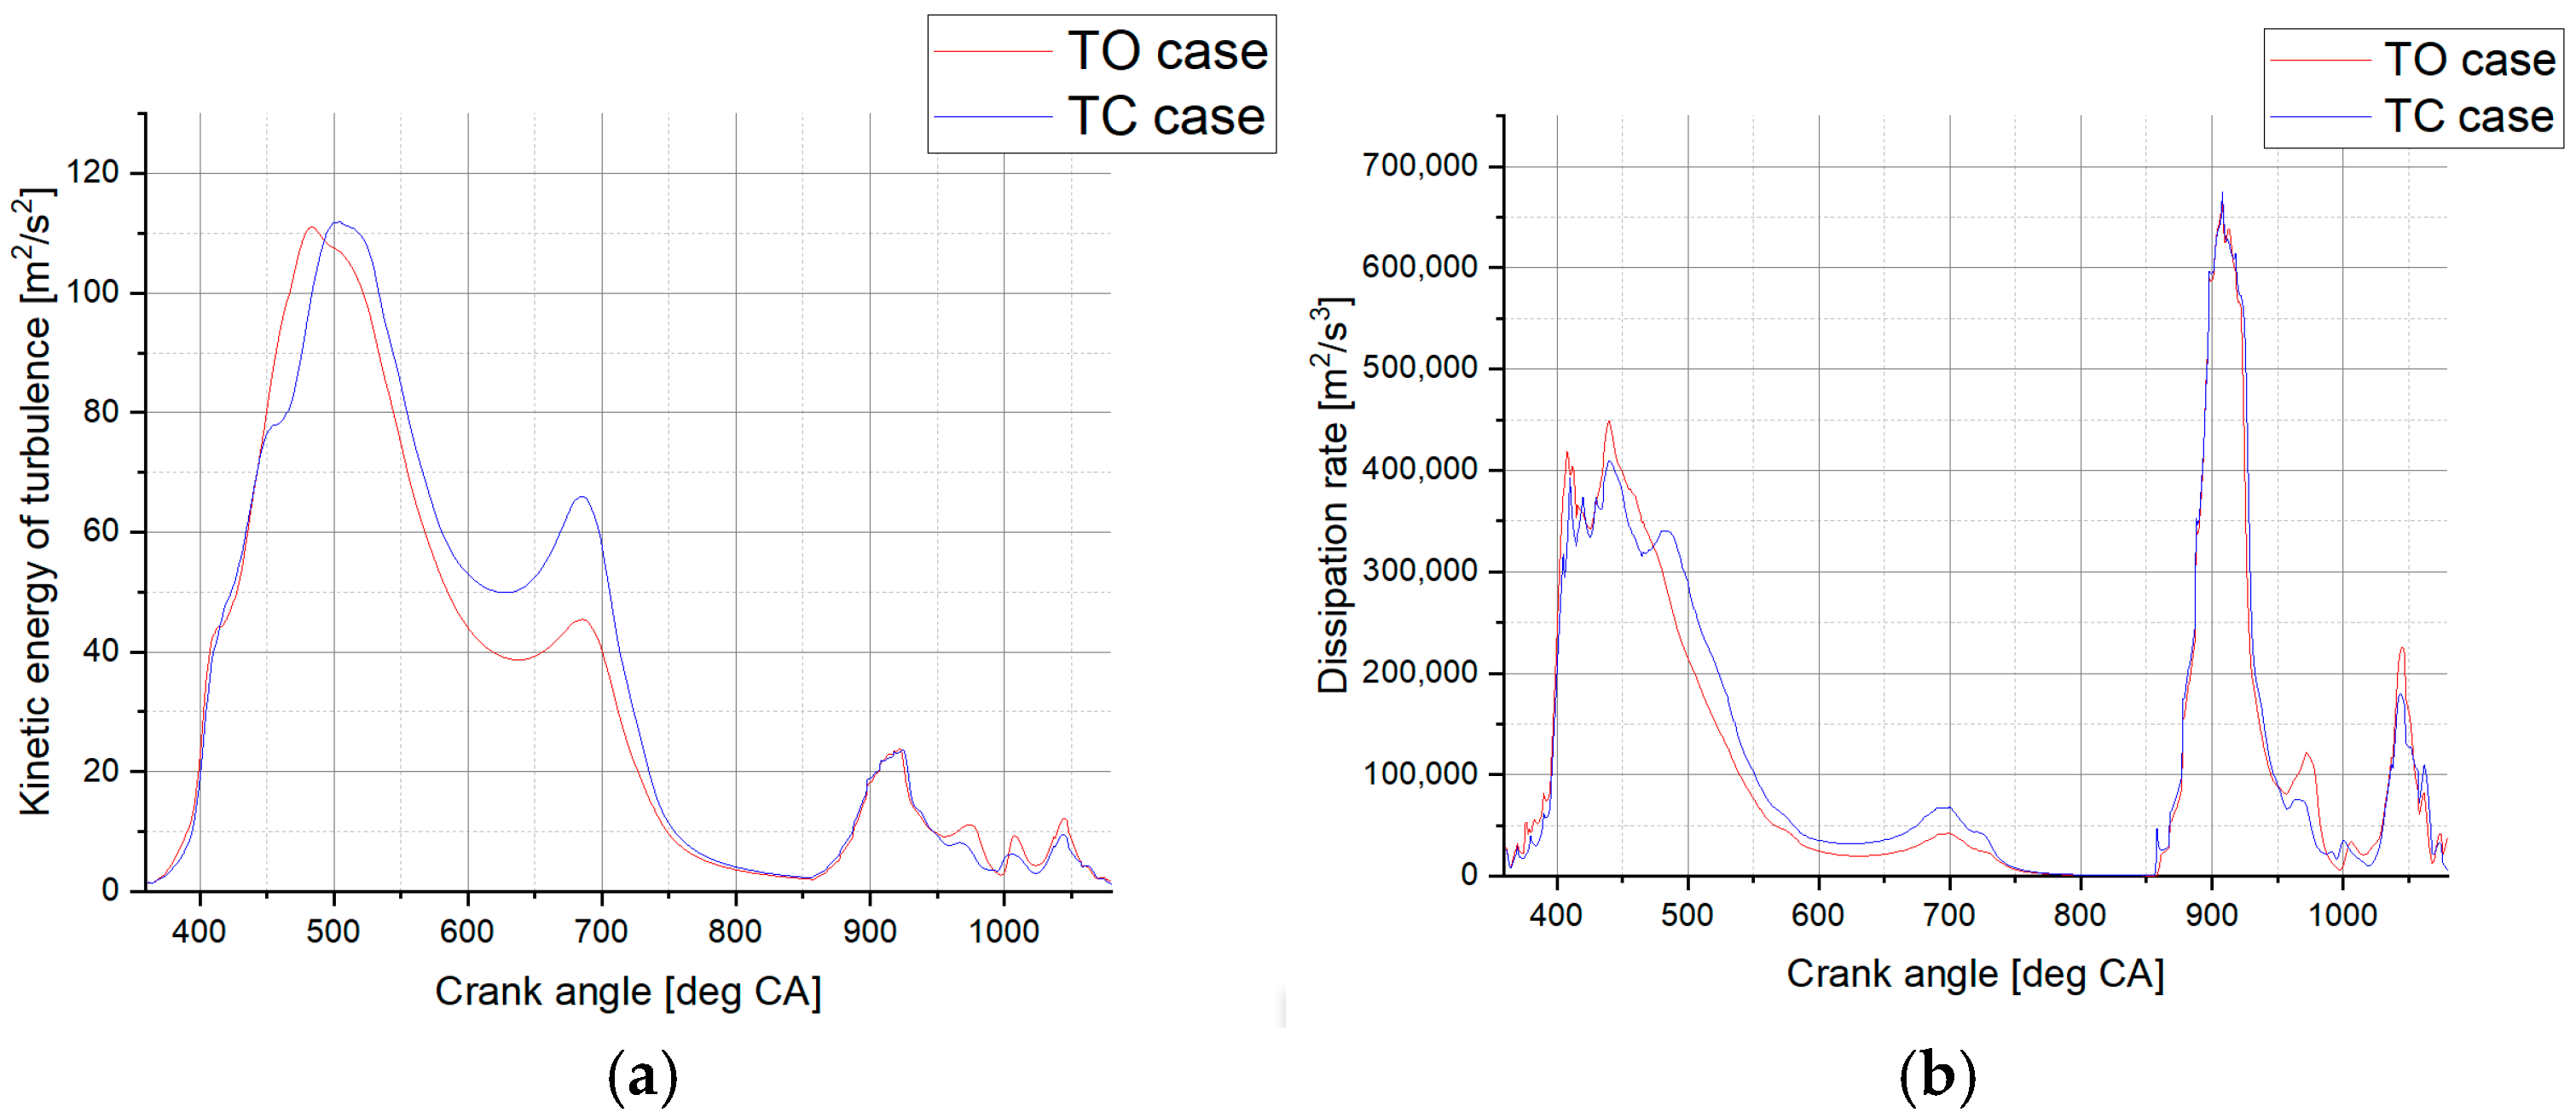
Figure 11 presents the crank angle-resolved evolution of in-cylinder turbulent kinetic energy and its dissipation rate.
It is clearly evident that there are no significant qualitative differences between the two cases considered. The first maximum level is achieved during the induction stroke, near bottom dead-center. For the modified intake manifold, the increased intake flow causes a phase shift in the TKE profile, resulting in a later peak. However, the difference in maximal values is barely discernible, remaining below 1%. During the compression stroke, the influence of the intensified intake flow gradually attenuates, leading to a reorganization of the fluid flow pattern. At this stage, only quantitative differences persist. The second peak is reached during the latter part of the compression stroke at almost identical crank angles, consistent with the ‘spin-up’ theory as a consequence of angular momentum conservation. However, the difference in peak values is now clearly pronounced, with the modified intake manifold showing an increase of approximately 50% due to the intensified flow field generated during the intake stroke. The ignition timing coincides with a high level of turbulence, thereby enhancing initial flame kernel development and decreasing ignition delay. Later, during compression stroke and combustion, all the differences encountered gradually attenuate, yielding the conclusion that turbulent diffusion is of predominant importance. In that manner, the specific effects of the modified intake manifold also attenuate casting doubt on any significant positive effects on overall engine performance.
The evolution of the fluid flow pattern and flame propagation is presented across three different cut planes:
  • the y-z plane (at x = 21.5 mm), which passed through the intake valve;
  • the x-z plane (at y = −5 mm), which passed through both the intake and exhaust valves;
  • the x-y plane (at z = −1.05 mm), which passed through the squish zone.
To facilitate better comparisons of the fluid flow patterns and flame propagation—particularly where subtle differences existed—specific color scales were employed throughout the analysis.

3.3.1. Fluid Flow Pattern During Induction Stroke

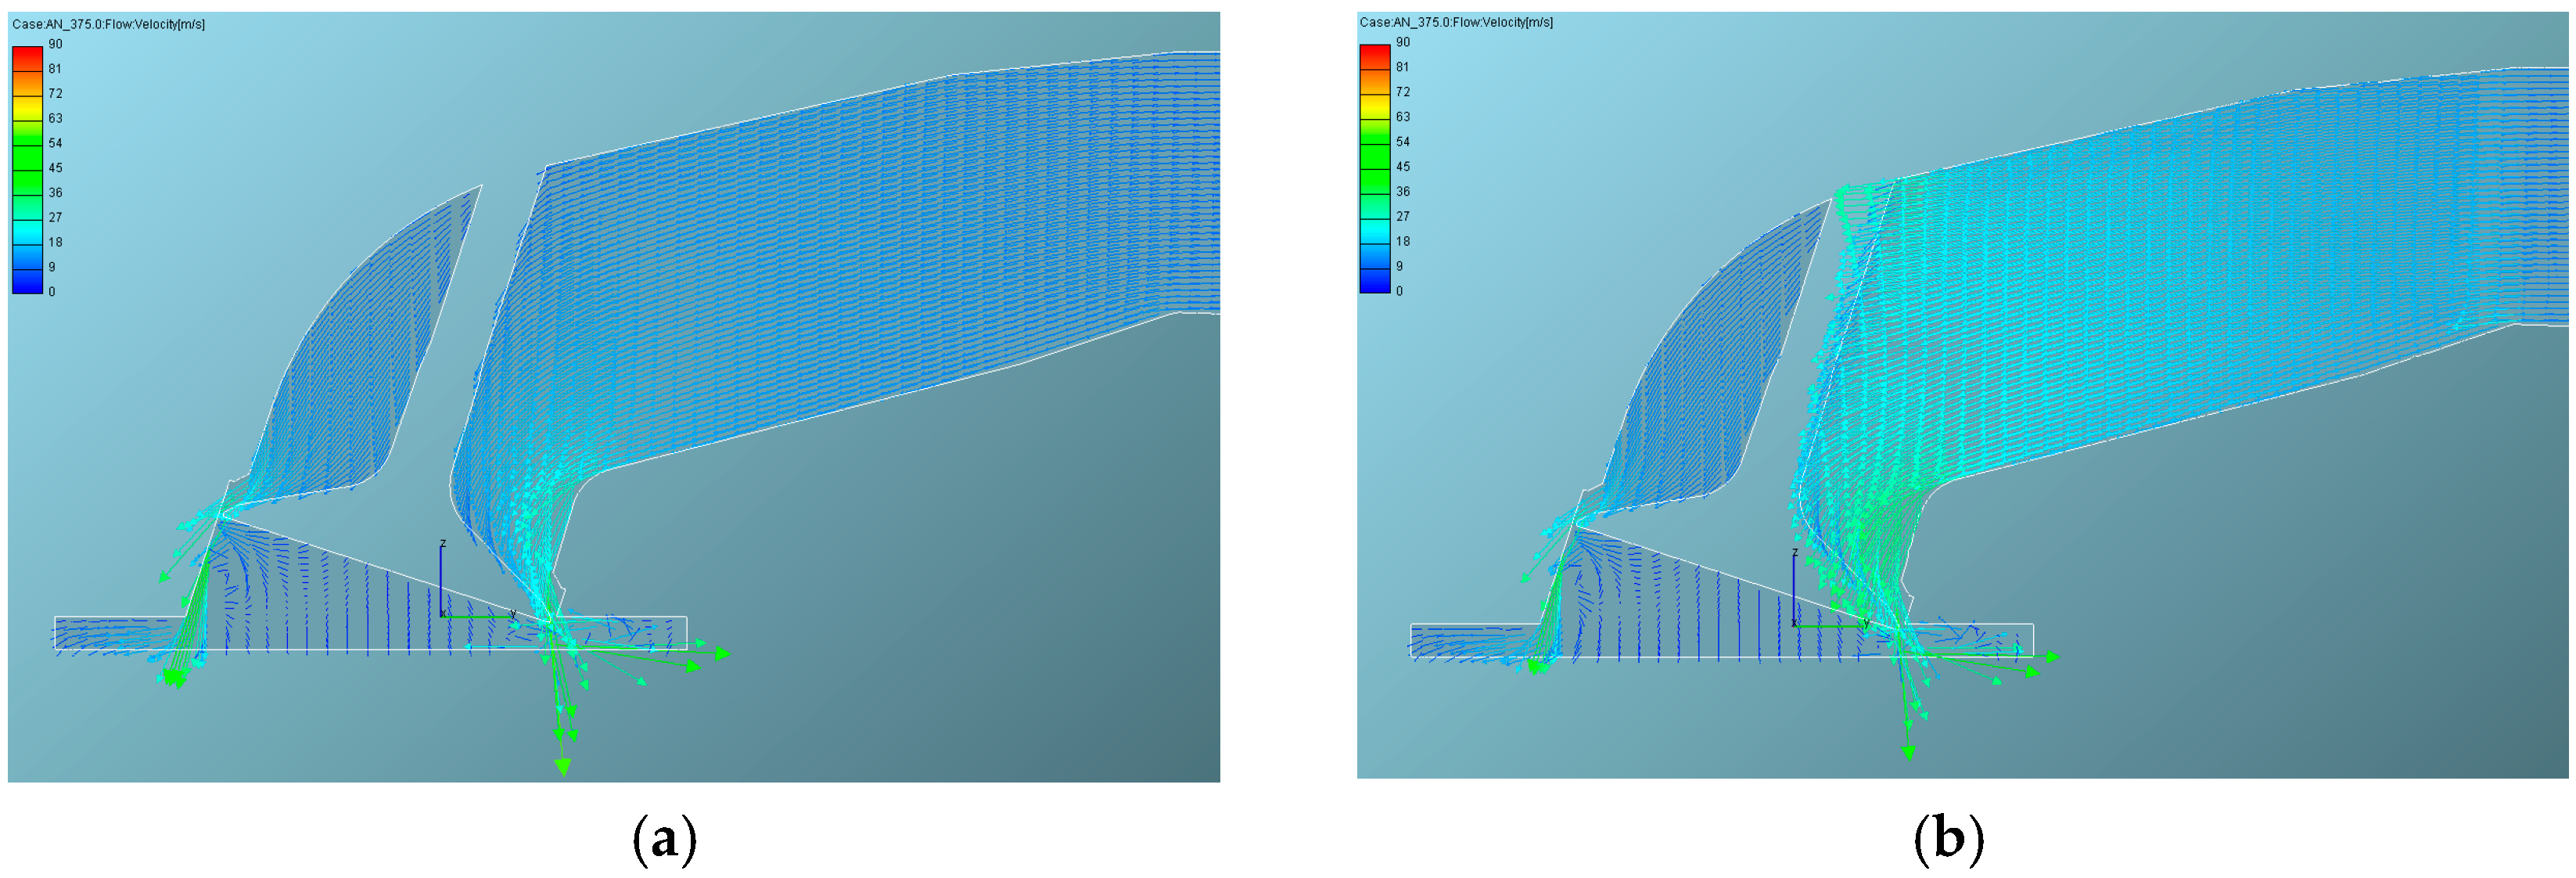
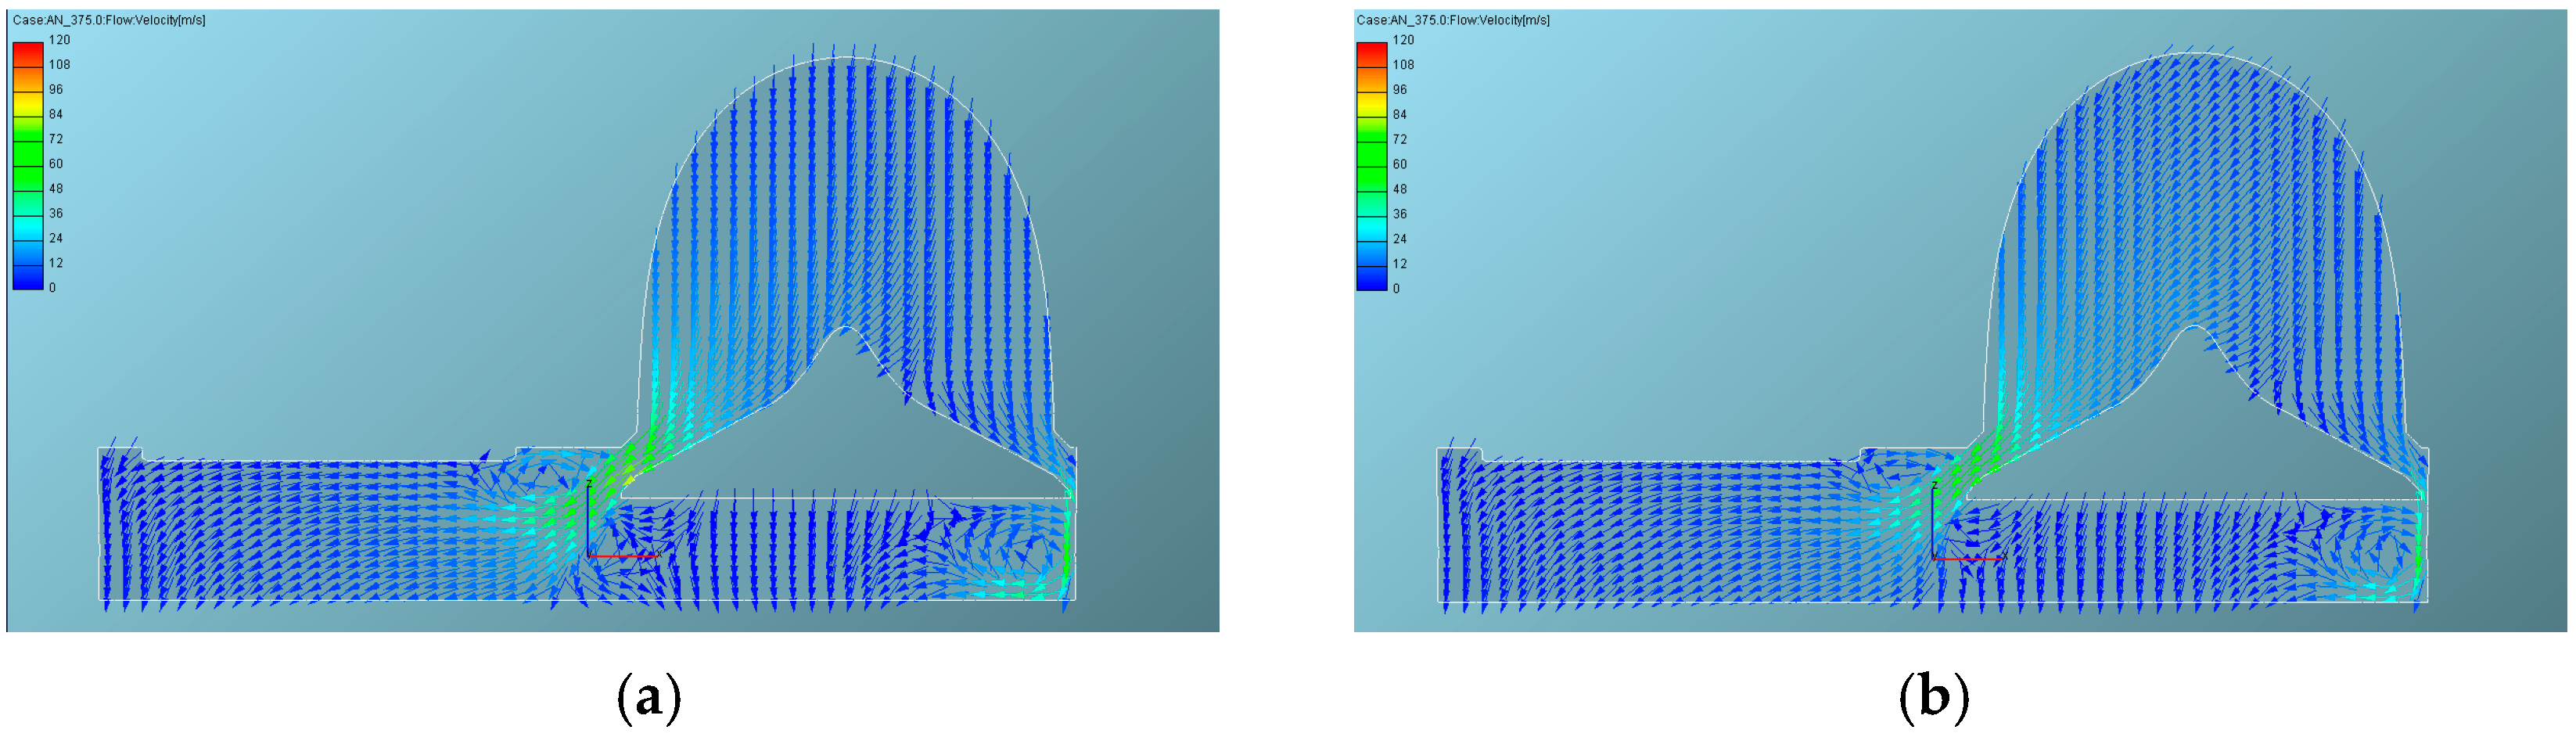
Figure 12 and Figure 13 illustrate the fluid flow patterns, represented as vectors, at the beginning of the induction stroke (15° ATDC) for both investigated cases in the y-z and x-z planes, respectively.
It is observed that the major portion of the intake flow impinges upon the piston crown, where it subsequently curls to initiate a vortex structure around the y-axis, with its center of rotation located beneath the exhaust valve. A smaller fraction of the intake jet strikes the cylinder wall and deflects toward the piston crown. This flow then recirculates and hits the intake valve face, promoting flow separation and creating two vortices located in the immediate vicinity of the intake valve. The fluid flow separation can also be encountered in the zone between intake and exhaust valve, adjacent to the cylinder head. Fluid flow pattern, at this moment, is asymmetrical due to different distances of cylinder wall and piston crown to the intake valve face [25,26]. It can also be encountered that, at this particular moment, fluid flow pattern in the combustion chamber for both cases under consideration is very similar without major differences in shape or intensity. The only difference that can be encountered is located in the intake manifold prior to the intake valve body. Due to the presence of the baffle, the intake manifold flow area is decreased, thus yielding to the intensification of the intake jet, still, without significant effects on fluid flow pattern and intensity.
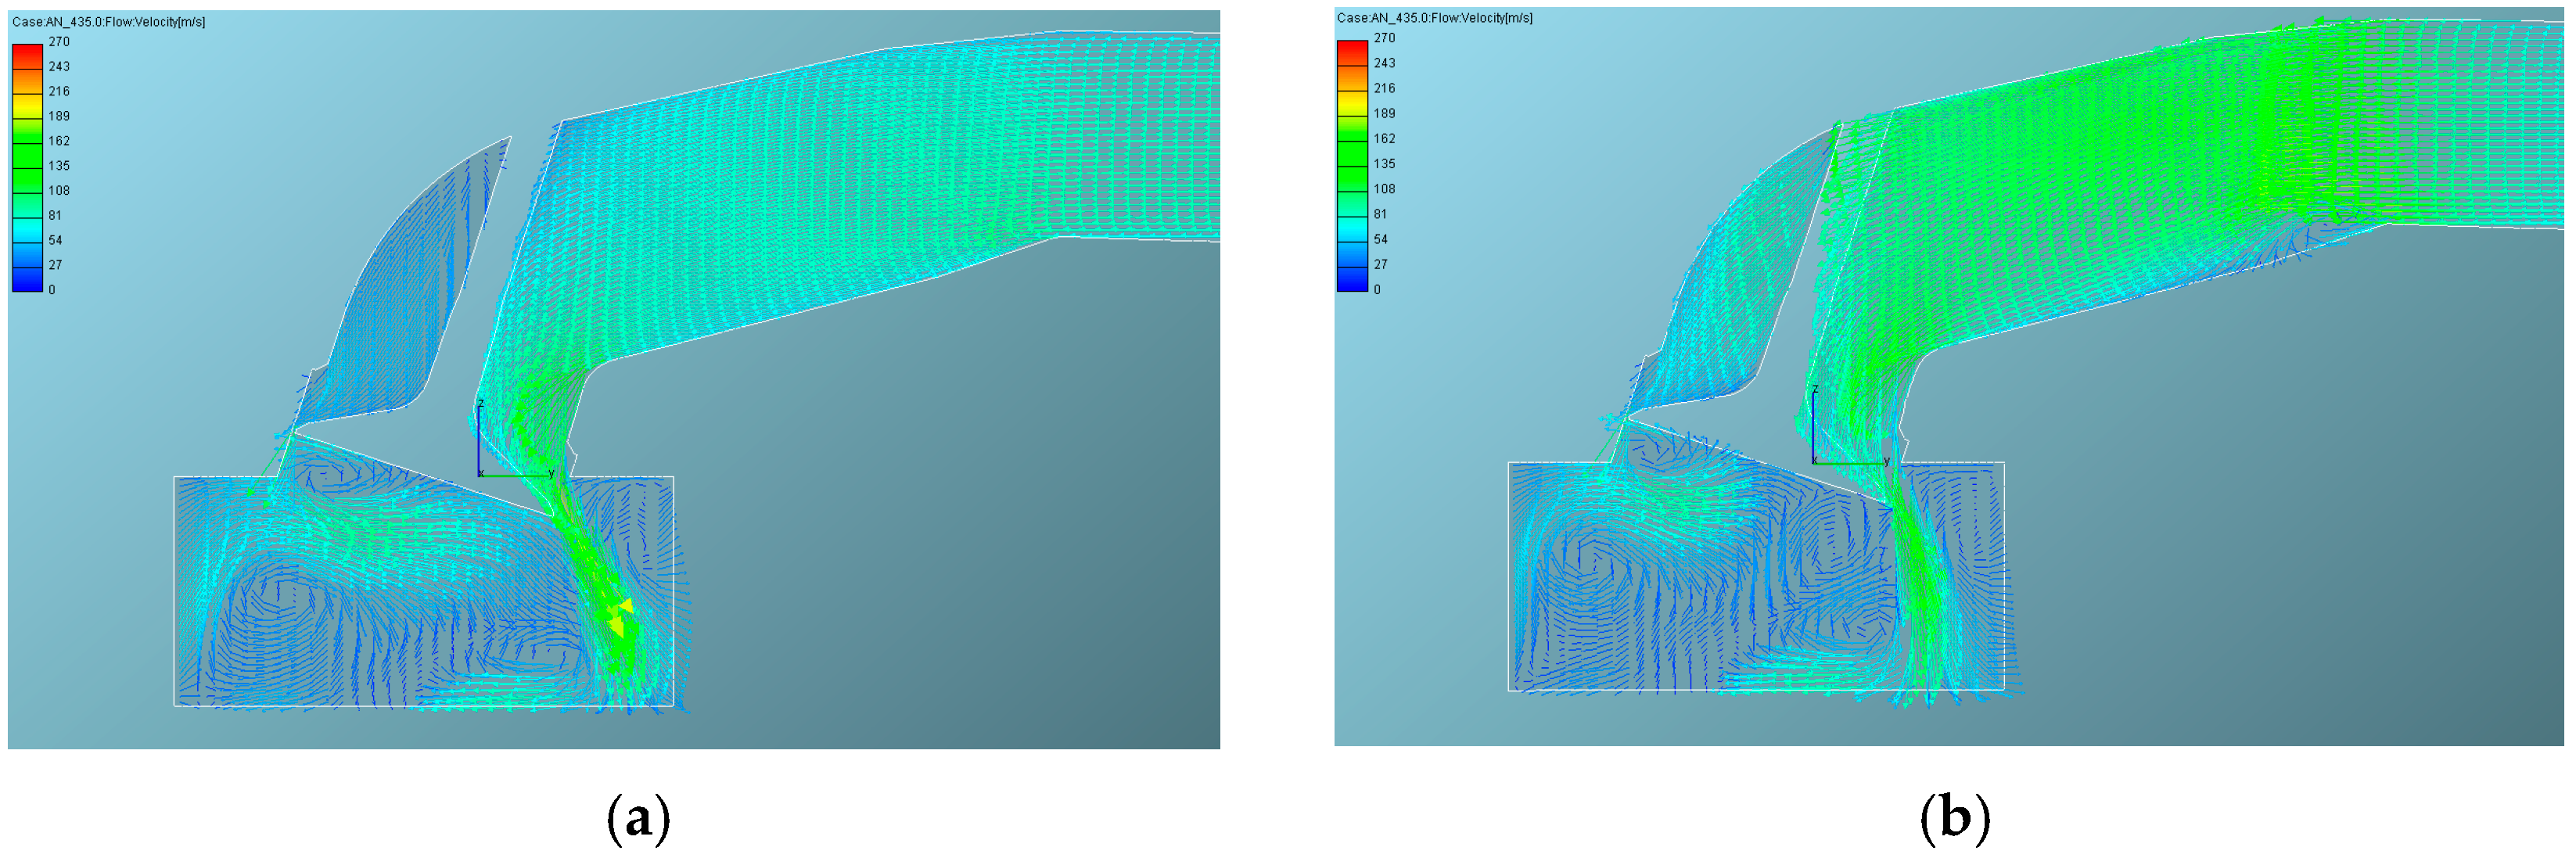
The further piston displacement downward (Figure 14 and Figure 15, 75° ATDC), the increase in the valve lift, and the subsequent increase in intake flow jet generate the formation of reverse tumble with center of rotation in the zone beneath the exhaust valve. Smaller vortices located beneath the intake valve still persist, thus yielding to further fluid flow separation. The fluid flow pattern in both cases under consideration is, qualitatively, the same. Only, some minor differences in the flow intensity caused by the intensification of the intake jet can be encountered.
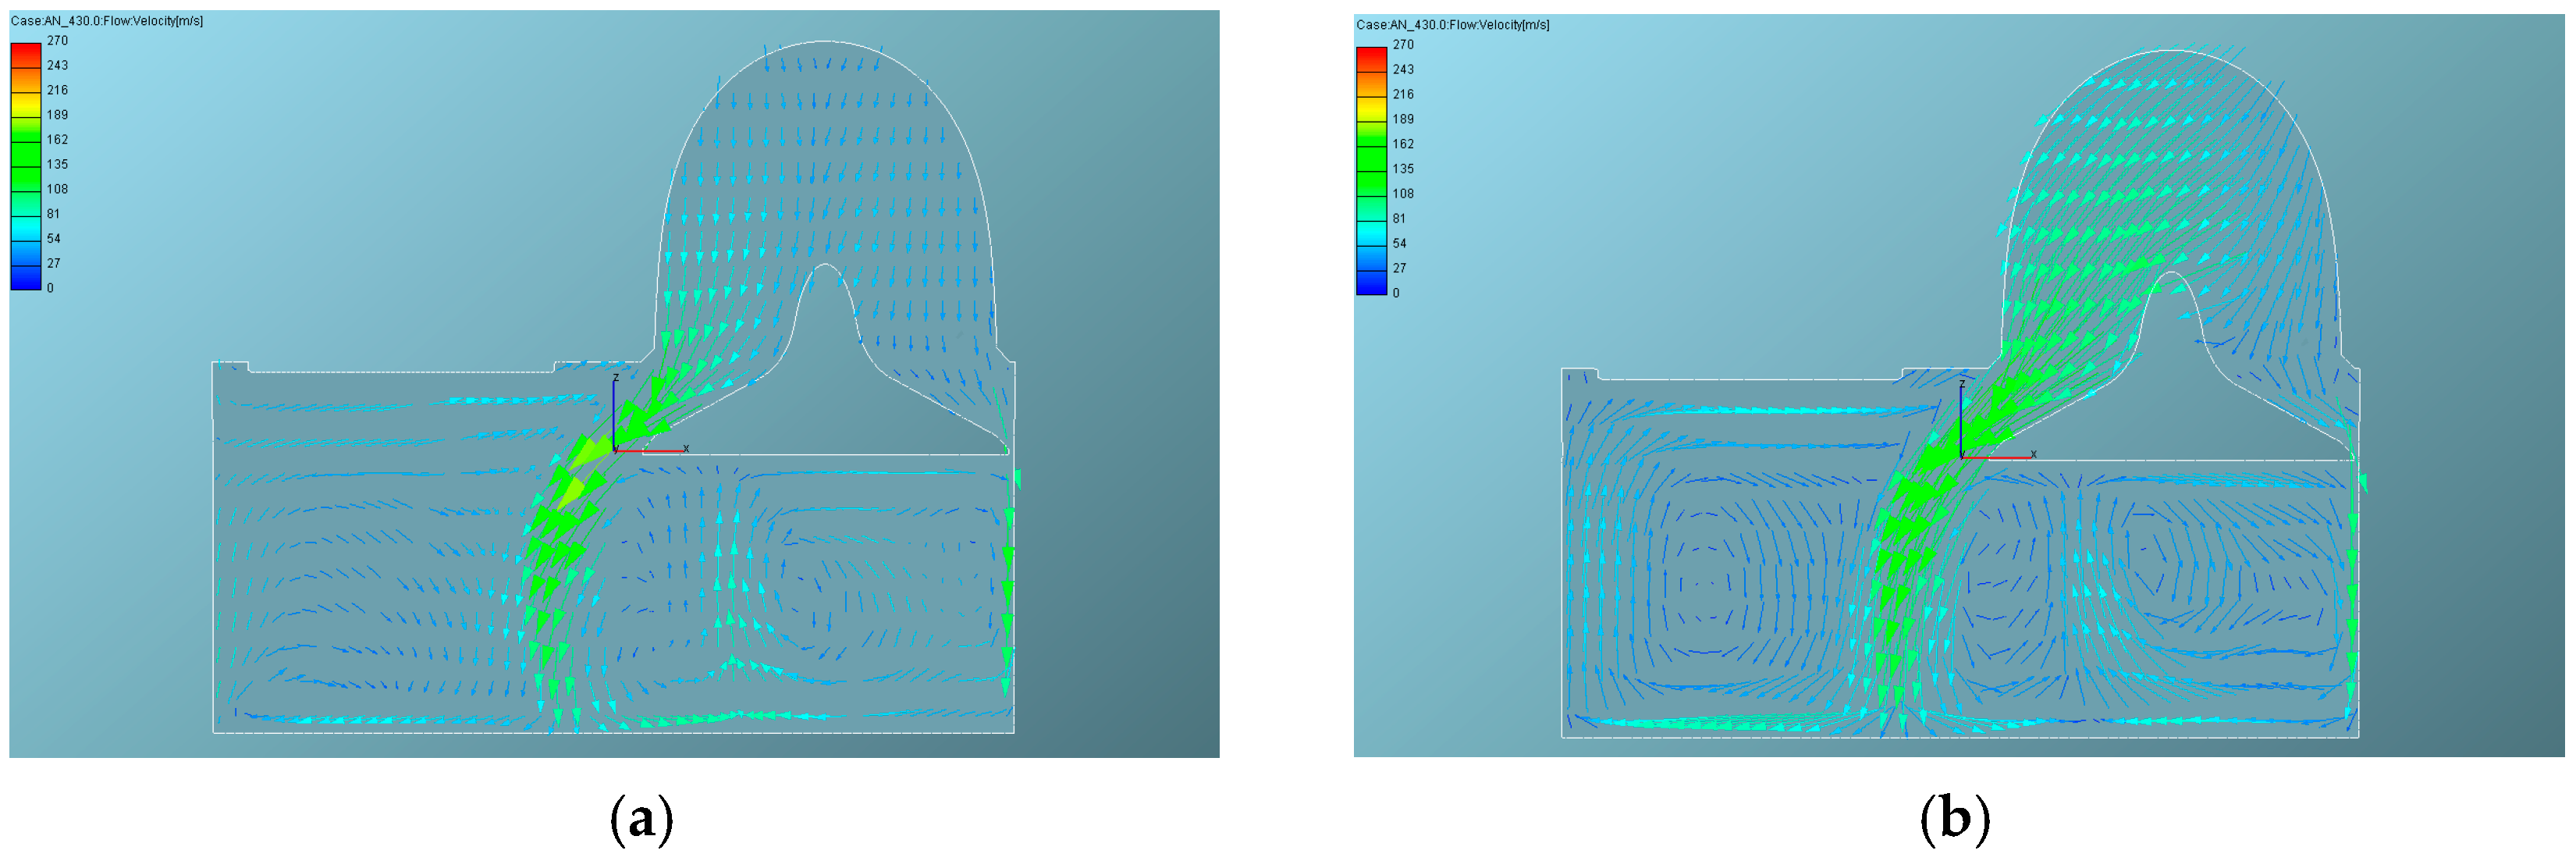
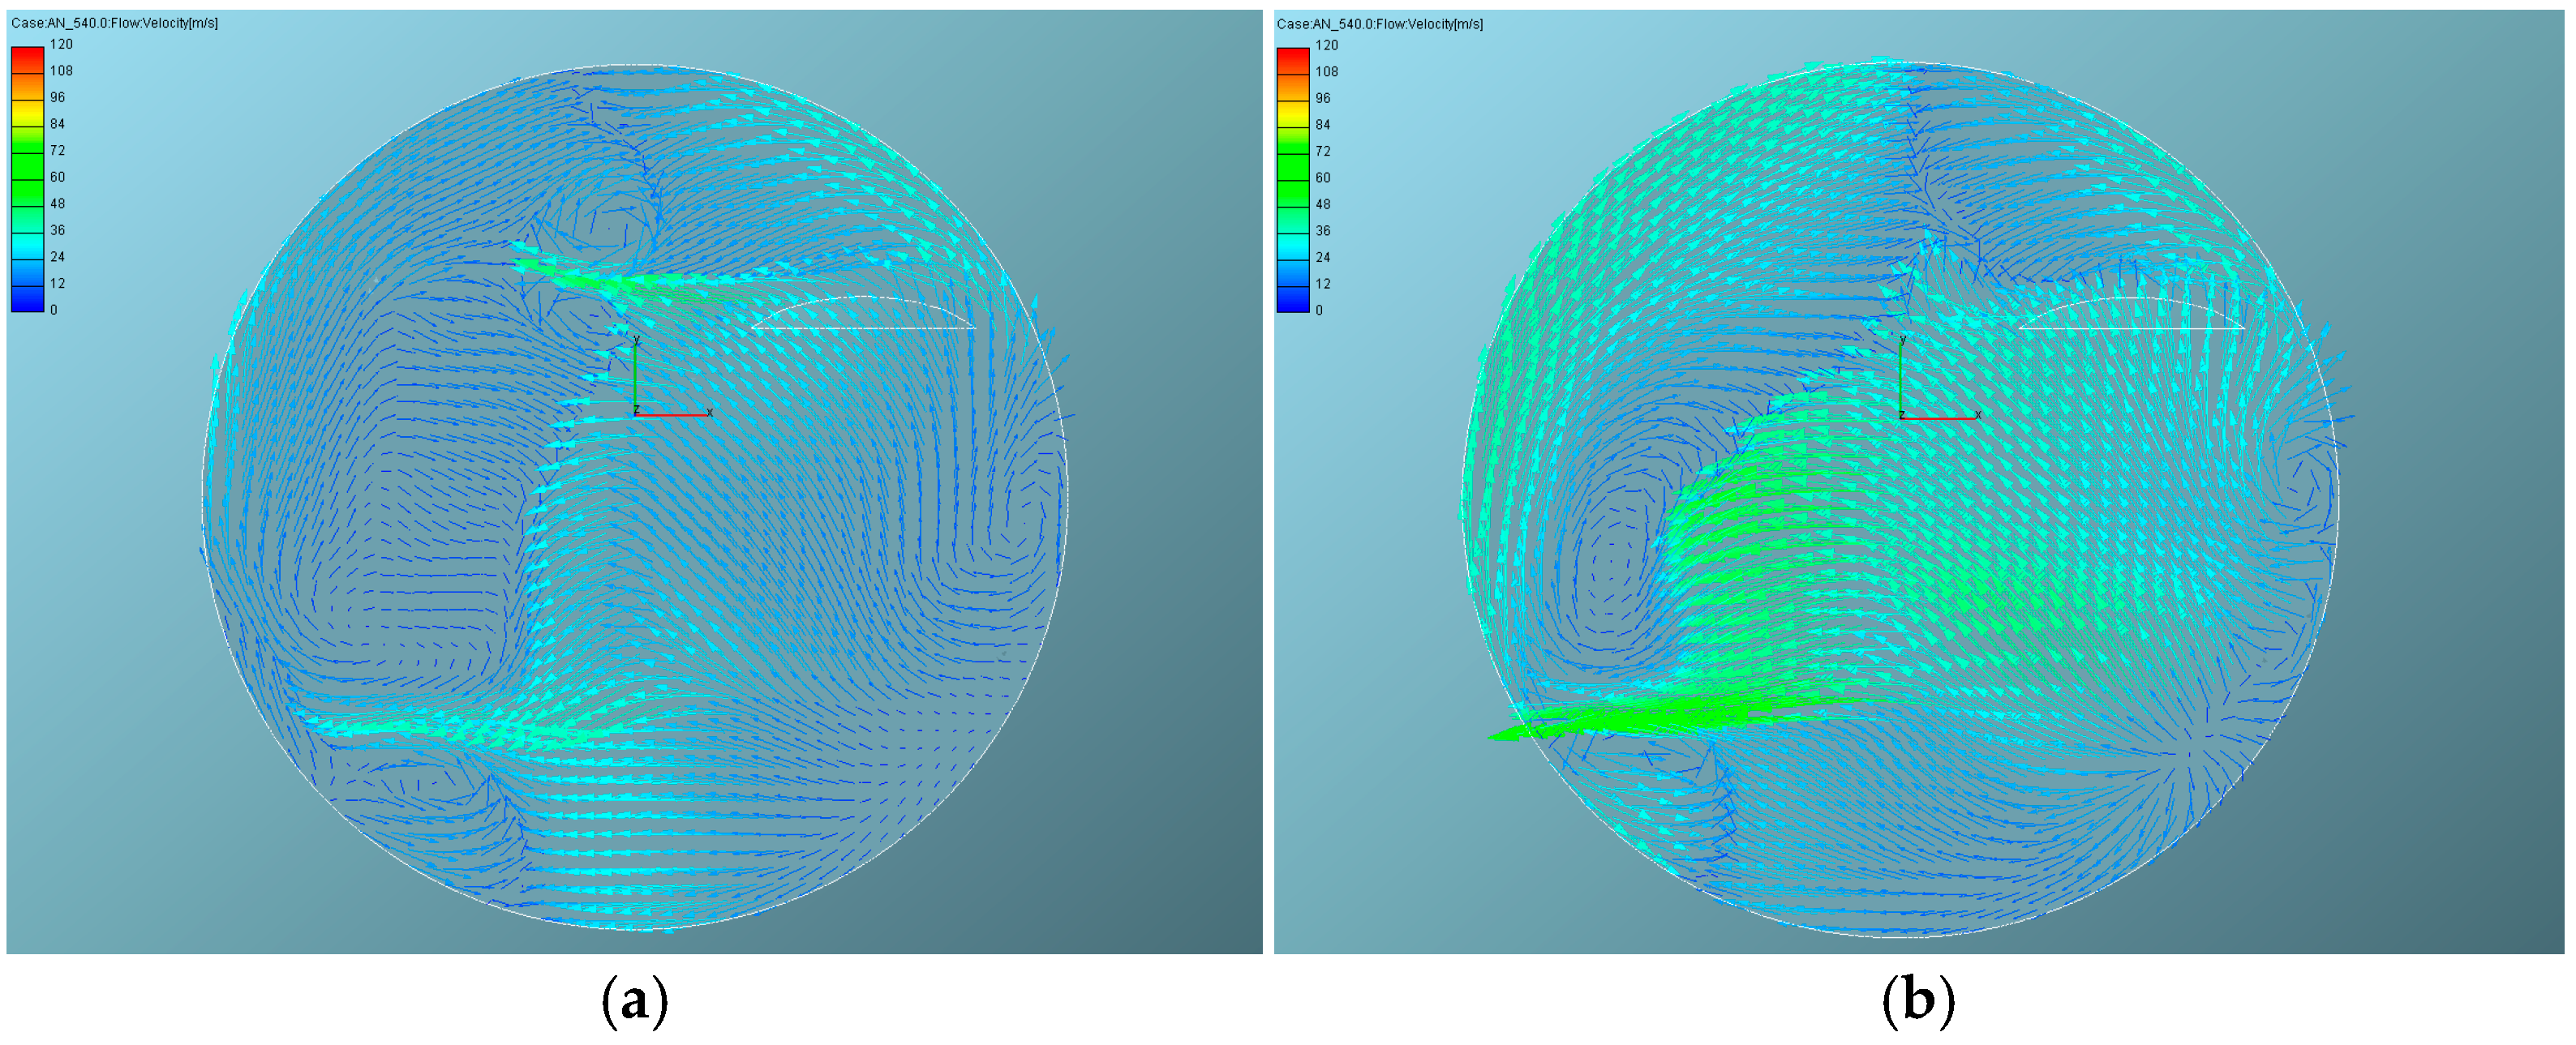
At 180° ATDC (Figure 16a), well-formed tumble engulfs the combustion chamber and dominates the fluid flow pattern. The conflict action between tumble vortex and smaller vortices located at the side of the chamber is encountered, yielding to their deflection. In the case of closed baffle (Figure 16b), due to increased intake jet, fluid flow separation is, still, clearly legible and the tumble center of rotation is located in the lower part of the chamber in contrast to the open baffle case where tumble center of rotation is located in the upper part of the chamber. Also, the conflict action between tumble and side vortices located beneath the intake valve, which are of greater intensity than in the open baffle case, can be encountered. Due to this, the tumble is slightly distorted and its center of rotation is less displaced than in the previous case.
A more intensive swirl flow around the z-axis is clearly visible in Figure 17 as a result of the intake modification. Nevertheless, the basic fluid flow structure remains qualitatively identical for both configurations under consideration.

3.3.2. Fluid Flow Pattern During Compression Stroke

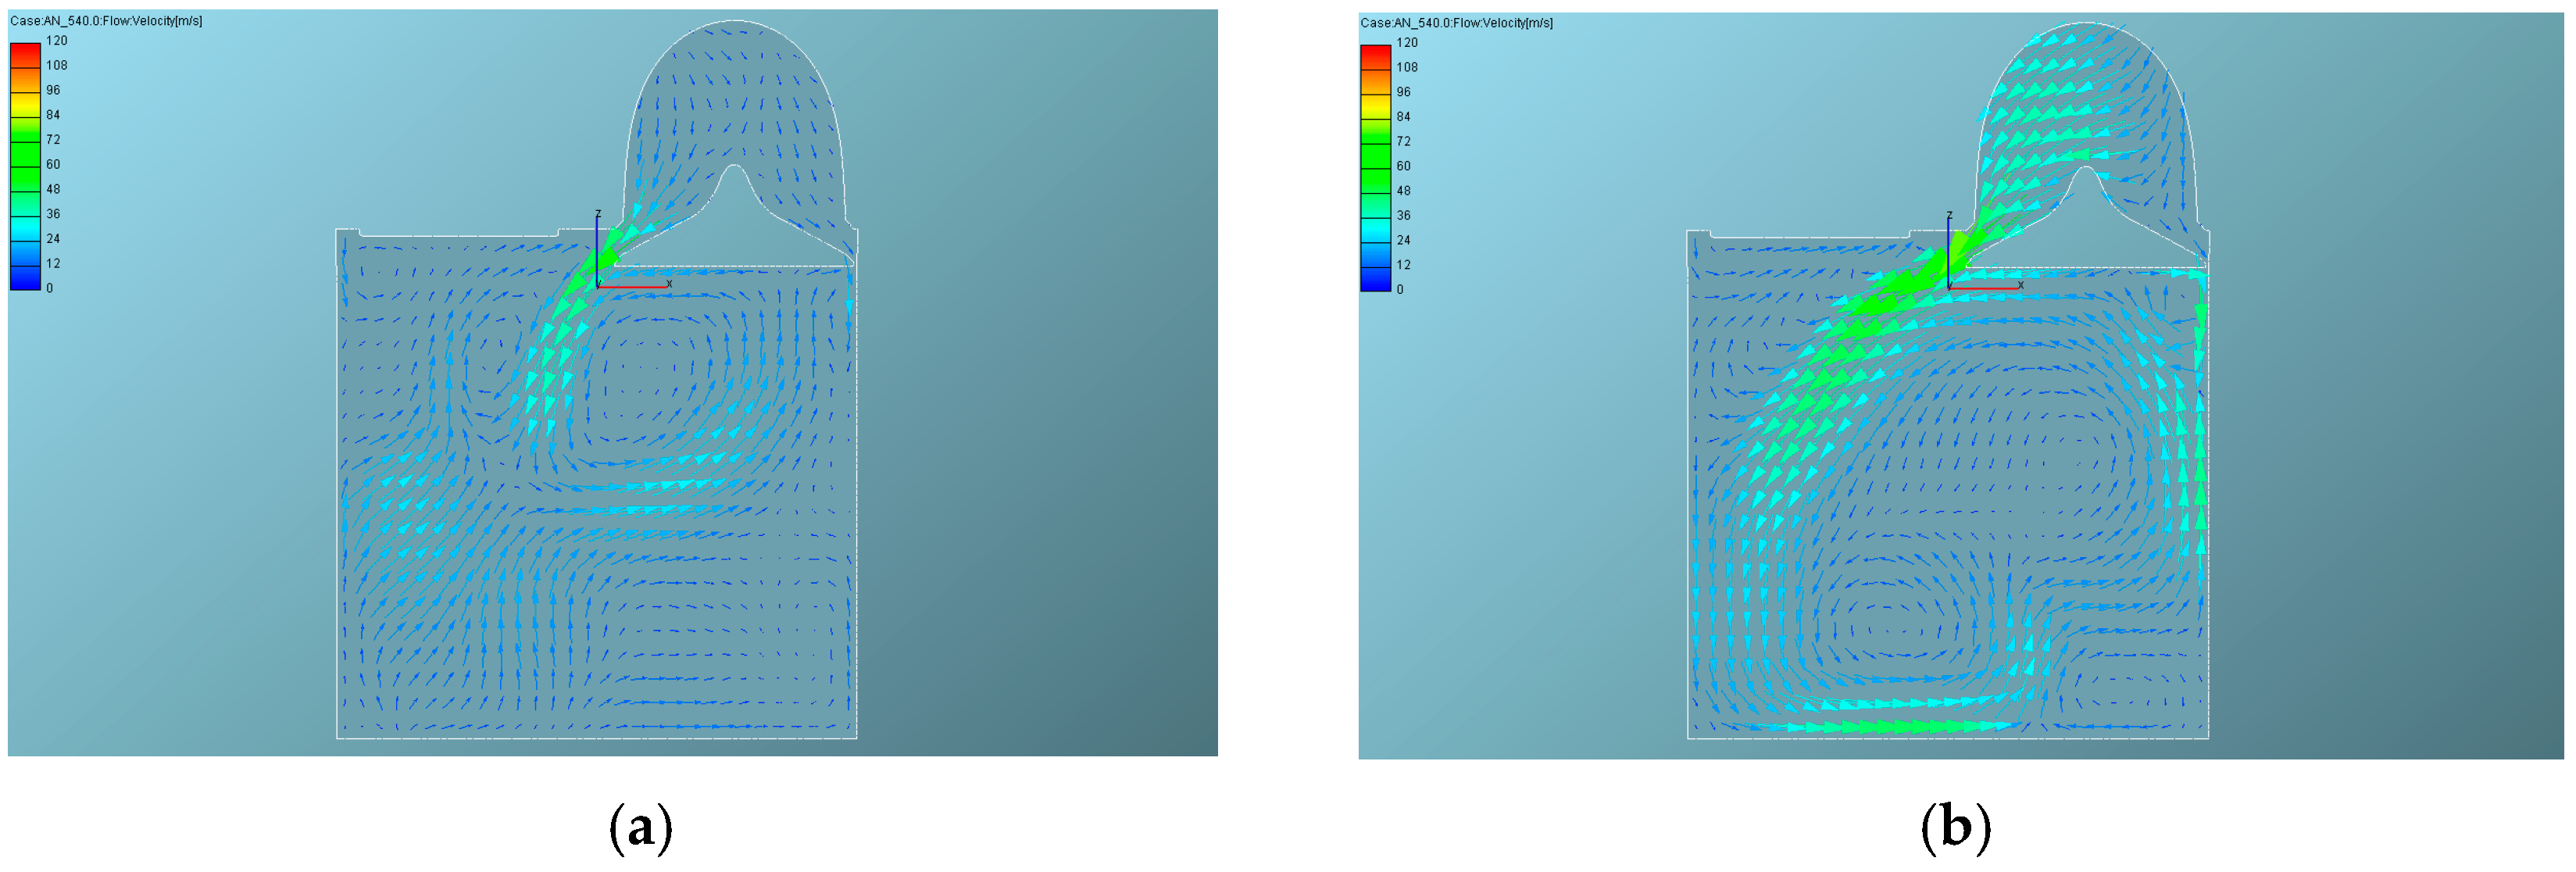
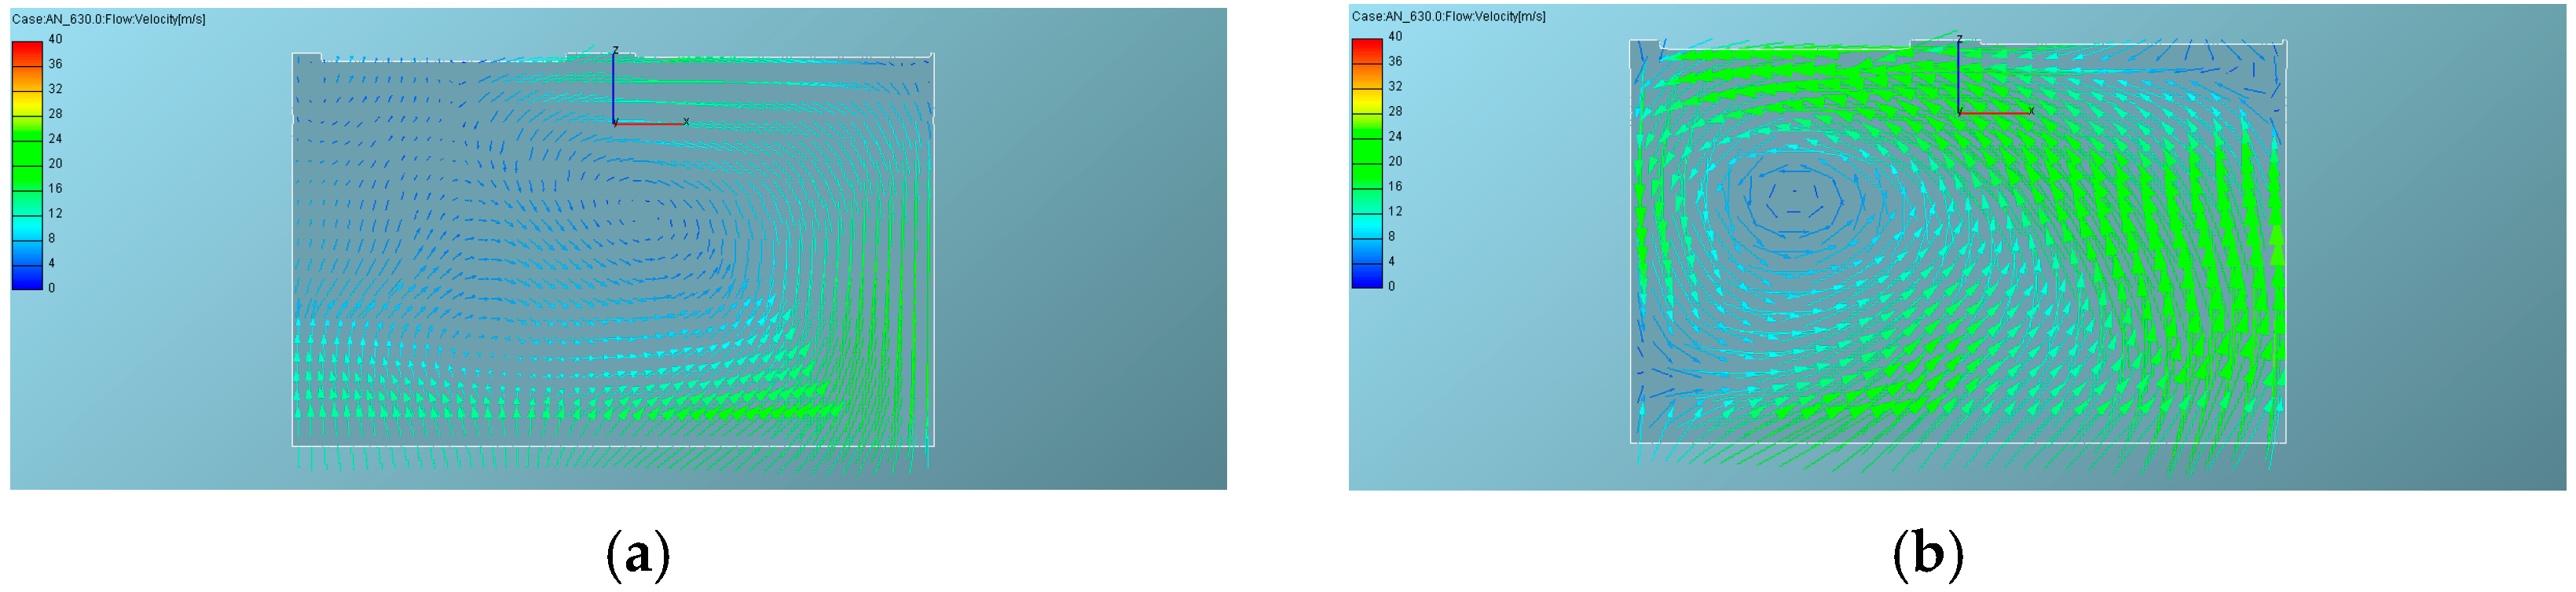
With the intake valve closure, the induction process terminates and the intake jet, as the main part of turbulence production, diminishes. The conditions established during induction reflects the intake port/valve geometry while piston geometry plays a secondary role. During the compression phase, the effects of these, earlier established, initial conditions gradually decays while the piston and cylinder head geometry take the leading role. The change in the direction of piston movement, accompanied with the loss of the intake jet, induces a significant restructuring of the fluid flow, as illustrated in Figure 18 and Figure 19.
The decrease in space in the combustion chamber yields to stretching of the tumble vortex and its center of rotation is gradually displaced towards the exhaust valve [25]. In addition, all the side vortices are destructed as a consequence of tumble vortex dominance. The stretching of tumble motion is accompanied with the rotation on a larger scale, as a consequence of angular momentum conservation, which is in accordance to the “spin-up” effect. All the effects of closed baffle in the intake manifold encountered earlier no longer exist and the fluid flow pattern in both cases is almost identical. Only the differences in form of slightly increased flow velocity can be encountered. It should also be noticed that in the case of unmodified intake manifold, the tumble center of rotation, prior to ignition, is located in the middle of the combustion chamber yielding the conclusion that cylinder–piston–valves geometric assembly is well designed because the tumble axis of rotation and the zone with maximal turbulence kinetic energy coincides with the spark plug location. In the case of modified intake manifold, the tumble axis of rotation is located in the zone beneath the exhaust valve and does not coincide with spark plug location. Consequently, it can be expected that positive effects of the increased tumble vortex in case of modified intake manifold will be reduced.

3.3.3. Combustion Phase

The spatial distribution of temperature is used to evaluate flame propagation through the unburnt mixture. The flame front is defined by the zone of peak temperature gradients.
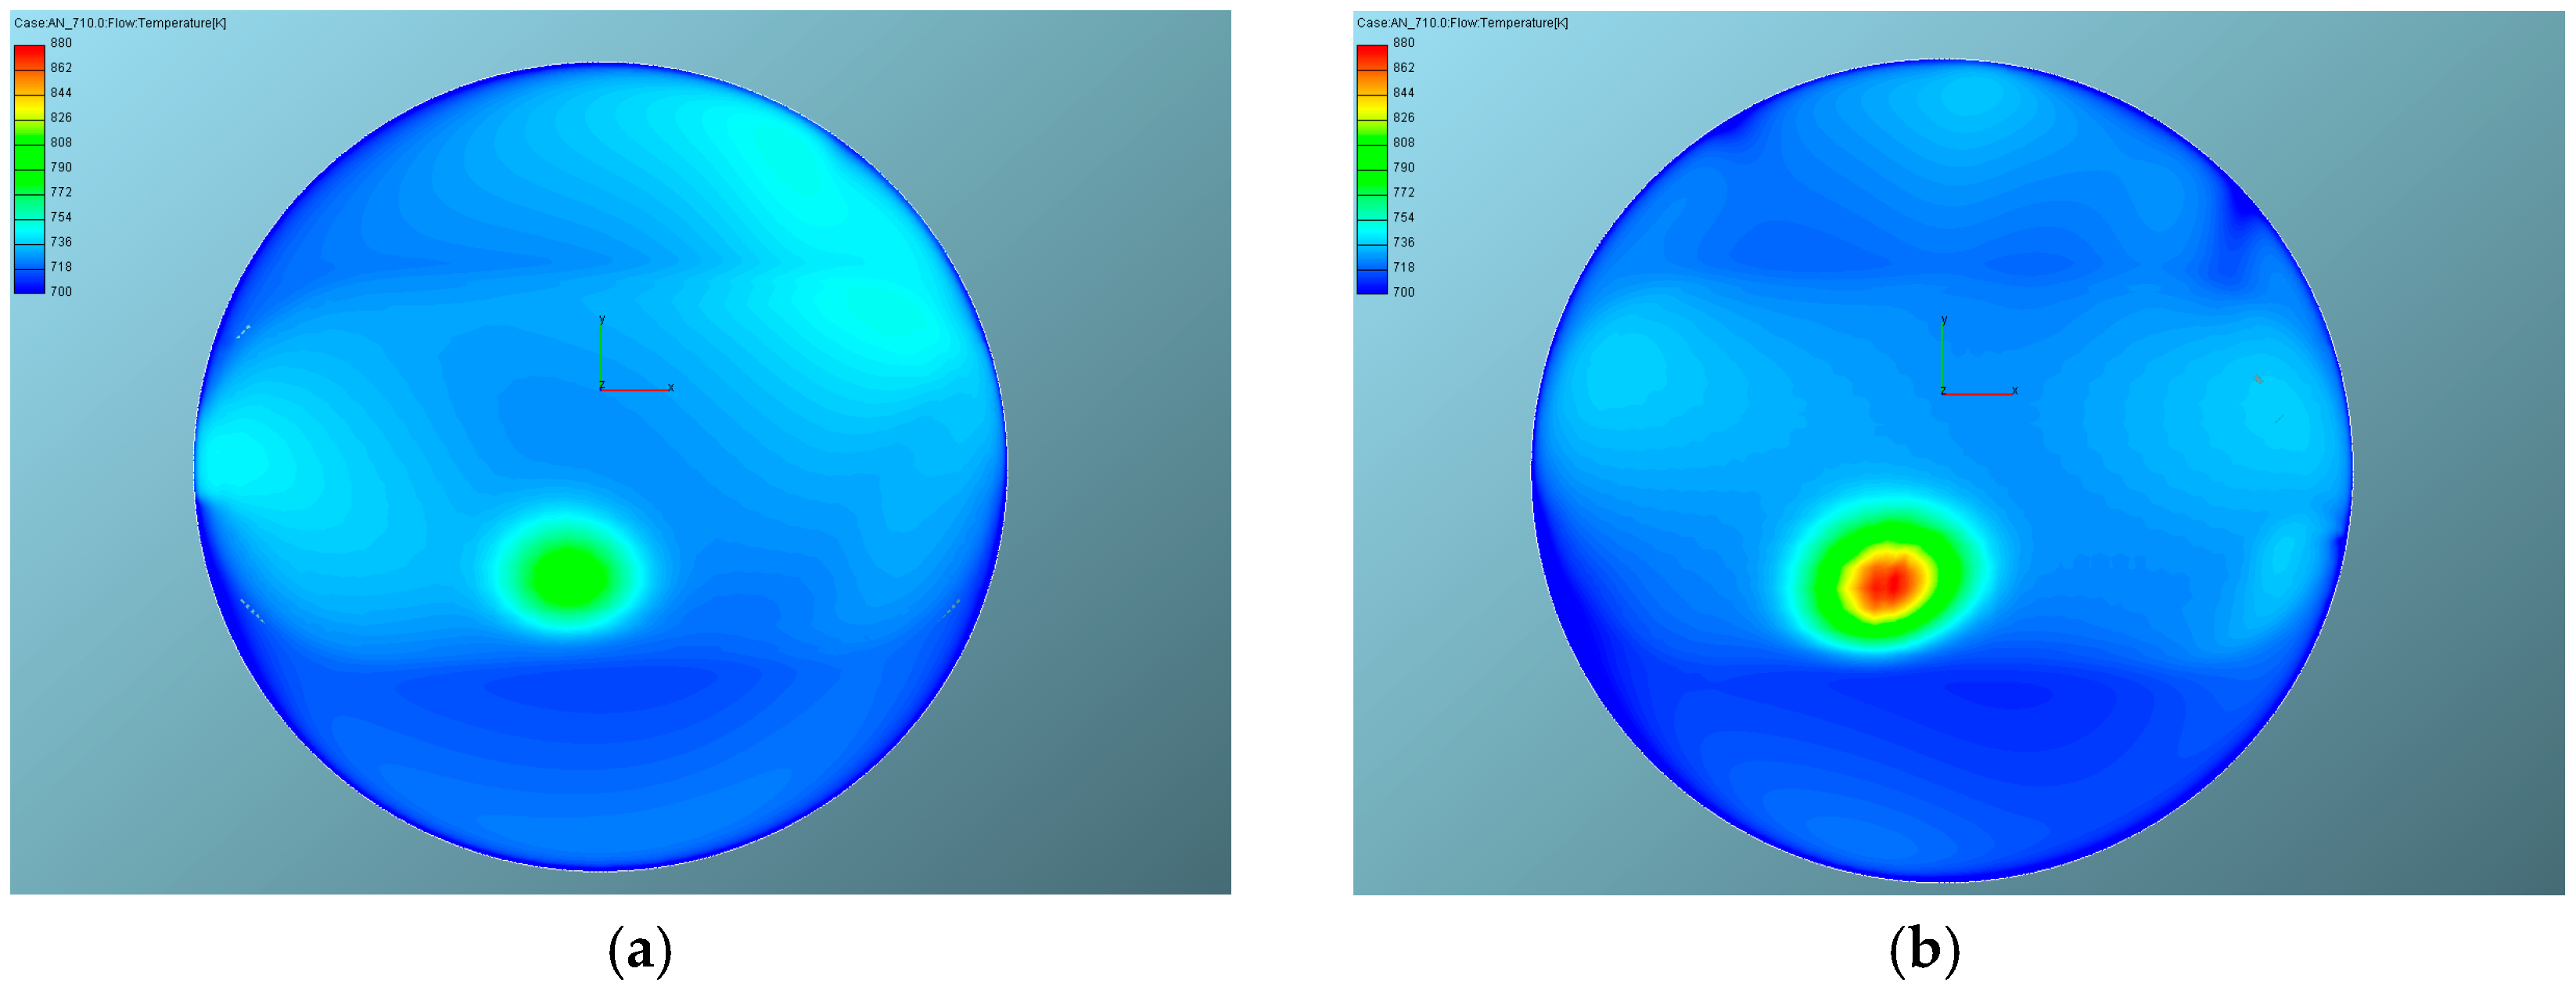
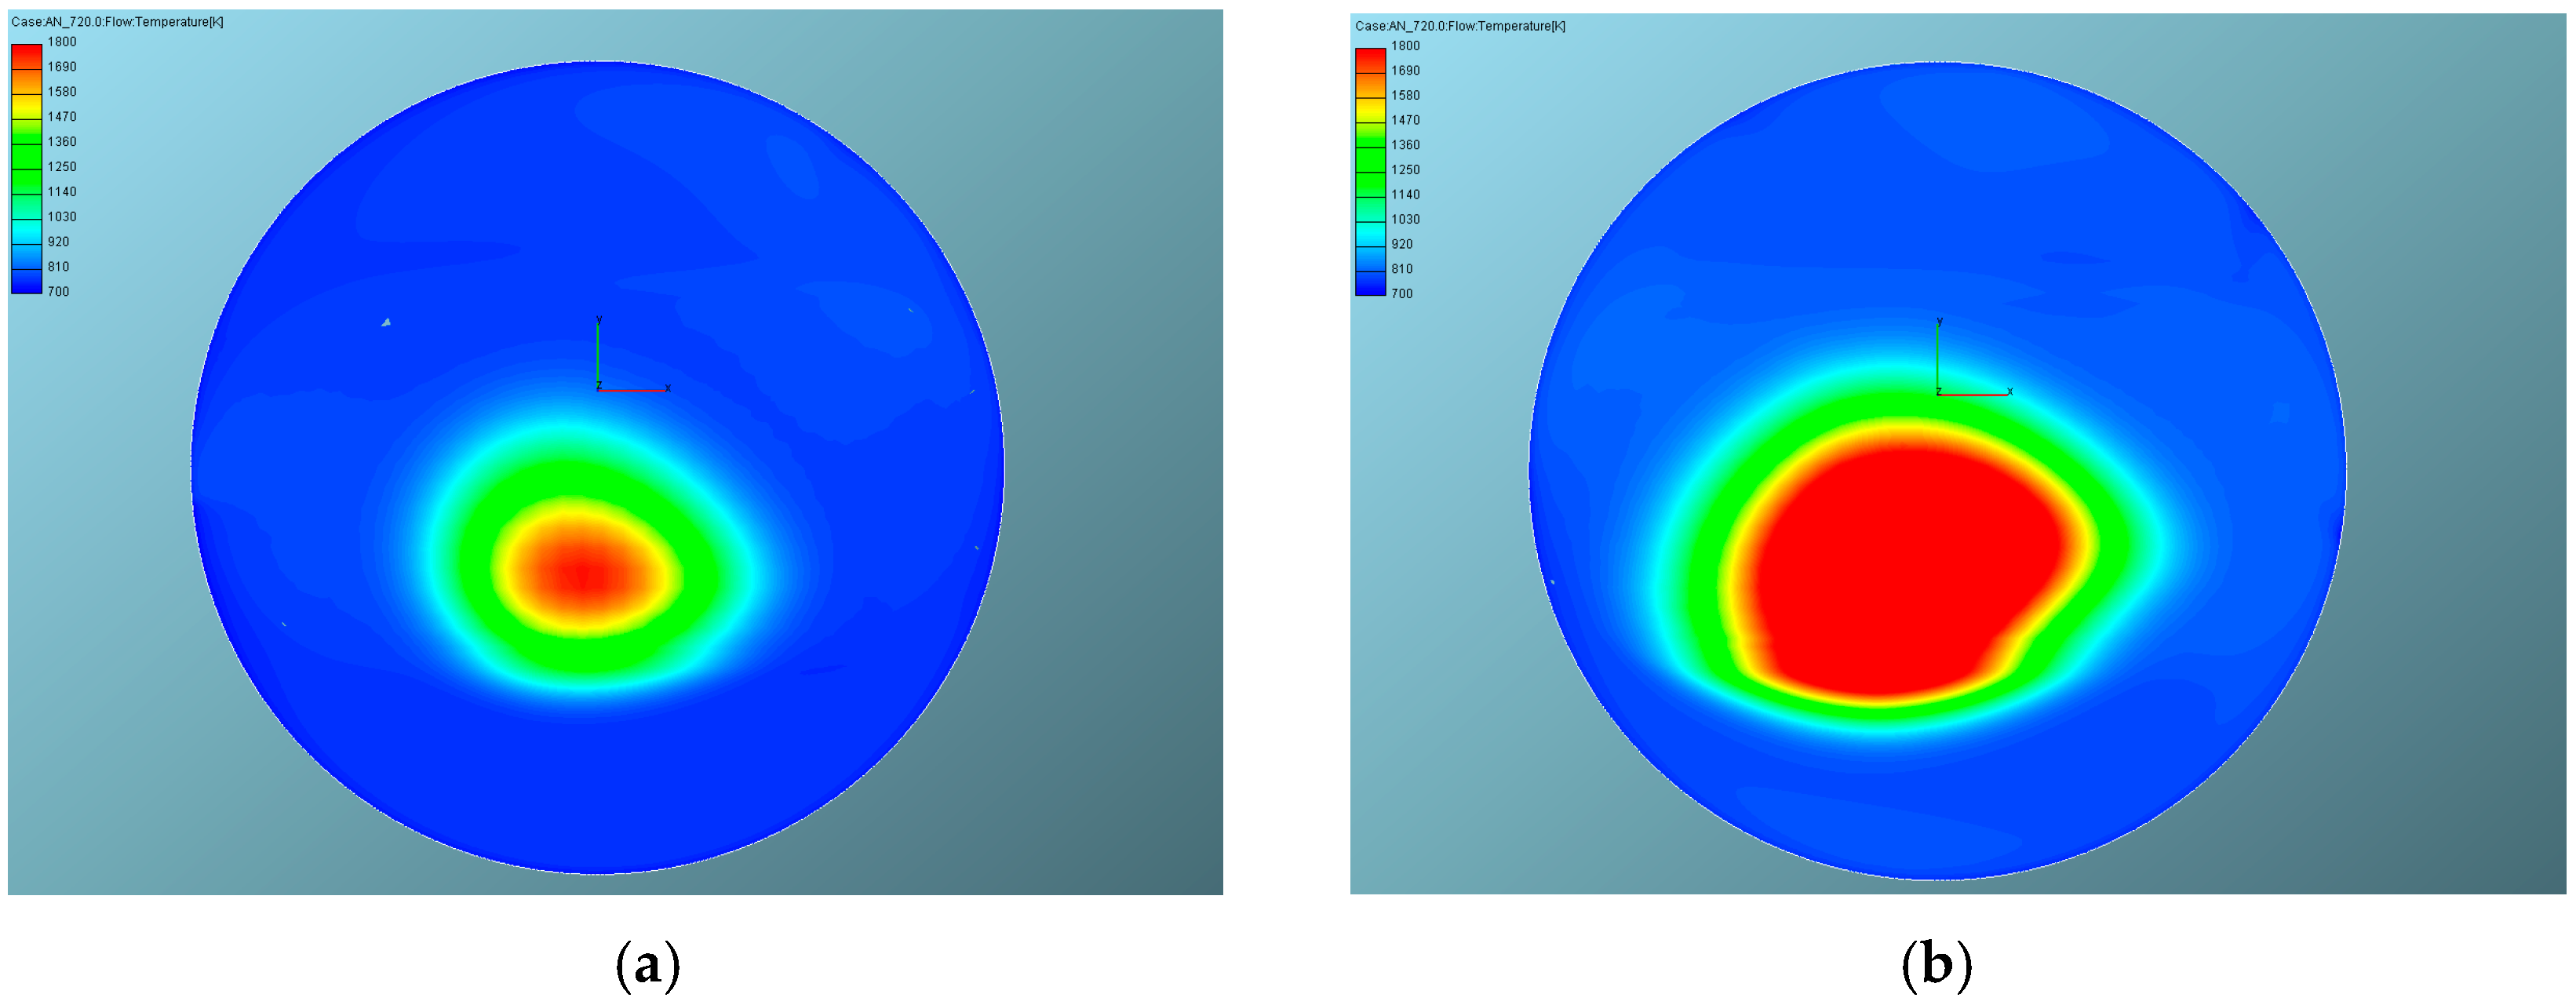
Early flame development is presented in Figure 20 and Figure 21 through the temperature fields in the x-y cutting plane through the squish zone at 350° ATDC and 360° ATDC, respectively.
From the figures presented the clear differences between flame front development in the early burning stage is encountered. In the case of closed baffle, Figure 20b, the flame front is clearly legible while, at the same moment, in the case of open baffle, the ignition delay period still lasts and flame front is under development. The shorter ignition delay period encountered implies the conclusion that the stronger tumble vortex encountered during compression stroke enhances flame propagation rate and decreases ignition delay period [5,25]. In the early burning stage, the flame area is located around spark plug with a nearly spherical shape indicating that both flow and spark characteristics govern flame front development and its propagation. Six interrelated mechanisms, acting simultaneously, are identified as critical for governing the flame front shape and its propagation velocity [27]. These mechanisms are as follows:
  • Macro flow—Macro flow established before ignition through its characteristic time and length scales defines turbulent structure.
  • Flame generated turbulence—Flame propagation through an unburnt mixture causes the acceleration of the hot gas in front of the flame front. Higher velocities in front of the flame yield to increase of velocity gradient and consequently increase the kinetic energy of turbulence in front of the flame.
  • Compression by the flame—The compressed zone in front of the flame front exhibits negative mean velocity divergence, thereby promoting the generation of turbulence.
  • Increase of the viscosity behind the flame front—Elevated temperatures promote an increase in fluid viscosity, which subsequently elevates the Ret number and accelerates the rate of viscous dissipation.
  • The sign and the magnitude of the density gradient across the flame front.
  • Effect of large heat release due to chemical reactions—The dilatation of turbulence within the heat release zone results in a decrease of turbulent kinetic energy, thereby attenuating the flow intensity.
During the continuation of the combustion process, Figure 21 at 360° ATDC, the differences in flame front size as well as its propagation rate still persist. The differences of flame propagation rates encountered are pursued by differences in the spatial distribution of the kinetic energy of turbulence, Figure 22. Higher turbulence intensity levels in the case of closed baffle indicate higher propagation rate thereafter, Figure 23 and Figure 24, which is also experimentally verified.
The obtained results regarding the evolution of the flame front and its propagation imply the conclusion of the existence of so-called “flame dominated fluid flow” controlled primarily by the turbulent diffusion, i.e., by high intensity of turbulence and the cascade process of tearing or breaking up large vortices into smaller ones and their dissipation into heat. The effects of earlier established macro flow gradually attenuate during the combustion process while the effects of turbulent diffusion prevail. Consequently, the differences in flame propagation rate encountered from the very beginning are decreased.
The intensification of the in-cylinder charge motion, specifically the higher swirl and tumble ratios generated by the modified intake port, directly influenced the combustion characteristics. Although the increased kinetic energy of turbulence (TKE) (as analyzed in previous sections) led to an enhanced flame propagation and a higher rate of heat release (RHR), this did not translate into improved engine performance.
Instead, the reduction in BMEP and indicated efficiency can be explained by the effectiveness of these flow patterns. The intake manifold modification, which intensified the intake jet and consequently enhanced swirl and tumble, also acted as a flow restriction, reducing volumetric efficiency. Furthermore, the increased flow velocity and faster flame propagation intensified the convective heat transfer to the cylinder walls. Essentially, these heightened thermal losses outweighed the kinetic benefits of the faster combustion process, resulting in the observed decrease in overall engine efficiency.

3.3.4. Nitric Oxide Emission

In addition to the analysis of the fluid flow pattern and flame front propagation, the results concerning nitric oxide (NO) emissions are also presented. Nitric oxide is a high-enthalpy combustion product created in the zone of burnt gases, immediately after flame front passage [28]. It should be noted that reactions of NO formation are rather slow in comparison to other reactions, mentioned in Section 2.3.4. The two most important factors for NO formation in any location can be identified as follows:
  • Temperature in location under consideration;
  • Reaction time being the time interval between the flame front passage and the moment when temperature decreases below the NO formation level (approximately 1800 K).
In the other words, NO concentration is a function of the change of the spatial distribution of temperature in time. Therefore, it can be expected that iso contours of temperature are pursued in a straight forward fashion by iso contours of NO concentration. Iso contours of NO concentration in the x-z cutting plane are presented in Figure 25, Figure 26 and Figure 27 (360° ATDC, 380° ATDC, 400° ATDC).
It is clearly noticeable that the shape of NO concentration iso contours pursue the shape of temperature iso contours adequately which is in accordance with the above mentioned assumption. On the other hand, the maximal concentration level is located in the spark plug zone indicating that reaction time is one of the essential factors. The obtained results also indicate that the commencement of NO formation coincides with the flame arrival and both reaction time and spatial distribution of temperature are of critical importance for NO formation. All the differences encountered in flame front propagation are also present here. The concentration level in the closed baffle case is slightly higher than in the open baffle case. Namely, higher temperature level and faster flame propagation in that case yield penalty as regards NO concentration.
The NO concentrations were calculated by integrating the spatially averaged mass fraction fields over the combustion cycle and correlating the results with the indicated work per cycle, thereby facilitating a direct quantitative comparison between the studied cases. The analysis of specific NO emission reveals that the intake modification (TC) leads to an increase in NO levels of approximately 12% (12.1 g/kWh vs. 13.5 g/kWh) compared to the baseline configuration (TO). Although the intensified in-cylinder flow enhances combustion speed, it simultaneously promotes higher local temperature fields within the burned gas region. Since the residence time for NO formation in the vicinity of the spark plug is effectively extended due to accelerated flame propagation, the thermal NO formation mechanism becomes more pronounced. Consequently, the applied aerodynamic modification results in increased NO emissions, representing an adverse environmental effect of the proposed intake design.

4. Conclusions

It is well-established that organized in-cylinder flows in IC engines are of predominant importance for the combustion rate and overall engine performance. The impact of specific fluid flow patterns depends to a high degree on the engine’s design and combustion chamber architecture. In the case of the pent-roof combustion chamber analyzed in this study, tumble motion is of predominant importance for combustion efficiency, whereas other flow structures may play a subordinate role.
The results indicate that the modification of the intake system successfully increased the intake flow intensity, primarily by intensifying the tangential flow component and enhancing the swirl ratio. However, it did not significantly influence the tumble motion, which remains the dominant coherent structure for this particular geometry. During the compression stroke, the initial influence of the intake system modifications gradually attenuates as the geometry of the combustion chamber takes a leading role.
Furthermore, during the combustion stage, the effects of the increased swirl become less pronounced because turbulent diffusion becomes the governing mechanism for flame propagation. Consequently, only quantitative, rather than qualitative, differences in the flame front shape were observed. While the intake port modification decreases flame kernel formation period as well as ignition delay due to intensified organized flow, these changes are insufficient to exert some significant effects on overall engine characteristics. In the case of this particular combustion chamber geometry layout, tumble motion remains the dominant flow structure. Instead, the intensified combustion and higher localized temperatures yield penalty of specific NO emissions increase, as the thermal NO formation mechanism was promoted.
The findings of this research suggest that modifications aimed at enhancing an organized flow that is of secondary importance for a specific combustion chamber layout, such as swirl in a pent-roof chamber, are unlikely to yield significant performance benefits. In fact, as demonstrated, such modifications can even lead to a deterioration of other important characteristics, such as increased exhaust emission and decreased BMEP in this particular case. The results suggest that although the modified intake system enhanced swirl and tumble intensity, the associated thermal losses and reduced volumetric efficiency led to an overall decrease in engine performance.
In conclusion, it is of critical importance to correctly identify the dominant type of coherent flow for a particular combustion chamber geometry layout prior to the implementation of structural changes. The application of contemporary CFD modeling techniques provides indispensable insight into these complex three-dimensional phenomena. However, to mitigate the risks associated with numerical assumptions and simplifications, the obtained numerical results must be interpreted within the context of the entire engine cycle and supported by applicable experimental validation.

Author Contributions

Conceptualization, Z.M. and R.P.; methodology, Z.M.; software, Z.M.; validation, Z.M., R.P. and A.D.; formal analysis, Z.M. and R.P.; investigation, Z.M.; resources, Z.M.; data curation, Z.M., R.P., A.D. and S.S.; writing—original draft preparation, Z.M.; writing—review and editing, R.P., A.D. and S.S.; visualization, Z.M.; supervision, R.P., A.D. and S.S.; project administration, Z.M., I.L. and S.D.; funding acquisition I.L. and S.D. All authors have read and agreed to the published version of the manuscript.

Funding

This research was funded by the Ministry of Science, Technological Development and Innovation of the Republic of Serbia (Contract No. 451-03-136/2025-03/200017).

Data Availability Statement

The data presented in this study are available on request from the corresponding author due to privacy reasons.

Acknowledgments

The authors would like to thank the personnel of the AVL List GmbH Advanced Simulation Technology (AST) division for their great contribution to software manuals and assistance dur-ing preliminary mesh generation. The authors express special gratitude to Zoran Jovanović, formerly with the Institute of Nuclear Sciences “Vinča”, University of Belgrade, and Miroljub Tomić, formerly with the Faculty of Mechanical Engineering, University of Belgrade, for providing the raw experimental data and the experimental setup specifications.

Conflicts of Interest

The authors declare no conflicts of interest.

Abbreviations

The following abbreviations are used in this manuscript:
CFDComputational Fluid Dynamics
ICInternal combustion
CADCrank angle degree
TOThrottle open
TCThrottle close
CDSCentral differencing scheme
MINMODMinimum modulus
EVMEddy Viscosity/Diffusivity
SMCSecond moment closure
LESLarge Eddy simulation
DNSDirect numerical simulation
ECFMExtended Coherent Flame Model
AKTIMArc and Kernel Tracking Ignition Model
DPIKDiscrete Particle Ignition Kernel
RHRRate of heat release
ATDCAfter top dead-center
RMSERoot Mean Square Error
BMEPBrake mean effective pressure
IMEPIndicated mean effective pressure

References

  1. Lumley, J.L. Flow in the cylinder. In Engines: An Introduction; Lumley, J.L., Ed.; Cambridge University Press: Cambridge, UK, 1999; pp. 134–184. ISBN 978-0-521-64489-1. [Google Scholar] [CrossRef] [Scilit]
  2. Kaplan, M. Influence of Swirl, Tumble and Squish Flows on Combustion Characteristics and Emissions in Internal Combustion Engine-Review. Int. J. Automot. Eng. Technol. 2019, 8, 83–102. [Google Scholar] [CrossRef] [Scilit]
  3. Jovanovic, Z.; Basara, B.; Tomic, M.; Petrovic, V. Some Subtleties Concerning Fluid Flow and Turbulence Modeling in 4.-Valve Engines. Therm. Sci. 2011, 15, 1065–1079. [Google Scholar] [CrossRef] [Scilit]
  4. Arcoumanis, C.; Bae, C.S.; Hu, Z. Flow and Combustion in a Four-Valve, Spark-Ignition Optical Engine. SAE Trans. 1994, 103, 197–211. [Google Scholar] [CrossRef] [Scilit]
  5. Hill, P.G.; Zhang, D. The Effects of Swirl and Tumble on Combustion in Spark-Ignition Engines. Prog. Energy Combust. Sci. 1994, 20, 373–429. [Google Scholar] [CrossRef] [Scilit]
  6. Pulkrabek, W.W. Fluid Motion within Combustion Chamber. In Engineering Fundamentals of the Internal Combustion Engines; Prentice Hall: Hoboken, NJ, USA, 2003; pp. 206–228. ISBN 978-0-13-140570-7. Available online: https://zlib.pub/book/engineering-fundamentals-of-the-internal-combustion-engine-6vv9blvl81h0 (accessed on 15 October 2023).
  7. Jovanovic, Z. Multidimensional Modelling of Combustion in Spark Ignition Engines. In Combustion Modelling in Spark Ignition Engines; Faculty of Mechanical Engineering of the University of Belgrade: Belgrade, Serbia, 1995; pp. 153–186. ISBN 86-7083-262-3. (In Serbian) [Google Scholar]
  8. Jovanovic, Z.; Masonicic, Z.; Zivanovic, Z.; Milovanovic, M. The Effect of Fuel Variation on Flame Propagation in IC Engines with Strong Macro Flows. Mach. Technol. Mater. 2014, 8, 20–23. [Google Scholar]
  9. AVL FIRE™, Version 2017. User Manual: Fire CFD Solver. AVL List GmbH: Graz, Austria, 2017.
  10. Ferziger, J.H.; Perić, M. Computational Methods for Fluid Dynamics, 3rd ed.; Springer: Berlin/Heidelberg, Germany; New York, NY, USA, 2002; ISBN 978-3-540-42074-3. Available online: http://servidor.demec.ufpr.br/CFD/bibliografia/Ferziger%20Peric%20-%20Computational%20Methods%20for%20Fluid%20Dynamics,%203rd%20Ed%20-%202002.pdf (accessed on 20 February 2024).
  11. Durbin, P.A. Near-Wall Turbulence Closure Modeling without ‘Damping Functions’. Theoret. Comput. Fluid Dyn. 1991, 3, 1–13. [Google Scholar] [CrossRef] [Scilit]
  12. Hanjalić, K.; Popovac, M.; Hadžiabdić, M. A Robust Near-Wall Elliptic-Relaxation Eddy-Viscosity Turbulence Model for CFD. Int. J. Heat Fluid Flow 2004, 25, 1047–1051. [Google Scholar] [CrossRef] [Scilit]
  13. AVL FIRE™, Version 2017. User Manual: Combustion Module. AVL List GmbH: Graz, Austria, 2017.
  14. Williams, F.A. Recent Advances in Theoretical Descriptions of Turbulent Diffusion Flames. In Turbulent Mixing in Nonreactive and Reactive Flows; Murthy, S.N.B., Ed.; Springer: Boston, MA, USA, 1975; pp. 189–208. [Google Scholar] [CrossRef] [Scilit]
  15. Marble, F.E.; Broadwell, J.E. The Coherent Flame Model for Turbulent Chemical Reactions; Defense Technical Information Center: Fort Belvoir, VA, USA, 1977. Available online: https://apps.dtic.mil/sti/tr/pdf/ADA036768.pdf (accessed on 3 June 2024).
  16. Duclos, J.P.; Zolver, M.; Baritaud, T. 3d Modeling of Combustion for Di-Si Engines. Oil Gas Sci. Technol.—Rev. IFP 1999, 54, 259–264. [Google Scholar] [CrossRef] [Scilit]
  17. Colin, O.; Benkenida, A.; Angelberger, C. 3d Modeling of Mixing, Ignition and Combustion Phenomena in Highly Stratified Gasoline Engines. Oil Gas Sci. Technol.—Rev. IFP 2003, 58, 47–62. [Google Scholar] [CrossRef] [Scilit]
  18. Wang, Z.; Li, F.; Wang, Y. A Generalized Kinetic Model with Variable Octane Number for Engine Knock Prediction. Fuel 2017, 188, 489–499. [Google Scholar] [CrossRef] [Scilit]
  19. Duclos, J.-M.; Colin, O. Arc and Kernel Tracking Ignition Model for 3D Spark-Ignition Engine Calculations. Proc. Int. Symp. Diagn. Model. Combust. Intern. Combust. Engines 2001, 01.204, 46. [Google Scholar] [CrossRef] [Scilit]
  20. Masonicic, Z.; Dragutinovic, S.; Davinic, A.; Savic, S.; Pesic, R. Some Aspects of Combustion Model Variation onto Flame Propagation and Exhaust Emissions of IC Engines. In Proceedings of the 10th International Congress Motor Vehicles & Motors 2024, Kragujevac, Serbia, 10–11 October 2024; pp. 493–500, ISBN 978-86-6335-120-2. [Google Scholar]
  21. Fan, L.; Li, G.; Han, Z.; Reitz, R.D. Modeling Fuel Preparation and Stratified Combustion in a Gasoline Direct Injection Engine. SAE Trans. 1999, 108, 105–119. Available online: https://www.jstor.org/stable/44743356 (accessed on 10 July 2024).
  22. Meintjes, K.; Morgan, A.P. Element Variables and the Solution of Complex Chemical Equilibrium Problems. Combust. Sci. Technol. 1989, 68, 35–48. [Google Scholar] [CrossRef] [Scilit]
  23. AVL FIRE™, Version 2017. User Manual: Emission Module. AVL List GmbH: Graz, Austria, 2017.
  24. Tomic, M.; Popovic, S.; Miljic, N.; Petrovic, S.; Cvetic, M.; Knezevic, D.; Jovanovic, Z. A Quick, Simplified Approach to the Evaluation of Combustion Rate from an Internal Combustion Engine Indicator Diagram. Therm. Sci. 2008, 12, 85–102. [Google Scholar] [CrossRef] [Scilit]
  25. Arcoumanis, C.; Whitelaw, J.H. Fluid Mechanics of Internal Combustion Engines—A Review. Proc. Inst. Mech. Eng. Part C Mech. Eng. Sci. 1987, 201, 57–74. [Google Scholar] [CrossRef] [Scilit]
  26. Jovanovic, Z.; Masonicic, Z.; Tomic, M. The Vice-Verse Movement of the Reverse Tumble Center of Rotation in a Particular Combustion Chamber. MTM Mach. Technol. Mater. 2008, II, 17–20. [Google Scholar]
  27. Jovanovic, Z.; Zeljkovic, I. Modelling of Fluid Flow, Combustion and Emission of Spark Ignition Engines-Multidimensional Approach. In Equipment and Technologies for Emission Control from Stationary and Mobile Sources; Faculty of Mechanical Engineering of the University of Belgrade: Belgrade, Serbia, 1997; pp. 281–316. ISBN 86-7083-311-5. (In Serbian) [Google Scholar]
  28. Jovanovic, Z.; Petrovic, S.; Tomic, M. The Effect of Combustion Chamber Geometry Layout on Combustion and Emission. Therm. Sci. 2008, 12, 7–24. [Google Scholar] [CrossRef] [Scilit]
Figure 1. The schematic diagram of experimental setup. Yellow lines indicate component labels; red lines show functional interconnections.
Energies 19 00229 g001
Figure 2. Perspective view of the intake manifold geometry layout (a) unmodified and (b) modified.
Energies 19 00229 g002
Figure 3. Top view of the intake manifold geometry layout (a) unmodified and (b) modified.
Energies 19 00229 g003
Figure 4. Detail view of numerical mesh (a) intake port and (b) intake valve.
Energies 19 00229 g004
Figure 5. Comparison of in-cylinder pressure trace using initial and final numerical mesh for mesh sensitivity study (a) unmodified and (b) modified intake manifold geometry layout.
Energies 19 00229 g005
Figure 6. In-cylinder pressure trace comparison (a) unmodified and (b) modified intake manifold geometry layout.
Energies 19 00229 g006
Figure 7. RMSE analysis of in-cylinder pressure trace (a) unmodified and (b) modified intake manifold geometry layout.
Energies 19 00229 g007
Figure 8. Rate of heat release comparison (a) unmodified and (b) modified intake manifold geometry layout.
Energies 19 00229 g008
Figure 9. RMSE analysis of rate of heat release (a) unmodified and (b) modified intake manifold geometry layout.
Energies 19 00229 g009
Figure 10. Cumulative heat release (a) and RMSE analysis (b).
Energies 19 00229 g010
Figure 11. In-cylinder kinetic energy of turbulence (a) and dissipation rate (b) evolution.
Energies 19 00229 g011
Figure 12. Fluid flow pattern in y-z plane at 15° ATDC for the (a) TO case and (b) TC case.
Energies 19 00229 g012
Figure 13. Fluid flow pattern in x-z plane at 15° ATDC for the (a) TO case and (b) TC case.
Energies 19 00229 g013
Figure 14. Fluid flow pattern in y-z plane at 75° ATDC for the (a) TO case and (b) TC case.
Energies 19 00229 g014
Figure 15. Fluid flow pattern in x-z plane at 75° ATDC for the (a) TO case and (b) TC case.
Energies 19 00229 g015
Figure 16. Fluid flow pattern in x-z plane at 180° ATDC for the (a) TO case and (b) TC case.
Energies 19 00229 g016
Figure 17. Fluid flow pattern in x-y plane at 180° ATDC for the (a) TO case and (b) TC case.
Energies 19 00229 g017
Figure 18. Fluid flow pattern in x-z plane at 270° ATDC for the (a) TO case and (b) TC case.
Energies 19 00229 g018
Figure 19. Fluid flow pattern in x-z plane at 300° ATDC for the (a) TO case and (b) TC case.
Energies 19 00229 g019
Figure 20. Spatial distribution of temperature in x-y plane at 350° ATDC for the (a) TO case and (b) TC case.
Energies 19 00229 g020
Figure 21. Spatial distribution of temperature in x-y plane at 360° ATDC for the (a) TO case and (b) TC case.
Energies 19 00229 g021
Figure 22. Spatial distribution of kinetic energy of turbulence in x-z plane at 370° ATDC for the (a) TO case and (b) TC case.
Energies 19 00229 g022
Figure 23. Spatial distribution of temperature in x-z plane at 370° ATDC for the (a) TO case and (b) TC case.
Energies 19 00229 g023
Figure 24. Spatial distribution of temperature in x-z plane at 380° ATDC for the (a) TO case and (b) TC case.
Energies 19 00229 g024
Figure 25. Iso contours of NO concentration in x-z plane at 370° ATDC for the (a) TO case and (b) TC case.
Energies 19 00229 g025
Figure 26. Iso contours of NO concentration in x-z plane at 380° ATDC for the (a) TO case and (b) TC case.
Energies 19 00229 g026
Figure 27. Iso contours of NO concentration in x-z plane at 400° ATDC for the (a) TO case and (b) TC case.
Energies 19 00229 g027
Table 1. Test engine specifications.
ItemContent
TypeIn-line, four-cylinder, four-stroke
IgnitionSpark ignition
FuelPetrol, port fuel injection
Displacement (L)1.372
Power (kW)/rpm53/5250
Bore (mm)80.5
Stroke (mm)67.4
Connecting rod length (mm)128.5
Compression ratio9.2
Number of valves2
Intake valve open7° CA BTDC
Intake valve close35° CA ABDC
Exhaust valve open37° CA BBDC
Exhaust valve close5° CA ATDC
Table 2. Numerical simulation boundary conditions.
SelectionBoundary TypeCondition
InletInlet/outletVariable pressure, temperature
OutletInlet/outletVariable pressure, temperature
ChamberWallFixed temperature
Cylinder wallWallFixed temperature
PistonMoving boundaryFixed temperature
Intake portWallFixed temperature
Exhaust portWallFixed temperature
Intake valveMoving boundaryFixed temperature
Exhaust valveMoving boundaryFixed temperature
Disclaimer/Publisher’s Note: The statements, opinions and data contained in all publications are solely those of the individual author(s) and contributor(s) and not of MDPI and/or the editor(s). MDPI and/or the editor(s) disclaim responsibility for any injury to people or property resulting from any ideas, methods, instructions or products referred to in the content.