Abstract
Rapid evolution of electricity distribution networks challenges the maintenance of up-to-date information in electricity utility databases. This hinders the ability of utilities to understand phase connectivity and topology of users in their distribution networks. Extensive research has been conducted to develop smart meter data-driven phase identification and topology determination approaches as alternatives to the conventional, time-consuming, and expensive approach of manual inspection. However, the majority of such approaches are challenged by low levels of smart meter penetration in distribution networks, entailing further investigation. The objective of this paper is to contribute to this challenge by proposing an alternative smart meter data-driven approach of user phase identification, verification, and topology determination and testing the method on a real Australian distribution network under varied levels of smart meter penetration. This paper first presents a smart meter data-driven user phase identification tool using k-means clustering. Then, a smart meter data-driven user phase verification and topology determination approach is introduced by analyzing voltage-to-power sensitivities obtained from linear regression. Four distinct linear regression models are developed and compared to recognize relevant parameters and input variables leading to the most reliable sensitivities. The overall process proposed in this study demonstrated high accuracy at original smart meter penetration of 75% of the case study DN. The performance at reduced smart meter penetrations of 50% and 25% is also examined and discussed in the paper.
1. Introduction
At present, electricity distribution networks (DNs) have become the least observable and the most dynamic element in the electricity power system due to the recent influx of behind-the-meter (BTM) distributed generation and new user connections. Most distribution network service providers (DNSPs) have limited, incomplete, or outdated knowledge about their DNs as they have been rapidly upgrading the DNs without precisely recording all changes [1]. However, accurate knowledge about user phase connectivity and topology can be useful in many functions benefiting grid operation, such as improvement of voltage unbalance, reduction of system losses, mitigation of individual phase overload, and effective location of system faults, among others [2]. This knowledge can also help optimal utilization of DN assets, enabling integration of distributed energy resources. Whenever this knowledge is required, many utilities adopt the conventional method of manual inspection in the field, which is labor-intensive and costly [3]. Therefore, development of more efficient, effective, and cost-worthy alternative approaches of user phase identification and topology determination is of vital importance. Such alternative approaches with a significant interest towards incorporation of data from smart electricity meters have been proposed in the literature [4]. Over the last decade, smart electricity meters have shown a remarkable growth in deployment throughout the world, and their function extends beyond ordinary billing [5]. High-resolution data obtained from smart electricity meters is readily utilized in many other applications beneficial to electricity utilities as well as consumers, including studies on user phase identification [6], network topology determination [7], feeder impedance calculation [8], broken neutral identification [9], and model-free voltage calculation [10], amongst others.
Generally, when a user on one phase consumes power, the users on that phase experience a voltage drop resulting in negative voltage-to-power sensitivities while the users on other phases undergo a small voltage rise leading to small positive sensitivities [11]. The user phase verification tool developed in this paper examines the viability of applying this concept to verify results obtained from the k-means clustering-based user phase identification approach proposed in the authors’ previous work [12]. (k-means clustering is an unsupervised machine learning algorithm used for grouping a dataset into a pre-defined number of clusters.) A similar linear approximation for user topology determination in low voltage (LV) feeders corresponding to increasing loop impedance order from the authors’ previous work [12] is further investigated in this paper. Both of these applications involving linear approximation of power flow equation are formulated based on the development of linear regression (LR) models. (LR is a supervised machine learning algorithm used for computing the most optimized linear relationship between dependent and independent variables.) This paper explores how LR can be used for user phase verification and topology determination in DNs, so that multiple functions can be achieved from the same fundamental knowledge and available data.
Although adoption of linearized power flow relationships is encountered in research on smart meter data-driven user phase identification [6,13] and topology determination [7,14,15], investigation of those proposed methods on reduced or varied levels of smart meter penetration, as thoroughly conducted in this study, is not often found. Even though partial smart meter coverage is addressed in some of the existing literature on user phase identification [1] and topology determination [16], examination of those approaches on varied smart meter penetration is not adequately explained or undertaken. In contrast, this study explicitly and systematically details the procedure for achieving varied smart meter penetration. Some of the literature that exists analyzes varied smart meter penetration with phase identification [17,18] and topology determination [19]. However, those methods have various limitations compared to the approach proposed in this paper. The limitations include not clearly explaining how varying levels of smart meter penetration are achieved, not providing sufficient details about the tested DN, requiring load data from substation monitors, depending on the availability of users with pre-known correct phases, and not identifying the phases of individual meter channels in three-phase users. Table 1 provides an in-detail discussion of the specialties and drawbacks encountered in the recent related literature. Unlike existing studies that rely on data from both smart meters and micro-phasor measurement units (µPMUs) to determine network topology [20], the topology determination approach proposed in this paper requires data only from residential smart meters. Furthermore, even though some studies available within the literature facilitate smart meter data-driven approaches for combined user phase identification and topology determination [21,22,23], the performance of those methods upon varied smart meter penetration levels is not analyzed, whereas this study explicitly evaluates and demonstrates it.

Table 1.
Recent literature on smart meter data-driven phase identification and topology determination.
As observable in Table 1, different smart meter data-driven user phase identification and topology determination techniques have been introduced in the literature. Level of smart meter penetration is a critical factor determining the accuracy of such approaches, and rigorous studies on its influence on those approaches is indispensable. Some smart meter penetration analysis on user phase identification and topology determination can be found in the literature, but they have different drawbacks as detailed in Table 1, entailing further investigation and improvement. Hence arises the relevance and uniqueness of the study presented in this paper. The user phase identification, verification, and topology determination approaches proposed in this paper rely solely on residential smart electricity meter data and are rigorously evaluated under varied smart meter penetration levels within a real LV DN. The proposed methods are simple and straightforward, yet more effective, efficient, and cost-worthy compared to the conventional approaches, which involve time-intensive and costly manual inspection and/or deployment of µPMUs.
In the context of power and energy engineering, machine learning (ML) is increasingly being applied to address the growing complexity of modern power systems driven by high penetration of renewable energy, decentralization, and the need for real-time decision-making. ML is widely used in forecasting load [24] and renewable generation [25], fault detection [26], and predictive maintenance [27], using data from advanced sensors, smart meters, and monitoring systems. Particularly in environments consisting of distributed energy resources (DERs), ML is used to accomplish voltage regulation [28], frequency control [29], and DER hosting capacity estimation [30]. ML also supports functionalities such as energy trading model development [31], price prediction [32], and bidding optimization [33], improving energy market efficiency. In overall, recent research demonstrates a growing emphasis on integrating ML techniques wherever applicable to enhance performance and decision-making across power and energy engineering applications.
The recent literature has shown interest in applying advanced ML techniques, particularly neural networks, for both phase identification [34,35] and topology determination [36,37] tasks. While these methods can provide strong performance in certain contexts, they can also introduce several practical challenges. Neural networks operate as black-box models, are computationally intensive, and require careful hyperparameter tuning, which can complicate their practical deployment. In addition, neural network-based phase identification approaches typically require the creation of labeled training datasets [34], whereas the k-means clustering-based method presented in this study is fully unsupervised and avoids the need for generating specialized training data. Both k-means clustering and LR offer simplicity, transparency, and ease of interpretation, qualities that were central to the objectives of this paper. The present study was therefore intentionally limited to these straightforward and highly interpretable approaches to ensure that the proposed methodology can be readily implemented in practical industry settings.
This paper first introduces the case study DN (Section 2) and the necessary smart meter data pre-processing (Section 3). In Section 4 the smart meter data-driven k-means clustering-based user phase identification approach utilizing the voltage correlations between users and electricity DN hierarchy is presented. Section 4 also examines how voltage-to-power sensitivity analysis can be utilized for user phase verification and user topology determination in DNs by introducing a smart meter data-driven voltage-to-power sensitivity analysis-based approach leveraging linearized power flow approximation. Four distinct LR models are developed and compared to identify the parameters and input variables yielding the most reliable voltage-to-power sensitivities. The dependency of performance accuracy of proposed user phase identification, verification, and user topology determination approaches on smart meter penetration is assessed by testing them on a real Australian DN under varied levels of smart meter penetration in Section 5. Section 6 discusses the results of this study and Section 7 gives the conclusion.
2. Case Study Distribution Network
This study was conducted on a real underground DN situated in an urban area of New South Wales, Australia, shown in Figure 1. The single-line diagram of the case study DN is provided in Figure 2 (feeder lengths are not to scale). The case study DN consisted of one distribution transformer and two radial LV feeders. The DN had a total of 28 users (customers) with user01 through user14 on one LV feeder referred to as Feeder1, and user15 through user28 on the other LV feeder, referred to as Feeder2.
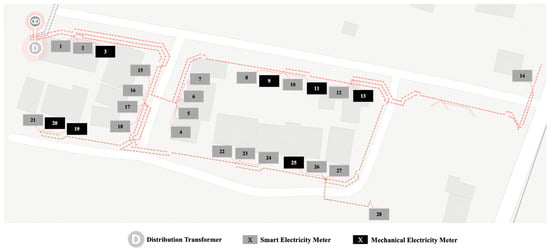
Figure 1.
Case study distribution network showing relative physical location of users.
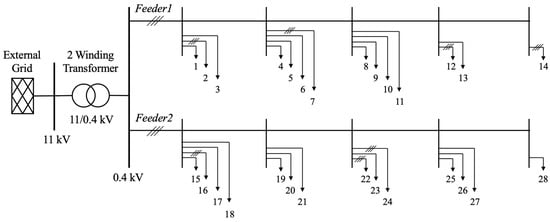
Figure 2.
Single-line diagram of the case study distribution network.
Here, 21 users had smart power quality enabled electricity meters (referred to as smart meters throughout the remainder of the paper), and seven users had mechanical electricity meters, corresponding to 75% smart meter penetration in the DN. Of the 21 users with smart meters, 14 were single-phase users (each having one smart meter channel) and 7 were three-phase users (each having three smart meter channels). This corresponded to a total of 35 smart meter channels referred to as user phases in this paper. As the user phase identification, verification, and user topology determination approach proposed in this paper is based on smart meter measurements, only these 35 user phases were considered for the study. Moreover, 62% of users with smart meters had rooftop solar PV installations. This included 12 single-phase and one three-phase rooftop solar PV systems at 13 users out of 21 users with smart meters.
For this study, smart meter data of 333 days across 11 months from November 2022 to October 2023 was available at five-minute intervals. Any missing data in between the mentioned time period was handled during data pre-processing.
3. Data Pre-Processing
This study required instantaneous active power (P), reactive power (Q), and voltage magnitude (V) at all smart meters. However, smart meter data can sometimes be incomplete. Therefore, only the instances with all three measurements of P, Q, and V at all 21 smart meters were considered in the analysis. That is, if any of these three measurements at any of the 21 smart meters was not available at a given instance in time, then that instance was not taken for the study. Thereby, 91% of instances were found to be having all three measurements at all 21 smart meters and were thus considered for the study. Data interpolation was not applied, as introducing synthetic values was beyond the scope of this study and could compromise the integrity of the analysis.
It was also required to handle any outliers in P, Q, and V smart meter measurements. V measurements can occasionally be erroneous, or loads may exhibit unexpected behavior leading to uncertain voltage fluctuations. To exclude such cases, the V measurements less than or equal to 200 V and greater than or equal to 260 V (this is beyond ± 30 V of standard system single-phase voltage of 230 V) were considered as outliers, and any instance with voltage outliers was excluded from the study. No instance needed to be excluded based on this criterion, because all V measurements fell within the considered thresholds, with a minimum and maximum recorded V of 220 V and 250 V, respectively.
To distinguish meaningful load behavior from background noise, it was required to ensure significant variations in P and Q over time. For this, it was necessary to check if sufficient standard deviations were demonstrated by both P and Q of all user phases. Hence, any user showing a standard deviation less than 10 W in P or less than 5 VAr in Q on any of its phases was removed from the study. We note that these thresholds are not universally applicable, and their appropriate values depend on the characteristics of the DN under study. When applying the proposed approach to a different DN, the thresholds should be re-evaluated based on the observed P and Q variations. In practice, threshold selection typically begins with smaller values, as identified in this study, and is gradually increased until the LR models achieve sufficient accuracy. It is important to emphasize that LR requires meaningful P and Q data with acceptable standard deviations in order to accurately capture the DN characteristics. Here, the standard deviation is considered to ensure that consistent behavior is observed throughout the studied period. Some three-phase meters may record zero or near-zero load on one or more channels, for instance, when certain loads such as residential hot water systems are connected to only one phase. To ensure reliable analysis, such cases are filtered out before applying LR through the adoption of this procedure. In this study, it was not needed to drop any user under this criterion, because all phases of all users had standard deviations in P and Q above the selected thresholds.
4. Methodology
The proposed overall process is illustrated in Figure 3 and explained in detail below. Algorithm 1, Algorithm 2 and Algorithm 3 are described in Section 4.1 and Section 4.3, and Section 4.4, respectively.
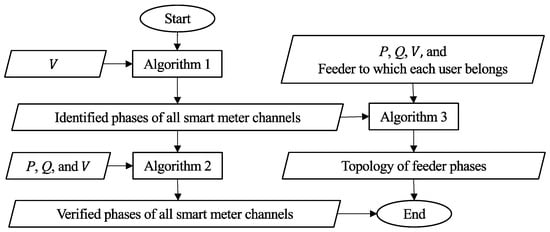
Figure 3.
Proposed overall process.
4.1. k-Means Clustering-Based User Phase Identification
k-means clustering is an unsupervised machine learning algorithm that iteratively clusters data into pre-defined k number of groups by considering Euclidean distance between data points and cluster centroids, where the centroids are randomly selected at first and updated in each iteration until no further change within clusters occurs [38]. k-means clustering is specially recognized for its simplicity, efficiency, and widespread application in phase identification. Its versatility is enhanced by its re-clustering capability after phase changes occur. However, its accuracy is sensitive to the initial clustering center and the number of clusters. Reference [39] proposes a k-means clustering-based phase identification method analyzing correlation between voltage measurements and identifies that a region-based phase identification approach can improve its accuracy. However, [39] leverages known topology within existing equipment to identify those regions, which is not applicable with the study in this paper, which does not use any prior knowledge regarding DN topology for user phase identification. Nevertheless, considering the small size of the case study DN with only one distribution transformer and two LV feeders, it is believed that the DN represents a considerably small region where k-means clustering can perform accurately. This is further confirmed by the results of this study, presented in Section 6.
This study applied the k-means clustering-based user phase identification approach proposed in the authors’ previous work [12] on the same DN, but using a new dataset over a different time period. In this study, k-means clustering with Euclidean distance as similarity measure was applied on the user smart meter voltage measurements considering that users on same phase of a DN follow relatively the same voltage variation pattern over time and are thus correlated. The k-means clustering was applied on night-time data (06.00 p.m. to 06.00 a.m.) across the 11 months of considered timespan, to minimize any potential interference from solar generation injections into the DN during day-time. If multiple phases of a particular three-phase user got assigned to the same cluster by k-means clustering, they were reassigned to unique clusters by comparing their Euclidean distances to corresponding cluster centroids. It should be mentioned that the proposed k-means clustering-based user phase identification approach yielded limited accuracy when applied over a chosen one month of data (month of May 2023), showing that its performance improves if implemented over a substantially longer timespan of data. The performance of proposed k-means clustering-based user phase identification algorithm was further verified by the proposed sensitivity analysis-based user phase verification tool explained in Section 4.3.
The proposed algorithm for k-means clustering-based user phase identification is given in Algorithm 1 and the phases of users as identified by it are depicted in Figure 4.
| Algorithm 1: k-means clustering-based user phase identification in an LV DN | |
| Require: | |
| 1. | Voltage magnitude measurements at user smart meters (V) |
| Process: | |
| 1. | Applying k-means clustering on night-time measurements for using Euclidean distance as similarity measure |
| 2. | Reassigning phases of three-phase users, that get assigned to same cluster in step 1, into unique clusters by comparing their Euclidean distances to cluster centroids |
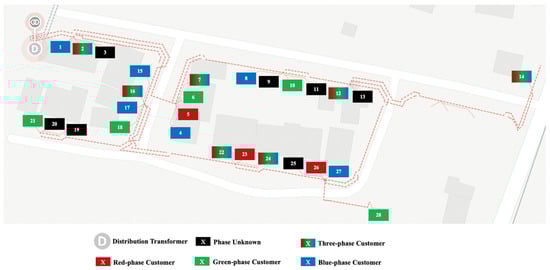
Figure 4.
User phases identified by the k-means clustering-based user phase identification approach.
4.2. LR Model Development
Use of linear approximations is a common practice adopted to reduce the complexity and computational burden involved with non-linear power flow analysis [40]. Accuracy of this linearization is of great importance to ensure the quality of proposed solutions. LR is a supervised machine learning algorithm that computes a linear relationship between dependent and independent variables by finding the best fit of a straight line or a surface that reduces the gap between predicted and actual output [38]. It is straightforward and easy to implement, yet powerful. Its coefficients clearly reflect the impact of each independent variable on each dependent variable, enabling better understanding of underlying dynamics. Considering these characteristics of LR, it was used to develop the proposed voltage-to-power sensitivity analysis-based user phase verification and user topology determination approaches.
LR models were developed using smart meter data of 31 days over one month from 01/05/2023 to 31/05/2023. Here, the month of May was chosen, because it depicted a significant variation in solar generation, allowing LR models to capture the sensitivities more precisely. The training dataset was built using 21 days of data from 01/05/2023 to 21/05/2023, and the testing dataset was built using 10 days of data from 22/05/2023 to 31/05/2023. Instead of using a random train-test split, this train-test split was considered because it involved continuous variation of user load and solar generation, enabling the LR models to better learn power flow relationships.
LR modeling was analyzed on different sizes of the dataset, different seasons of the year, as well as different splits of train-test, before setting it up the way explained above for this study. However, considering the scope of this study, details of those analyses are not presented in this paper.
LR models developed in this study were based on the linearized approximation of power flow shown in (1) [11]. Theoretical expansion of (1) for a single instance in time is given in (2) in the form of Y = MX, where Y is the dependent variable matrix, X is the independent variable matrix, and M is the coefficient matrix. As observable, this linear approximation does not have an intercept. Thus, the LR models were developed by setting the parameter fit_intercept to False during LR model fitting in sklearn [41].
- 1.
- : V of user phase h at time t;
- 2.
- : V at distribution transformer LV bus at time ;
- 3.
- : P of user phase at time ;
- 4.
- : Q of user phase at time ;
- 5.
- : influence of P of user phase on V of user phase (sensitivity with P);
- 6.
- : influence of Q of user phase on V of user phase (sensitivity with Q);
- 7.
- N: number of user phases considered in the LR model.
LR models were developed considering two load conditions. One was by including both P and Q load terms of Equation (1) and finding both P and Q sensitivities. The other was by including only the load term related to P and finding only P sensitivities. As the performance of proposed sensitivity analysis-based tasks is directly dependent upon the accuracy of sensitivities, it is important to ensure that the sensitivities capture power flow relationships as accurately as possible. The aforementioned two load conditions were considered to grasp the impacts from rooftop solar PV generation, which are mostly embedded within P variations. Since the positive and negative nature of the coefficients is important for the proposed sensitivity analysis-based user phase verification approach (explained in Section 4.3), both settings of False and True with parameter positive were examined during LR model fitting. Whenever the coefficients were forced to be positive by setting the parameter positive to True, the LR models were fed with reverse signed P and Q loads to maintain physical meaningfulness.
Thereby, the performance of proposed sensitivity analysis-based tasks was investigated upon four distinct LR models as detailed in Table 2. LRmodel_01 was built considering both P and Q load terms with original signs of coefficients, while LRmodel_02 was built considering only the P load term with original signs of coefficients. LRmodel_03 was built considering both P and Q load terms by forcing the coefficients to be positive, while LRmodel_04 was developed considering only the P load term by forcing the coefficients to be positive. According to the R2 values of developed LR models given in Table 2, all four LR models were equally capable of capturing the power flow relationships. This is further observable in Figure 5, which illustrates test results of developed LR models by plotting LR predicted voltages against smart meter measured voltages during LR model testing.
Table 2.
Details and R2 values of developed LR models.
Figure 5.
Test results of developed LR models.
As distribution transformer monitor data was unavailable for this case study DN, smart meter V measurements of user phases located closest to the distribution transformer were used in place. Users situated closest to the distribution transformer on each phase were found by choosing the users showing minimum standard deviation in night-time voltages during the full available time span of 11 months. This was done by considering the fact that the voltage variation at a user is dependent upon the corresponding line impedance, which is proportional to the distance from the distribution transformer to the user. Therefore, the users located closest to the distribution transformer generally have comparatively low standard deviations in V than those distantly located. Here, the night-time V measurements were taken to minimize interference from solar PV generation. The user phases thus identified as situated closest to the distribution transformer were ph_a_user02, ph_b_user02, and ph_c_user02, which were the same as indicated by the network explorer software utilized by the DNSP.
To ensure more reliable sensitivity analysis, user02—whose V measurements were taken as the distribution transformer V—was not included in the development of LR models as a user. Therefore, the sensitivities of user02 were not found, and the phases of user02 were not directly verified by the proposed sensitivity analysis-based phase verification technique. However, its phases were indirectly verified by the accurate performance of LR models where its respective phases were used in place of transformer phases. When user02 was included as a user in the LR models, the performance accuracy of the LR models dropped and thus the study was continued with the LR models developed by excluding user02.
Once the LR models were developed, the resultant sensitivities were utilized for user phase verification and user topology determination explained in the following subsections.
4.3. Sensitivity Analysis-Based User Phase Verification
When power is consumed by a user on a particular phase of a DN, it is expected that the voltage at the other users on the same phase will reduce, leading to negative sensitivities, while the users on the other phases will get small positive sensitivities [11]. However, when this was investigated on the case study DN with the developed LR models, not all users on a considered phase got negative P sensitivities (P sensitivities refer to voltage-to-active power sensitivities) and not all users on other phases got positive P sensitivities. A combination of both negative and positive P sensitivities could be encountered in almost all user phases. The number of negative P sensitivities shown by each user phase with each of the three phase groups with LRmodel_01 and LRmodel_04 are plotted in Figure 6a and Figure 6b, respectively. In these plots, the user phases are labeled considering the phases already identified by the k-means clustering-based user phase identification approach explained earlier. Examination of Figure 6 deduces that a user phase tends to belong to the phase with which it gets the highest number of negative P sensitivities. For example, consider ph_a_user05 of LRmodel_01 in Figure 6a. Here, ph_a_user05 shows negative P sensitivities with eight user phases on phase a, two user phases on phase b, and three user phases on phase c. Therefore, according to the proposed sensitivity analysis-based phase verification method, it was verified that ph_a_user05 belongs to phase a.
Figure 6.
No. of negative P sensitivities of (a) LRmodel_01 and (b) LRmodel_04 at 75% smart meter penetration.
It is important to mention that this sensitivity analysis-based user phase verification approach is a further verification tool for the proposed k-means clustering-based user phase identification approach and not an independent user phase identification tool that stands alone. However, it is able to find the relative phase group to which a smart meter channel belongs given the phases of other smart meter channels included in the LR model.
The proposed algorithm for sensitivity analysis-based user phase verification is given in Algorithm 2.
| Algorithm 2: Sensitivity analysis-based user phase verification in an LV DN | |
| Require: | |
| 1. | Active power measurements at user smart meters (P) |
| 2. | Reactive power measurements at user smart meters (Q) |
| 3. | Voltage magnitude measurements at user smart meters () |
| 4. | Phases of all smart meter channels identified by the k-means clustering-based user phase identification approach |
| Process: | |
| 1. | Identifying user phases located closest to the distribution transformer by considering lowest standard deviation in night-time V measurements (ph_a_user02, ph_b_user02 and ph_c_user02) |
| 2. | Developing LR models by taking user02 V measurements as those of the distribution transformer and not considering user02 as a user in the LR models |
| 3. | Obtaining the sensitivities from LR models and verifying the user phases by finding the phase to which a given meter channel (user phase) gets highest number of negative P sensitivities |
4.4. Sensitivity Analysis-Based User Topology Determination
In this study, user topology refers to the ascending order of loop impedance (total impedance of live and neutral paths of both feeder and service lines) at the users on a phase of a feeder. Knowing loop impedance order means knowing relative location of each user on a phase of a feeder from the distribution transformer in terms of feeder line and service line impedances. This knowledge helps understand the degree to which each user on a feeder is impacted by feeder voltage and power variations. It also helps determine the probability at which each BTM rooftop solar PV installation gets curtailed during system thermal and voltage violations, as the user with highest loop impedance is most likely to be affected the most and thereby be restricted in PV exports the most.
As service lines (the line between an individual user and the feeder line) have higher per-meter impedance than feeder lines, the geographic user topology may differ from the user topology obtained via comparison of loop impedance. For example, consider the two users, user18 and user21 on phase green of Feeder2, shown in Figure 7. Here, even though user18 has a shorter feeder line than user21, the loop impedance of user18 is higher than that of user21. This is because user18 has a longer service line than user21.
Figure 7.
Loop impedance of user18 and user21.
The four LR models developed earlier using the linearized approximation of power flow equation associating P and Q consumption and V at user phases shown in (1) were employed to determine the user topology. Mean values of P sensitivities of each user phase were arranged in ascending order to obtain the topology along a phase of a feeder, as proposed in the authors’ previous work [12]. The obtained topology corresponds to the increasing order of loop impedance at users along a feeder phase.
The proposed algorithm for sensitivity analysis-based user topology determination is given in Algorithm 3.
| Algorithm 3: Sensitivity analysis-based user topology determination on a phase of an LV Feeder | |
| Require: | |
| 1. | Active power measurements at user smart meters (P) |
| 2. | Reactive power measurements at user smart meters (Q) |
| 3. | Voltage magnitude measurements at user smart meters () |
| 4. | Phases of all smart meter channels identified by the k-means clustering-based user phase identification approach |
| 5. | Feeder to which each user belongs from DNSP records |
| Process: | |
| 1. | Identifying user phases located closest to the distribution transformer by considering lowest standard deviation in night-time V measurements (ph_a_user02, ph_b_user02 and ph_c_user02) |
| 2. | Developing LR models by taking user02 V measurements as those of the distribution transformer and not considering user02 as a user in the LR models |
| 3. | Obtaining the sensitivities from LR models and determining the user topology along a phase of a feeder by arranging mean P sensitivities of each meter channel (user phase) on considered feeder phase in ascending order |
5. Varied Smart Meter Penetration
Smart meter penetration is the percentage of smart meters over the total number of electricity meters (both smart meters and mechanical meters) in a DN. Generally, a smart meter is installed when an existing mechanical meter expires or when smart meter functionalities are particularly required to cater a tariff structure adopted at a user. The only Australian State to have achieved 100% smart meter penetration to date is the State of Victoria [42].
As mentioned in Section 2, the case study DN had a total of 28 electricity meters, including 21 smart meters and seven mechanical meters corresponding to an original smart meter penetration of 75%. A reduced smart meter penetration from this was achieved by the exclusion of a number of randomly selected smart meters from the study, lowering the resultant smart meter penetration below the original penetration of 75%.
Even though with an original smart meter penetration of 75%, the presence of smart meters in the case study DN is relatively higher than mechanical meters, the low number of meters in overall can be identified as a limitation of this study. This is because exclusion of smart meters results in low resolution step changes in the DN. However, the case study DN with 14 single-phase and seven three-phase smart meters is representative of a generic unbalanced urban Australian DN.
Dependency of performance accuracy of proposed user phase identification, verification, and user topology determination algorithms on smart meter penetration was investigated by testing them on varied levels of smart meter penetration. Thus, in addition to the original smart meter penetration level of 75%, two reduced smart meter penetration levels of 50% and 25% were examined by randomly excluding users with smart meters from the analysis. At both reduced smart meter penetration levels, ten unique iterations were performed by randomly choosing ten groups of users to be removed as shown in Table 3 and Table 4. Thereby, the performance accuracy at reduced smart meter penetration levels was found by taking the average of resultant accuracy shown at each iteration. It is important to note that user02 was not removed in any test, because it was necessary to keep it to build the LR models where its V measurements were used as distribution transformer V values.
Table 3.
Users removed randomly at 50% smart meter penetration.
Table 4.
Users removed randomly at 25% smart meter penetration.
Though the same number of users were removed at each iteration to achieve a given reduced smart meter penetration level, the number of smart meter channels (user phases) involved in the analysis was not the same for every iteration. This is because the random removal of users can include different combinations of single- and three-phase users. For example, consider Group_01 and Group_02 at 50% smart meter penetration level shown in Table 3. In Group_01, user07, user14, and user12 are three-phase users while the others are single-phase users. Thus, Group_01 removes 13 user phases resulting in 22 user phases for the analysis. In Group_02, user22 and user12 are three-phase users while the others are single-phase users. Thus, Group_02 removes 11 user phases, resulting in 24 user phases for the analysis.
6. Results and Discussion
As discussed in Section 1, this study was focused on presenting a simple and reliable smart meter data-driven approach of user phase identification, user phase verification, and user topology determination in LV DNs as an alternative to conventional methods of manual inspections and/or placement of µPMUs, rather than intending on outperforming any existing smart meter data-driven methods. Therefore, this section discusses the results of this study in detail, rather than comparing them against other studies presented in the literature.
6.1. k-Means Clustering-Based User Phase Identification
The performance of the proposed k-means clustering-based user phase identification approach was evaluated using four metrics: accuracy, precision, recall, and F1 score. Accuracy represents the fraction of correctly predicted instances over the entire dataset. Precision indicates how many of the positive predictions are actually correct, while recall reflects how many of the actual positive instances are successfully identified. The F1 score combines precision and recall through their harmonic mean, providing a balanced measure of classification performance. When the accuracy reaches 100%, it indicates that all instances have been correctly classified, and consequently, precision, recall, and F1 score also attain 100%. In this study, macro averaging was employed, where the evaluation metrics are independently computed for each class (phase) and then averaged without weighting, giving equal importance to all classes regardless of their sample sizes.
The proposed k-means clustering-based user phase identification approach was able to identify the phases of all smart meter channels correctly except for user28, whose phase could not be verified with the network explorer software utilized by the DNSP. However, it was assumed that the phase of user28 was correctly identified by the proposed approach considering its accurate performance with all other user phases. Thus, at 75% of original smart meter penetration level, the proposed k-means clustering-based user phase identification approach could correctly identify the phases of all 35 user phases resulting in a performance accuracy of 100%.
Resultant accuracy, precision, recall, and F1 score of each iteration at 50% and 25% smart meter penetration levels are provided in Table 5 and Table 6, respectively, with the accuracy further elaborated in Figure 8. In Figure 8, smart meter penetration increases along the x-axis, while performance accuracy, representing the percentage of user phases correctly identified by the proposed user phase identification approach, increases along the y-axis. Each marker represents the performance accuracy of an iteration undertaken at respective smart meter penetration level. At 50% smart meter penetration, within 71% and 100% of user phases were correctly identified during the considered ten iterations, corresponding to average accuracy, precision, recall, and F1 score of 86%, 88%, 86%, and 86%, respectively. At 25% smart meter penetration, average accuracy, precision, recall, and F1 score of 88%, 90%, 88%, and 88% were respectively shown with a minimum and maximum accuracy of 67% and 100%, respectively.
Table 5.
Resultant accuracy, precision, recall, and F1 score of proposed user phase identification approach at 50% smart meter penetration.
Table 6.
Resultant accuracy, precision, recall, and F1 score of proposed user phase identification approach at 25% smart meter penetration.
Figure 8.
Accuracy of user phase identification method at 75%, 50%, and 25% smart meter penetration.
It is observable that the performance of proposed k-means clustering-based user phase identification approach is not solely dependent upon the level of smart meter penetration, but it also depends on the location of available smart meters within the DN. For example, as visible in Table 5, both Iteration_01 and Iteration_04 at 50% smart meter penetration had a total of 22 user phases in the analysis, but the resultant accuracies were different. It is also evident that the higher the smart meter penetration, the higher the accuracy that can be expected. Nevertheless, it can be concluded that the proposed k-means clustering-based user phase identification approach maintains high average accuracy even at low smart meter penetration levels.
6.2. Sensitivity Analysis-Based User Phase Verification
Table 7 presents the accuracy of proposed sensitivity analysis-based phase verification approach with each LR model by considering the number of user phases correctly verified at 75% of original smart meter penetration. LRmodel_01 had an accuracy of 91% with ph_a_user22, ph_a_user24, and ph_c_user17 not correctly verified. ph_c_user01 and ph_a_user05 were not correctly verified by LRmodel_02 and LRmodel_03, respectively. Thus, both of them had an accuracy of 97%. LRmodel_04 verified all user phases correctly and had an accuracy of 100%. According to Figure 6, when a certain user phase was not correctly verified, it was either due to having the same number of negative P sensitivities on multiple phases making it impossible to distinctly identify one phase, or due to having a higher number of negative P sensitivities on a different phase making it identified as belonging to a wrong phase.
Table 7.
Phase verification performance accuracy of developed LR models at 75% smart meter penetration.
As the three-phase user user02 was not considered as a user in LR models, its phases were not directly verified by the proposed sensitivity analysis-based phase verification method. Therefore, the number of user phases to be verified by the proposed user phase verification tool was always three less than the number of user phases identified by the proposed user phase identification tool. However, the phases of user02 were indirectly verified by the accurate performance of LR models where its V measurements were used at respective phases of distribution transformer. Moreover, the smart meter penetration levels remained the same in both the proposed user phase identification and verification approaches, because even though user02 was not considered as a user in the proposed user phase verification method, the smart meter measurements of user02 were utilized as distribution transformer measurements.
Dependency of performance accuracy of the proposed sensitivity analysis-based user phase verification approach on smart meter penetration level was examined by testing each LR model on reduced smart meter penetration levels. Here also, ten iterations were performed at each reduced smart meter penetration levels of 50% and 25%, whose results are demonstrated in Figure 9.
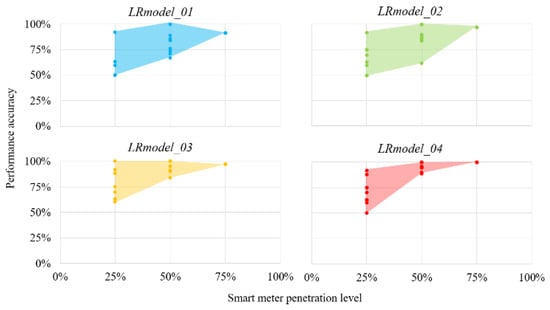
Figure 9.
Accuracy of user phase verification method at 75%, 50%, and 25% smart meter penetration.
The minimum, maximum, and average accuracies shown by each LR model in verifying user phases at 50% and 25% smart meter penetration levels are given in Table 8 and Table 9, respectively. Accordingly, it was observable that at 50% smart meter penetration, all four LR models maintained an average accuracy above 80%. However, as the smart meter penetration was further lowered to 25%, the average accuracy dropped significantly. Thus, it can be concluded that if a DN has at least 50% of smart meter penetration, the proposed k-means clustering-based user phase identification approach can be further verified with the successful application of proposed sensitivity analysis-based user phase verification tool.
Table 8.
Phase verification performance accuracy of developed LR models at 50% smart meter penetration.
Table 9.
Phase verification performance accuracy of developed LR models at 25% smart meter penetration.
6.3. Sensitivity Analysis-Based User Topology Determination
Details of the user topology determination results at original smart meter penetration of 75% are provided in Table 10. It can be observed that all four LR models were able to determine the user topology on feeder phases with a maximum of two users incorrectly determined. Dependency of proposed user topology determination approach on smart meter penetration level was also investigated, by conducting ten iterations at each reduced smart meter penetration level. Accordingly, it was observable that at 50% and 25% reduced smart meter penetration levels, the proposed tool determined the topology of users with a maximum of two and one incorrectly located users, respectively. At all smart meter penetration levels examined here, the majority of the incorrectly located users were found to be three-phase and/or having installed rooftop solar PV systems. Thus, it can be concluded that even though the proposed user topology determination approach is slightly challenged by the interaction among the phases at three-phase users and by the intermittency of solar generation, it can offer adequate accuracy even at low smart meter penetration levels.
Table 10.
Accuracy of user topology determination at 75% smart meter penetration.
7. Conclusions
This paper presented a novel smart meter data-driven k-means clustering-based user phase identification tool, which performed with 100% accuracy at original smart meter penetration of 75% in the case study DN as well as acceptably accurate performance with reduced smart meter penetrations. A voltage-to-power sensitivity analysis-based user phase verification tool was then proposed by leveraging a linearized power flow approximation and developing four distinct LR models to further verify the results of proposed user phase identification tool. The proposed user phase verification tool with all four LR models had accuracies greater than 90% at 75% of original smart meter penetration in the DN. When tested on reduced smart meter penetrations, it was found that if a DN has at least 50% of smart meter penetration, the proposed user phase identification approach can be successfully verified with the proposed user phase verification tool. Finally, a voltage-to-power sensitivity analysis-based user topology determination tool was proposed using the same four LR models built for user phase verification. At smart meter penetration levels of 75%, 50% and 25%, the proposed tool determined the user topology with a maximum of two, two, and one incorrectly located users, respectively. It was observable that the majority of the incorrectly located users were three-phase and/or had installed rooftop solar PV systems, which can be further investigated in future studies.
Changes in DN configuration and/or characteristics were not considered in this study. If the DN changes, the LR model needs to be retrained. However, this will not be a complex task as the LR model training is fast and dependent on the size of training dataset, which was only one month in this study. Even though this study was performed only on an underground DN, the method is applicable for overhead DNs and mixed DNs, as it is mainly a change of DN impedance parameters. As most of the urban DNs in Australia are underground at present, the DN analyzed in this study is considered as a good representation of a typical urban Australian DN.
This study was conducted on a real DN to maintain clarity and ensure that the results reflect practical operating conditions. The selection of the case study DN was guided by two key requirements: (i) a high penetration of smart meters and (ii) the availability of high-quality smart meter data recordings. The partnering DNSP is currently rolling out smart meters across their service area, and all new DNs under their jurisdiction are underground. Extending the study to simulated DNs and to real DNs with mixed overhead-underground configurations can be considered as part of future work to further generalize and evaluate the proposed methodology.
Several challenges may arise when applying the proposed methods in practice. One such challenge is the variability in smart meter quality, which can introduce inconsistencies across users and may influence the performance of the proposed methods. In addition, missing or incomplete smart meter data can reduce the reliability of the analysis. While this study excluded such timestamps without applying interpolation or synthetic data generation, so as to avoid introducing artificial patterns, future studies may consider suitable data interpolation or reconstruction techniques when appropriate. We also emphasize that the P and Q standard deviation thresholds must be tuned according to the DN under study, as variability levels differ across networks and LR requires sufficient P and Q variance to capture the underlying network characteristics. Moreover, practical considerations such as communication bandwidth limitations for retrieving detailed smart meter data and the requirement for scalable database infrastructure capable of storing and processing large datasets of fine-grained smart meter measurements may present further constraints.
At last, it is proposed that the performance of proposed user phase identification, phase verification, and user topology determination tools can be further improved by using techniques such as data augmentation. Furthermore, benchmarking the proposed methods against advanced ML techniques can be considered as an important avenue for future studies. It is suggested that the proposed tools can be utilized for more advanced power engineering applications such as data-driven model-free voltage calculation.
Author Contributions
Conceptualization, T.K., B.B., J.C.K. and D.A.R.; Methodology, T.K. and B.B.; Writing—Original Draft Preparation, T.K.; Writing—Review and Editing, B.B., J.C.K. and D.A.R. All authors have read and agreed to the published version of the manuscript.
Funding
This research was funded by Gridsight through a Higher Degree Research Scholarship at the University of Wollongong.
Data Availability Statement
Data is unavailable due to privacy or ethical restrictions.
Acknowledgments
The authors wish to acknowledge the contributions of Gridsight and Endeavour Energy for their technical support and access to field data.
Conflicts of Interest
Author Brendan Banfield was employed by the company Gridsight. The remaining authors declare that the research was conducted in the absence of any commercial or financial relationships that could be construed as a potential conflict of interest. The authors declare that this study received funding from Gridsight. The funder was not involved in the study design, collection, analysis, interpretation of data, the writing of this article, or the decision to submit it for publication.
References
- Hosseini, Z.S.; Khodaei, A.; Paaso, A. Machine Learning-Enabled Distribution Network Phase Identification. IEEE Trans. Power Syst. 2021, 36, 842–850. [Google Scholar] [CrossRef]
- Therrien, F.; Blakely, L.; Reno, M.J. Assessment of Measurement-Based Phase Identification Methods. IEEE Open Access J. Power Energy 2021, 8, 128–137. [Google Scholar] [CrossRef]
- Izadi, M.; Mohsenian-Rad, H. Improving Real-world Measurement-based Phase Identification in Power Distribution Feeders with a Novel Reliability Criteria Assessment. In Proceedings of the 2021 IEEE PES Innovative Smart Grid Technologies Europe (ISGT Europe), Espoo, Finland, 18–21 October 2021; pp. 1–5. [Google Scholar] [CrossRef]
- Athanasiadis, C.L.; Papadopoulos, T.A.; Kryonidis, G.C.; Doukas, D.I. A review of distribution network applications based on smart meter data analytics. Renew. Sustain. Energy Rev. 2024, 191, 114151. [Google Scholar] [CrossRef]
- Wang, Y.; Chen, Q.; Hong, T.; Kang, C. Review of Smart Meter Data Analytics: Applications, Methodologies, and Challenges. IEEE Trans. Smart Grid 2019, 10, 3125–3148. [Google Scholar] [CrossRef]
- Wang, W.; Yu, N. Maximum Marginal Likelihood Estimation of Phase Connections in Power Distribution Systems. IEEE Trans. Power Syst. 2020, 35, 3906–3917. [Google Scholar] [CrossRef]
- Xu, Z.; Jiang, W.; Xu, J.; Wu, L.; Wang, M.; Chen, J.; Chen, Y.; Zhao, J. Distribution Network Topology Identification Using Smart Meter Data and Considering the Same-Bus-Different-Feeder Condition. IEEE Trans. Ind. Inform. 2022, 19, 8600–8613. [Google Scholar] [CrossRef]
- Wang, Y.; Liu, M.Z.; Ochoa, L.F. Assessing the effects of DER on voltages using a smart meter-driven three-phase LV feeder model. Electr. Power Syst. Res. 2020, 189, 106705. [Google Scholar] [CrossRef]
- Chan, W.J. Broken Neutral Classification through Anomaly Detection using Features based on Voltage and Current Observations. In Proceedings of the 2021 IEEE PES Innovative Smart Grid Technologies—Asia (ISGT Asia), Brisbane, Australia, 5–8 December 2021; pp. 1–5. [Google Scholar] [CrossRef]
- Bassi, V.; Ochoa, L.F.; Alpcan, T.; Leckie, C. Electrical Model-Free Voltage Calculations Using Neural Networks and Smart Meter Data. IEEE Trans. Smart Grid 2023, 14, 3271–3282. [Google Scholar] [CrossRef]
- Weckx, S.; D’Hulst, R.; Driesen, J. Voltage Sensitivity Analysis of a Laboratory Distribution Grid with Incomplete Data. IEEE Trans. Smart Grid 2015, 6, 1271–1280. [Google Scholar] [CrossRef]
- Kalinga, T.; Banfield, B.; Knott, J.C.; Robinson, D.A. Smart Meter Data-Driven Characterization of LV Electricity Distribution Networks. In Proceedings of the 2023 IEEE International Conference on Energy Technologies for Future Grids (ETFG), Wollongong, Australia, 3–6 December 2023; pp. 1–6. [Google Scholar] [CrossRef]
- Yi, Y.; Liu, S.; Zhang, Y.; Xue, Y.; Deng, W.; Li, Q. Phase Identification of Low-Voltage Distribution Network Based on Stepwise Regression Method. J. Mod. Power Syst. Clean Energy 2023, 11, 1224–1234. [Google Scholar] [CrossRef]
- Wang, X.; Zhao, Y.; Zhou, Y. A Data-Driven Topology and Parameter Joint Estimation Method in Non-PMU Distribution Networks. IEEE Trans. Power Syst. 2024, 39, 1681–1692. [Google Scholar] [CrossRef]
- Zhang, J.; Wang, Y.; Weng, Y.; Zhang, N. Topology Identification and Line Parameter Estimation for Non-PMU Distribution Network: A Numerical Method. IEEE Trans. Smart Grid 2020, 11, 4440–4453. [Google Scholar] [CrossRef]
- Pengwah, A.B.; Gerdroodbari, Y.Z.; Razzaghi, R.; Andrew, L.L.H. Topology Identification of Distribution Networks with Partial Smart Meter Coverage. IEEE Trans. Power Deliv. 2024, 39, 992–1001. [Google Scholar] [CrossRef]
- Xu, M.; Li, R.; Li, F. Phase Identification with Incomplete Data. IEEE Trans. Smart Grid 2018, 9, 2777–2785. [Google Scholar] [CrossRef]
- Dahale, S.; Pahwa, A.; Natarajan, B. Phase Identification in Unobservable Distribution Systems. IEEE Trans. Power Deliv. 2023, 38, 3067–3075. [Google Scholar] [CrossRef]
- García, S.; Fresia, M.; Mora-Merchán, J.M.; Carrasco, A.; Personal, E.; León, C. A data-driven topology identification method for low-voltage distribution networks based on the wavelet transform. Electr. Power Syst. Res. 2025, 243, 111517. [Google Scholar] [CrossRef]
- Srinivas, V.L.; Wu, J. Topology and Parameter Identification of Distribution Network Using Smart Meter and µPMU Measurements. IEEE Trans. Instrum. Meas. 2022, 71, 1–14. [Google Scholar] [CrossRef]
- Pappu, S.J.; Bhatt, N.; Pasumarthy, R.; Rajeswaran, A. Identifying Topology of Low Voltage Distribution Networks Based on Smart Meter Data. IEEE Trans. Smart Grid 2018, 9, 5113–5122. [Google Scholar] [CrossRef]
- Guo, L.; Yang, G.; Liu, Y.; Zhang, Y.; Wang, Z.; Yu, H.; Wang, Y.; Wang, C. Topology and Parameter Identification of Three-Phase Low-Voltage Distribution Network and Voltage Control Strategy Based on User Smart Meter Measurements: A Data-Driven Approach. IEEE Trans. Instrum. Meas. 2025, 74, 1–13. [Google Scholar] [CrossRef]
- Jiao, F.; Li, Z.; Ai, J.; Yang, H.; Deng, Y.; Li, D.; Gao, W.; Lai, Z.; Fu, X. Topology Identification Method for Low-Voltage Distribution Node Networks Based on Density Clustering Using Smart Meter Real-Time Measurement Data. IEEE Access 2024, 12, 83600–83610. [Google Scholar] [CrossRef]
- Kakkar, R.; Agrawal, S.; Tanwar, S. Artificial Intelligence-Based Electric Vehicle Charging Station Load Forecasting Scheme for Smart Grid System. Concurr. Comput. 2025, 37, e70083. [Google Scholar] [CrossRef]
- Baseer, M.A.; Almunif, A.; Alsaduni, I.; Tazeen, N. Electrical Power Generation Forecasting from Renewable Energy Systems Using Artificial Intelligence Techniques. Energies 2023, 16, 6414. [Google Scholar] [CrossRef]
- Anwar, T.; Mu, C.; Yousaf, M.Z.; Khan, W.; Khalid, S.; Hourani, A.O.; Zaitsev, I. Robust fault detection and classification in power transmission lines via ensemble machine learning models. Sci. Rep. 2025, 15, 2549. [Google Scholar] [CrossRef] [PubMed]
- Olojede, D.; King, S.; Jennions, I. Application of machine learning in power grid fault detection and maintenance. Energy Inform. 2025, 8, 119. [Google Scholar] [CrossRef]
- Zheng, Z.; Li, P.; Cui, W.; Liu, Y.; Sun, M.; Chi, Y.; Yang, Q.; Chen, Y. Research on Intelligent Voltage Regulation Method Within a Station Based on Multi-Agent Reinforcement Learning. IEEE Access 2025, 13, 49852–49860. [Google Scholar] [CrossRef]
- Saleem; Raza, M.A.; Umer, S.W.; Faheem, M.; Jumani, T.A.; Yameen, M. An Intelligent Frequency Control Scheme for Inverting Station in High Voltage Direct Current Transmission System. Eng. Rep. 2025, 7, e13106. [Google Scholar] [CrossRef]
- Liu, L.; Shi, N.; Wang, Z.; Reno, M.J.; Azzolini, J.A. Probabilistic Estimation of PV Hosting Capacity in DER-Rich Feeders Using Smart Meter Data. IEEE Trans. Smart Grid 2025, 16, 4293–4296. [Google Scholar] [CrossRef]
- Zhang, N.; Yan, J.; Hu, C.; Sun, Q.; Yang, L.; Gao, D.W.; Guerrero, J.M.; Li, Y. Price-Matching-Based Regional Energy Market with Hierarchical Reinforcement Learning Algorithm. IEEE Trans. Ind. Inf. 2024, 20, 11103–11114. [Google Scholar] [CrossRef]
- Aliyon, K.; Ritvanen, J. Deep learning-based electricity price forecasting: Findings on price predictability and European electricity markets. Energy 2024, 308, 132877. [Google Scholar] [CrossRef]
- Wang, Y.; Liu, C.; Yuan, W.; Li, L. MRL-Based Model for Diverse Bidding Decision-Makings of Power Retail Company in the Wholesale Electricity Market of China. Axioms 2023, 12, 142. [Google Scholar] [CrossRef]
- Dande, C.S.C.; Efkarpidis, N.A.; Christen, M.; Ginocchi, M.; Monti, A. Consumer phase identification in distribution grids using Graph Neural Networks based on synthetic and measured power profiles. Energy AI 2025, 22, 100607. [Google Scholar] [CrossRef]
- Liu, D.; Giraldo, J.S.; Palensky, P.; Vergara, P.P. A siamese neural network model for phase identification in distribution networks. Int. J. Electr. Power Energy Syst. 2025, 169, 110718. [Google Scholar] [CrossRef]
- Li, H.; Weng, Y.; Vittal, V.; Blasch, E. Distribution Grid Topology and Parameter Estimation Using Deep-Shallow Neural Network with Physical Consistency. IEEE Trans. Smart Grid 2024, 15, 655–666. [Google Scholar] [CrossRef]
- Ebtia, A.; Ghafouri, M.; Debbabi, M.; Kassouf, M.; Mohammadi, A. Power Distribution Network Topology Detection Using Dual-Graph Structure Graph Neural Network Model. IEEE Trans. Smart Grid 2025, 16, 1833–1850. [Google Scholar] [CrossRef]
- Mirtaheri, S.L.; Shahbazian, R. Machine Learning: Theory to Applications; CRC Press: Boca Raton, FL, USA, 2022. [Google Scholar]
- Sun, L.; Chen, Y.; Du, Q.; Xu, H.; Wang, W. Identification of low-voltage phase lines using IEC 61850 and K-means clustering. Electr. Power Syst. Res. 2024, 234, 110597. [Google Scholar] [CrossRef]
- Fazio, A.R.D.; Perna, S.; Russo, M.; De Santis, M. Linear Power Flow Method for Radial Distribution Systems Including Voltage Control Devices. IEEE Trans. Ind. Appl. 2024, 60, 4749–4761. [Google Scholar] [CrossRef]
- Pedregosa, F.; Varoquaux, G.; Gramfort, A.; Michel, V.; Thirion, B.; Grisel, O.; Blondel, M.; Prettenhofer, P.; Weiss, R.; Dubourg, R.; et al. Scikit-learn: Machine Learning in Python. J. Mach. Learn. Res. 2011, 12, 2825–2830. [Google Scholar]
- AEMC. Review of the Regulatory Framework for Metering Services, Final Report; AEMC: Sydney, Australia, 2023. [Google Scholar]
Disclaimer/Publisher’s Note: The statements, opinions and data contained in all publications are solely those of the individual author(s) and contributor(s) and not of MDPI and/or the editor(s). MDPI and/or the editor(s) disclaim responsibility for any injury to people or property resulting from any ideas, methods, instructions or products referred to in the content. |
© 2025 by the authors. Licensee MDPI, Basel, Switzerland. This article is an open access article distributed under the terms and conditions of the Creative Commons Attribution (CC BY) license.