Article

Droplet-Scale Combustion Analysis of Third-Generation Biodiesel–Diesel Blends

by
A. S. M. Sazzad Parveg
and
Albert Ratner
*
Department of Mechanical Engineering, University of Iowa, Iowa City, IA 52242, USA
*
Author to whom correspondence should be addressed.
Energies 2025, 18(7), 1692; https://doi.org/10.3390/en18071692
Submission received: 1 March 2025 / Revised: 22 March 2025 / Accepted: 24 March 2025 / Published: 28 March 2025
(This article belongs to the Section I1: Fuel)

Abstract

:
Biodiesel derived from waste cooking oil (WCO) and animal fats is a promising alternative to fossil fuels, offering environmental benefits and renewable energy potential. However, a detailed understanding of its combustion characteristics at the droplet scale is essential for optimizing its practical application. This study investigates the combustion behavior of biodiesel–diesel blends (B5, B10, B15, B20, B25, B50, B75) and neat fuels (B0 and B100) by analyzing combustion rates, pre-ignition time, burning time, droplet morphology, and puffing characteristics. The results demonstrate that biodiesel concentration strongly influences combustion dynamics. Higher blends (B50, B75) exhibit enhanced steady combustion rates due to increased oxygen availability, while lower blends (B5–B25) experience stronger puffing events, leading to greater secondary droplet formation. The global combustion rate follows a non-linear trend, peaking at B10, decreasing at B25, and rising again at B50 and B75. Pre-ignition time increases with biodiesel content, while burning time exhibits an inverse relationship with combustion rate. Four distinct puffing mechanisms were identified, with lower blends producing finer secondary droplets and higher blends forming larger droplets. Puffing characteristics were evaluated based on puffing occurrences, intensity, and effectiveness, revealing that puffing peaks at B25 in occurrence and at B10 in intensity, while higher blends (B50, B75) exhibit notable puffing effectiveness. This study addresses a critical research gap in droplet-scale combustion of WCO and animal fat-derived biodiesel across a wide range of blend ratios (B5–B75). The findings provide key insights for optimizing biodiesel formulations to improve fuel spray atomization, ignition stability, and combustion efficiency in spray-based combustion systems, such as diesel engines, gas turbines, and industrial burners, bridging fundamental research with real-world applications.

1. Introduction

The increasing global energy demand continues to be met primarily by petroleum-based fuels, which account for a significant share of transportation and industrial energy consumption. As of 2022, fossil fuels supply approximately 80% of the world’s primary energy demand, with petroleum-based liquid fuels contributing around 28% of total consumption [1,2]. Despite global efforts toward decarbonization, fossil liquid fuels are expected to remain a major energy source beyond 2050 due to their widespread availability and existing infrastructure. However, reliance on petroleum fuels poses several challenges, including climate change, environmental pollution, and energy security risks. The combustion of fossil fuels is a major contributor to greenhouse gas (GHG) emissions, exacerbating global warming. Additionally, pollutants such as nitrogen oxides (NOx), sulfur oxides (SOx), and particulate matter (PM) degrade air quality and pose significant health risks [3]. Furthermore, petroleum fuel prices are subject to geopolitical instability, leading to market fluctuations and energy security concerns. These issues necessitate the development of sustainable and renewable fuel alternatives, with biofuels, particularly biodiesel, emerging as a promising solution [4].
Biodiesel, a renewable fuel derived from biological feedstocks, has gained attention as an alternative to petroleum diesel due to its lower carbon footprint, biodegradability, and compatibility with existing diesel engines. Unlike fossil fuels, biodiesel contains oxygenated compounds, which enhance combustion efficiency and reduce emissions of carbon monoxide (CO), unburned hydrocarbons (UHC), and PM [5,6]. Additionally, biodiesel has a higher cetane number and improved lubricity, enhancing engine performance and longevity. However, biodiesel also presents challenges, including higher viscosity, lower energy density, and oxidation instability, which can affect fuel injection, combustion efficiency, and storage stability [7]. These limitations necessitate further research into optimizing biodiesel formulations and understanding droplet-scale combustion behavior to ensure its efficient use in practical applications.
Biodiesel feedstocks can be classified into four generations based on their origin and sustainability. First-generation biodiesel is derived from edible vegetable oils such as soybean, palm, and canola oil. Second-generation biodiesel is produced from non-edible oils, including jatropha, karanja, and castor oil. Third-generation biodiesel includes fuels derived from waste cooking oil (WCO) and animal fats, as these feedstocks utilize industrial and household waste materials, reducing disposal-related environmental concerns. Fourth-generation biodiesel refers to algae-derived biofuels, which have high growth rates and carbon sequestration potential, making them a promising but currently expensive alternative [8,9]. It is important to note that there is no universal agreement on biodiesel generation classification, as some researchers categorize waste cooking oil (WCO) as second-generation biodiesel, considering its non-edible nature and waste utilization benefits [8,9,10,11,12,13,14,15]. However, for the current study, WCO and animal fat-derived biodiesel will be classified as third generation to emphasize their role in waste recycling and sustainability. Among these feedstocks, third-generation biodiesel (WCO and animal fats) is particularly promising due to its low production cost, waste management benefits, and environmental sustainability. Each year, over 16.5 million tons of WCO are generated globally, much of which is improperly discarded, leading to water contamination and environmental hazards [10]. Utilizing WCO and animal fats for biodiesel production aligns with circular economy principles, reducing waste while producing a viable, renewable fuel source [9,13,14]. The most common method of biodiesel production is transesterification, where triglycerides react with methanol or ethanol in the presence of a catalyst to form fatty acid methyl esters (FAME) and glycerol as a byproduct [7,8,16,17,18,19]. The efficiency of this process depends on several factors, including catalyst selection, reaction temperature, alcohol-to-oil molar ratio, and feedstock composition [7,8,16,17,18,19]. Base catalysts such as sodium hydroxide (NaOH) and potassium hydroxide (KOH) are widely used due to their high reaction rates, while acid catalysts are preferable for high free fatty acid feedstocks [7,8,16,17,18,19]. The physicochemical properties of biodiesel, including viscosity, oxidation stability, and fatty acid saturation, directly impact its combustion characteristics. Understanding these properties and their impact on droplet scale combustion is essential for predicting combustion performance and optimizing biodiesel use in diesel engines, gas turbines, and industrial burners [3,11,16,20,21].
The physicochemical properties of biodiesel–diesel blends—particularly volatility, viscosity, surface tension, and oxygen content—are primarily governed by the fatty acid methyl ester (FAME) composition of the biodiesel component, which significantly influences droplet evaporation and combustion behavior [16,21]. Biodiesels derived from waste cooking oil (WCO) and animal fats typically contain higher proportions of saturated FAMEs, such as methyl palmitate (C16:0) and methyl stearate (C18:0), resulting in higher viscosity, lower volatility, and elevated boiling points [16,21,22,23,24,25,26,27,28]. These characteristics lead to slower evaporation and longer ignition delays. In contrast, vegetable oil-based bio-diesels—such as those from soybean and rapeseed—contain higher levels of unsaturated FAMEs like methyl oleate (C18:1), methyl linoleate (C18:2), and methyl linolenate (C18:3), contributing to faster evaporation, improved volatility, and shorter ignition delays [16,21,22,23,24,25,26,27,28]. While saturated-rich biodiesels generally offer higher cetane numbers—indicating faster chemical ignition—they tend to exhibit poorer atomization and lower volatility, resulting in longer overall ignition delays and increased soot formation under engine relevant conditions [21,24,29]. Conversely, unsaturated biodiesels typically burn more completely and cleanly due to better fuel–air mixing and higher intrinsic oxygen content [21,27,29]. Evaporation behavior varies with both FAME composition and blend ratio. Higher biodiesel blends (≥B50), especially those rich in saturated FAMEs, tend to evaporate more slowly, while lower blends (≤B30) based on unsaturated biodiesels exhibit faster evaporation and more dynamic droplet behavior, including localized boiling and puffing [21,26,28,29,30]. Ignition delay also increases with higher biodiesel content, particularly for saturated-rich fuels, due to their larger molecular size and lower volatility [24,31]. Combustion rates follow a non-linear trend across blend ratios. Lower blends (≤B30) often demonstrate diesel-like performance, while higher blends (≥B50) may require adjusted injection timing or spray strategies to compensate for slower vaporization [21,25,27,32]. Puffing and microexplosions, important mechanisms for secondary atomization, are more pronounced in unsaturated-rich blends due to greater volatility differentials among com-ponents, enhancing fuel–air mixing and combustion efficiency. In contrast, saturated-rich biodiesels typically exhibit weaker and more uniform puffing behavior [21,22,27,28,30]. Soot formation is closely linked to FAME saturation. Biodiesels derived from WCO and animal fats, being saturated-rich, are more prone to soot formation due to incomplete combustion. On the other hand, biodiesels with higher unsaturation levels enable cleaner combustion by promoting soot oxidation through improved atomization and higher oxygen content [21,27,29].
Thus, systematic optimization of biodiesel–diesel blends based on FAME composition is essential to balance ignition timing, combustion efficiency, and emissions control. This understanding directly informs the refinement of fuel injection strategies and combustion chamber design in diesel engines, gas turbines, and industrial burners. Importantly, investigating the droplet-scale combustion behavior of biodiesels from different feedstocks is critical due to the wide variability in FAME profiles. Likewise, analyzing a broad range of blend ratios reveals non-linear combustion trends, which are vital for identifying optimal blending strategies that ensure efficient, clean, and reliable performance in practical spray-based combustion systems. Although biodiesel engine performance has been extensively studied, droplet-scale investigations remain limited. Most existing studies focus on specific blend ratios, particularly lower blends (B ≤ 30), offering only partial insight into droplet-scale combustion behaviors. Given the direct influence of droplet dynamics on spray combustion, a detailed understanding of evaporation, ignition, and flame development at the droplet scale is essential for performance optimization.
This study systematically investigates the droplet-scale combustion characteristics of a broad range of biodiesel–diesel blends (B5, B10, B15, B20, B25, B50, B75), focusing on combustion rate, pre-ignition time, burning time, droplet morphology, and puffing behavior. It also provides specific combustion insights into blends derived from waste cooking oil (WCO) and animal fat-based biodiesels—feedstocks rich in saturated FAMEs—highlighting their distinct effects compared to more unsaturated biodiesels. These results offer a valuable comparison for understanding how feedstock composition influences evaporation, ignition, and secondary atomization, which are crucial for optimizing spray combustion. The findings will be important in supporting the development of more efficient injection strategies, advanced injector design, and optimized combustion chambers—enhancing the practical use of biodiesel in diesel engines, gas turbines, and industrial combustion systems through improved combustion efficiency and emissions control.

2. Materials and Methods

2.1. Materials

The biodiesel used in this study was procured from a local biodiesel manufacturer and was produced from waste cooking oil and animal fats via a base-catalyzed trans-esterification process. Ultra-low-sulfur diesel (ULSD) was sourced from a local gas station. Both fuels were used in their original, unaltered form. Biodiesel–diesel blends were pre-pared by mixing the fuels at specified volume fractions in 20 mL disposable scintillation vials (Fisher Scientific, Hampton, NH, USA). An ultrasonic disruptor (Biologics 300 MP, BioLogics, Inc., Manassas, VA, USA) with a 3/16” probe was used for 15 min, operating at 30% amplitude with 4 s pulses to ensure homogeneity. Seven blends were formulated with biodiesel volume fractions of 5%, 10%, 15%, 20%, 25%, 50%, and 75%, denoted as B5, B10, B15, B20, B25, B50, and B75, respectively. Neat diesel and pure biodiesel were designated as B0 and B100, respectively. The key properties of the neat fuels are summarized in Table 1.

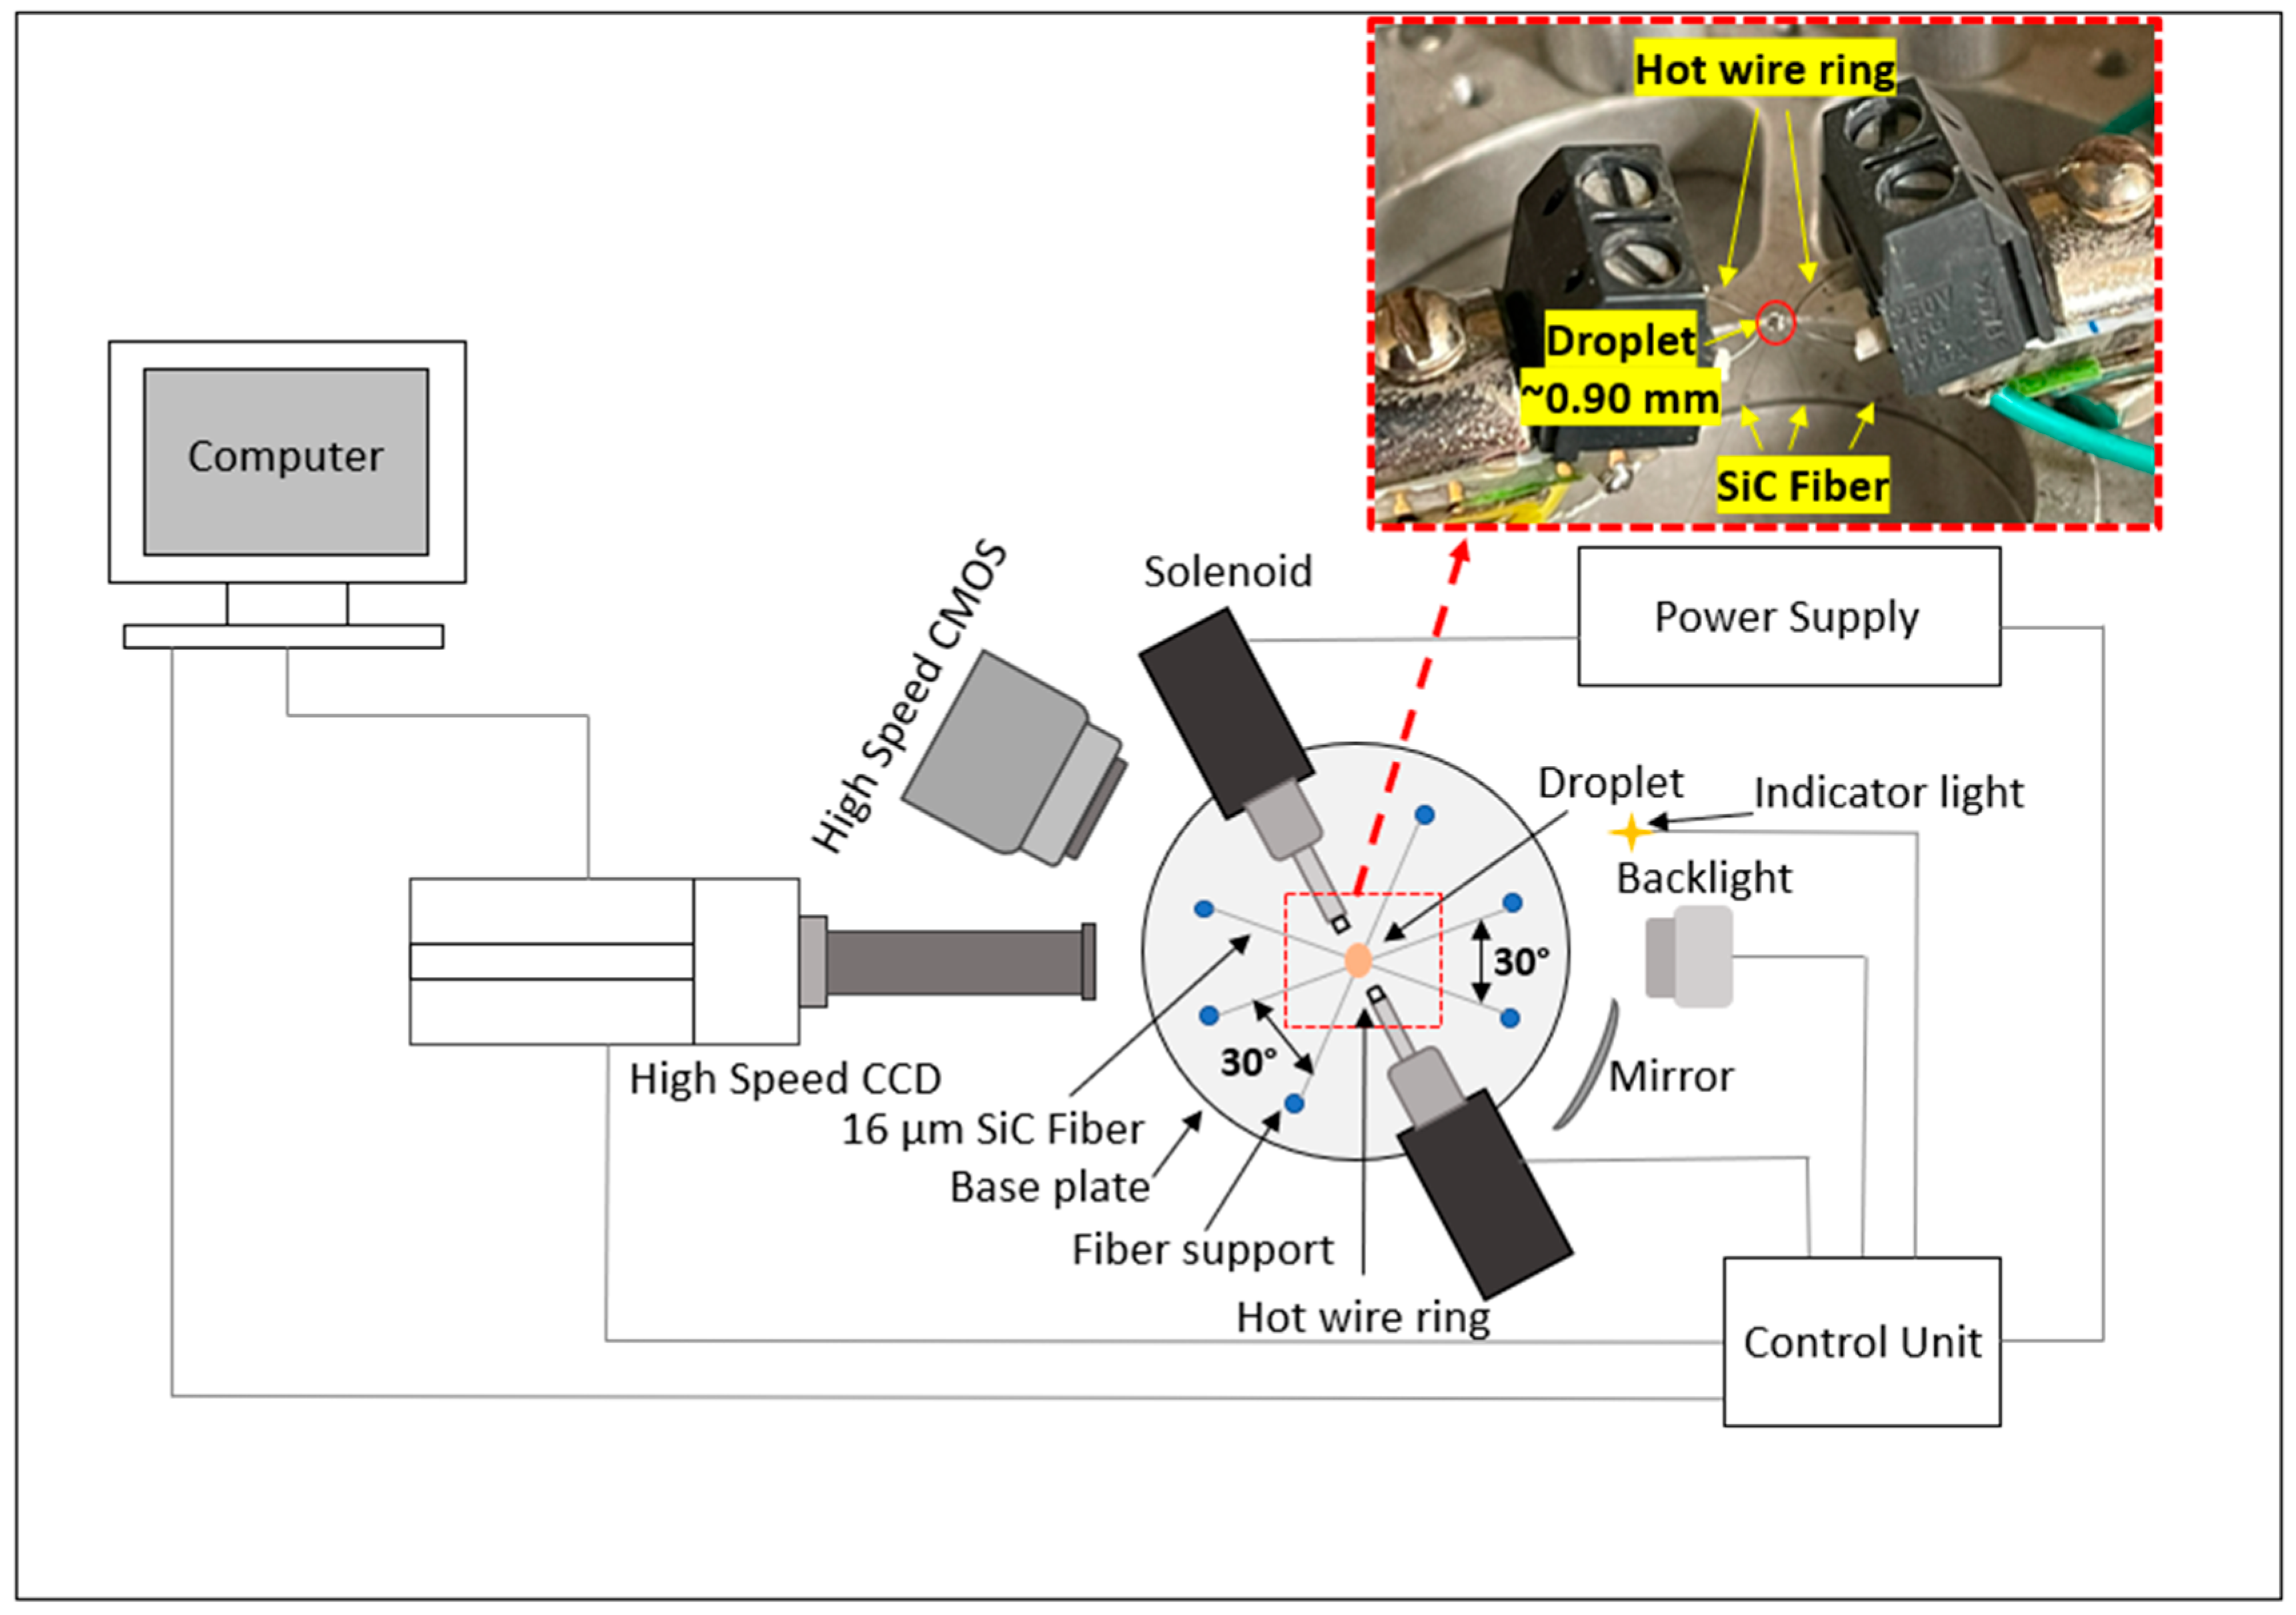
2.2. Experimental Setup

This study utilized a well-established suspended droplet combustion technique with cross-fiber support and shadowgraph imaging to analyze the burning behavior of single fuel droplet. The experimental setup, detailed in [44], involved suspending fuel droplets at the intersection of three fine silicon carbide (SiC) fibers under standard atmospheric conditions (~25 °C, 1 atm). The system included a stable aluminum base, optical support structures, an ignition mechanism, and high-speed cameras for capturing combustion events, as shown in Figure 1. Droplets were held in place using NL-202 Nicalon™ (COI Ceramics, Inc., San Diego, CA, USA) fibers (16 μm diameter) arranged in a cross-fiber configuration and were precisely dispensed at the fiber intersection using a Hamilton micro-syringe (10 µL, Model 701 RN, 26s gauge). Ignition was achieved using two Kanthal A-1 hot wires, symmetrically positioned at an equal distance (~0.60 mm) on either side of the droplet, with solenoids ensuring precise placement for controlled ignition. Two high-speed cameras were used to capture combustion dynamics. The primary camera, an IDT X-StreamVision XS-3 (Integrated Design Tools, Inc., Pasadena, CA, USA), recorded images at 1000 frames per second (fps) with a resolution of 948 × 552 pixels. Paired with a 105 mm Nikon AF MicroNikkor-F/2.8 lens (Nikon Corporation, Urbandale, IA, USA), it provided high-resolution imaging. A bright white LED placed behind the droplet ensured proper illumination for shadowgraph imaging. Camera settings were managed through IDT Motion Studio software (Version 2.10.05), allowing for precise adjustments to track droplet size, shape changes, and combustion behavior. A secondary Casio EXILIM Pro EX-F1 camera (Casio America, Inc., Dover, NJ, USA) recorded at 600 fps with a resolution of 432 × 192 pixels. Using a concave mirror (4” diameter, 9” focal length), it provided a wider field of view to capture key combustion phases, including flame formation, extinction, and overall flame dynamics. This camera was crucial for measuring ignition delay, burning duration, and flame behavior. To ensure proper synchronization of the ignition system and imaging setup, an Arduino UNO microcontroller coordinated the solenoid movements and hot wire activation with the primary camera, ensuring precise timing across all components.
Suspended droplet combustion experiments are sensitive to several experimental factors, which can potentially lead to artifacts in the results. Key factors influencing the experiments include the initial droplet size (d0), the thermo-physical properties of the support fibers, and the droplet-to-fiber diameter ratio both initially (d0/dfiber) and during combustion (ds(t)/dfiber) [20]. Previous studies suggest that for reliable combustion rate quantification under normal gravity conditions, the initial droplet-to-fiber diameter ratio should be at least 36 (d0/dfiber ≥ 36) [20]. Furthermore, to ensure that the fiber does not significantly affect the combustion rate, the instantaneous droplet-to-fiber ratio (ds(t)/dfiber) should remain above 13 during combustion [20]. To reduce potential issues such as soot formation and radiative heat losses, the initial droplet size should ideally be smaller than 1.00 mm [20]. Using microfibers with low thermal conductivity (around 1.50 W/m·K) further minimizes heat transfer effects, ensuring the fibers have minimal impact on the combustion dynamics [20].
For this study, the corresponding values include initial droplet size, d0 = ~0.870 ± 0.034 mm; micro-fiber size, d f i b e r = 0.016 mm; fiber thermal conductivity, λfiber = 1.50 W/mk; and droplet-to-fiber diameter ratio, d0/dfiber = 52 to 57. The combustion rate and quantitative data were quantified within a specified range while adhering to the criterion of ( d s ( t ) /dfiber) > 20. Additionally, temporal changes in droplet shape, evaluated through roundness (R), were monitored to ensure the preservation of the spherical form of burning droplets or to measure any shape deformation, especially during the analysis period for quantitative data.

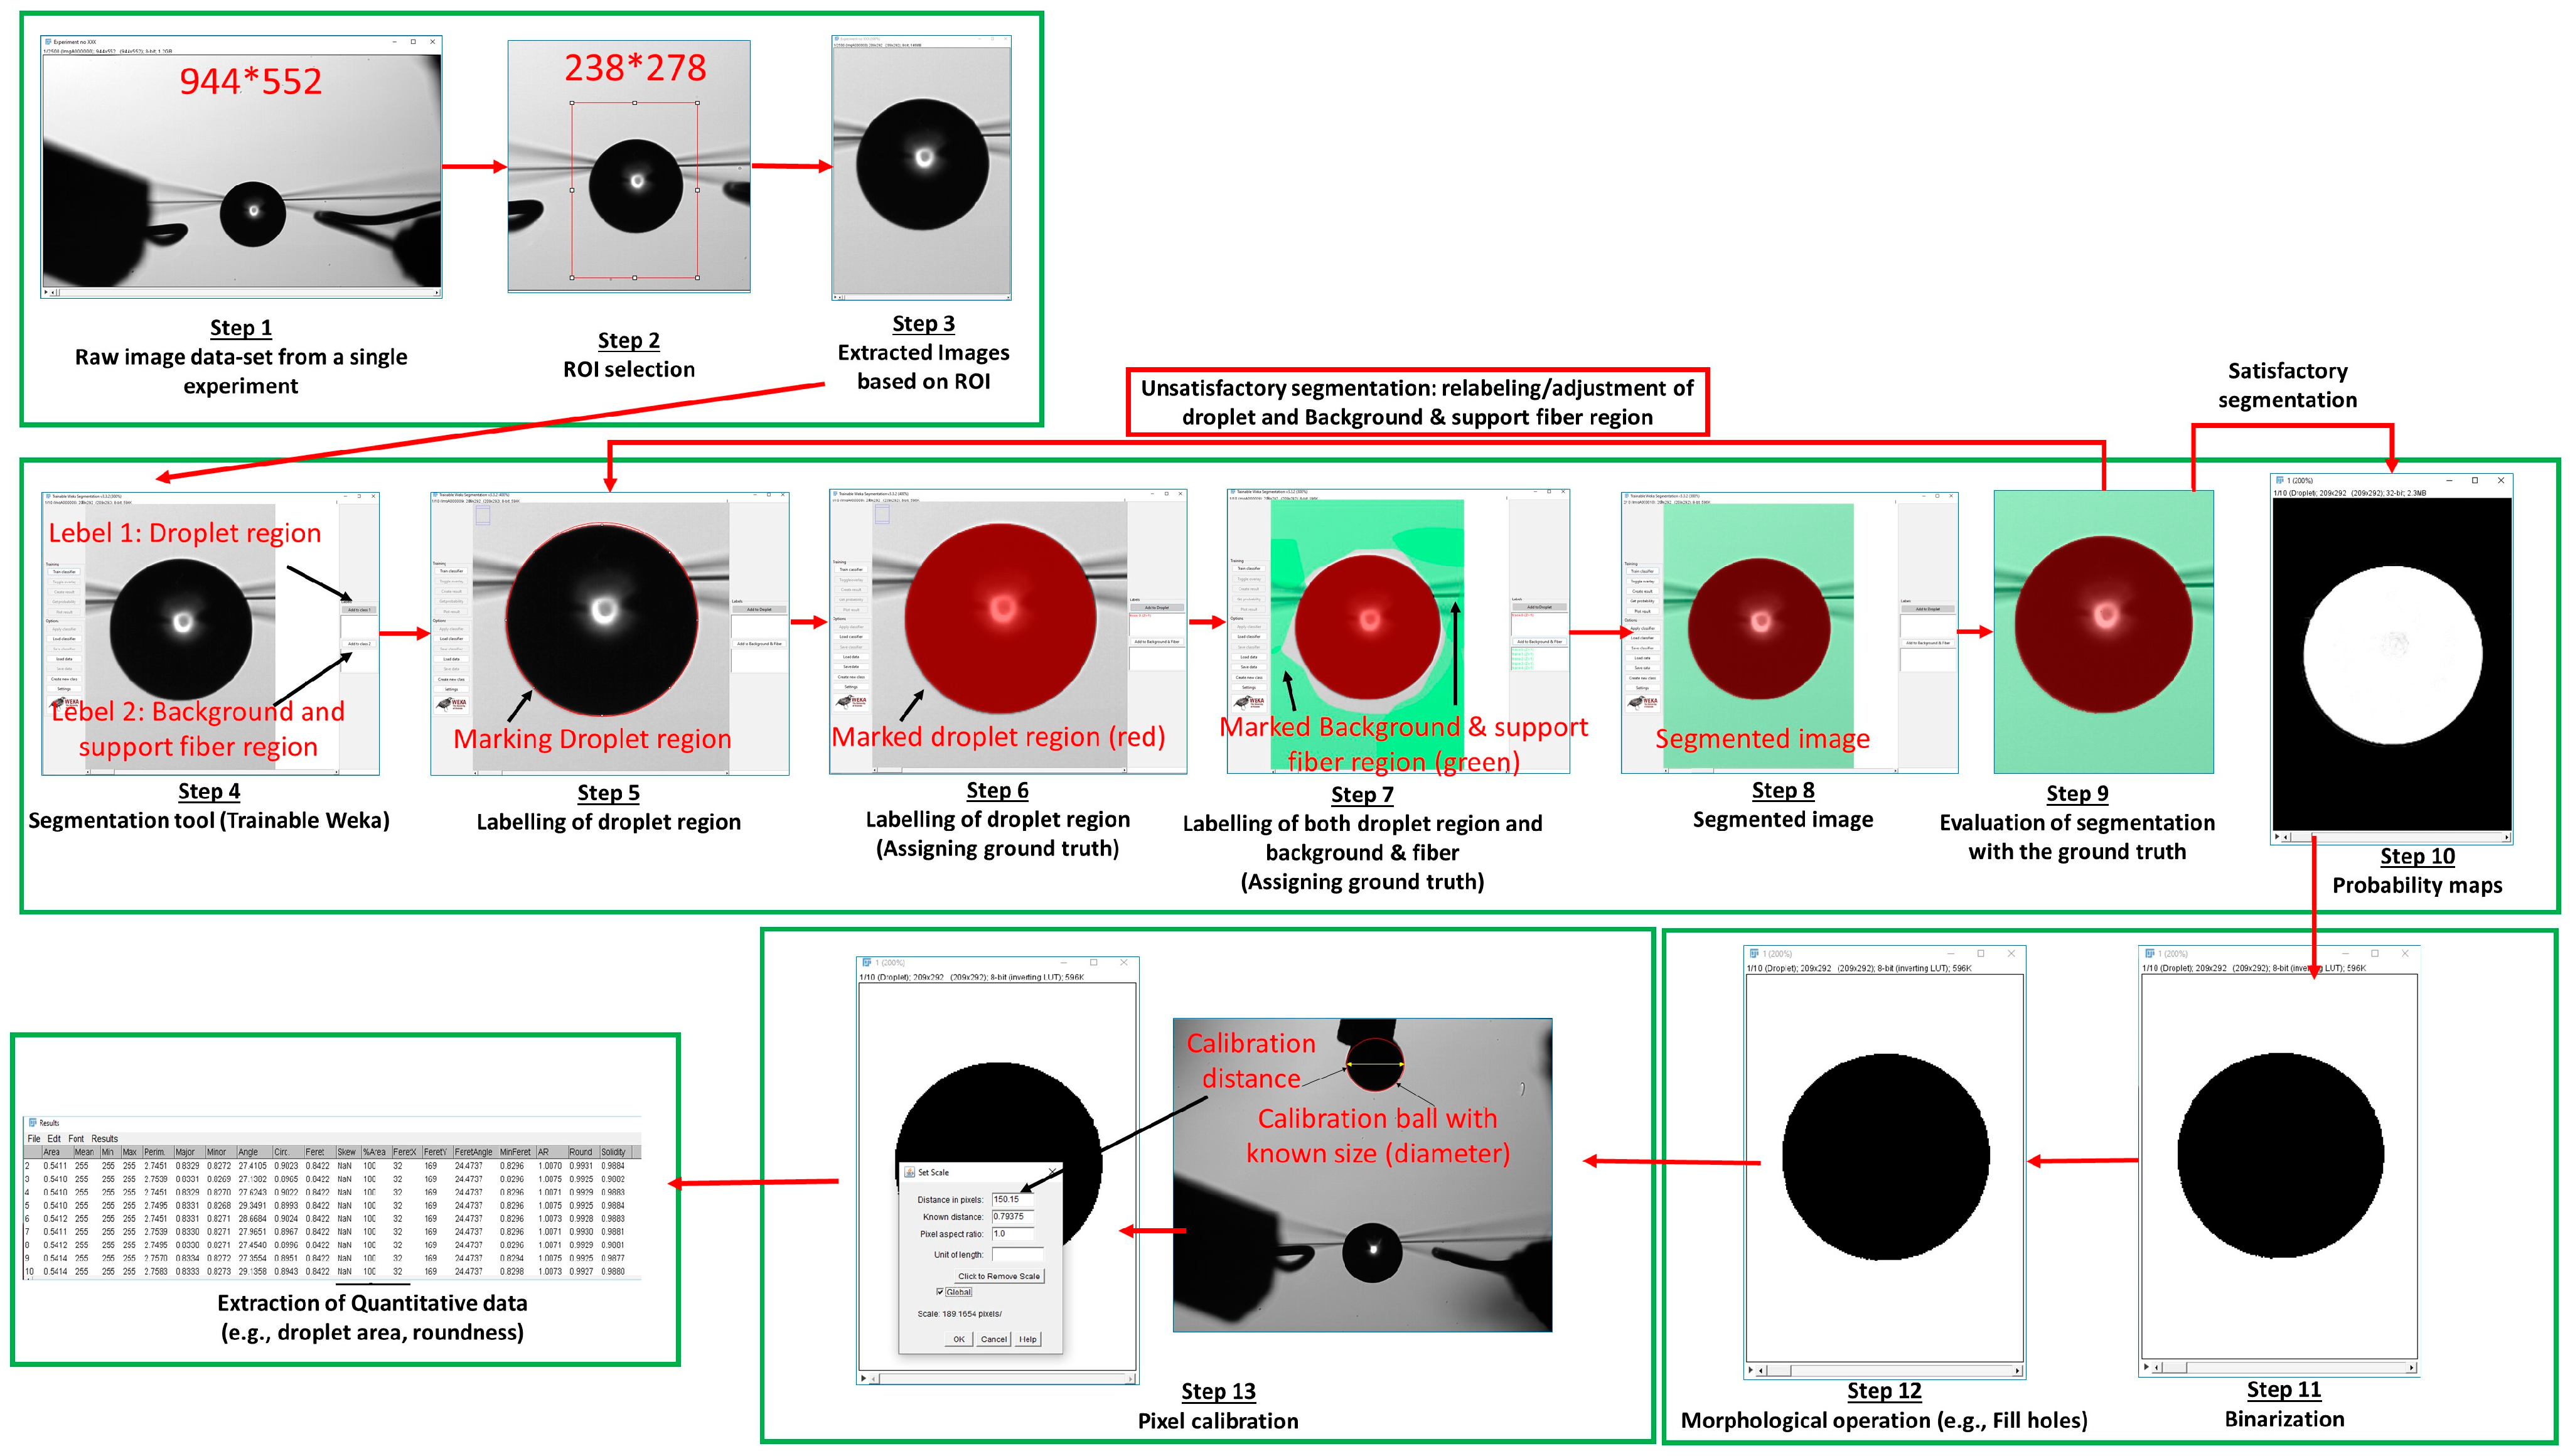
2.3. Image Post Processing

The image post-processing in this study was primarily performed using Fiji ImageJ software (Version 1.53t), with the Trainable Weka Segmentation plugin (version 3.3.1) for isolating and segmenting droplets from the background and support fibers [44]. Figure 2 shows a step-by-step overview of this process. Each experiment produced a raw dataset consisting of at least 2000 images, each with a resolution of 948 × 552 pixels. A region of interest (ROI) of 238 × 278 pixels was defined within each image to focus the analysis on the droplet and other key features. The Fast Random Forest algorithm, a supervised machine learning technique, was used for image segmentation to accurately separate the droplets, background, and fibers [44]. To guide this segmentation, specific areas of the images were manually labeled to identify the droplet, background, and fiber regions. These labeled images acted as ground truth data, helping the segmentation model learn and correctly identify the droplet regions. The results of the segmentation were checked visually, and probability maps were generated to show the confidence levels of the segmentation. The images were binarized, converting them into black and white, to simplify further analysis. Morphological operations, such as filling holes, were applied to improve the segmentation and ensure continuous and closed shapes. Calibration was carried out using a reference standard (Aluminum 2017 Alloy calibration ball, diameter 1/32”) to ensure accurate scaling of measurements to real-world units. Important metrics, including droplet area and roundness, were extracted from the segmented images for a comprehensive analysis of droplet behavior during combustion. The color images from the CMOS camera underwent minimal processing, mainly cropping for analysis. These images provided insights into flame dynamics, tracking ignition and flame extinction over time. The droplet size was measured using the equivalent projected area of a circle, which is given by the following equation:
d e q = 2 A π
where d e q is the equivalent diameter (the diameter of the circle with the same projected area as the droplet) and A is the projected area of the droplet (in pixels or real-world units, depending on calibration).

2.4. Uncertainty Analysis

Accurate measurement of droplet size is the primary source of uncertainty in this study. A calibration sphere of known dimensions was used to scale the measurements appropriately, converting image-based dimensions into real-world units. For each test, a droplet containing approximately 0.40 μL of fuel was suspended at the intersection of support fibers, corresponding to a theoretical equivalent droplet diameter of 0.90 mm. The experimentally measured initial equivalent droplet diameter across all tested fuels was 0.870 ± 0.034 mm, which closely aligns with the theoretical value. The observed variation primarily arose from wetting effects on the syringe needle, causing residual fuel to remain on its surface. Despite this, the coefficient of variation in the initial equivalent droplet diameter remained below 4%, which is considered acceptable, as variations in initial droplet size can influence overall combustion behavior.
To ensure accurate measurement of the instantaneous equivalent droplet diameter throughout combustion, droplet images were processed using ImageJ (Version 1.53t) segmentation. To validate the segmentation accuracy, results were compared with manually measured diameters from a dataset of 500 randomly selected images captured at different combustion stages. The uncertainty in the segmentation process was estimated to be below 5% when the normalized squared droplet diameter (d/d0)2 was greater than 0.10. However, for (d/d0)2 values below 0.10, uncertainty can increase significantly—up to 40%—due to challenges in accurately detecting droplet edges. The difficulty in precise edge identification arose from multiple factors, including image quality, blurring, and noise near the droplet boundary, particularly as the droplet regressed during burning. Additionally, complex droplet shapes, deformation effects, and step-like intensity variations at the droplet’s boundary contributed to segmentation errors. These issues were more pronounced in droplets undergoing puffing, where non-smooth boundaries made edge detection less reliable. To ensure accuracy in subsequent calculations, only data points with (d/d0)2 > 0.10 were considered for quantitative analysis, such as determining combustion rates and puffing characteristics. The temporal resolution of the CCD and CMOS cameras used in the experiments was 0.001 s and 0.0016 s, respectively. These resolutions resulted in a maximum temporal uncertainty of less than 1.00% for key combustion time measurements, including pre-ignition time and burning time. Given the high frame rate of these cameras, this uncertainty is negligible in the context of droplet combustion analysis.
To ensure reliable and consistent results, each fuel type was tested in at least five repeated experiments. The uncertainty across these repeated tests was quantified using the standard deviation of the mean, and error bars were included in the reported results accordingly. Additionally, the coefficient of variation (ratio of standard deviation to the mean) was computed for all key combustion parameters, including combustion rate, pre-ignition time, burning time, puffing occurrences, puffing intensity, puffing effectiveness. These values are provided in Table 2 as additional indicators of measurement uncertainty. Note that for puffing characteristics, the coefficient of variation can be higher across experiments due to the inherently unpredictable nature of the puffing phenomenon. Further details on the methodology for determining combustion stages, combustion rates, and pre-ignition times are provided in the Supplementary Materials (Section S1: Data Quantification).

3. Results and Discussion

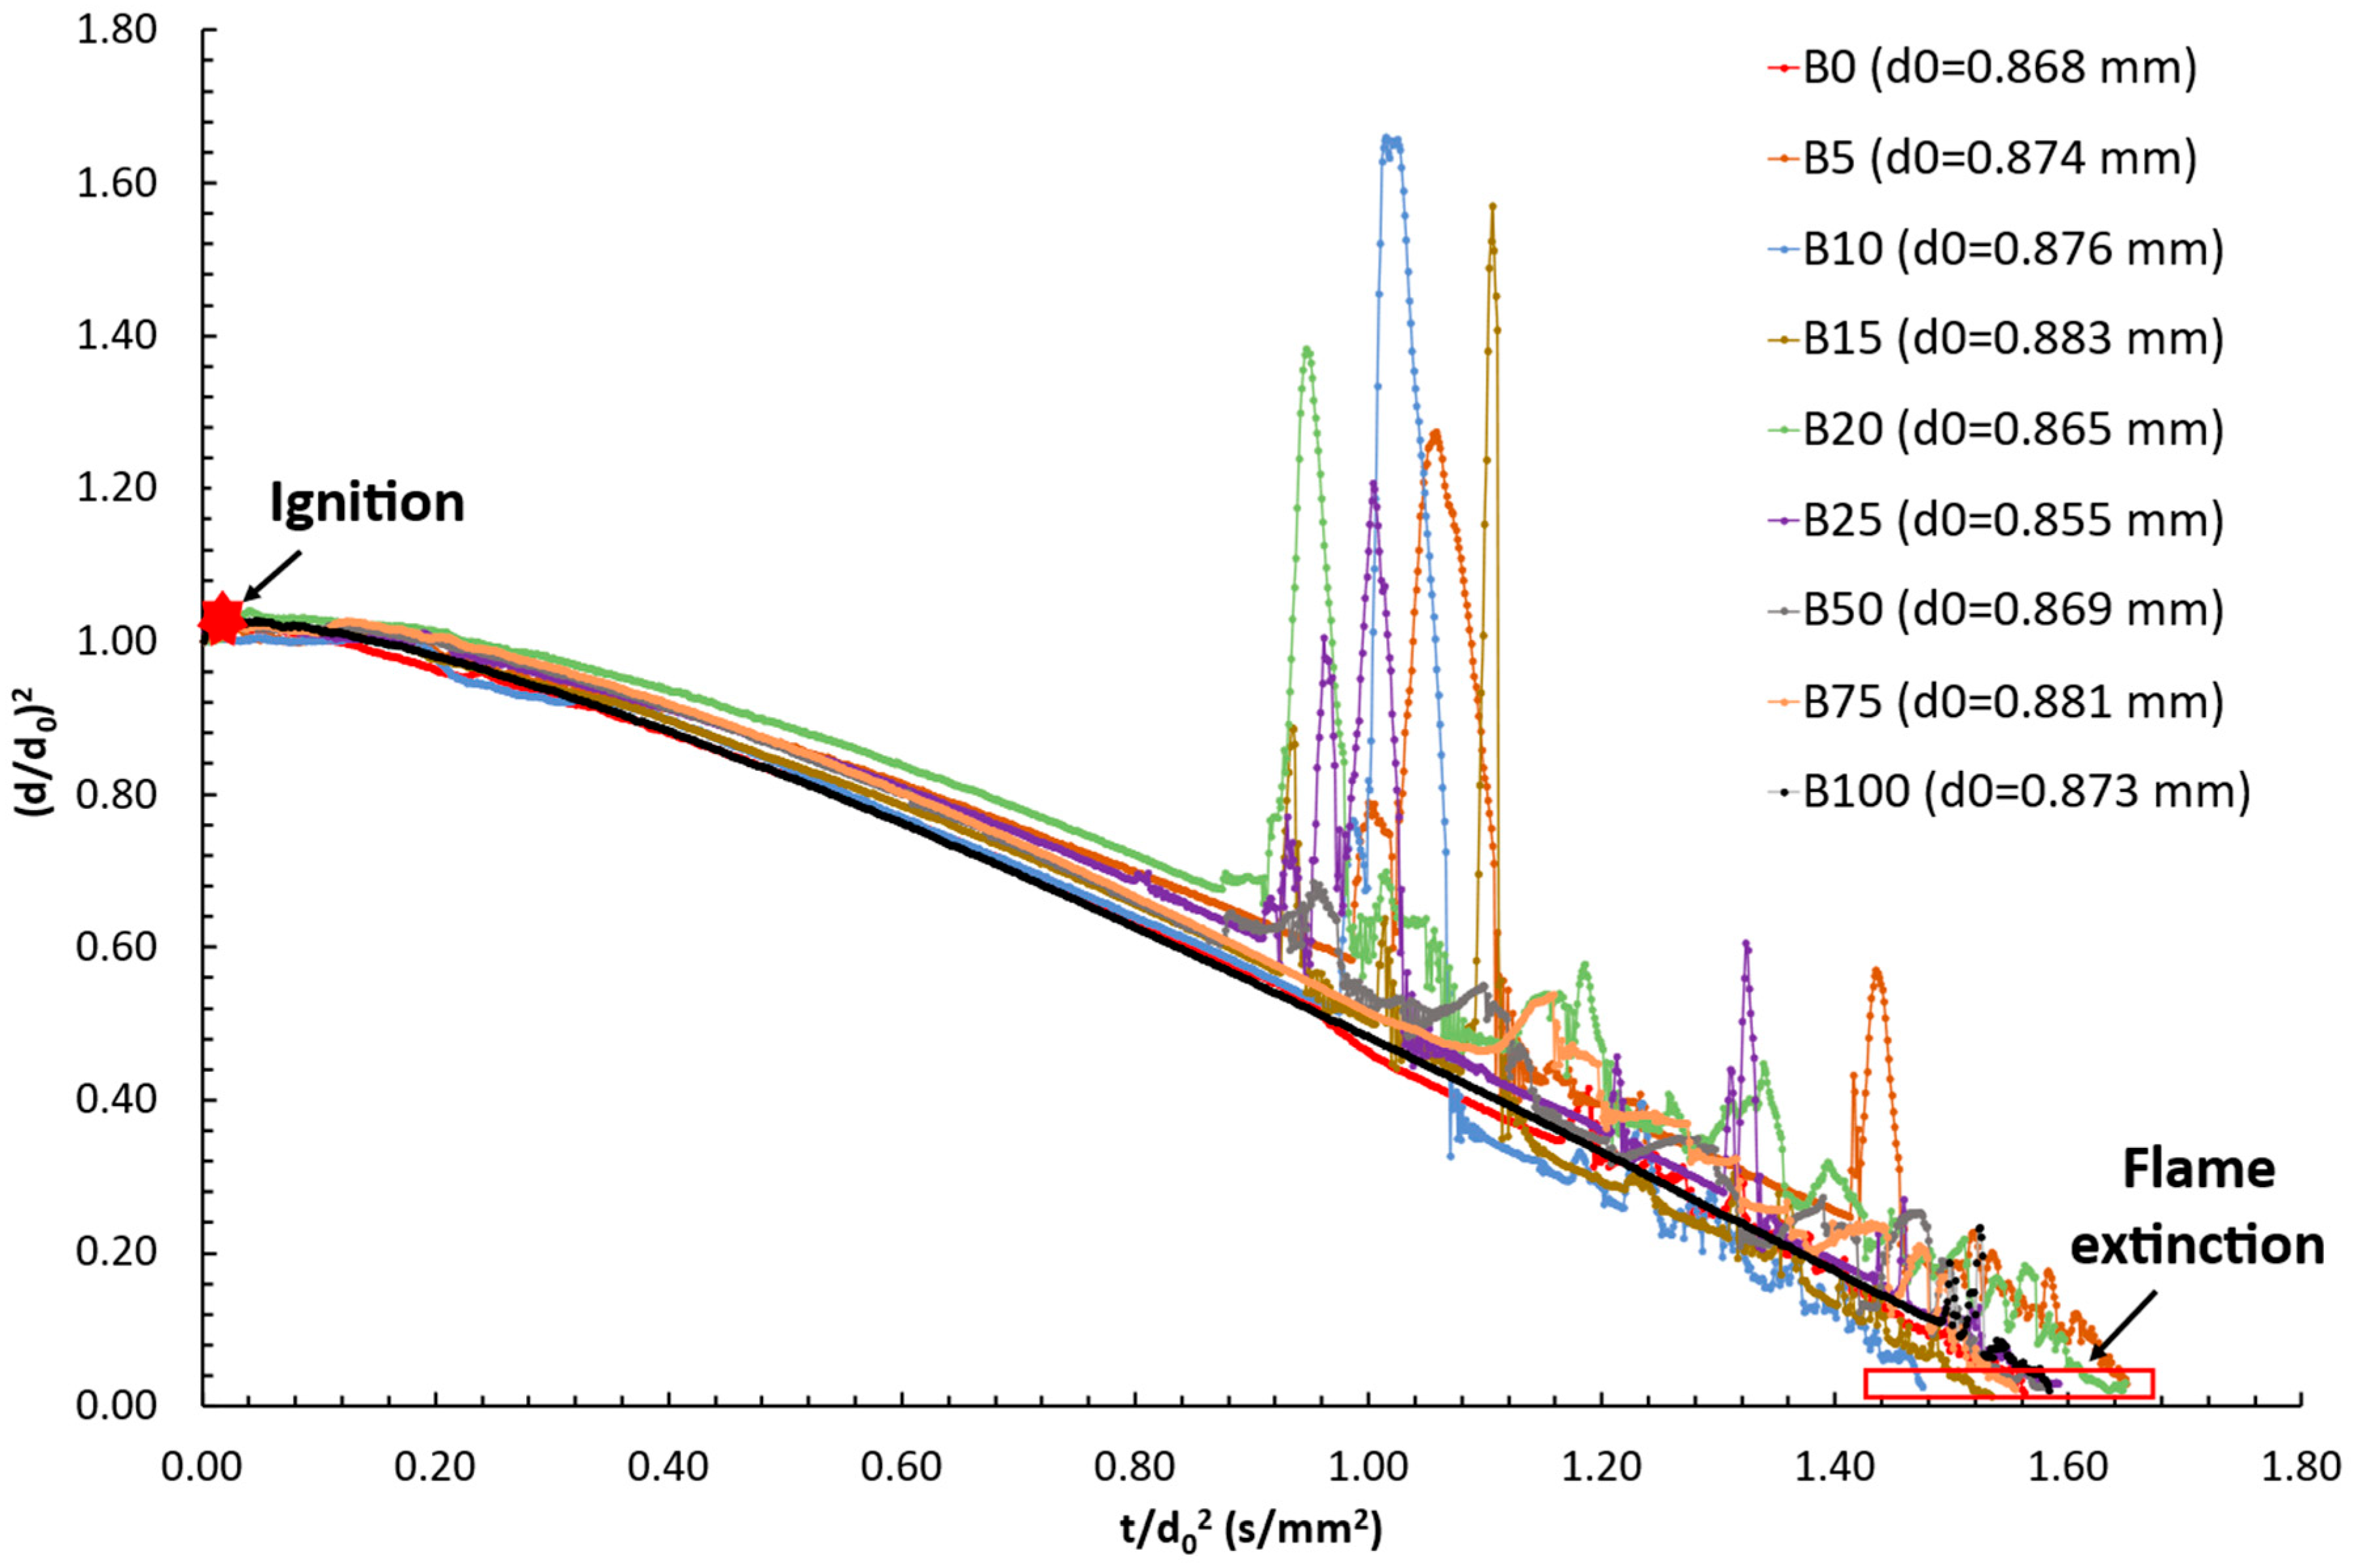
3.1. Burning Droplet Evolution over Time

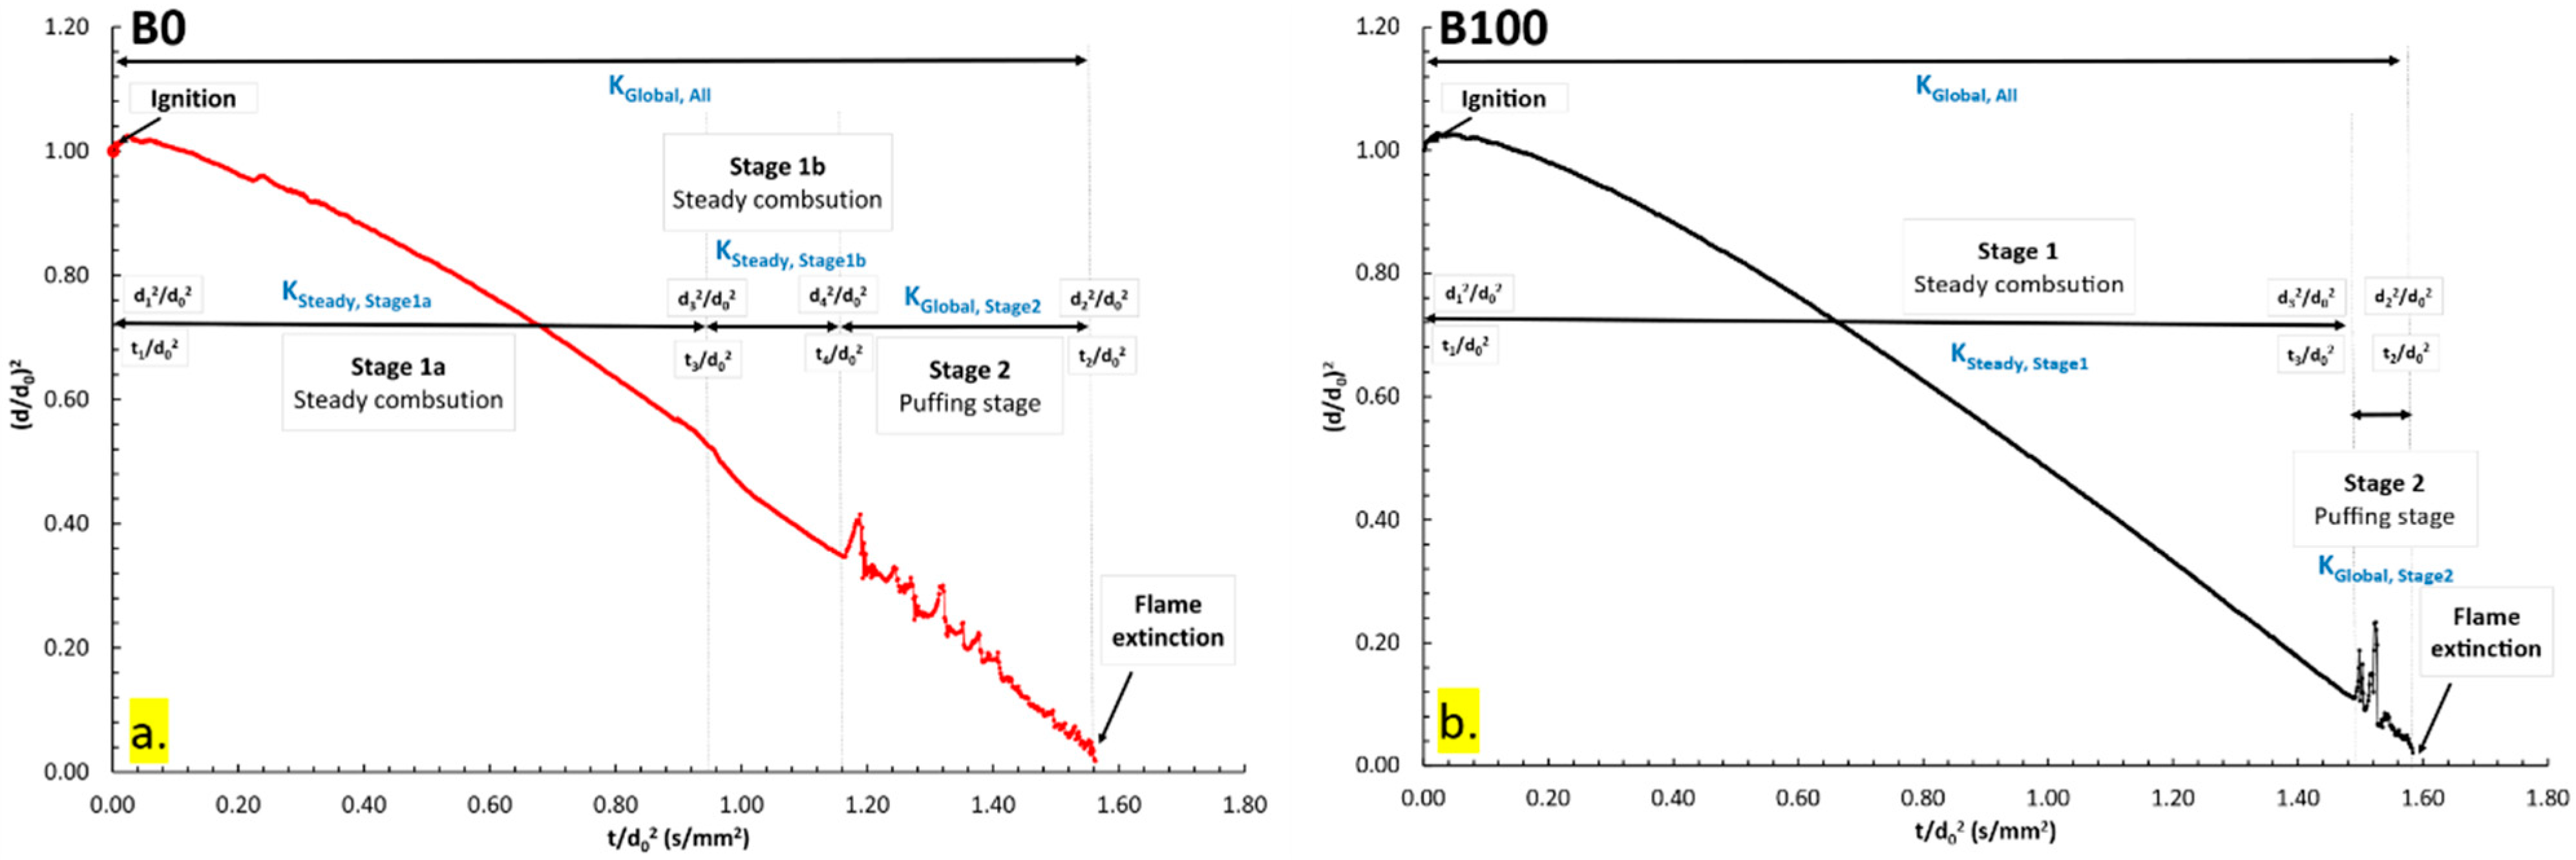
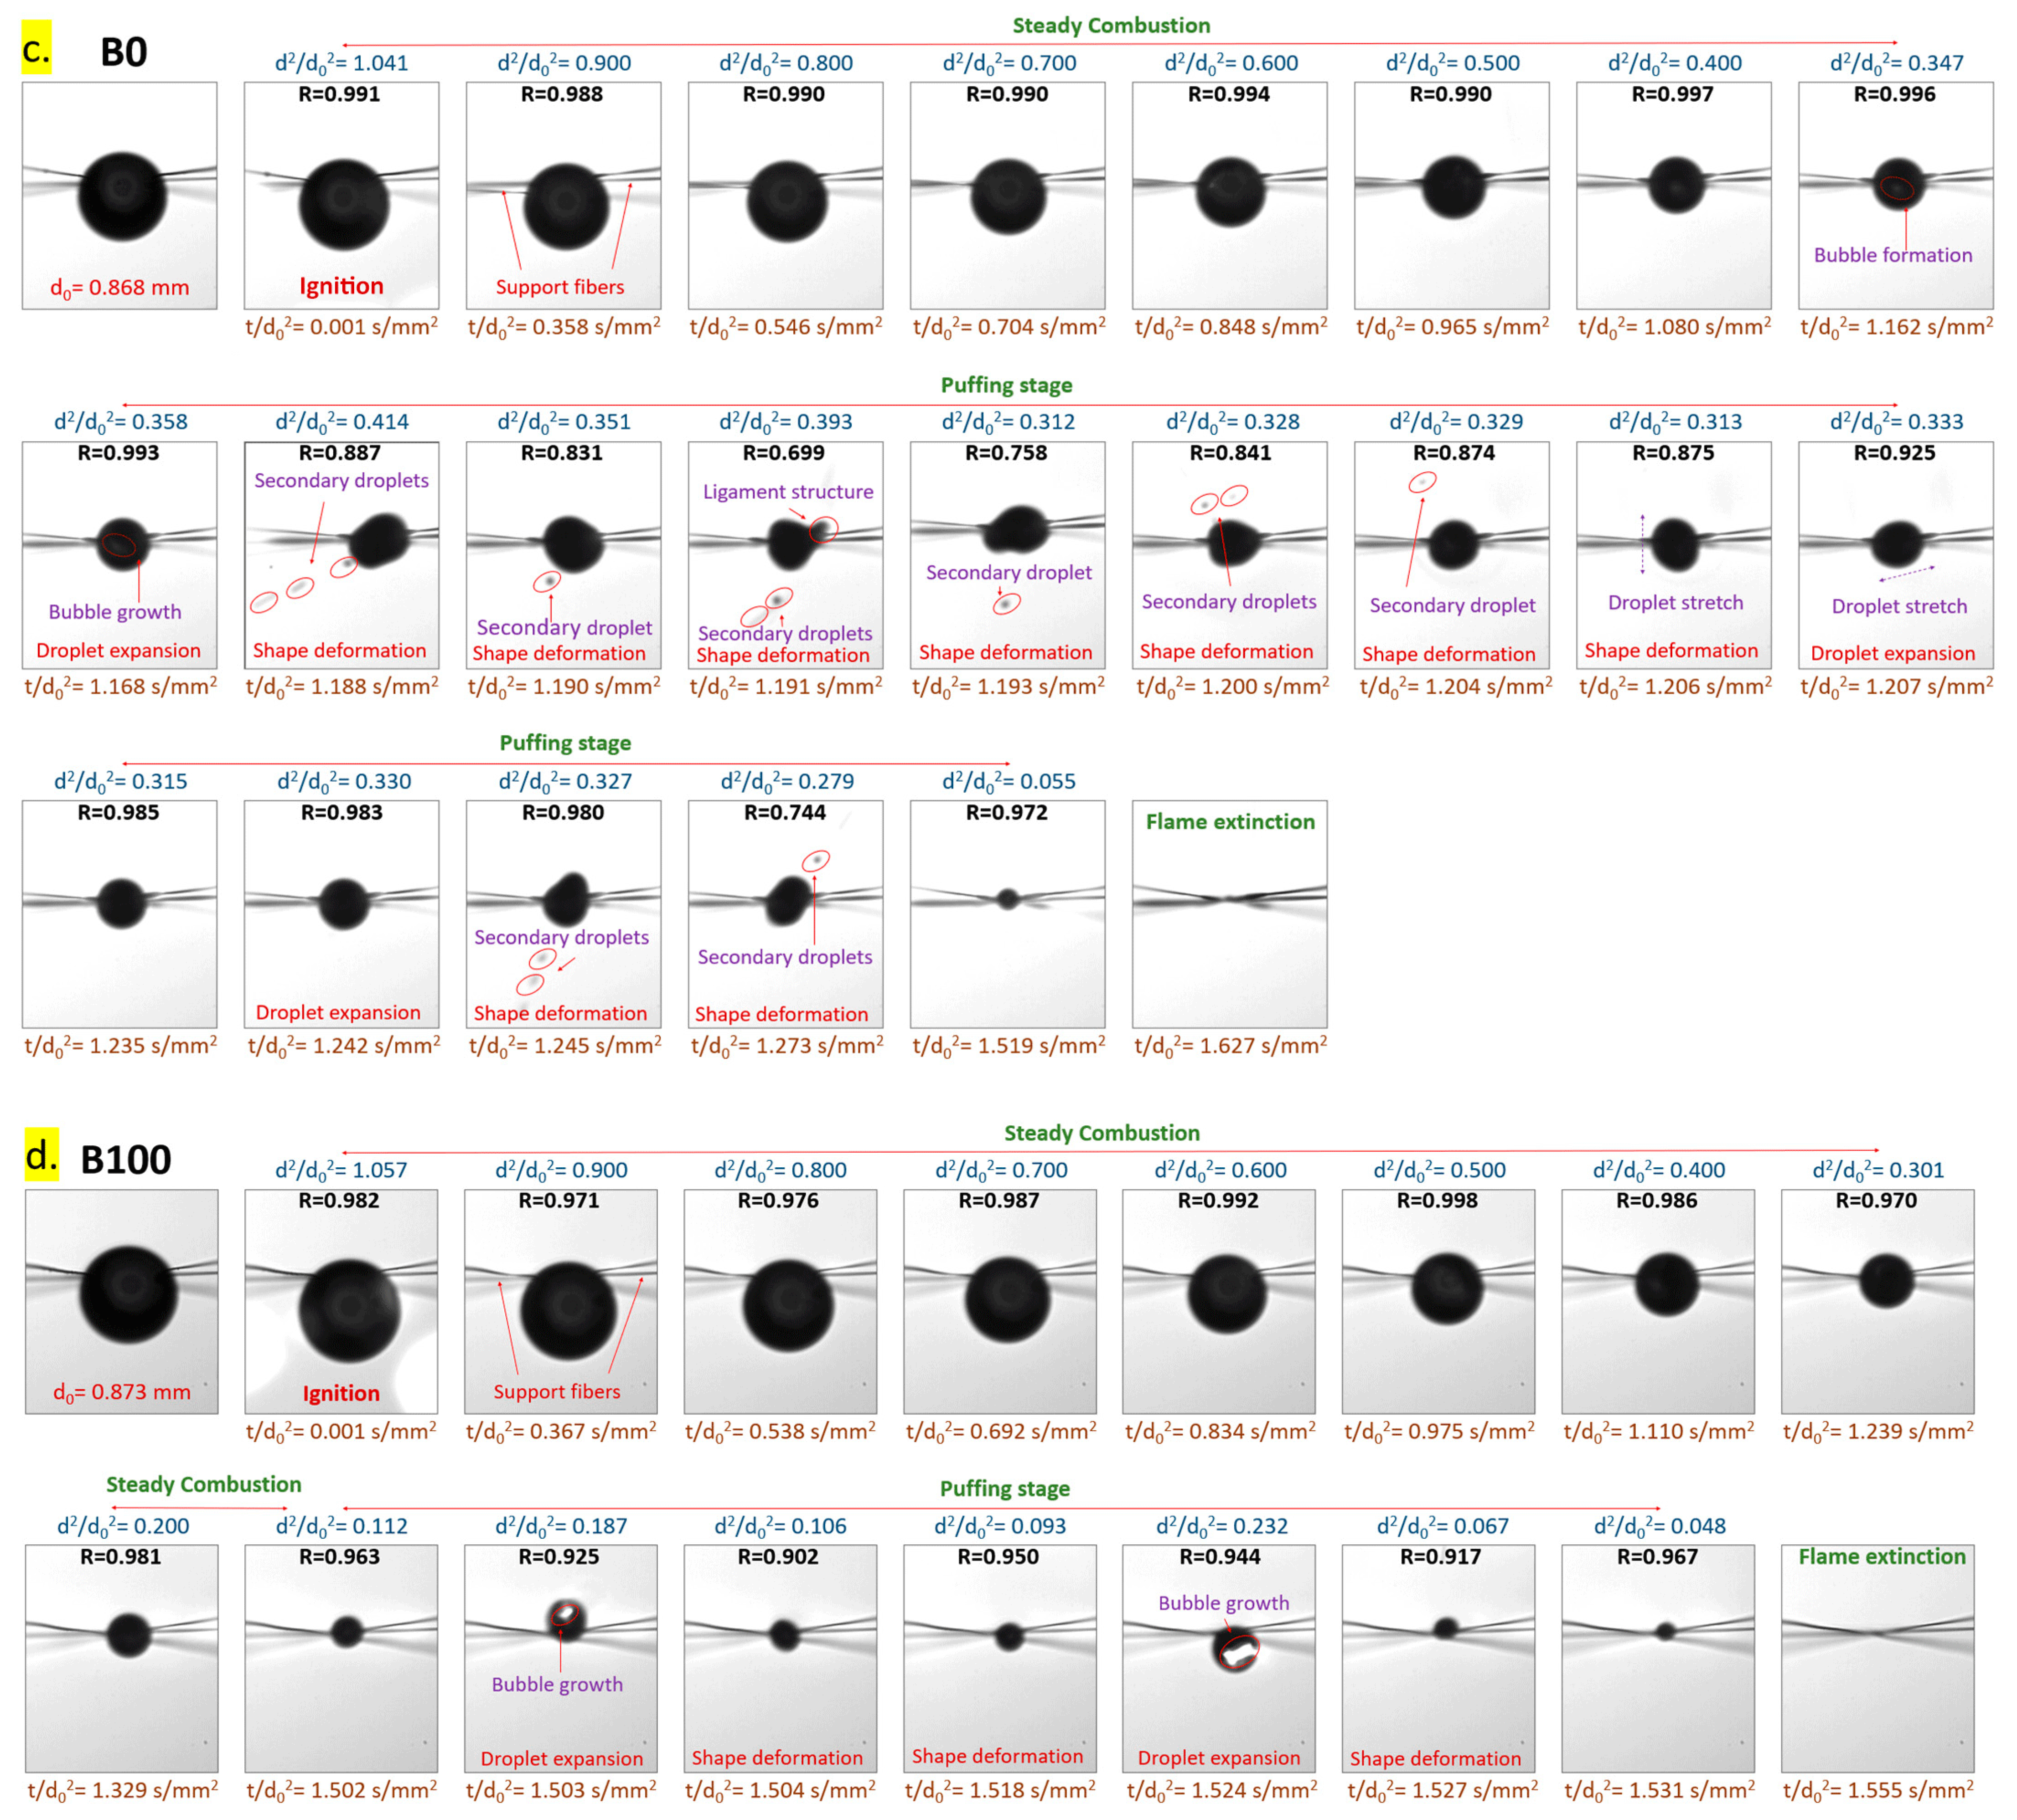
3.1.1. Combustion Characteristics of B0 and B100

The combustion behavior of pure fuels (B0 and B100) shows notable differences in droplet evolution. Figure 3 presents the d 2 -plots comparing the droplet evolution trends for all tested fuels with comparable initial droplet sizes. The droplet evolution is plotted from the moment of ignition ( t / d 0 2 = 0.000 s/mm2). Prior to ignition, each droplet undergoes a volumetric expansion stage (not shown in Figure 3) during the heat-up period, where thermal energy from the heating source raises the droplet temperature close to the boiling point, leading to fuel vapor formation. When this vapor mixes with ambient air under stoichiometric conditions, ignition occurs, and an envelope flame establishes itself as the primary heat source, providing energy (mainly through conduction and radiation) to sustain further fuel vaporization and combustion. Following ignition, all fuel droplets regress smoothly over time, adhering to the d 2 -law for a certain period before experiencing fluctuations in normalized droplet diameter (d/d0)2 due to puffing. During the steady combustion stage, the droplet size regression remains relatively uniform. However, as combustion progresses, volatility differences between surface and core components lead to superheating of the more volatile components near the core. These superheating initiates localized heterogeneous nucleation, forming vapor bubbles inside the droplet. These bubbles grow, coalesce, and eventually rupture the liquid sheet, resulting in the sudden ejection of unburned fuel vapor and the formation of secondary droplets. This puffing process repeats cyclically until combustion ceases with flame extinction. The timing and extent of vapor bubble formation and droplet expansion depend on the biodiesel content in the blended fuel. Even neat fuels exhibit puffing tendencies due to the volatility differences between constituent components.
Figure 4a illustrates the temporal evolution of a B0 droplet, marking different combustion stages. Detailed definitions of these stages are provided in the Supplementary Materials under Section S1: Data Quantification. In general, B0 droplet combustion includes both a steady and a puffing stage. However, two distinct steady droplet regression trends are observed, with a sharp bump appearing around t / d 0 2 = 0.900 s/mm2 due to compositional variations in B0 fuel. As B0 fuel contains a wide variety of chemical species with different physicochemical properties, the fuel vaporization trend changes accordingly. The onset of puffing occurs around t / d 0 2 = 1.200 s/mm2, marked by fluctuations in (d/d0)2. In contrast, B100 droplets exhibit a smoother regression during the steady stage without significant fluctuations (Figure 4b). Despite being a multicomponent fuel, B100 consists of a narrower distribution of constituent components with similar physicochemical properties, leading to uniform surface vaporization. Puffing in B100 droplets appears later ( t / d 0 2 = 1.500 s/mm2) than B0 droplets, with a significantly shorter puffing stage and fewer individual puffing events.
Figure 4c,d represent the temporal changes in droplet morphology for a B0 droplet (initial diameter, d0 = 0.868 mm) and a B100 droplet (initial diameter, d0 = 0.873 mm), respectively. The plots track normalized time ( t / d 0 2 ), droplet roundness (R), instantaneous droplet diameter (d), and normalized droplet diameter ((d/d0)2). In the B0 droplet, after ignition, the droplet maintains its spherical shape until t / d 0 2 = 1.162 s/mm2, when bubbles form near the core. These bubbles continue to grow until they rupture at t / d 0 2 = 1.188 s/mm2, producing multiple secondary droplets and significant shape deformations. The process repeats in cycles until flame extinction occurs at t / d 0 2 = 1.627 s/mm2. Momentum-induced impacts from fuel vapor ejection cause oscillations, stretching the droplet in different directions (observed between t / d 0 2 = 1.200–1.207 s/mm2). For B100 droplets, combustion dynamics follow a similar pattern, but bubble formation and puffing begin much later ( t / d 0 2 = 1.502 s/mm2), with a milder puffing stage compared to B0.

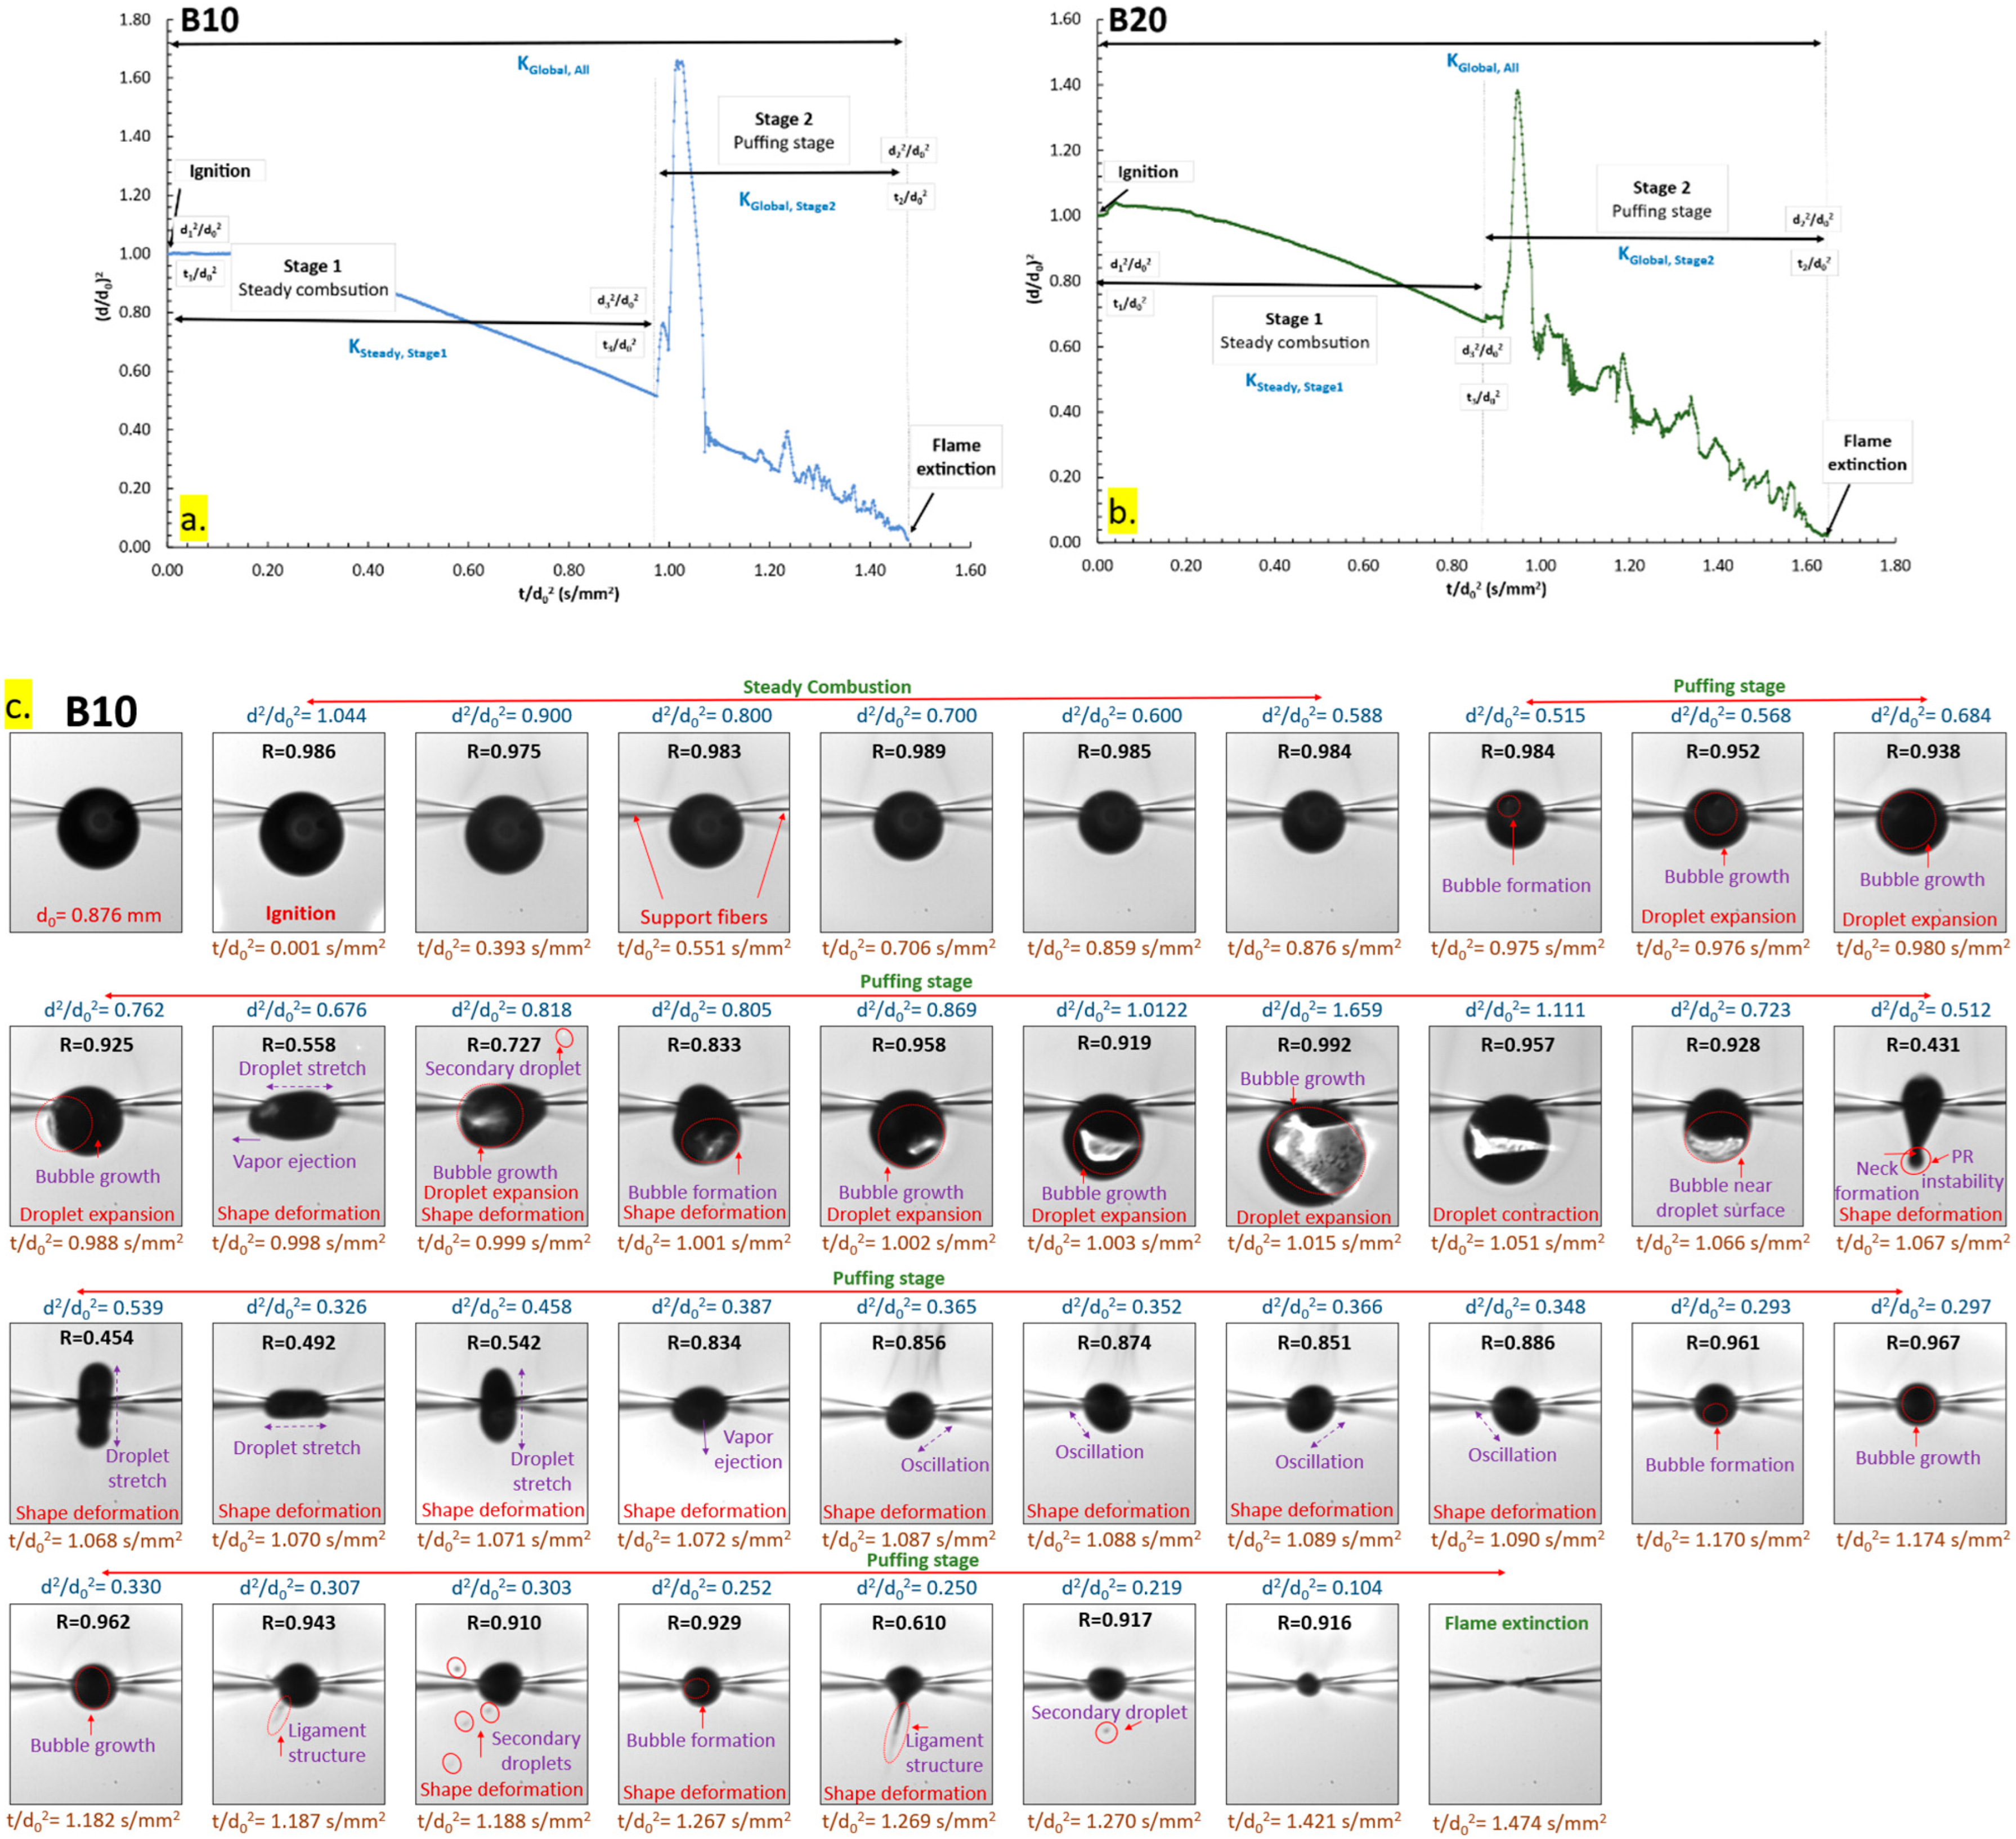
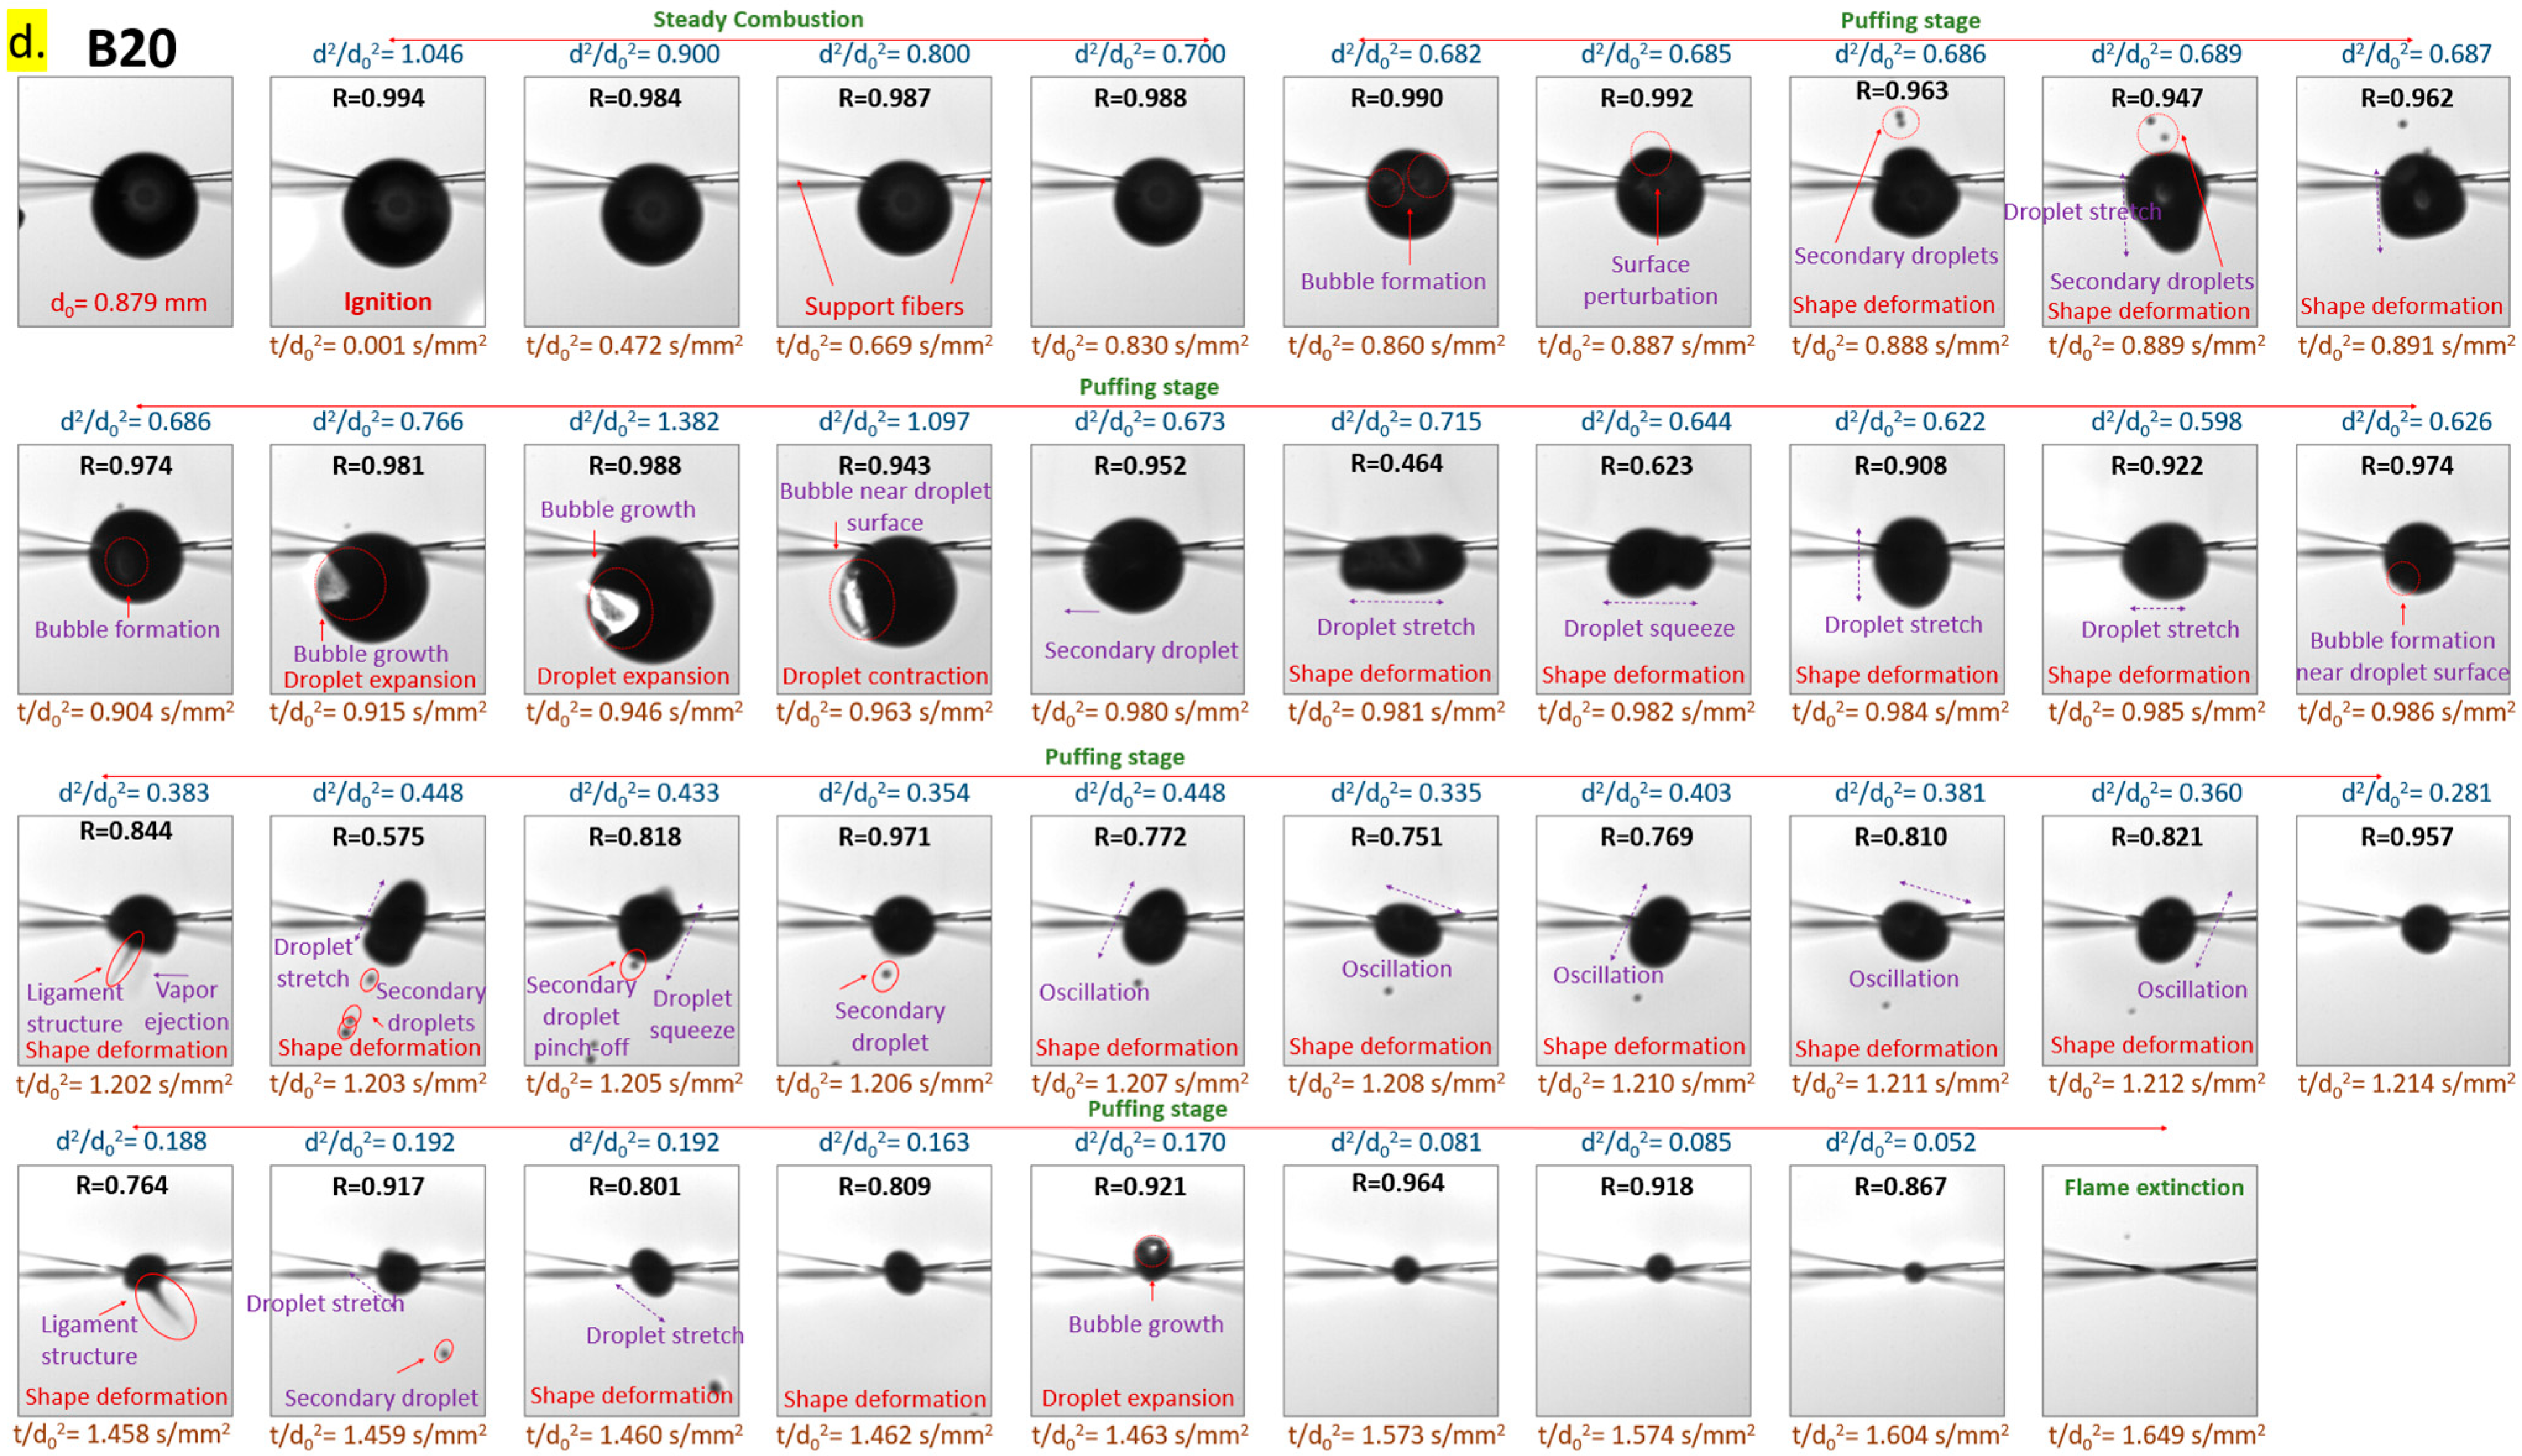
3.1.2. Combustion Characteristics of B5, B10, B15, and B20

The combustion behavior of blended fuels varies significantly with biodiesel concentration. This section discusses the droplet evolution trends for B10 and B20 as representative cases. Figure 5a,b illustrate the temporal evolution of B10 and B20 droplets, highlighting different combustion stages. Combustion in these droplets also follows two distinct stages; however, the characteristics of stage 2 differ significantly from those of B0 and B100 droplets.
For B10 and B20 droplets, the puffing stage appears much earlier than in B0 or B100, at approximately t / d 0 2 = 0.870 s/mm2 for B10 and t / d 0 2 = 0.860 s/mm2 for B20. Additionally, this stage is marked by significant droplet expansion, with maximum normalized droplet diameters reaching d 2 / d 0 2 = 1.619 for B10 and d 2 / d 0 2 = 1.361 for B20, compared to 0.391 for B0 and 0.221 for B100. A common trend observed during the puffing stage is an initial strong puffing event, followed by periodic weaker puffing events. The sequence of puffing stage appearance among the fuels follows the following order: B100 > B0 > B75 > B5 > B10 > B15 > B50 > B25 > B20.
Figure 5c,d illustrate the temporal changes in droplet morphology for B10 (d0 = 0.876 mm) and B20 (d0 = 0.879 mm) droplets during combustion. For the B10 droplet, after ignition, the droplet regresses smoothly while maintaining a spherical shape until t / d 0 2 = 0.975 s/mm2, at which point bubbles begin to form near the surface. These bubbles grow due to the accumulation of less volatile biodiesel components near the droplet surface, creating a liquid film. The bubbles migrate toward the surface at t / d 0 2 = 0.988 s/mm2, where the thinning liquid film ruptures, leading to the ejection of unburned fuel vapor and deformation of the droplet. Immediately after vapor ejection, another bubble forms, continuing the puffing cycle, and the droplet reaches a maximum normalized size of d 2 / d 0 2   = 1.659 at t / d 0 2 = 1.015 s/mm2. After reaching this peak, the droplet steadily contracts until t / d 0 2 = 1.067 s/mm2, at which point a bubble rupture inside the droplet without sudden vapor ejection. This event deforms the liquid film around the bubble, creating an extending ligament structure. The ligament undergoes Plateau–Rayleigh (PR) instability, leading to the formation of a secondary droplet [45,46]. The internal bubble burst generates a recoil force, stretching and deforming the droplet. The droplet oscillates with the support fiber acting as an anchor, and during this oscillation, another bubble rupture occurs, ejecting unburned fuel vapor. This cyclic process of bubble formation, ligament structure formation, and secondary droplet ejection through PR instability continues until flame extinction at t / d 0 2 = 1.474 s/mm2. For the B20 droplet, combustion follows a similar pattern. The droplet regresses smoothly while maintaining a spherical shape until t / d 0 2 = 0.860 s/mm2, when multiple bubbles form near the droplet surface. These bubbles coalesce and migrate to the surface, producing secondary droplets through Plateau–Rayleigh (PR) instability at t / d 0 2 = 0.888 s/mm2. The recoil force from the internal bubble bursts stretches and deforms the droplet. Around t / d 0 2 = 0.904 s/mm2, another bubble forms near the droplet core, growing and significantly expanding the droplet to a maximum normalized size of d 2 / d 0 2 = 1.382. Following this expansion, the droplet steadily contracts until t / d 0 2 = 0.963 s/mm2 as the liquid film around the bubble becomes permeable, allowing a gradual release of unburned fuel vapor. However, at t / d 0 2 = 0.980 s/mm2, another internal bubble rupture occurs, forming a ligament structure that undergoes PR instability, leading to secondary droplet formation. The recoil force from the burst further deforms and stretches the droplet. During oscillation, a new bubble appears near the droplet surface at t / d 0 2 = 0.986 s/mm2, eventually forming another ligament structure and ejecting secondary droplets. This cycle repeats multiple times until flame extinction at t / d 0 2 = 1.649 s/mm2.
The primary distinction between B10 and B20 droplets lies in their bubble rupture mechanisms. B10 droplets experience both sudden ejection of unburned fuel vapor due to the abrupt rupture of the liquid film and secondary droplet formation via ligament stretching and PR instability. In contrast, B20 droplets predominantly exhibit the latter mechanism.

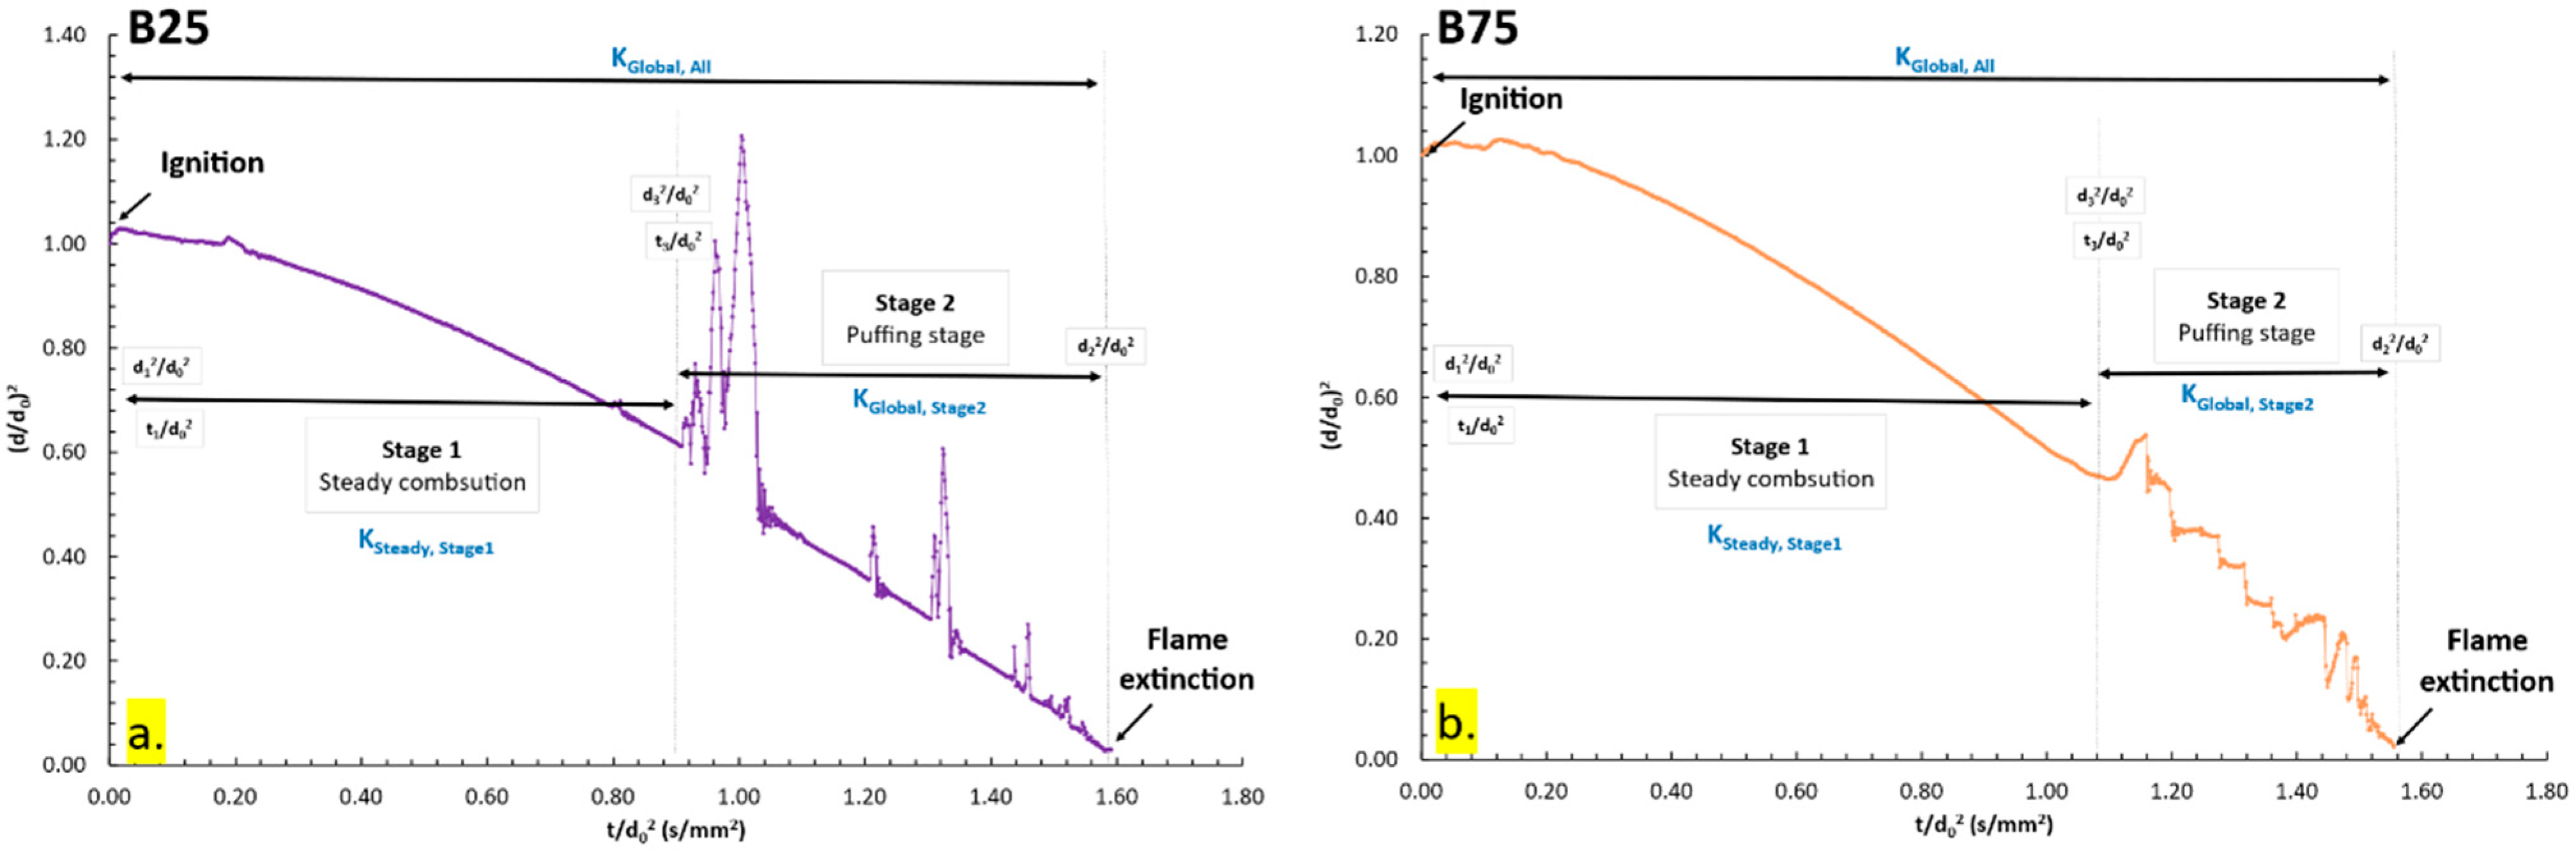
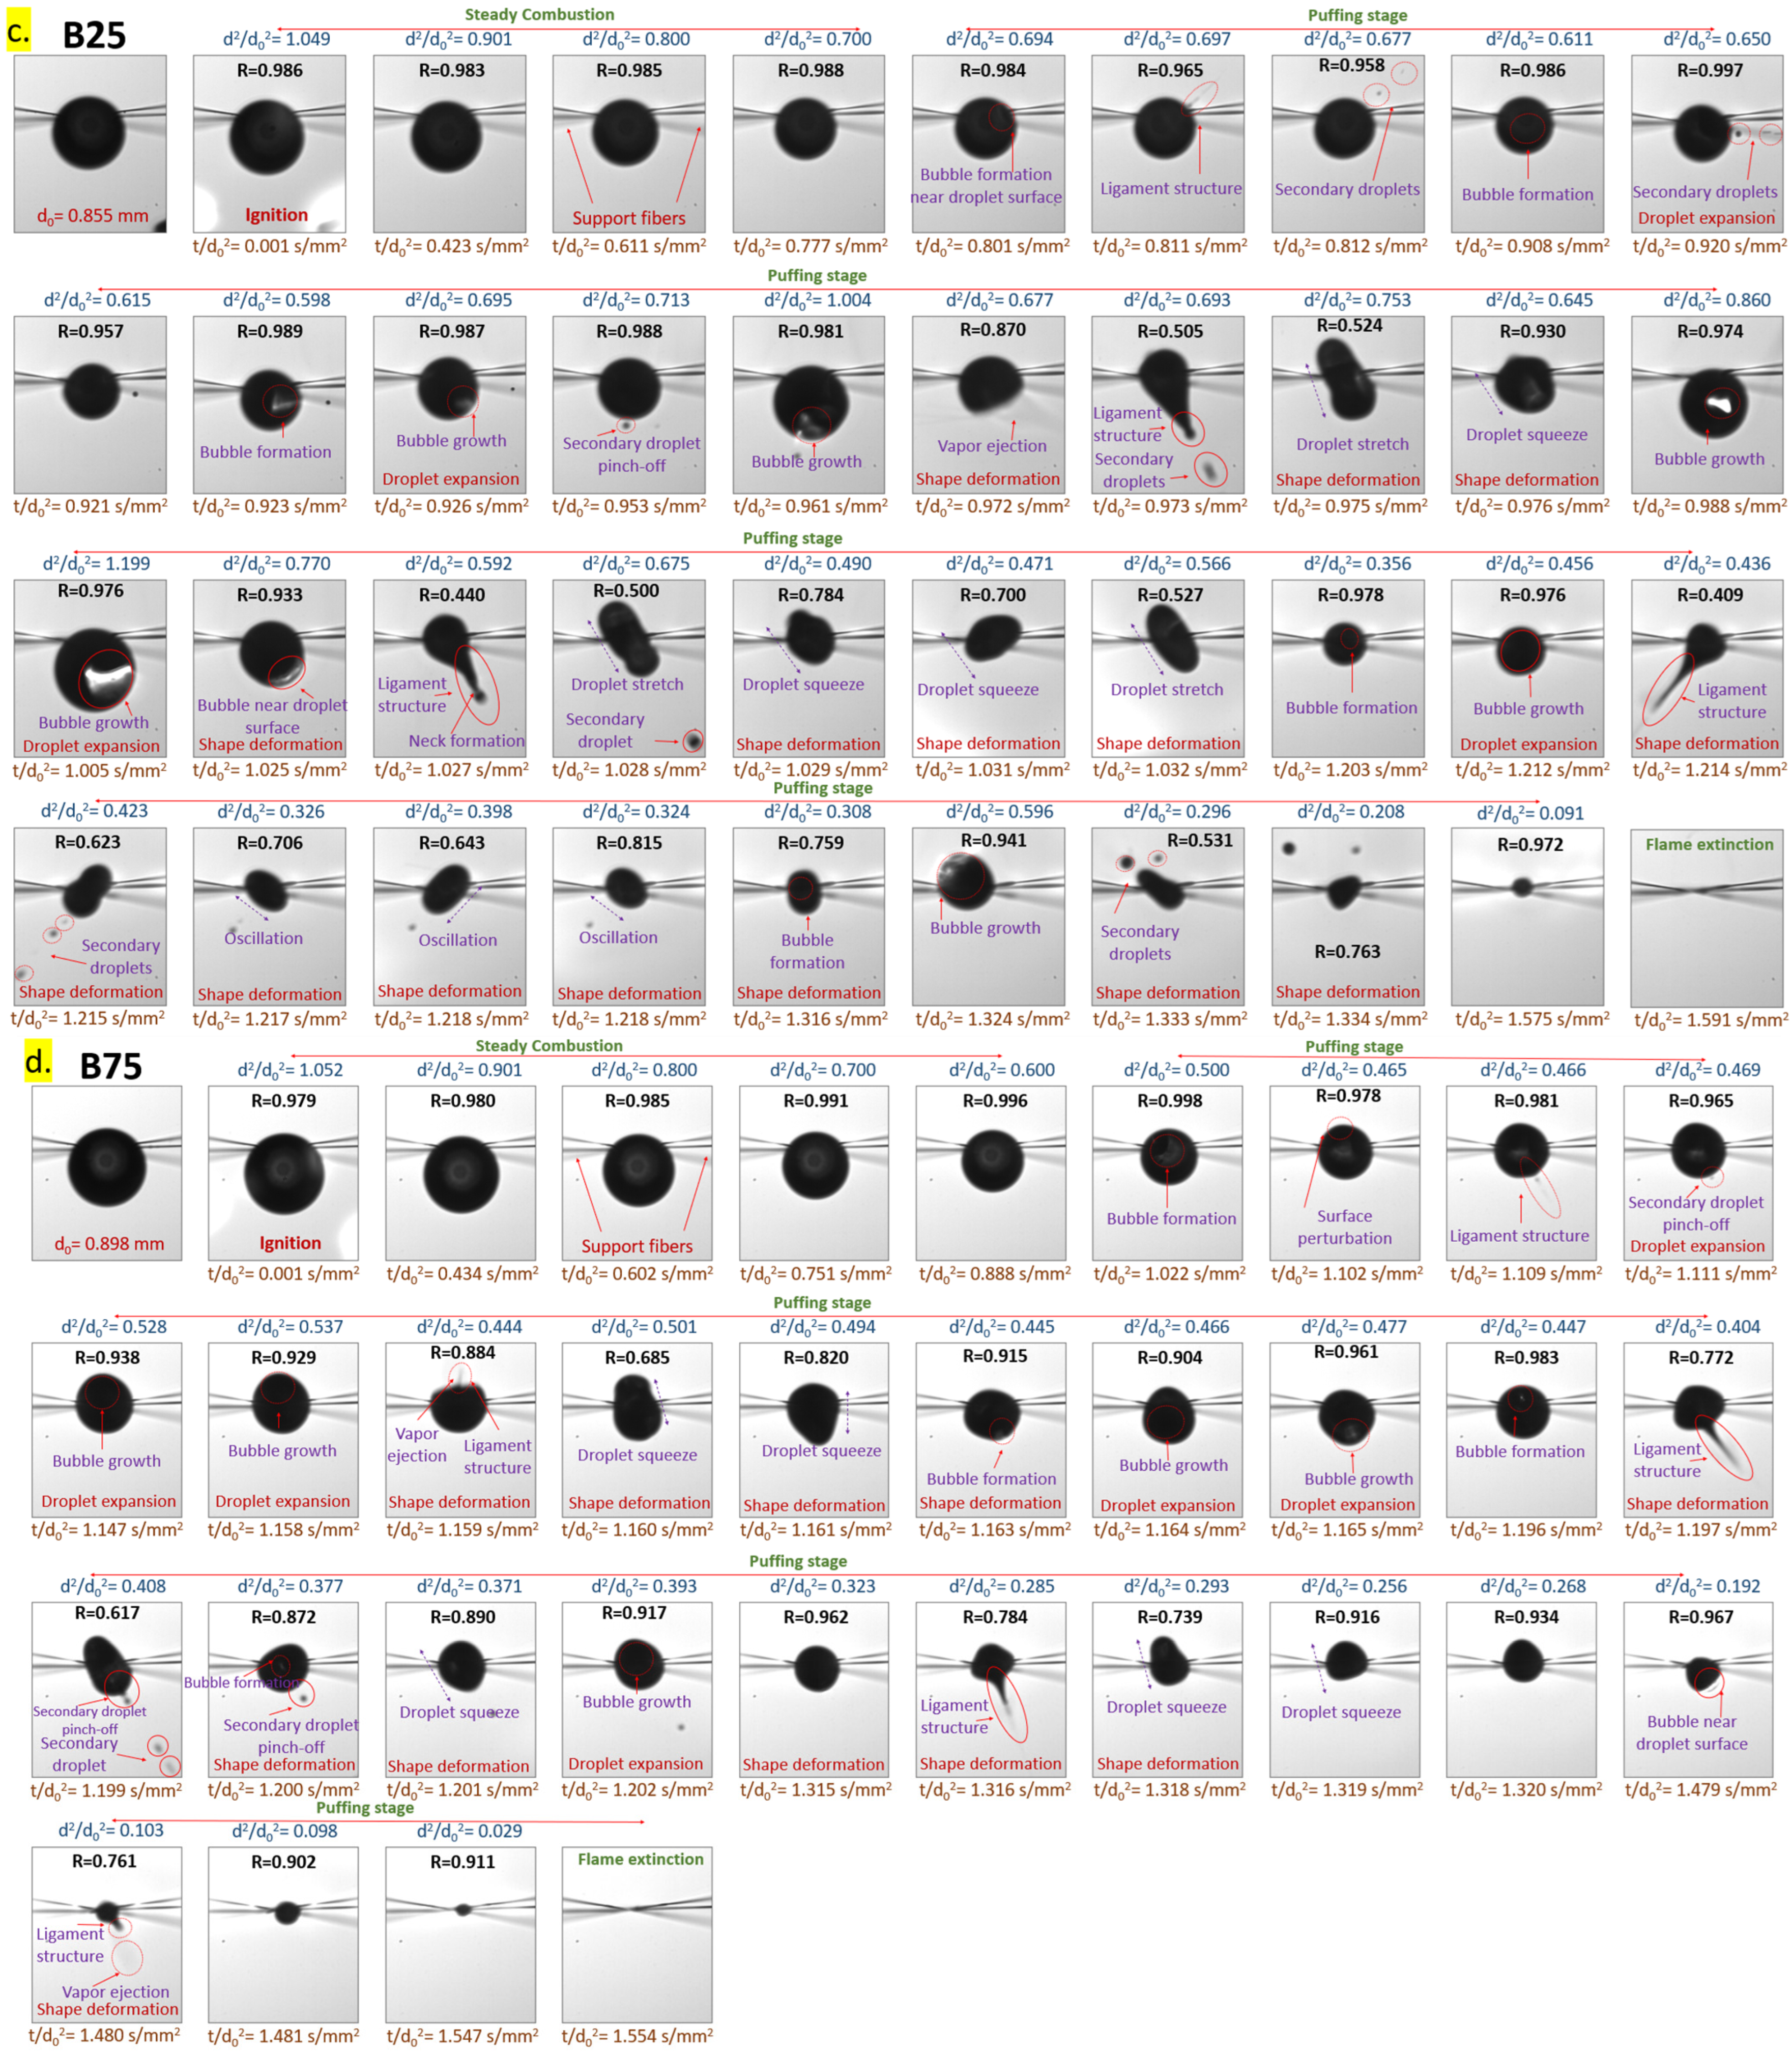
3.1.3. Combustion Characteristics of B25, B50, B75

The combustion behavior of blended fuels differs significantly at and beyond 25% v/v biodiesel concentration. Figure 6a,b illustrate the temporal evolution of B25 and B75 droplets. While B25, B50 and B75 droplets follow a two-stage combustion process similar to lower biodiesel blends, stage 2 characteristics for B50 and B75 deviate notably from other fuel compositions. The onset of the puffing stage occurs earlier for B25 at t / d 0 2 = 0.801 s/mm2, whereas for B75, it is delayed to t / d 0 2 = 1.100 s/mm2. Additionally, the maximum normalized droplet size for B25 reaches d 2 / d 0 2 = 1.199, while for B75, it is significantly smaller at d 2 / d 0 2 = 0.53. Unlike lower biodiesel blends (B5–B20), which exhibit a strong puffing event followed by periodic weak puffing, B50 and B75 experience only continuous weak puffing events.
Figure 6c,d show the temporal changes in the morphology of B25 (d0 = 0.855 mm) and B75 (d0 = 0.898 mm) droplets during combustion. The B25 droplet initially maintains a spherical shape until t / d 0 2 = 0.801 s/mm2, when a bubble forms near the droplet surface. In contrast to lower blends, this bubble rupture leads to the formation of a thin ligament structure, which results in the ejection of small secondary droplets. At t / d 0 2 = 0.908 s/mm2, another bubble forms near the droplet core, leading to the generation of larger secondary droplets through ligament stretching and break up. Subsequently, another bubble appears at t / d 0 2 = 0.926 s/mm2, growing steadily and expanding the droplet significantly, reaching d 2 / d 0 2 = 1.199 at t / d 0 2 = 0.971 s/mm2. This bubble eventually ruptures at t / d 0 2 = 0.972 s/mm2, triggering a sudden ejection of unburnt fuel vapor and a strong recoil force. The resulting deformation of the droplet leads to oscillations, further ligament formation, and continued secondary droplet ejection via PR instability. This process repeats until flame extinction at t / d 0 2 = 1.591 s/mm2. Key distinctions of the B25 droplet compared to lower blends include the formation of thinner ligaments and smaller secondary droplets during surface bubble rupture. However, ligaments formed from internal bubble ruptures appear thicker, leading to larger secondary droplets.
For the B75 droplet, initial combustion proceeds smoothly, maintaining a spherical shape until t / d 0 2 = 1.022 s/mm2, when a bubble forms near the droplet surface. Unlike lower blends, this bubble rupture does not result in significant ligament formation. However, a thick ligament structure emerges in the opposite direction, leading to secondary droplet formation through PR instability and secondary droplet pinching off from the primary droplet surface. This cycle continues until flame extinction at t / d 0 2 = 1.554 s/mm2. A notable characteristic of B75 combustion is the formation of significantly thicker ligaments as droplet size decreases. Unlike B5–B25 blends, which exhibit substantial droplet expansion due to strong puffing events, B50 and B75 lack such expansion. Instead, puffing occurs primarily through ligament formation. The reason for this behavior is attributed to the higher surface tension and viscosity of B100 compared to B0. As biodiesel concentration increases, the liquid film surrounding the bubble can withstand internal bubble rupture more effectively, leading to the development of thick ligaments rather than abrupt vapor ejection events.

3.2. Combustion Rate, Pre-Ignition Time and Burning Time

3.2.1. Combustion Rate Analysis

The results presented in Figure 7 highlight the combustion rate variations across pure fuels and biodiesel–diesel blends, demonstrating the complex interplay between fuel composition, oxygen content, and puffing behavior. The steady combustion rate (KSteady) follows a linear increase with biodiesel content (R2 > 0.90), while the global combustion rate (KGlobal,All) deviates from this trend due to puffing effects, which vary with blend ratio. These findings emphasize the dual influence of fuel-bound oxygen and secondary atomization mechanisms on combustion efficiency. The steady combustion rate (KSteady), which excludes puffing effects, exhibits a strong linear correlation with biodiesel concentration (R2 > 0.90), indicating that as biodiesel content increases, the steady combustion rate predictably rises. This is attributed to biodiesel’s oxygenated nature, which enhances oxidation efficiency and compensates for its lower heating value and higher boiling range compared to diesel. The B100 droplet exhibits a 9% higher KSteady than B0, confirming the positive effect of biodiesel-derived oxygen on combustion stability. This trend is further supported by flame structure observations in Figure 8, where increasing biodiesel concentration leads to a transition from yellow, elongated, sooty flames (B0) to shorter, bluish, and more enclosed flames (B100). The reduction in flame height and increased width in B50 and B75 droplets indicate more efficient combustion dynamics, aligning with the observed increase in KSteady.
Unlike KSteady, the global combustion rate (KGlobal,All) accounts for the entire droplet burning process, including puffing-induced secondary atomization effects. A key observation is that KGlobal,All initially increases with biodiesel content, peaks at B10, decreases at B25, and rises again at B50 and B75 before stabilizing near B100. This non-monotonic trend highlights the interplay between fuel composition and puffing behavior, where secondary droplet formation enhances combustion rate at specific blend concentrations. The B10 droplet exhibits the highest global combustion rate among blends, suggesting that puffing mechanisms are most effective at this concentration. This aligns with previous studies reporting that moderate biodiesel blends (B10–B25) experience the strongest puffing intensity due to fuel volatility differences between diesel and biodiesel components [28,30]. The reduction in KGlobal,All for B25 indicates a diminishing puffing effect, likely due to a more homogeneous blend composition, which reduces internal boiling instabilities. At higher biodiesel concentrations (B50 and B75), global combustion rates increase again, reaching 9% and 12% above B0, respectively. This suggests that puffing mechanisms at higher biodiesel fractions contribute to enhanced combustion efficiency, possibly due to localized boiling that promote secondary droplet formation. However, B100 exhibits a lower-than-expected increase, indicating that at pure biodiesel levels, puffing is less effective in driving combustion enhancements, likely due to its more uniform boiling behavior and higher boiling temperature range.
Figure 9 compares combustion rate trends in this study with existing literature, revealing notable variations based on feedstock type [25,27,29,30,31,32,47,48,49]. Commercial biodiesel (edible or non-edible oil derived) and soy oil biodiesel generally show higher combustion rates, whereas castor oil and tallow-based biodiesels exhibit lower combustion rates due to their higher viscosity and reduced volatility. The current study’s findings on WCO and animal fat-derived biodiesel align with previous research, demonstrating a moderate increase in combustion rate compared to B0 but one which is lower than biodiesel blends containing a higher proportion of unsaturated FAME’s. These differences highlight the importance of biodiesel feedstock composition in determining combustion characteristics.
The strong linear correlation between KSteady and biodiesel content (R2 > 0.90) suggests that oxygen content is the dominant factor influencing steady-state combustion rate. However, deviations in KGlobal,All indicate that puffing mechanisms play a critical role in combustion rate, particularly in mid-range blends (B10–B25) and higher blends (B50–B75). This suggests that puffing mechanisms can play an important role in boosting combustion rates at higher biodiesel concentrations. Therefore, characterizing puffing mechanisms and parameters is crucial to understand the observed trends in global combustion rates, which will be discussed in Section 3.3, Puffing Modes and Characteristics.

3.2.2. Pre-Ignition Time Analysis

Pre-ignition time is a critical combustion parameter that defines the interval between ignition initiation and the establishment of a stable flame. It is composed of two components: physical delay and chemical delay [20,27,44]. Physical delay includes droplet heating, evaporation, and fuel vapor–air mixing, while chemical delay refers to pre-combustion reactions within the fuel–air mixture. In the suspended droplet combustion method, physical delay is typically measured due to limitations in temporal resolution, making it the primary focus of experimental analysis [20,27,44]. The physical delay of ignition is heavily influenced by the thermo-physical properties of fuels, including boiling point, flash point, and surface tension. Higher boiling points necessitate greater energy input for phase transition from liquid to vapor, delaying fuel–air mixing and thereby extending pre-ignition time. Similarly, higher flash points result in longer ignition delays, as more time is required to initiate combustion reactions and establish a stable diffusion flame. These effects are most pronounced in high-biodiesel blends, which exhibit higher boiling and flash points compared to diesel. As shown in Figure 10, pre-ignition time exhibits a strong linear correlation with biodiesel concentration (R2 > 0.95), indicating a clear dependence of ignition delay on fuel properties. B0 (pure diesel) exhibited the shortest pre-ignition time, while B100 had the longest, marking a 46% increase compared to B0. This substantial increase is primarily due to biodiesel’s higher boiling and flash points, which extend the physical delay phase. Blended fuels exhibited pre-ignition times following a linear trend between B0 and B100, confirming that biodiesel concentration proportionally influences ignition delay. A longer pre-ignition time in biodiesel blends allows more fuel to accumulate in the vapor phase before combustion initiates, leading to more premixed combustion. This results in higher combustion temperatures and more complete fuel oxidation, potentially reducing soot, unburned hydrocarbons (UHCs), and carbon monoxide (CO) emissions [11,15]. However, higher combustion temperatures can also increase nitrogen oxides (NOx) emissions, due to the thermal NOx formation mechanism.
As illustrated in Figure 11, the observed pre-ignition time trends in this study align well with existing literature, reinforcing the predictable influence of biodiesel concentration on ignition delay [27,32,47,48,50]. The strong linear correlation (R2 > 0.95) between biodiesel content and pre-ignition time confirms that fuel-bound oxygen and higher boiling temperatures play a dominant role in ignition delay behavior. These findings highlight the need to optimize injection timing and combustion strategies in diesel engines using high-biodiesel blends to mitigate NOx formation while maximizing combustion efficiency.

3.2.3. Burning Time Analysis

Burning time, defined as the duration from ignition to flame extinction, is a key combustion parameter that inversely correlates with the combustion rate—shorter burning times indicate higher combustion rates [20,44]. As shown in Figure 12, burning time trends for pure and blended fuels exhibit expected and non-linear variations, influenced by both fuel composition and puffing effects. The steady combustion rate follows a linear increase with biodiesel concentration, suggesting that burning time should exhibit a corresponding linear decline. However, deviations from this trend can be attributed to puffing, which introduces secondary atomization and transient combustion enhancements. The B0 droplet exhibited the longest burning time, consistent with its lowest combustion rate, while the B10 droplet had the shortest burning time, indicating the highest combustion rate among all tested fuels. This aligns with the global combustion rate trends (Figure 7b), where B10 exhibited the highest combustion efficiency due to enhanced puffing and secondary droplet formation. As biodiesel concentration increased from B10 to B25, burning time gradually lengthened, reflecting a declining global combustion rate. However, at B50 and B75, burning time decreased again, corresponding to an increase in combustion rate for these blends. The B100 droplet exhibited an 8% shorter burning time compared to B0, suggesting that despite its higher boiling point and lower volatility, the additional oxygen in biodiesel enhances oxidation reactions, leading to a more complete and rapid combustion phase. This observation is consistent with previous studies that have reported higher combustion efficiency in B100 due to improved soot oxidation and cleaner flame characteristics [27,32,47,48]. Figure 13 compares burning time trends from this study with the existing literature, highlighting notable differences based on biodiesel feedstock composition. Soybean and commercial biodiesels generally show shorter burning times, while castor oil and tallow-based biodiesels exhibit longer combustion durations, likely due to their higher viscosity and reduced evaporation rates. The current study’s results for WCO and animal fat-derived biodiesel fall within the expected range, demonstrating moderate reductions in burning time compared to diesel but longer durations than highly unsaturated biodiesels.

3.3. Puffing Modes and Characteristics

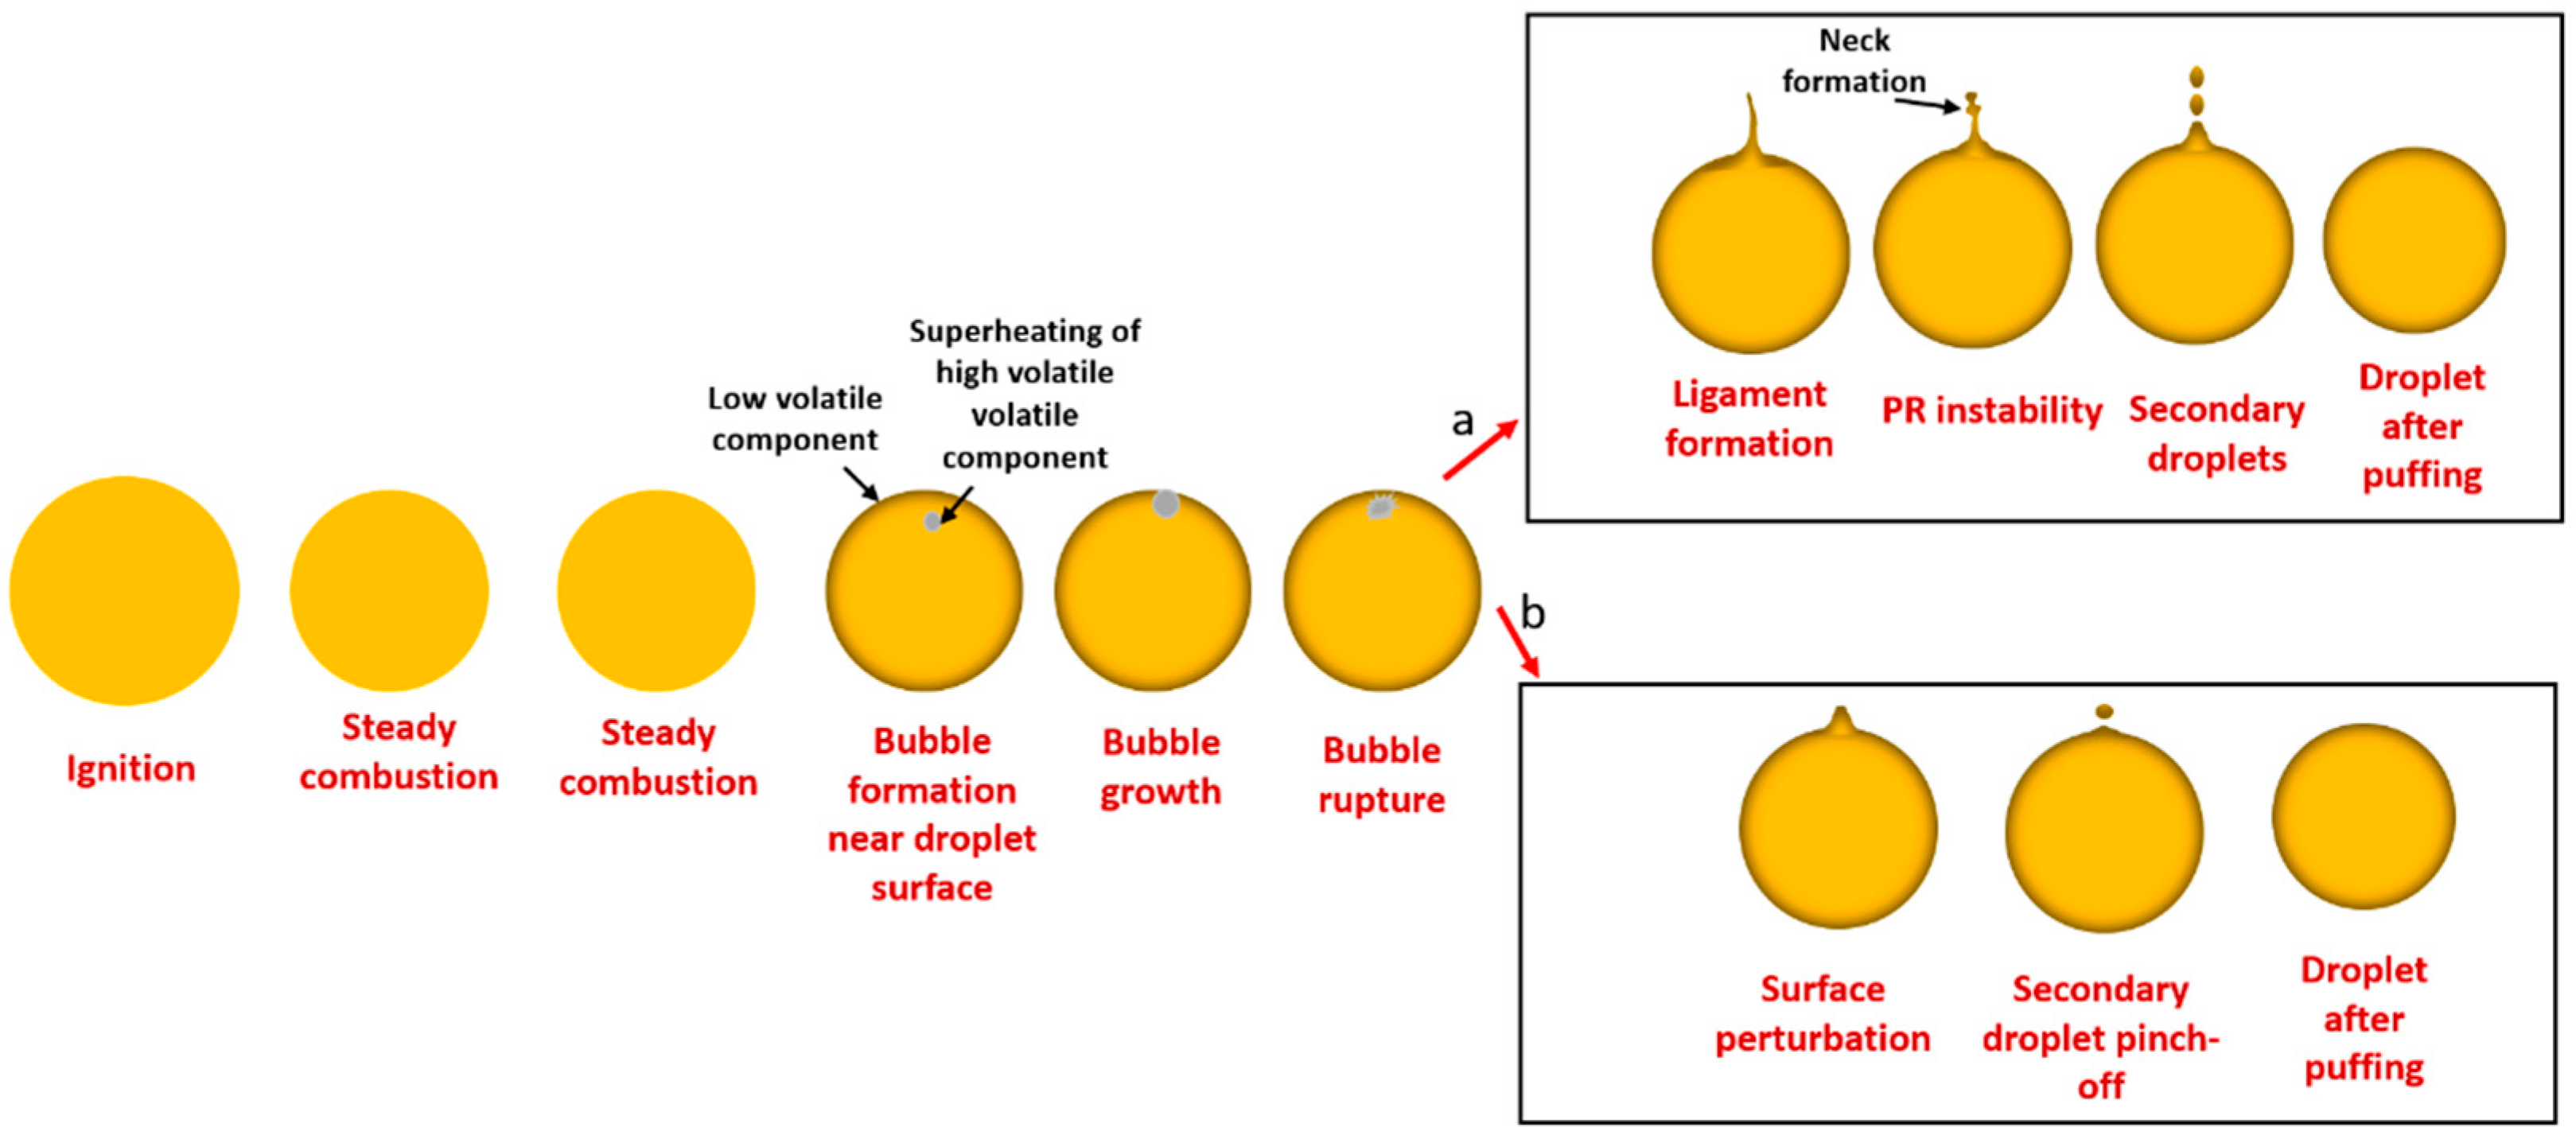
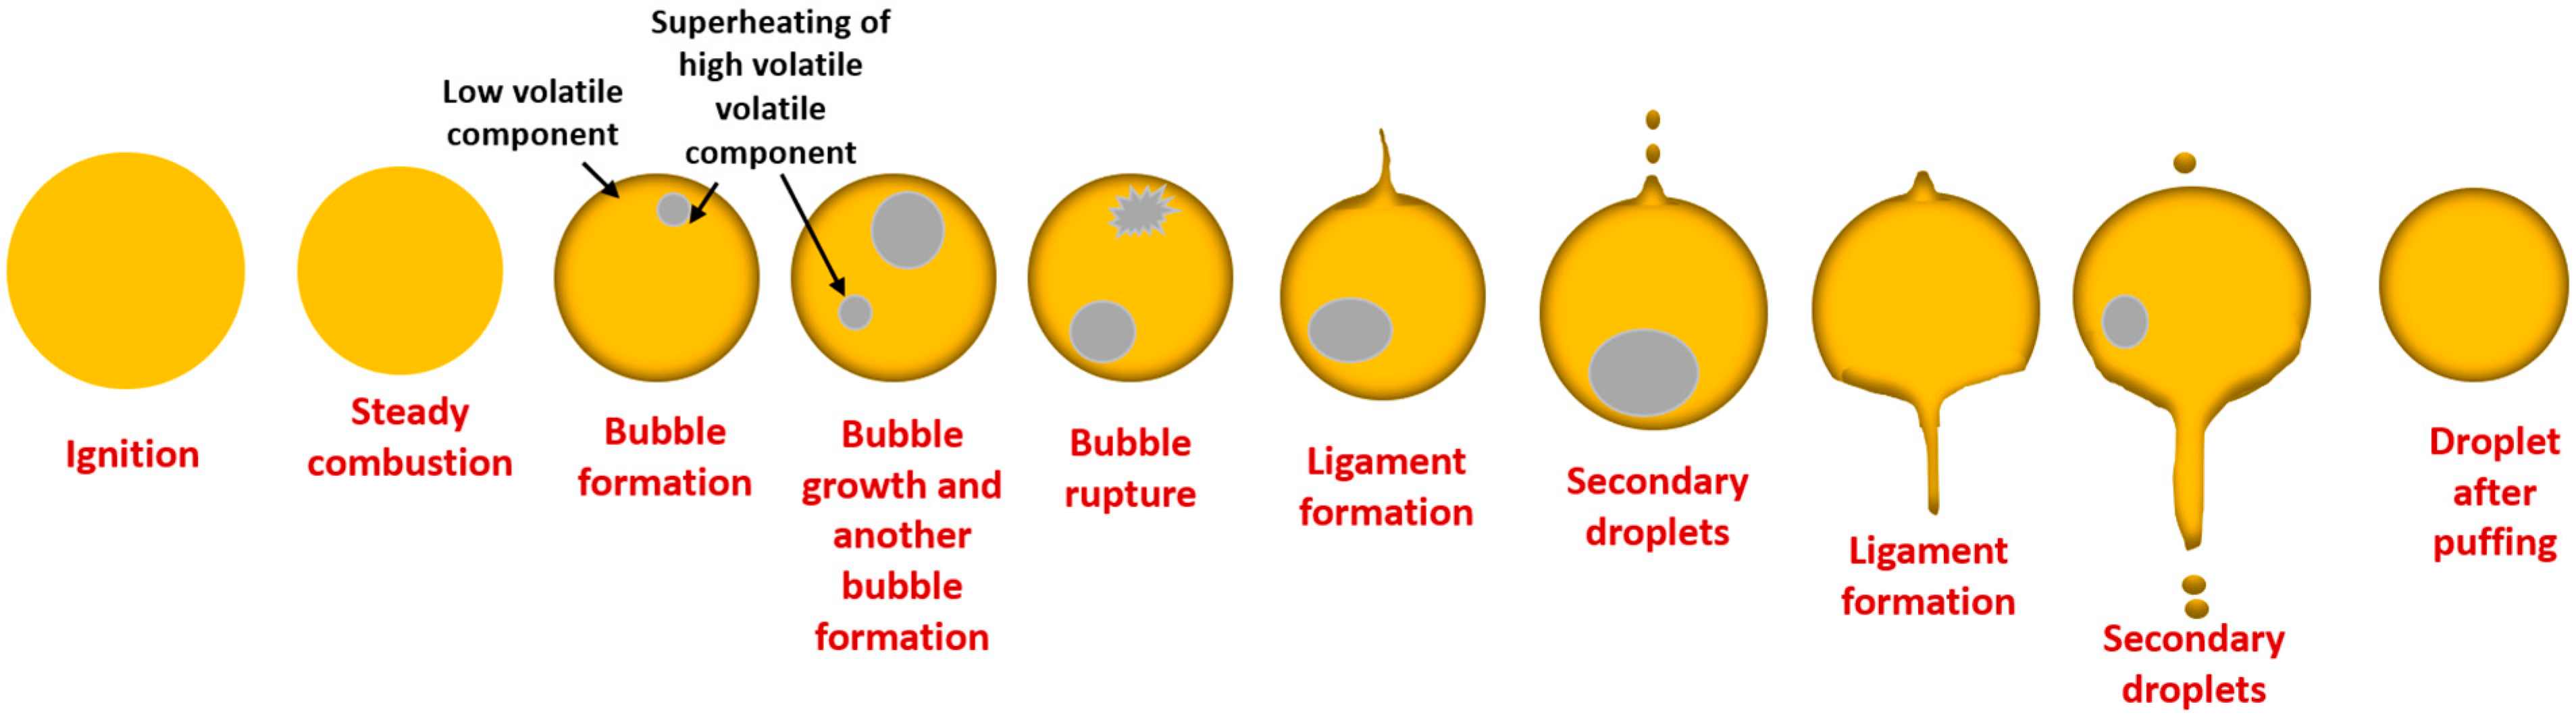
3.3.1. Puffing Mechanisms in Diesel–Biodiesel Blends

The puffing behavior observed in the tested fuels reveals four distinct mechanisms, each governed by fuel composition, volatility, and surface tension effects. Puffing occurs due to the localized accumulation of low-volatility components, leading to heterogeneous nucleation and vapor bubble formation. The interaction of these bubbles with the surrounding liquid results in secondary atomization, significantly influencing combustion efficiency and fuel–air mixing. The classification of these puffing mechanisms provides valuable insights into the droplet fragmentation process, especially in the context of biodiesel–diesel blends, where differences in FAME composition and fuel volatility play a crucial role.
Puffing mechanism 1:
As illustrated in Figure 14, bubble growth in Puffing Mechanism 1 follows three distinct pathways. In the first pathway, a bubble expands within the droplet until it reaches a critical size near the surface. At this point, the surrounding liquid can no longer contain the internal forces, resulting in a sudden rupture. This violent vapor release deforms the droplet surface, ejecting multiple secondary droplets and generating a recoil force that destabilizes the droplet, inducing oscillatory motion. In the second pathway, the bubble migrates toward the droplet surface due to buoyancy and internal pressure gradients [45,46]. Upon reaching the interface, it ruptures explosively, stretching the surrounding liquid into a ligament. This ligament subsequently undergoes Plateau–Rayleigh (PR) instability, fragmenting into multiple secondary droplets [45,46]. Bubble rupture occurs when the net force acting on the gas–liquid interface exceeds the surface tension of the bubble. At the interface, surface tension counteracts part of the internal vapor pressure, but the remaining force stretches the free surface, thinning the liquid film until rupture occurs, forming a cavity. The rapid movement of the surrounding liquid extends the ligament further. Once the ligament reaches a critical length, it undergoes pinch-off due to neck formation, generating secondary droplets [45,46]. The sudden ejection of liquid mass induces a recoil force, further disturbing droplet equilibrium. In the third pathway, the bubble ruptures near the droplet surface, expelling unburnt fuel vapor and creating a localized cavity. As the surrounding liquid moves to fill this cavity, a thin ligament forms and subsequently fragments due to PR instability, producing multiple small secondary droplets.
For pathways involving ligament formation, the ligament’s aspect ratio (length-to-width ratio) plays a crucial role in determining its breakup behavior and the size and number of secondary droplets [45,46]. Ligament length is influenced by liquid density, ligament width, and bubble residual energy [45]. Higher liquid density results in shorter ligaments, while lower surface tension and larger bubbles promote longer ligaments. Previous studies indicate that ligament evolution is governed by the interplay between surface tension and inertia, with viscosity acting as a stabilizing force [45,46]. Surface tension resists ligament stretching along its length while promoting necking and pinch-off along its circumference. Ligament breakup generally falls into two categories: long-wave breakup, which produces high-aspect-ratio ligaments that rapidly fragment into small droplets, and short-wave breakup, where thick ligaments break successively from the tip, generating larger secondary droplets [45,46].
The present study reveals similar trends, where lower biodiesel blends (B5–B25) and pure diesel (B0) predominantly generate high-aspect-ratio ligaments, leading to multiple small secondary droplets. In contrast, higher blends (B50 and B75) produce low-aspect-ratio ligaments, resulting in fewer but larger secondary droplets. In the first pathway, secondary droplet size increases with biodiesel content. For example, B10 droplets generate secondary droplets around 25 μm, while B20 droplets produce secondary droplets approximately 65 μm in diameter. In the second pathway, ligament aspect ratio significantly influences droplet size. B10 droplets exhibit a ligament aspect ratio of approximately 10, producing secondary droplets around 57 μm. In comparison, B20 droplets have a reduced aspect ratio of 5, leading to larger secondary droplets of about 85 μm. At higher biodiesel concentrations, similar ligament aspect ratios result in even larger secondary droplets, with B50 producing droplets around 100 μm and B75 around 120 μm. For the third pathway, ligament aspect ratios tend to be higher than those in the second pathway, leading to smaller secondary droplets. For instance, B10 droplets exhibit a ligament aspect ratio of approximately 13, producing secondary droplets around 60 μm, whereas B15 droplets have an aspect ratio of 10, resulting in secondary droplets around 70 μm.
Puffing mechanism 2:
Figure 15 presents a schematic of puffing mechanism 2. In this mechanism, after the formation of a vapor bubble, the bubble undergoes significant expansion, causing the droplet to enlarge. As the bubble continues to grow, it reaches a maximum size before beginning to shrink, leading to droplet contraction. The primary reason for bubble shrinkage is the substantial increase in droplet surface area during bubble expansion, which accelerates the evaporation process due to the enlarged liquid–gas interface. This rapid evaporation induces a sudden compositional change at the droplet surface, increasing the concentration of low-volatile components, primarily biodiesel in the present study. Since biodiesel has a higher surface tension and viscosity compared to diesel, the surrounding liquid exerts an opposing pressure on the bubble, leading to contraction. Additionally, the internal bubble pressure rises due to this compression. Another contributing factor is the cooling effect experienced by significantly expanded bubbles. Due to the low thermal conductivity of gases, larger bubbles dissipate heat inefficiently, limiting their ability to sustain volumetric expansion and eventually leading to shrinkage. As the bubble contracts, the increasing pressure at the gas–liquid interface pushes it toward the droplet surface. Eventually, the bubble ruptures, forming a cavity and ejecting unburnt fuel vapor. This mechanism was observed only in lower biodiesel blends (B5–B25) during the initial puffing stage, with ligament aspect ratios generally smaller than those in Puffing Mechanism 1. For instance, B5 droplets exhibited a ligament aspect ratio of approximately 4.5, producing secondary droplets around 140 μm. B15 droplets had a ligament aspect ratio of approximately 5.6, generating secondary droplets around 77 μm. Similarly, B20 droplets exhibited a ligament aspect ratio of approximately 8.3, producing secondary droplets around 55 μm.
Puffing mechanism 3:
As shown in Figure 16, puffing mechanism 3 involves bubble formation near the droplet surface without significant growth. Instead of expanding substantially, the bubble ruptures near the surface, producing either thin ligaments or surface perturbations. Ligaments formed through this mechanism were relatively short and exhibited lower aspect ratios than previously discussed mechanisms. In the first pathway, the ligament aspect ratio increased with higher biodiesel content. This trend can be attributed to biodiesel’s higher surface tension, which allows near-surface bubbles to accommodate greater internal pressure before rupture. For instance, B0 droplets exhibited a ligament aspect ratio of approximately 2.5, producing secondary droplets around 55 μm. B10 droplets had a ligament aspect ratio of approximately 4, generating secondary droplets around 45 μm. B20 droplets exhibited a ligament aspect ratio of approximately 6, producing secondary droplets around 40 μm. Similarly, B50 droplets exhibited a ligament aspect ratio of approximately 7.3, forming secondary droplets around 30 μm. For the second pathway, no significant differences in ligament aspect ratios were observed across the tested fuels, with values generally remaining below 2. However, secondary droplet sizes varied between 30 and 60 μm, increasing with higher biodiesel content in the blend.
Puffing mechanism 4:
Figure 17 illustrates puffing mechanism 4, which represents a combination of mechanisms 1 and 3. In this mechanism, multiple bubbles form within the droplet, with some growing and migrating toward the surface while others remain near their point of origin. As these bubbles rupture, secondary droplets are generated. Bubbles that reach the droplet surface undergo rupture-driven ligament formation, similar to mechanism 1. Simultaneously, bubbles that rupture near the droplet surface without significant growth induce localized surface perturbations, like mechanism 3. These perturbations contribute to additional secondary droplet formation, with their sizes and distributions influenced by biodiesel concentration.
The puffing mechanisms observed in this study are consistent with previous research on multicomponent fuel droplet combustion, particularly in biodiesel–diesel and bioethanol–diesel blends, while mechanism 3 is reported for the first time [24,45,46,51]. Experimental studies indicate that ligament-driven atomization dominates in fuels with higher volatility differences, whereas surface perturbation effects become more prominent in fuels with lower volatility differences. The observed trends in ligament aspect ratios and secondary droplet sizes further confirm that surface tension, viscosity, and bubble expansion dynamics play crucial roles in puffing-induced secondary atomization [45,46,51].

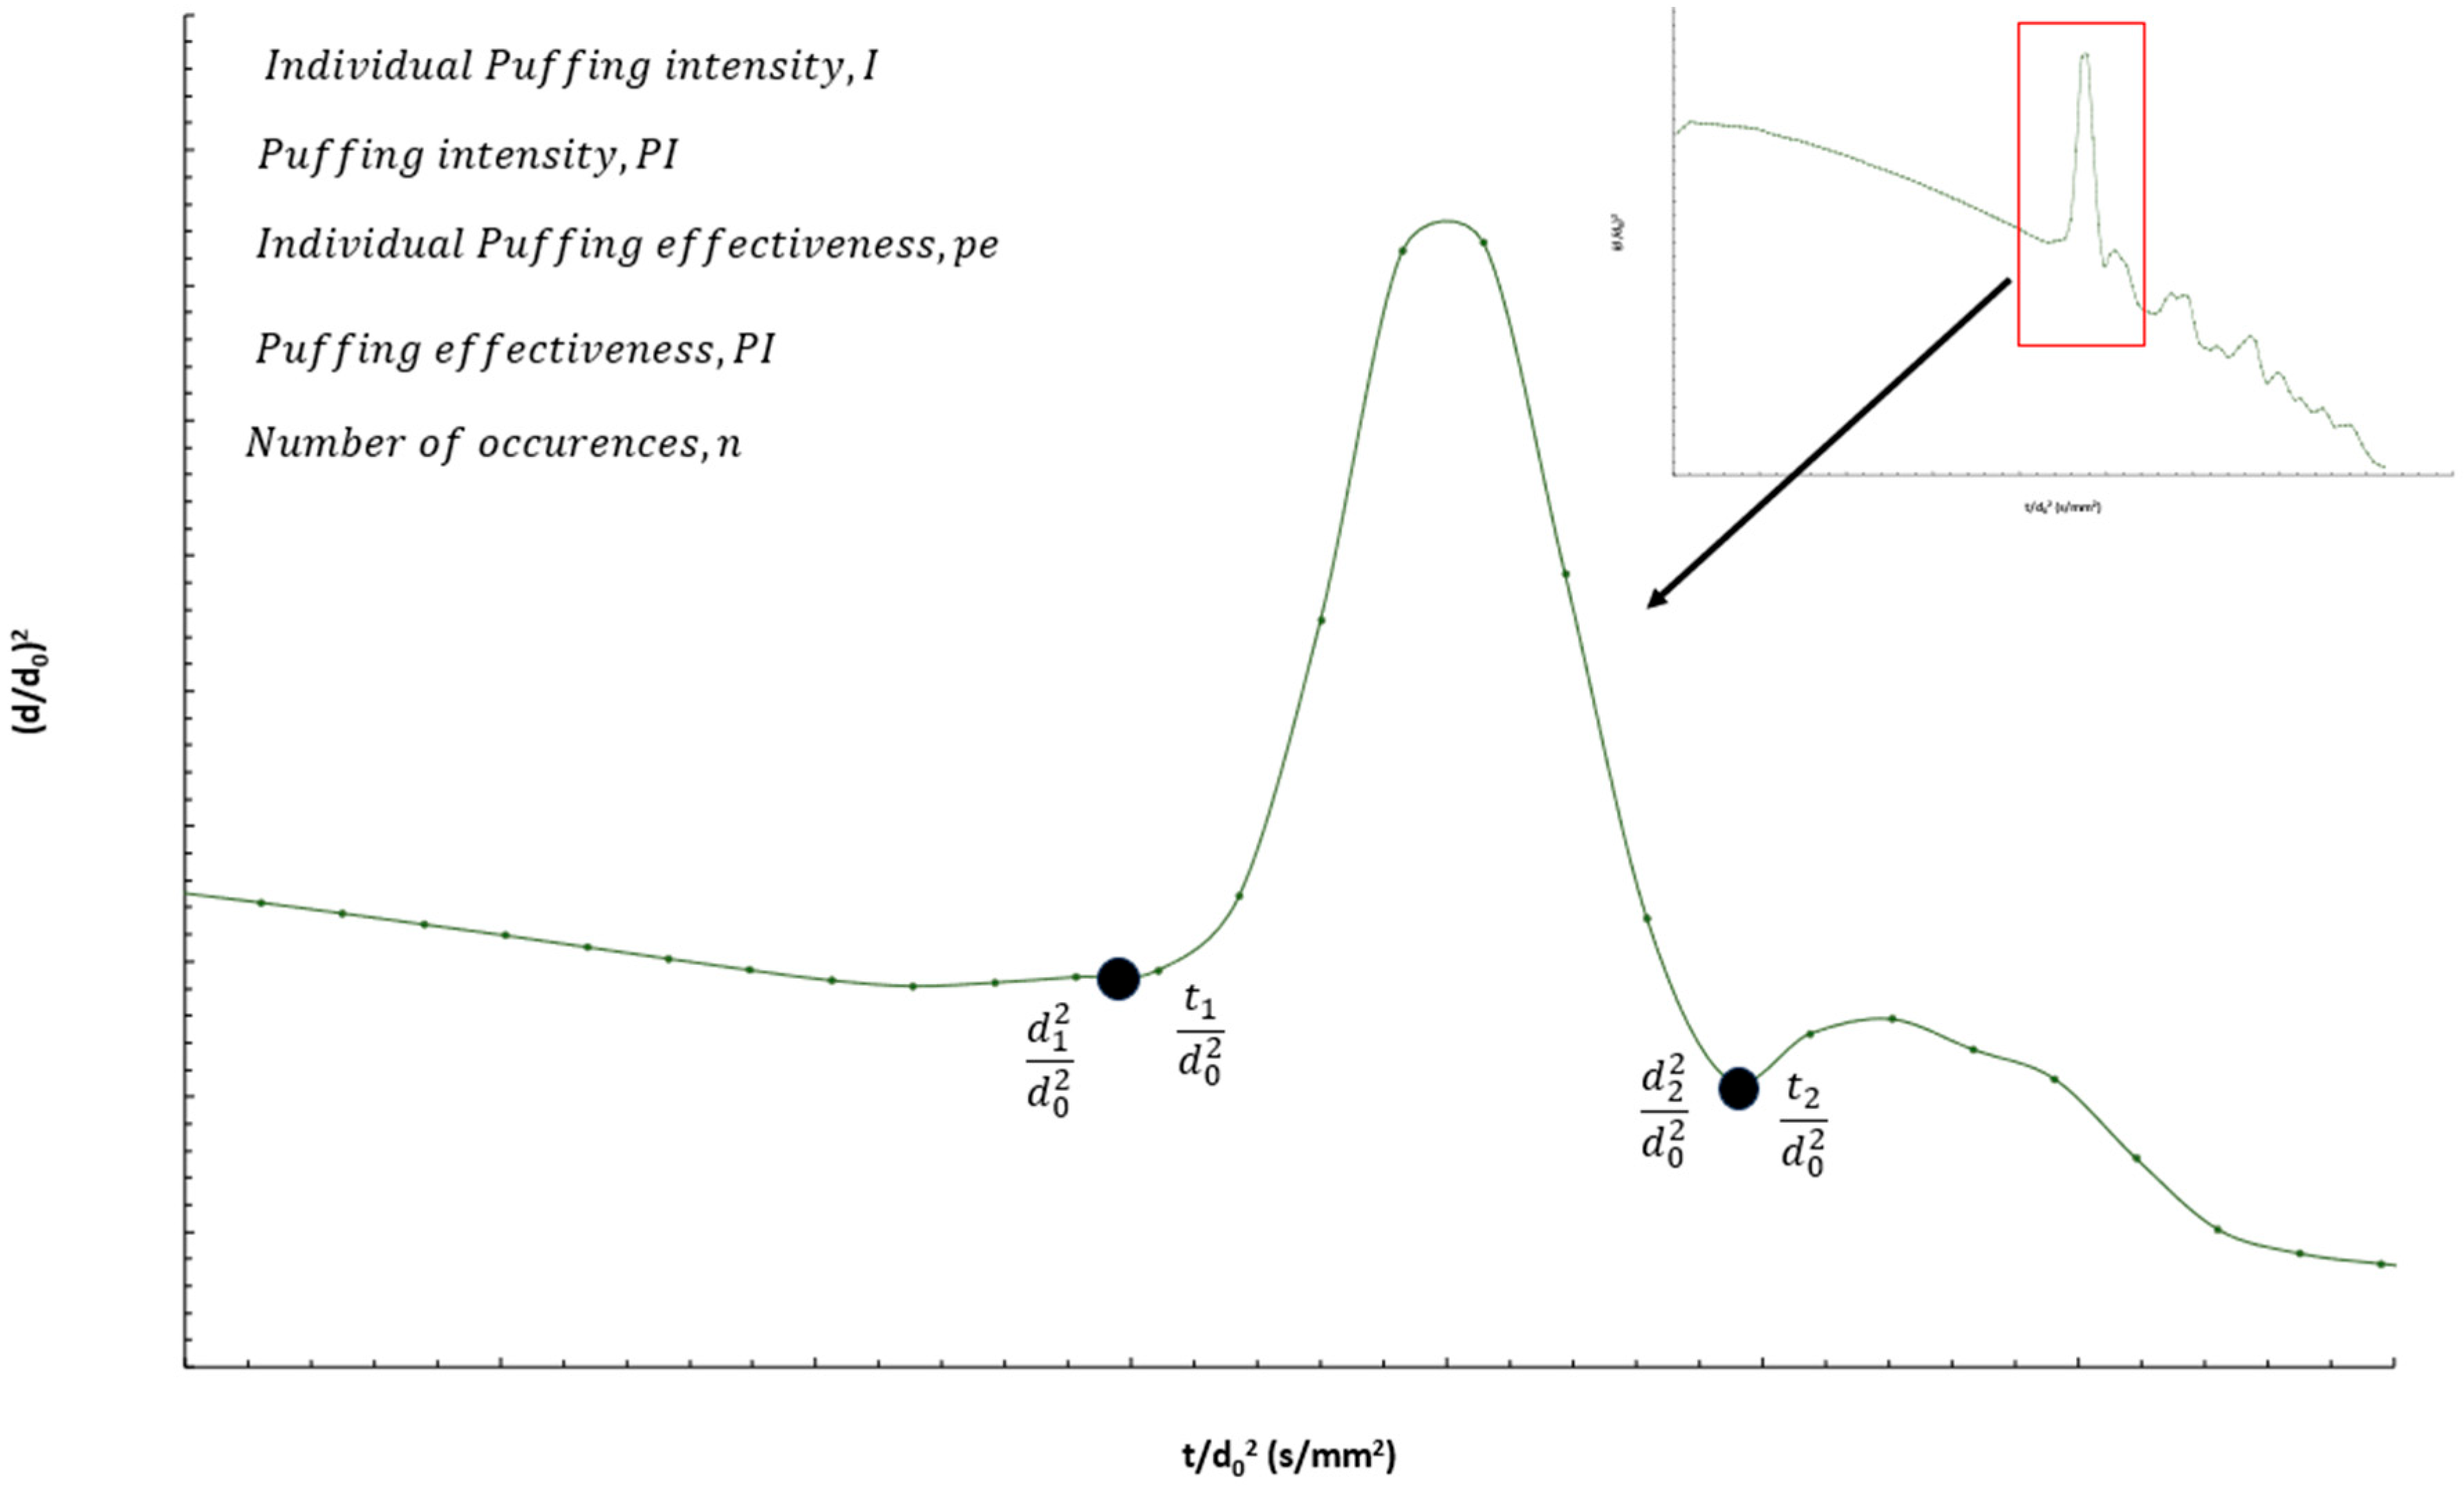
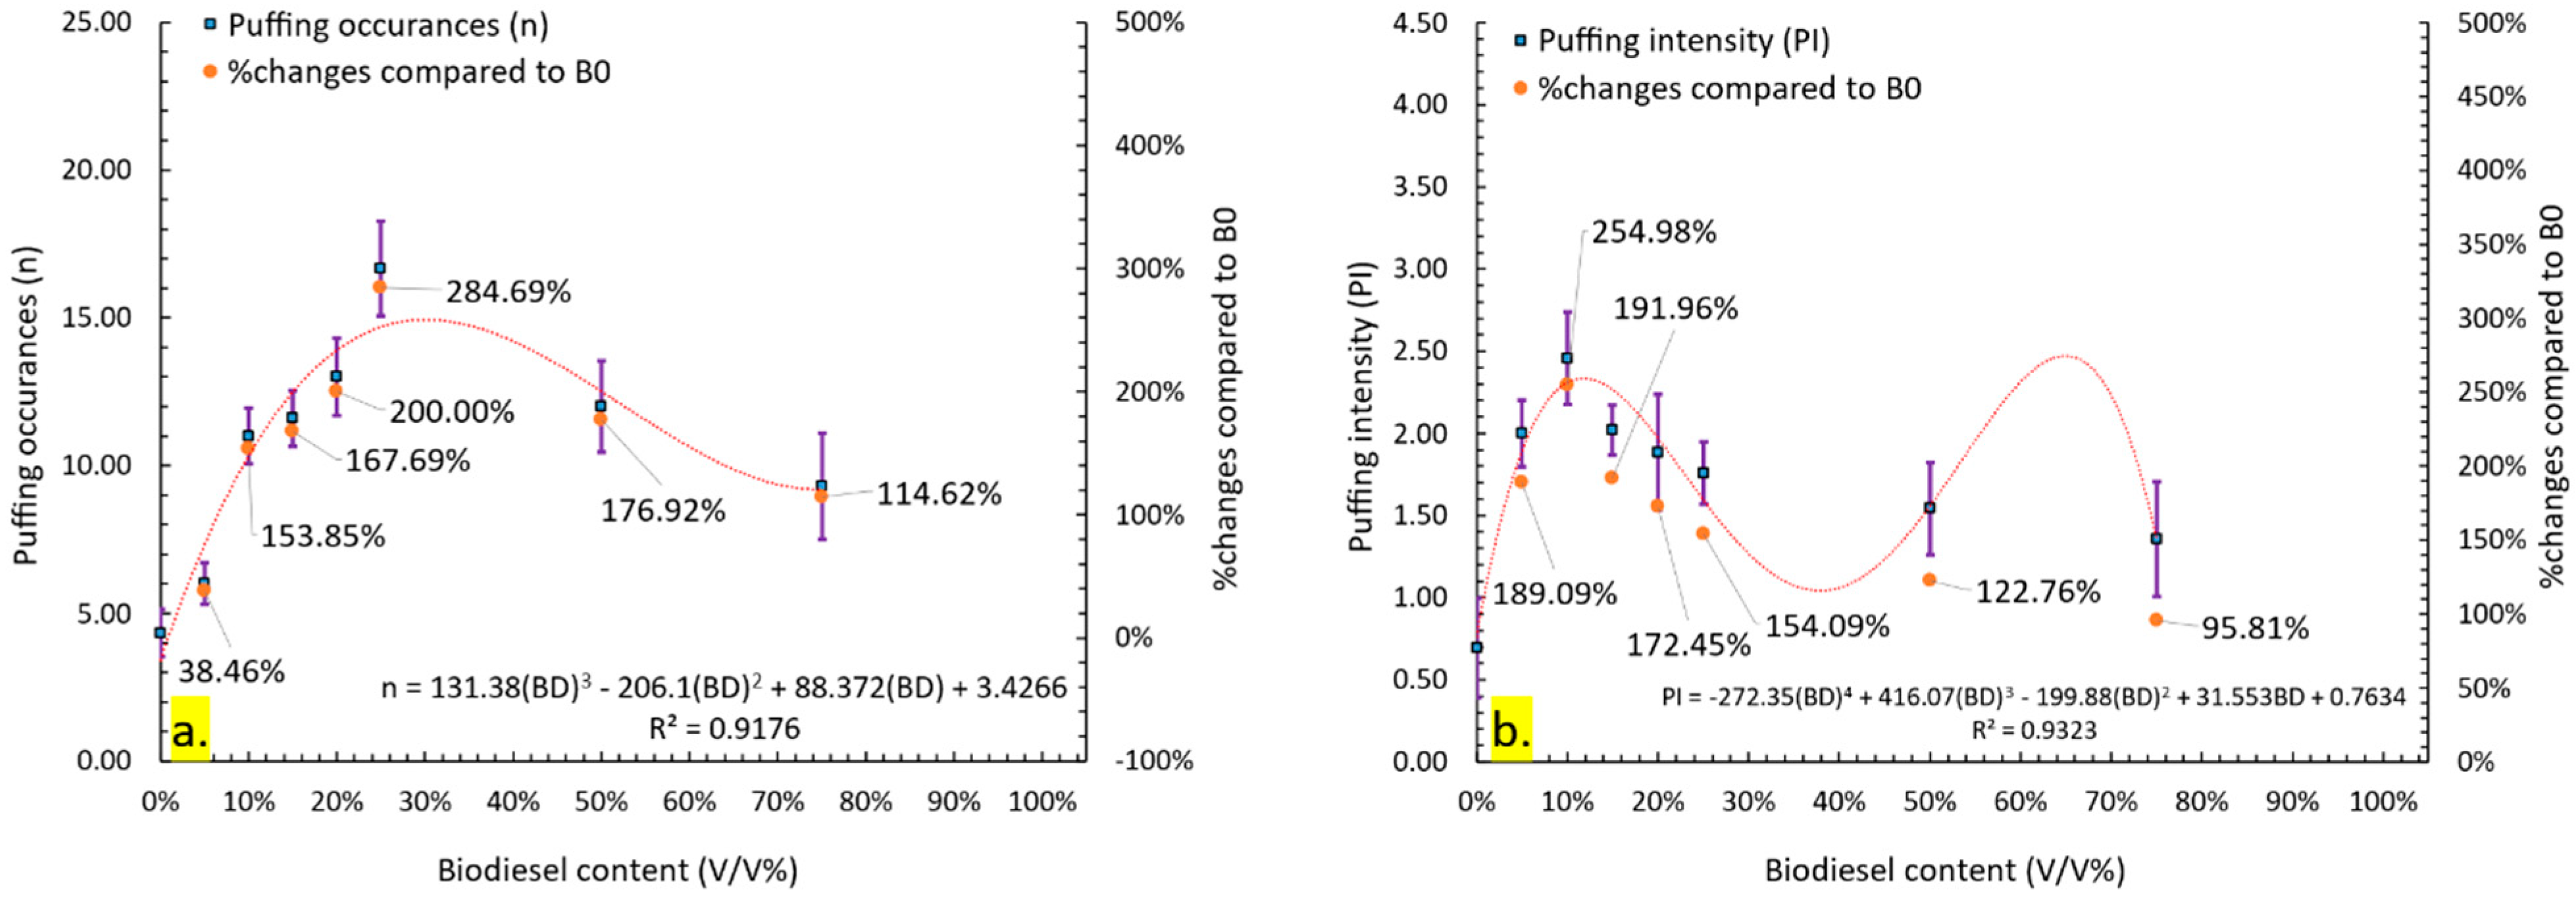
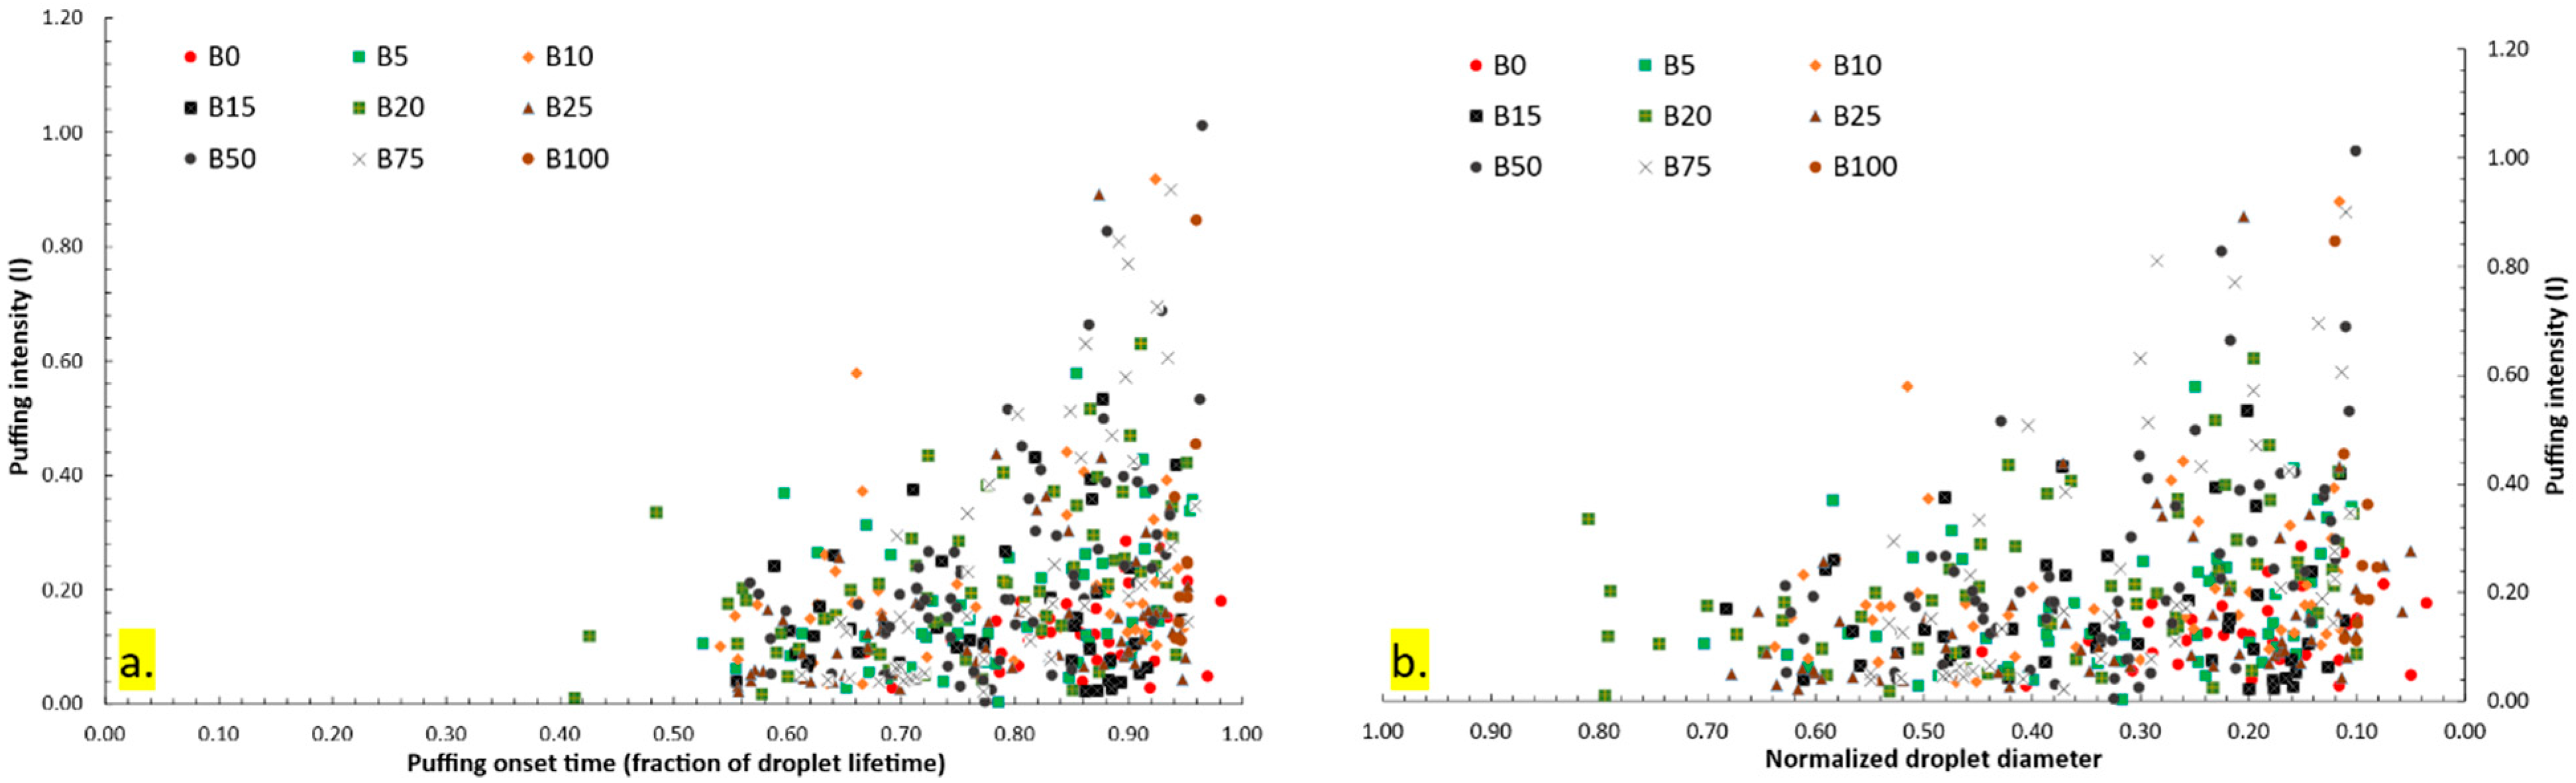
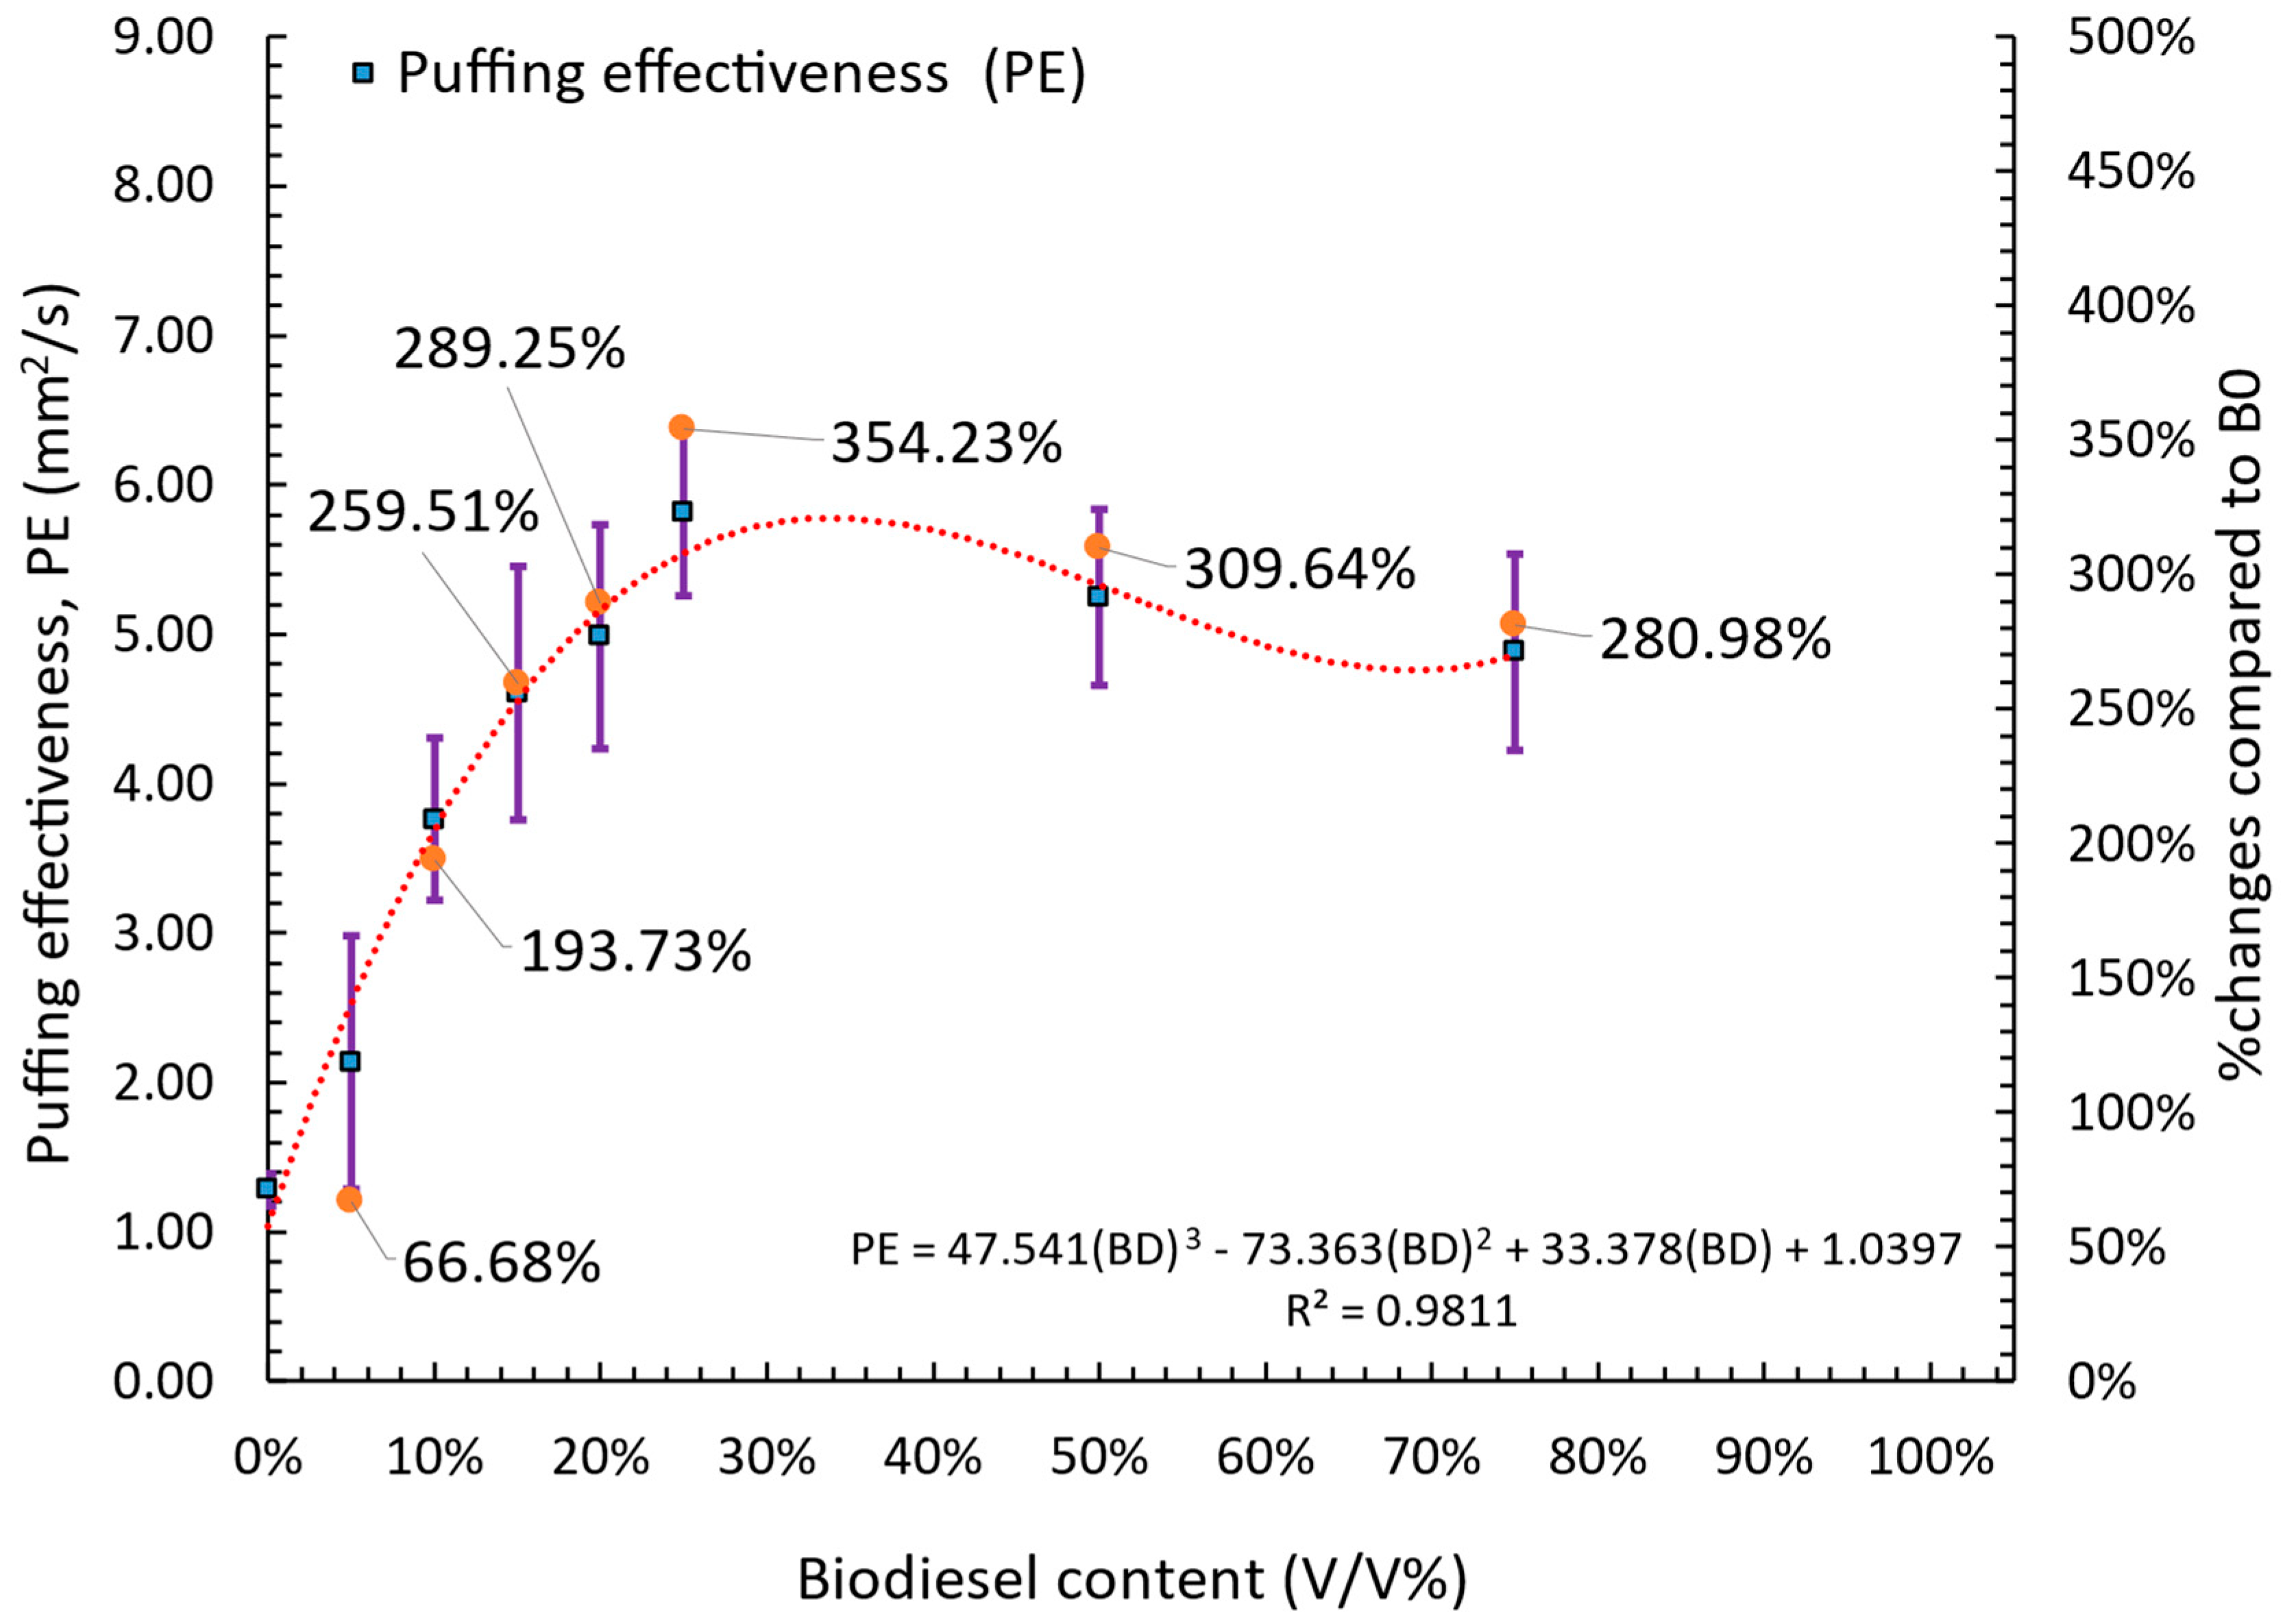
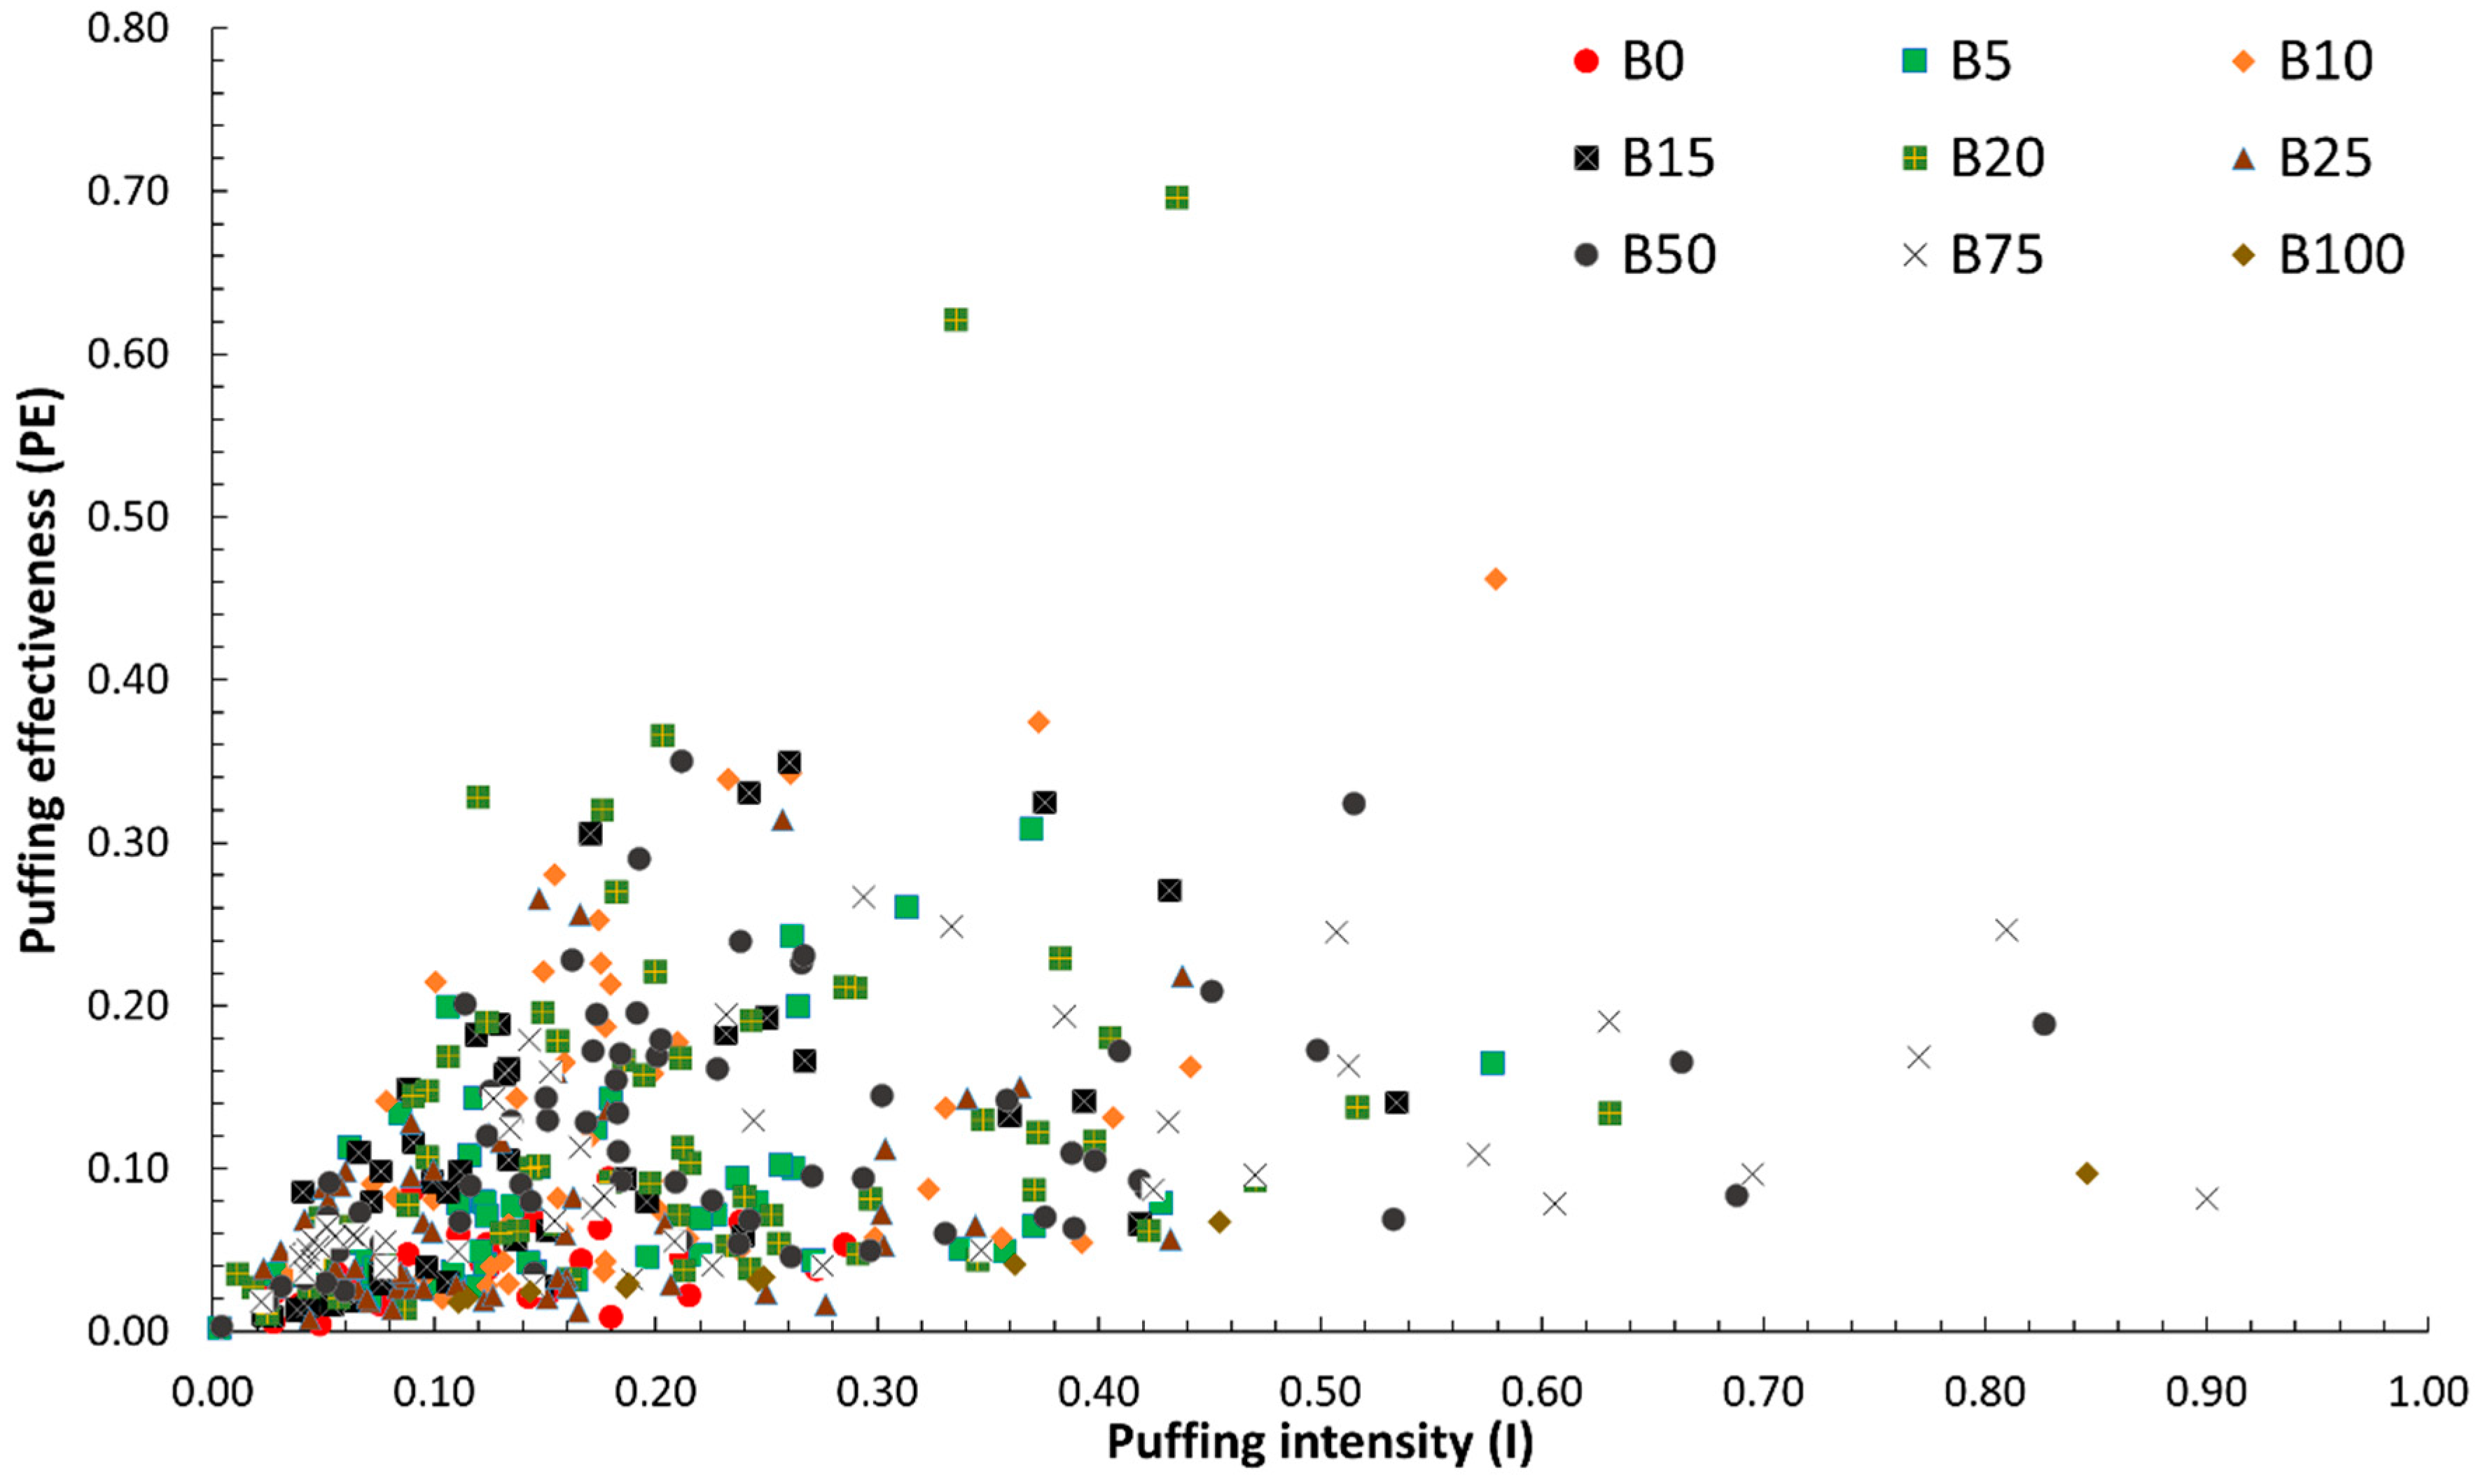
3.3.2. Quantitative Analysis of Puffing Occurrences, Intensity, and Effectiveness

The puffing behavior of diesel–biodiesel blends was quantitatively analyzed using three key parameters: puffing occurrences (n), puffing intensity (PI), and puffing effectiveness (PE). A detailed methodology for calculating these parameters is provided in Supplementary Information Section S1: Data Quantification and illustrated in Figure 18. Puffing occurrences (n) denote the total number of puffing events during combustion. Individual puffing intensity (I) quantifies the reduction in droplet size per puffing event, indicating the volume of fuel expelled [44,45,46,51]. Similarly, individual puffing effectiveness (pe) measures the rate of droplet size reduction during a puffing event. The overall puffing intensity (PI) and puffing effectiveness (PE) represent the cumulative values of all occurrences throughout the combustion process. These parameters collectively provide insights into how puffing affects the combustion rate. It is important to note that the projected area of the droplet is used to determine its projected diameter or size, which serves as an approximation of the actual droplet dimensions. Consequently, the relationship between projected area and volume introduces an approximation in the characterization of puffing behavior. However, since puffing dynamics primarily depend on relative changes in droplet size, the trends observed using projected area are expected to be consistent with those derived from actual volume measurements. Notably, for B100 droplets, puffing was observed only during the final combustion stage. Due to potential uncertainties associated with the influence of the support fiber and image processing limitations, puffing parameters were quantified only for droplets with a normalized diameter squared, d 2 / d 0 2 , greater than 0.100. Under these conditions, no puffing events were observed in B100 droplets, and therefore, no quantitative data are presented for this case.
Individual   puffing   intensity ,   I = d 1 d 0 2 d 2 d 0 2 d 2 d 0 2
Puffing   intensity ,   P I = i = 1 n I i
Individual   puffing   effectiveness ,   p e = d 1 d 0 2 d 2 d 0 2 t 1 d 0 2 t 2 d 0 2
Puffing   effectiveness ,   P E = i = 1 n p e i
where d 1 d 0 = normalized droplet diameter at the onset of a puffing event, d 2 d 0 = normalized droplet diameter at the end of a puffing event, t 1 d 0 2 = normalized time at the onset of a puffing event, t 2 d 0 2 = normalized time at the end of a puffing event, and n = number of puffing occurrences during one experiment.
Figure 19a shows the variation in puffing occurrences across different fuel blends, following a third-order polynomial trend with a strong correlation (R2 > 0.91). The results show that puffing occurrences increased with biodiesel concentration in lower blends, reaching a peak at B25. Beyond B25, the number of puffing events declined for higher blends (B50 and B75). Specifically, puffing occurrences increased almost linearly with biodiesel content up to B25, where the highest frequency—approximately three times that of B0—was observed. The frequency of puffing events is closely linked to the formation of heterogeneous nucleation sites, which promote bubble formation. In lower biodiesel blends, greater compositional variation enhances the likelihood of puffing, leading to more frequent occurrences. The trends in puffing intensity for different fuel blends are shown in Figure 19b, following a fourth-order polynomial trend with a strong correlation (R2 > 0.93). All biodiesel blends exhibited greater puffing intensity than B0, with B10 displaying the highest intensity—approximately 2.5 times that of B0. Beyond B10, puffing intensity gradually decreased but remained higher than that of pure diesel. Puffing intensity is directly linked to the extent of droplet fragmentation, influencing the amount of fuel released as vapor or secondary droplets into the flame zone. The evolution of puffing intensity with respect to droplet lifetime and normalized droplet size is presented in Figure 20. For B0, puffing intensity ranged from 0.027 to 0.28, occurring at approximately 66.7% of the droplet’s lifetime with a normalized droplet size of 0.446. In contrast, lower biodiesel blends (B5–B25) exhibited earlier and more intense puffing events, with puffing initiation occurring between 41.2% and 55.6% of the droplet’s lifetime and at larger normalized droplet sizes. Higher blends (B50 and above) demonstrated delayed puffing, occurring at later combustion stages, with reduced puffing intensity. For B100, puffing events were observed much later, at approximately 94.1% of the droplet’s lifetime, with a significantly reduced normalized droplet size of 0.100.
Puffing effectiveness (PE), which quantifies the rate at which puffing events contribute to droplet fragmentation and combustion rate improvements, exhibits a third-order polynomial trend (R2 > 0.98) (Figure 21). All biodiesel blends displayed higher puffing effectiveness than B0, with B10 demonstrating the highest effectiveness (~3.5 times that of B0). Beyond B10, puffing effectiveness declined until B25, but remained significantly higher than B0. Interestingly, B50 and B75 exhibited increased puffing effectiveness, despite their lower puffing occurrences and intensity, suggesting that although puffing events were less frequent, they were more effective in enhancing combustion through rapid droplet fragmentation. This can be attributed to shorter, thicker ligament formations (mechanism 1, pathway 2) in B50 and B75, which facilitate larger secondary droplet generation, leading to greater fuel mass transport into the flame zone.
The trends in puffing characteristics align well with the global combustion rate trends (Figure 7b), reinforcing the role of puffing in combustion enhancement. The highest global combustion rate was observed for B10, attributed to the optimal combination of the highest puffing intensity, effectiveness, and moderate puffing occurrences. Beyond B10, global combustion rate declined up to B25, despite increased puffing occurrences, due to the reduced intensity and effectiveness of puffing events. However, B50 and B75 exhibited a resurgence in combustion rate, driven by moderate puffing intensity and occurrences, coupled with significantly higher puffing effectiveness. This suggests that while higher blends (B50–B75) experience fewer puffing events, each event contributes more effectively to fuel–air mixing and combustion enhancement.
Figure 22 compares individual puffing intensity with resultant puffing effectiveness. The data indicate that higher puffing intensity does not necessarily correspond to higher puffing effectiveness. Instead, combustion enhancement is influenced by a combination of moderate puffing intensity, high puffing effectiveness, and frequent puffing occurrences.
Figure 23 compares combustion and puffing characteristics across different biodiesel blends, normalized against B0 (pure diesel). The radar plot (Figure 23a) shows that B10 consistently outperformed other blends in global combustion rate, aligning with its peak puffing effectiveness and intensity (Figure 23b). The results align with previous studies on biodiesel puffing behavior, where lower biodiesel blends (≤B30) exhibit the strongest puffing effects due to compositional stratification [28,30].

4. Conclusions

This study systematically examined the combustion behavior of diesel–biodiesel blends (B5, B10, B15, B20, B25, B50, B75) at the droplet scale, focusing on third-generation biodiesel derived from waste cooking oil (WCO) and animal fats. The findings provide new insights into how biodiesel concentration influences droplet evolution during combustion, affecting combustion rate, pre-ignition time, burning time, and puffing characteristics, all of which play a crucial role in fuel mass transport and overall combustion efficiency.
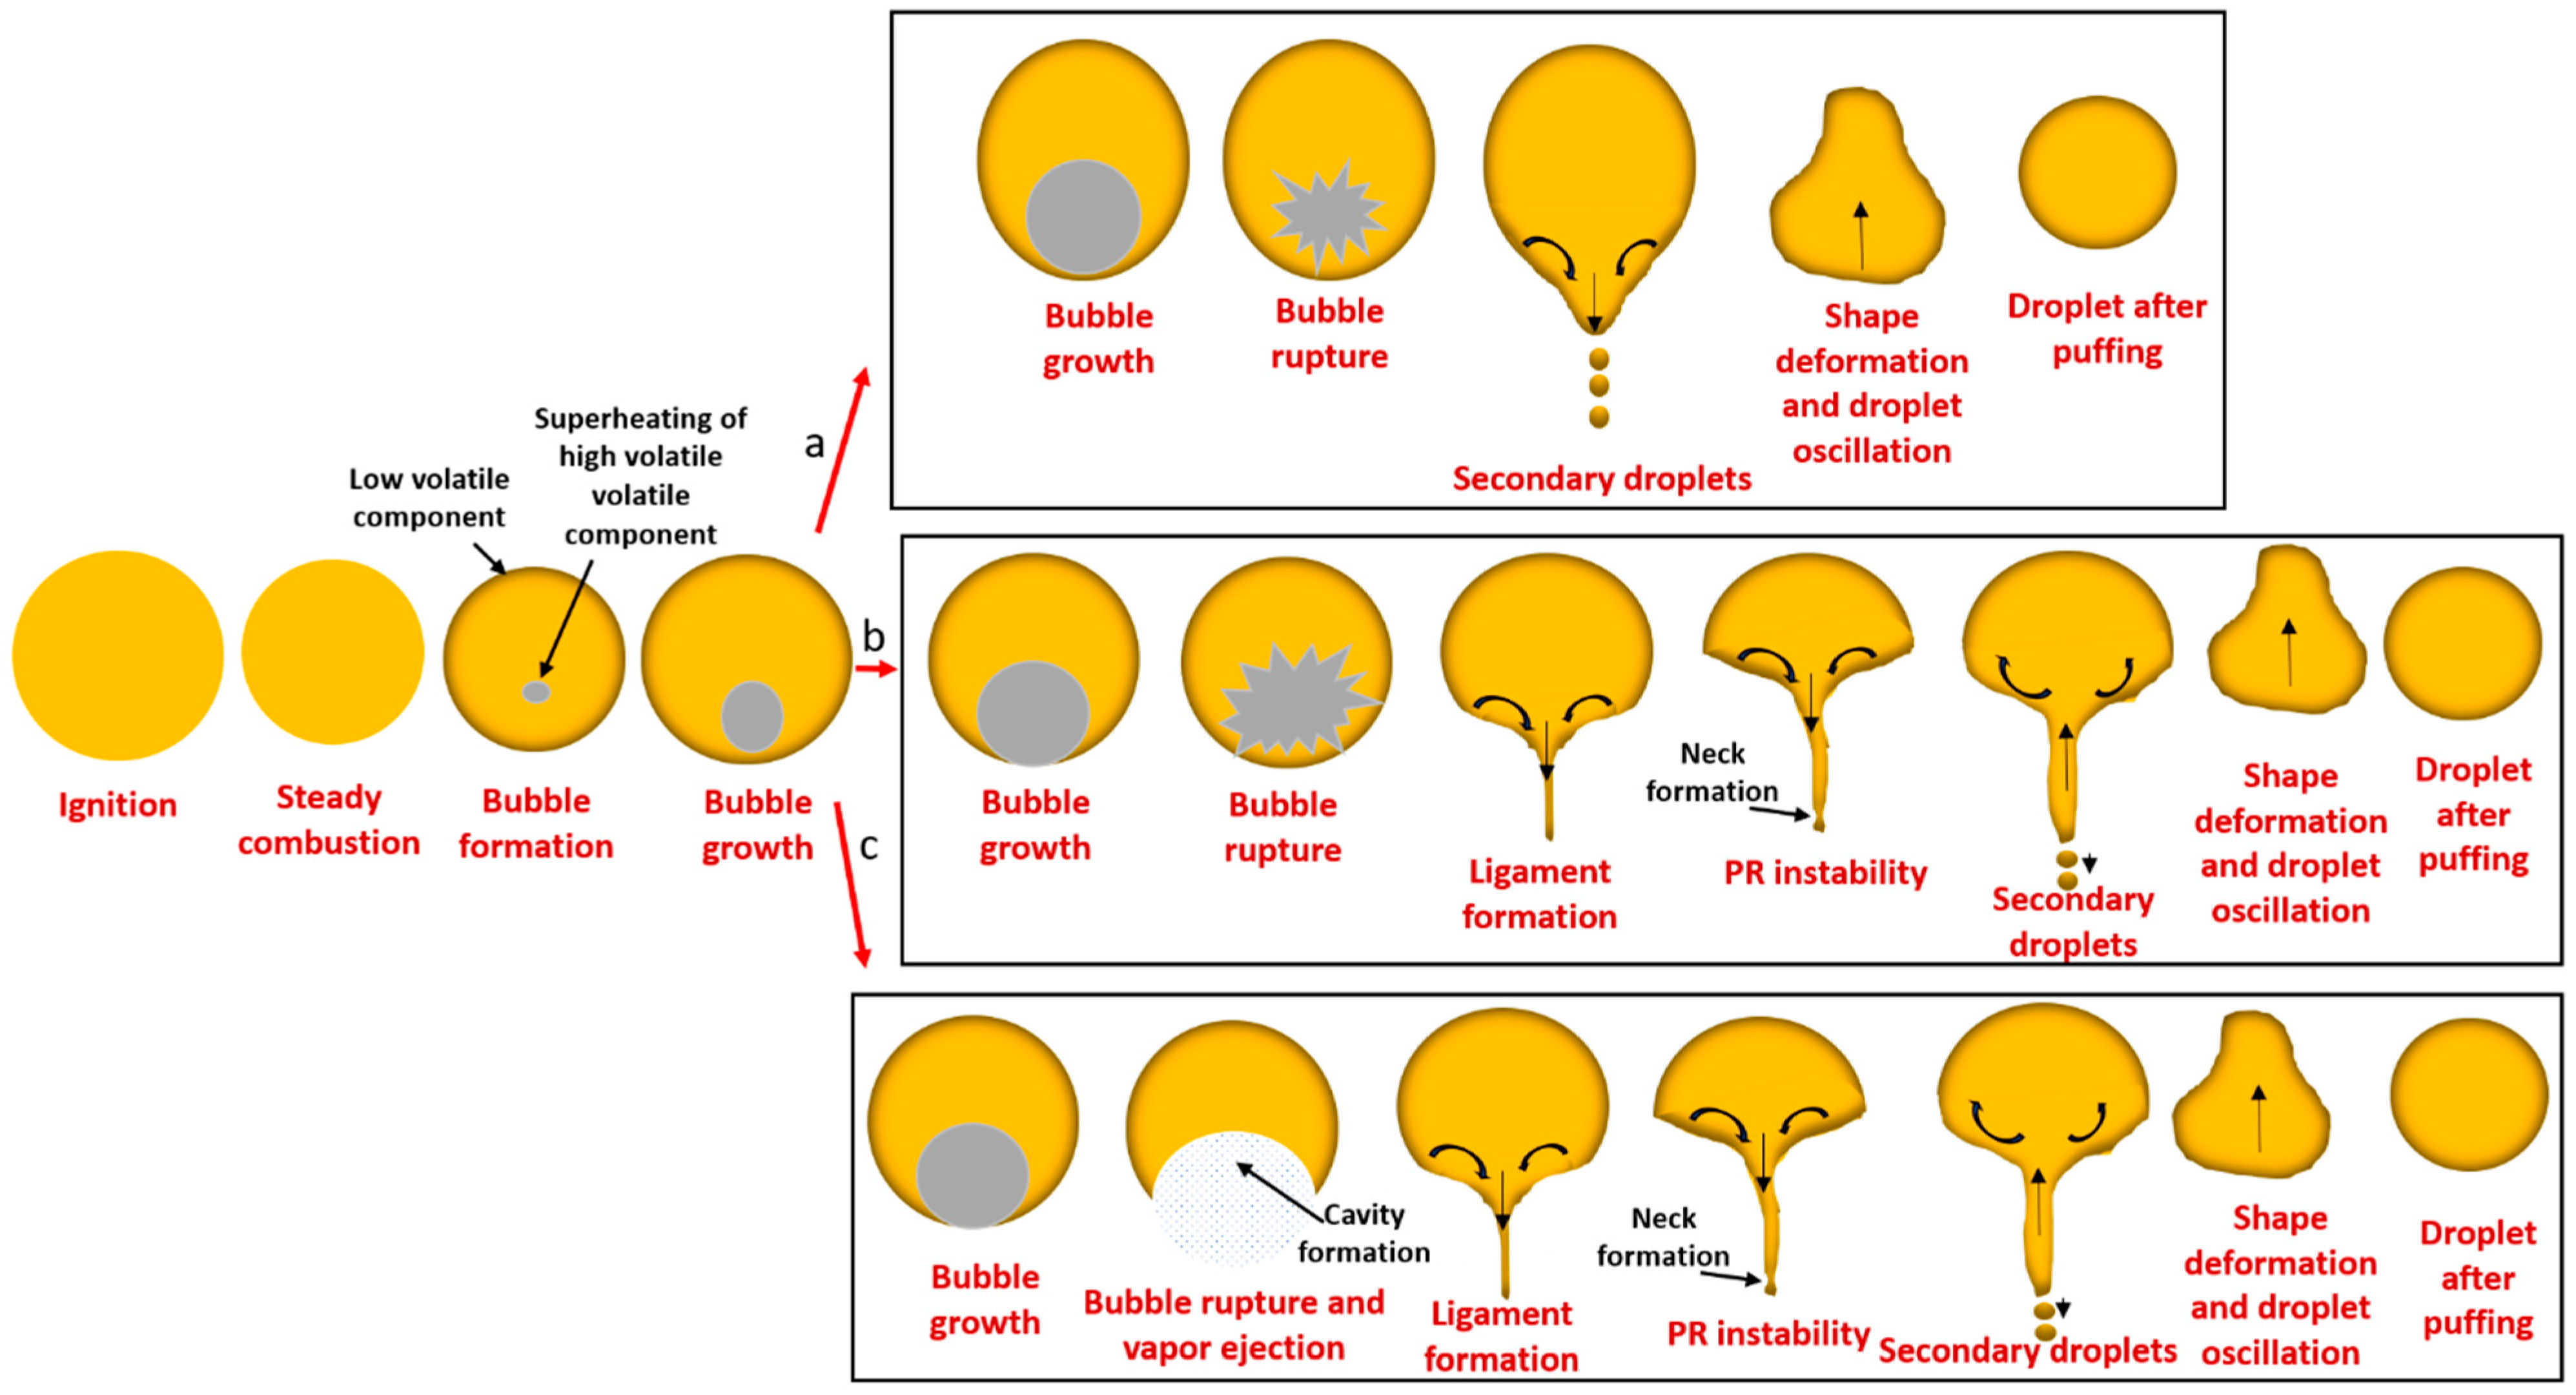
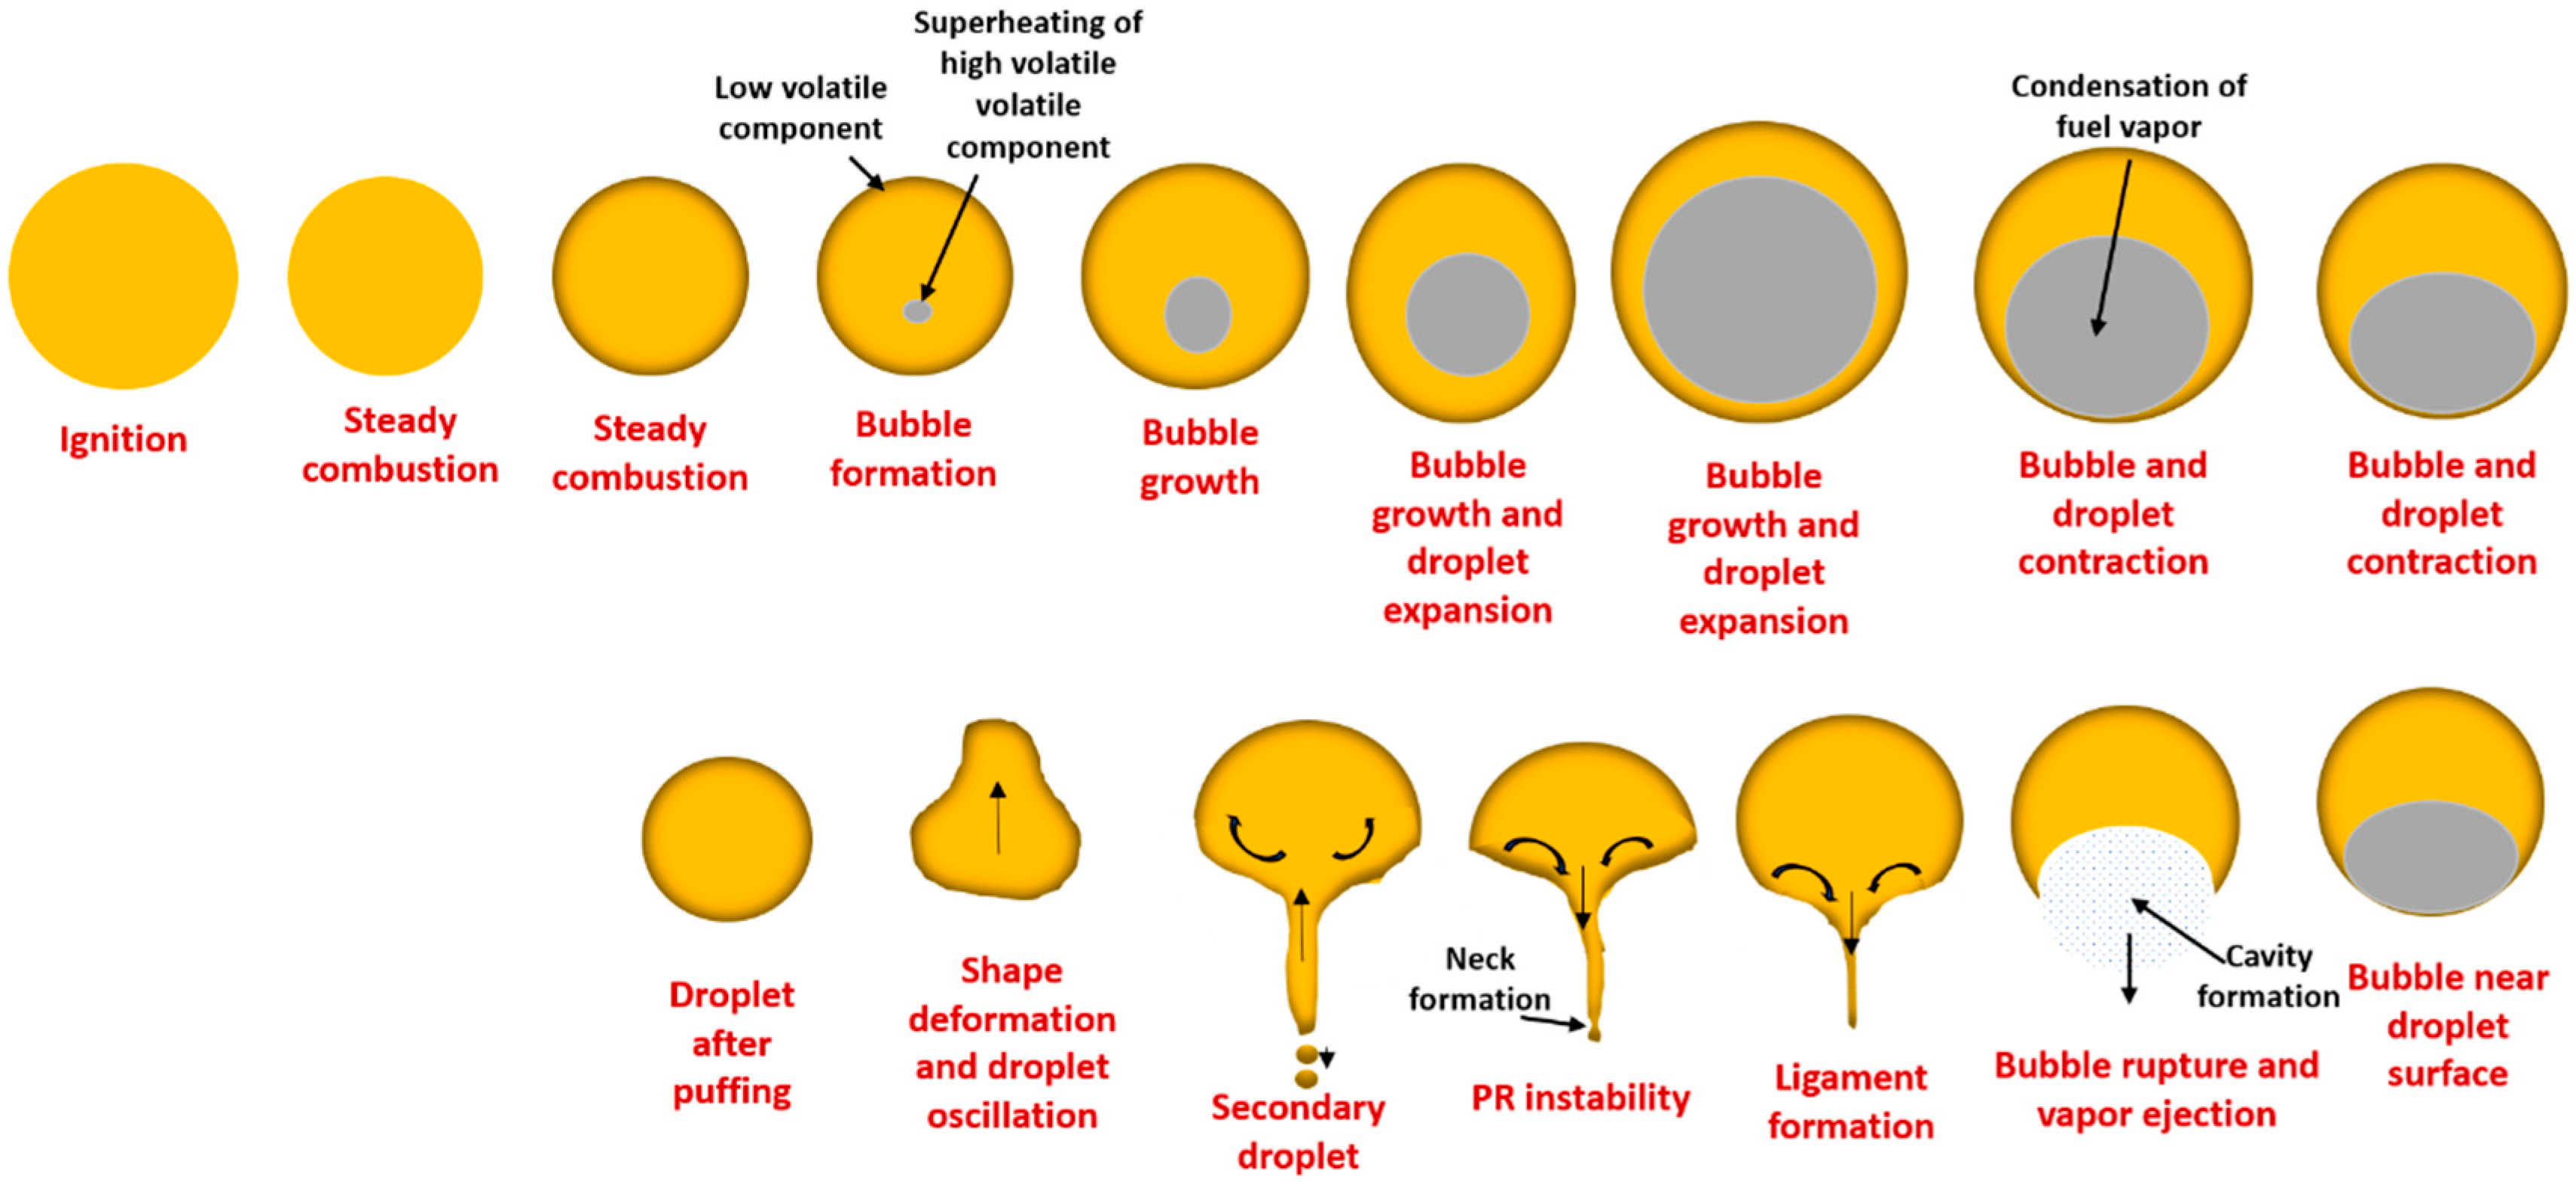
  • Both neat fuels (B0 and B100) and blended fuels exhibited two distinct combustion stages: a steady combustion stage and a puffing stage. However, the characteristics and duration of these stages varied notably among different blends, particularly in puffing behavior between lower (B5–B25) and higher (B50, B75) biodiesel concentrations. The evolution of droplet morphology also showed distinct differences between these two blend categories.
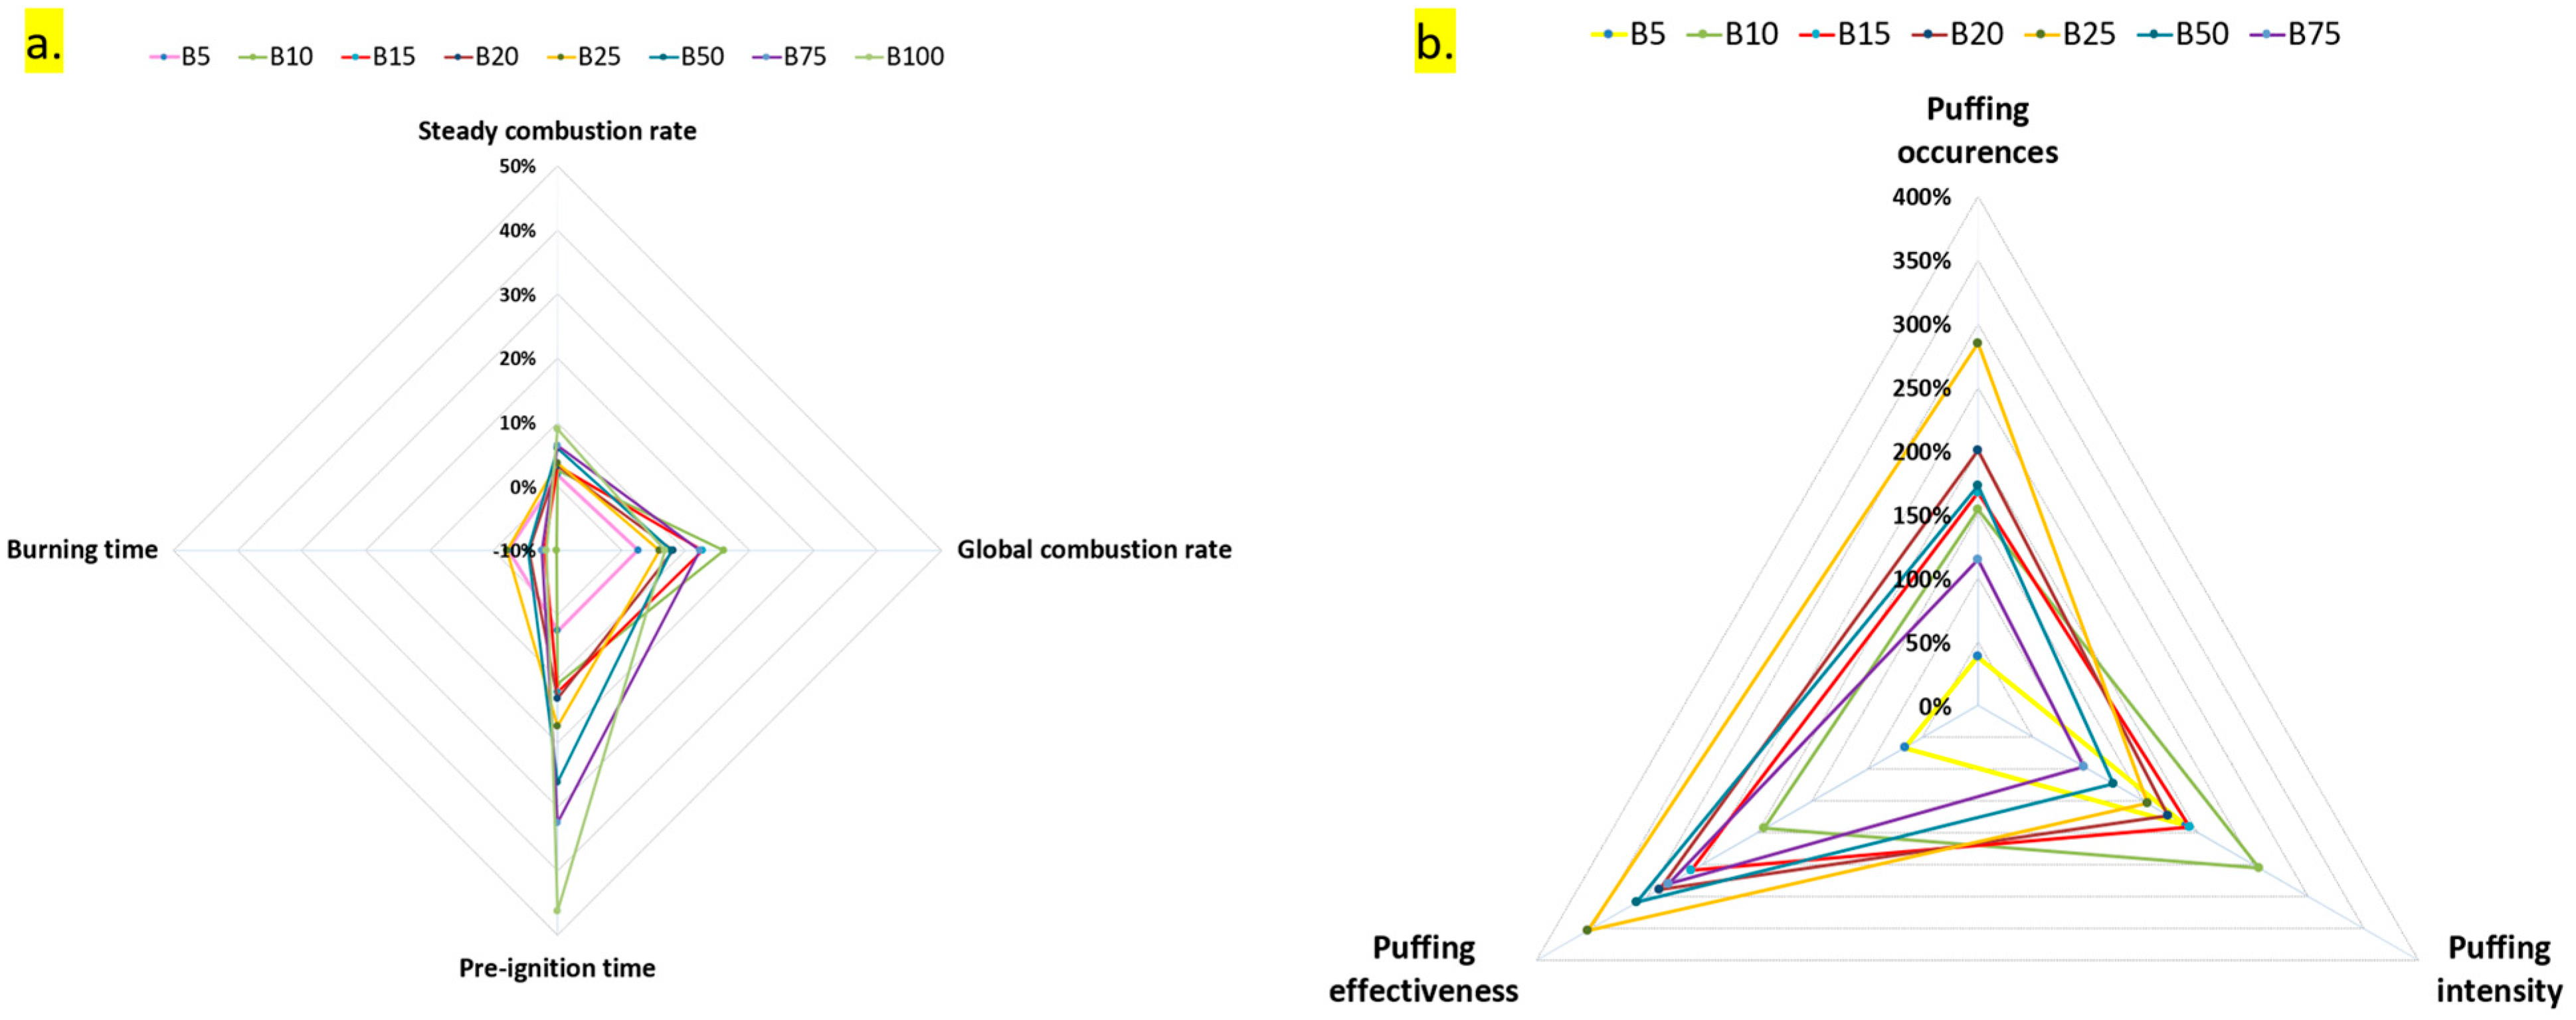
  • Four puffing mechanisms were identified. Mechanisms 1, 3, and 4 were observed in all fuels except B100, while mechanism 2 was exclusive to lower blends (B5–B25). Puffing characteristics, including the number of occurrences, intensity, and effectiveness, exhibited a non-linear trend with increasing biodiesel content. Puffing occurrences peaked at B25 before declining at higher blends (B50 and B75). Puffing intensity was highest at B10 and decreased beyond this concentration. Puffing effectiveness followed a similar trend, peaking at B10 and decreasing up to B25, but with a secondary enhancement at B50 and B75, indicating that puffing dynamics vary with blend composition. A comparison of individual puffing events revealed that high-intensity puffing did not necessarily correlate with increased effectiveness.
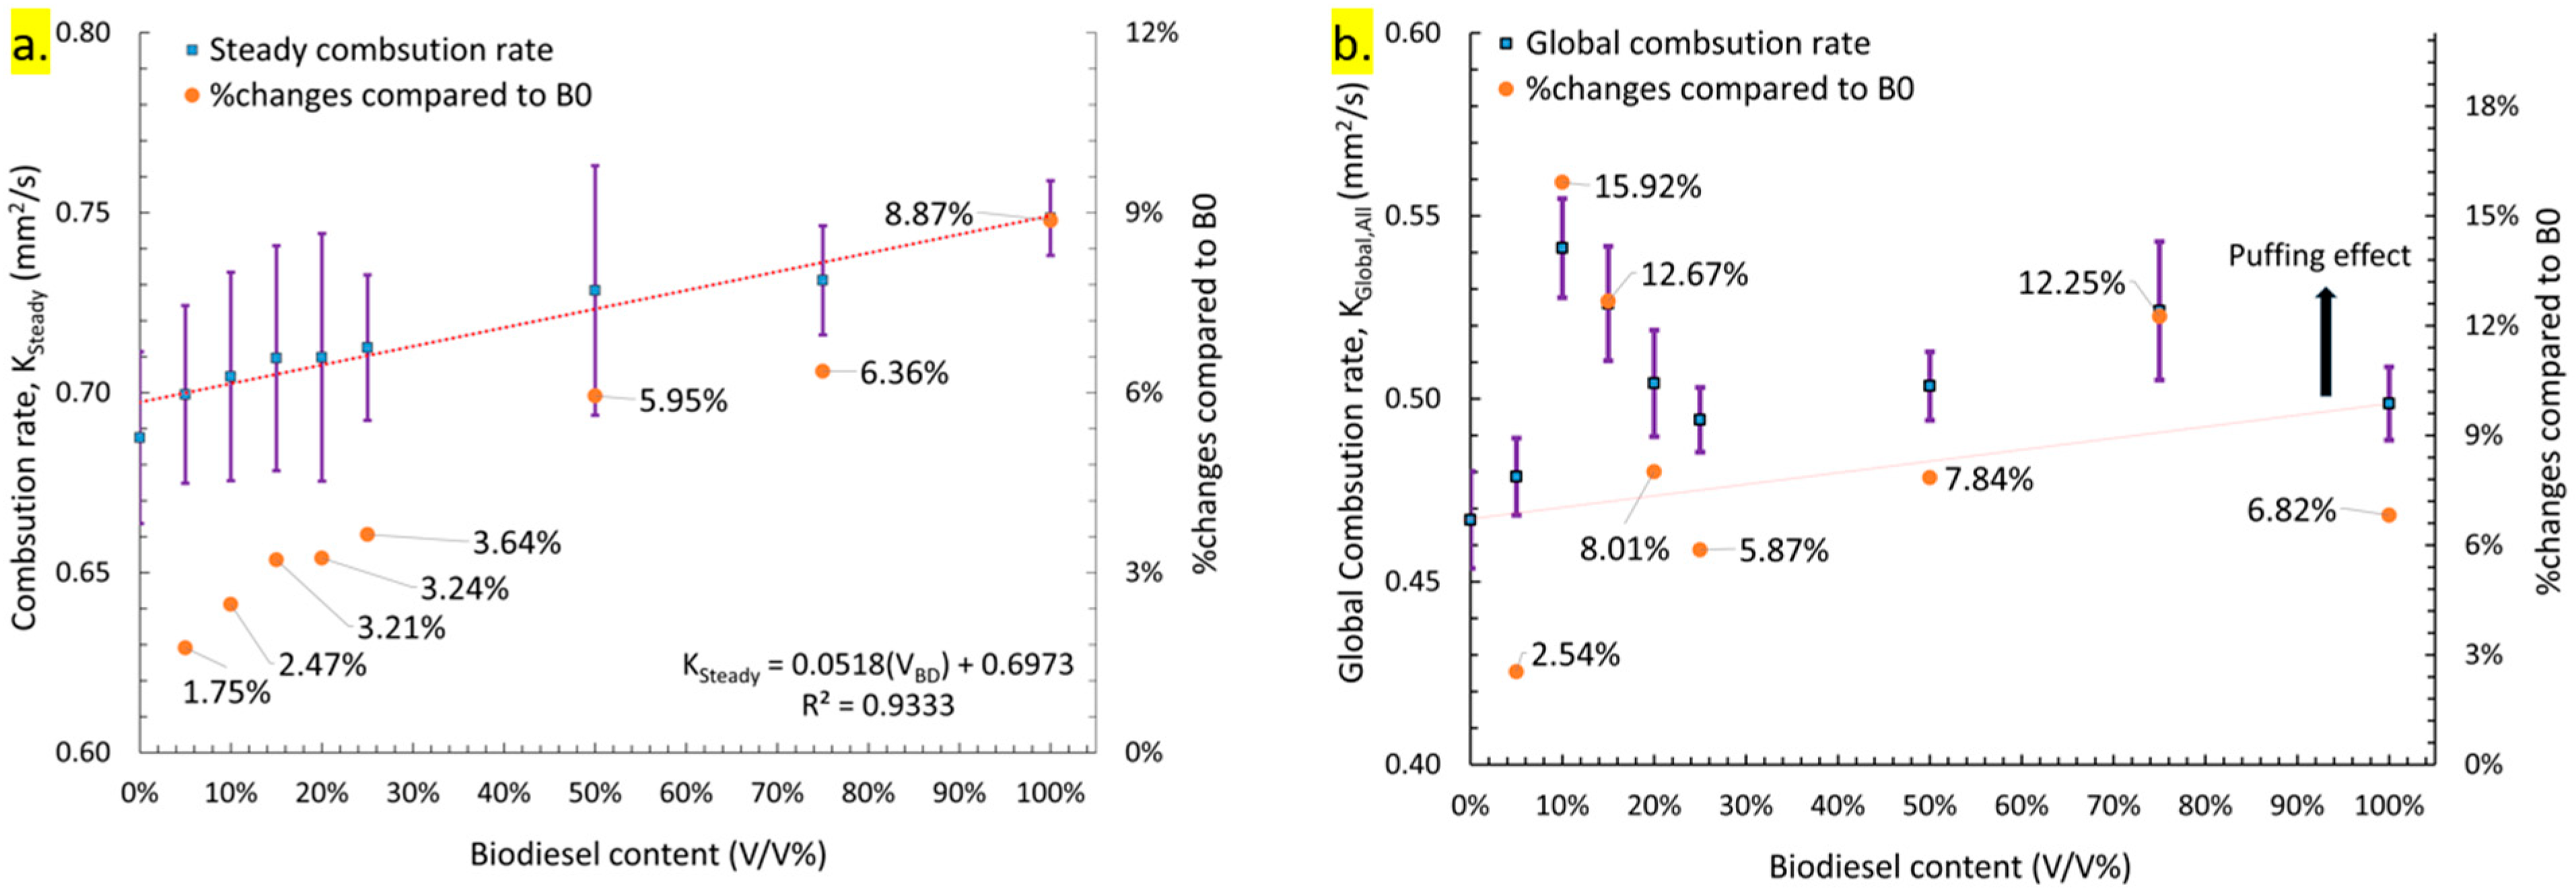
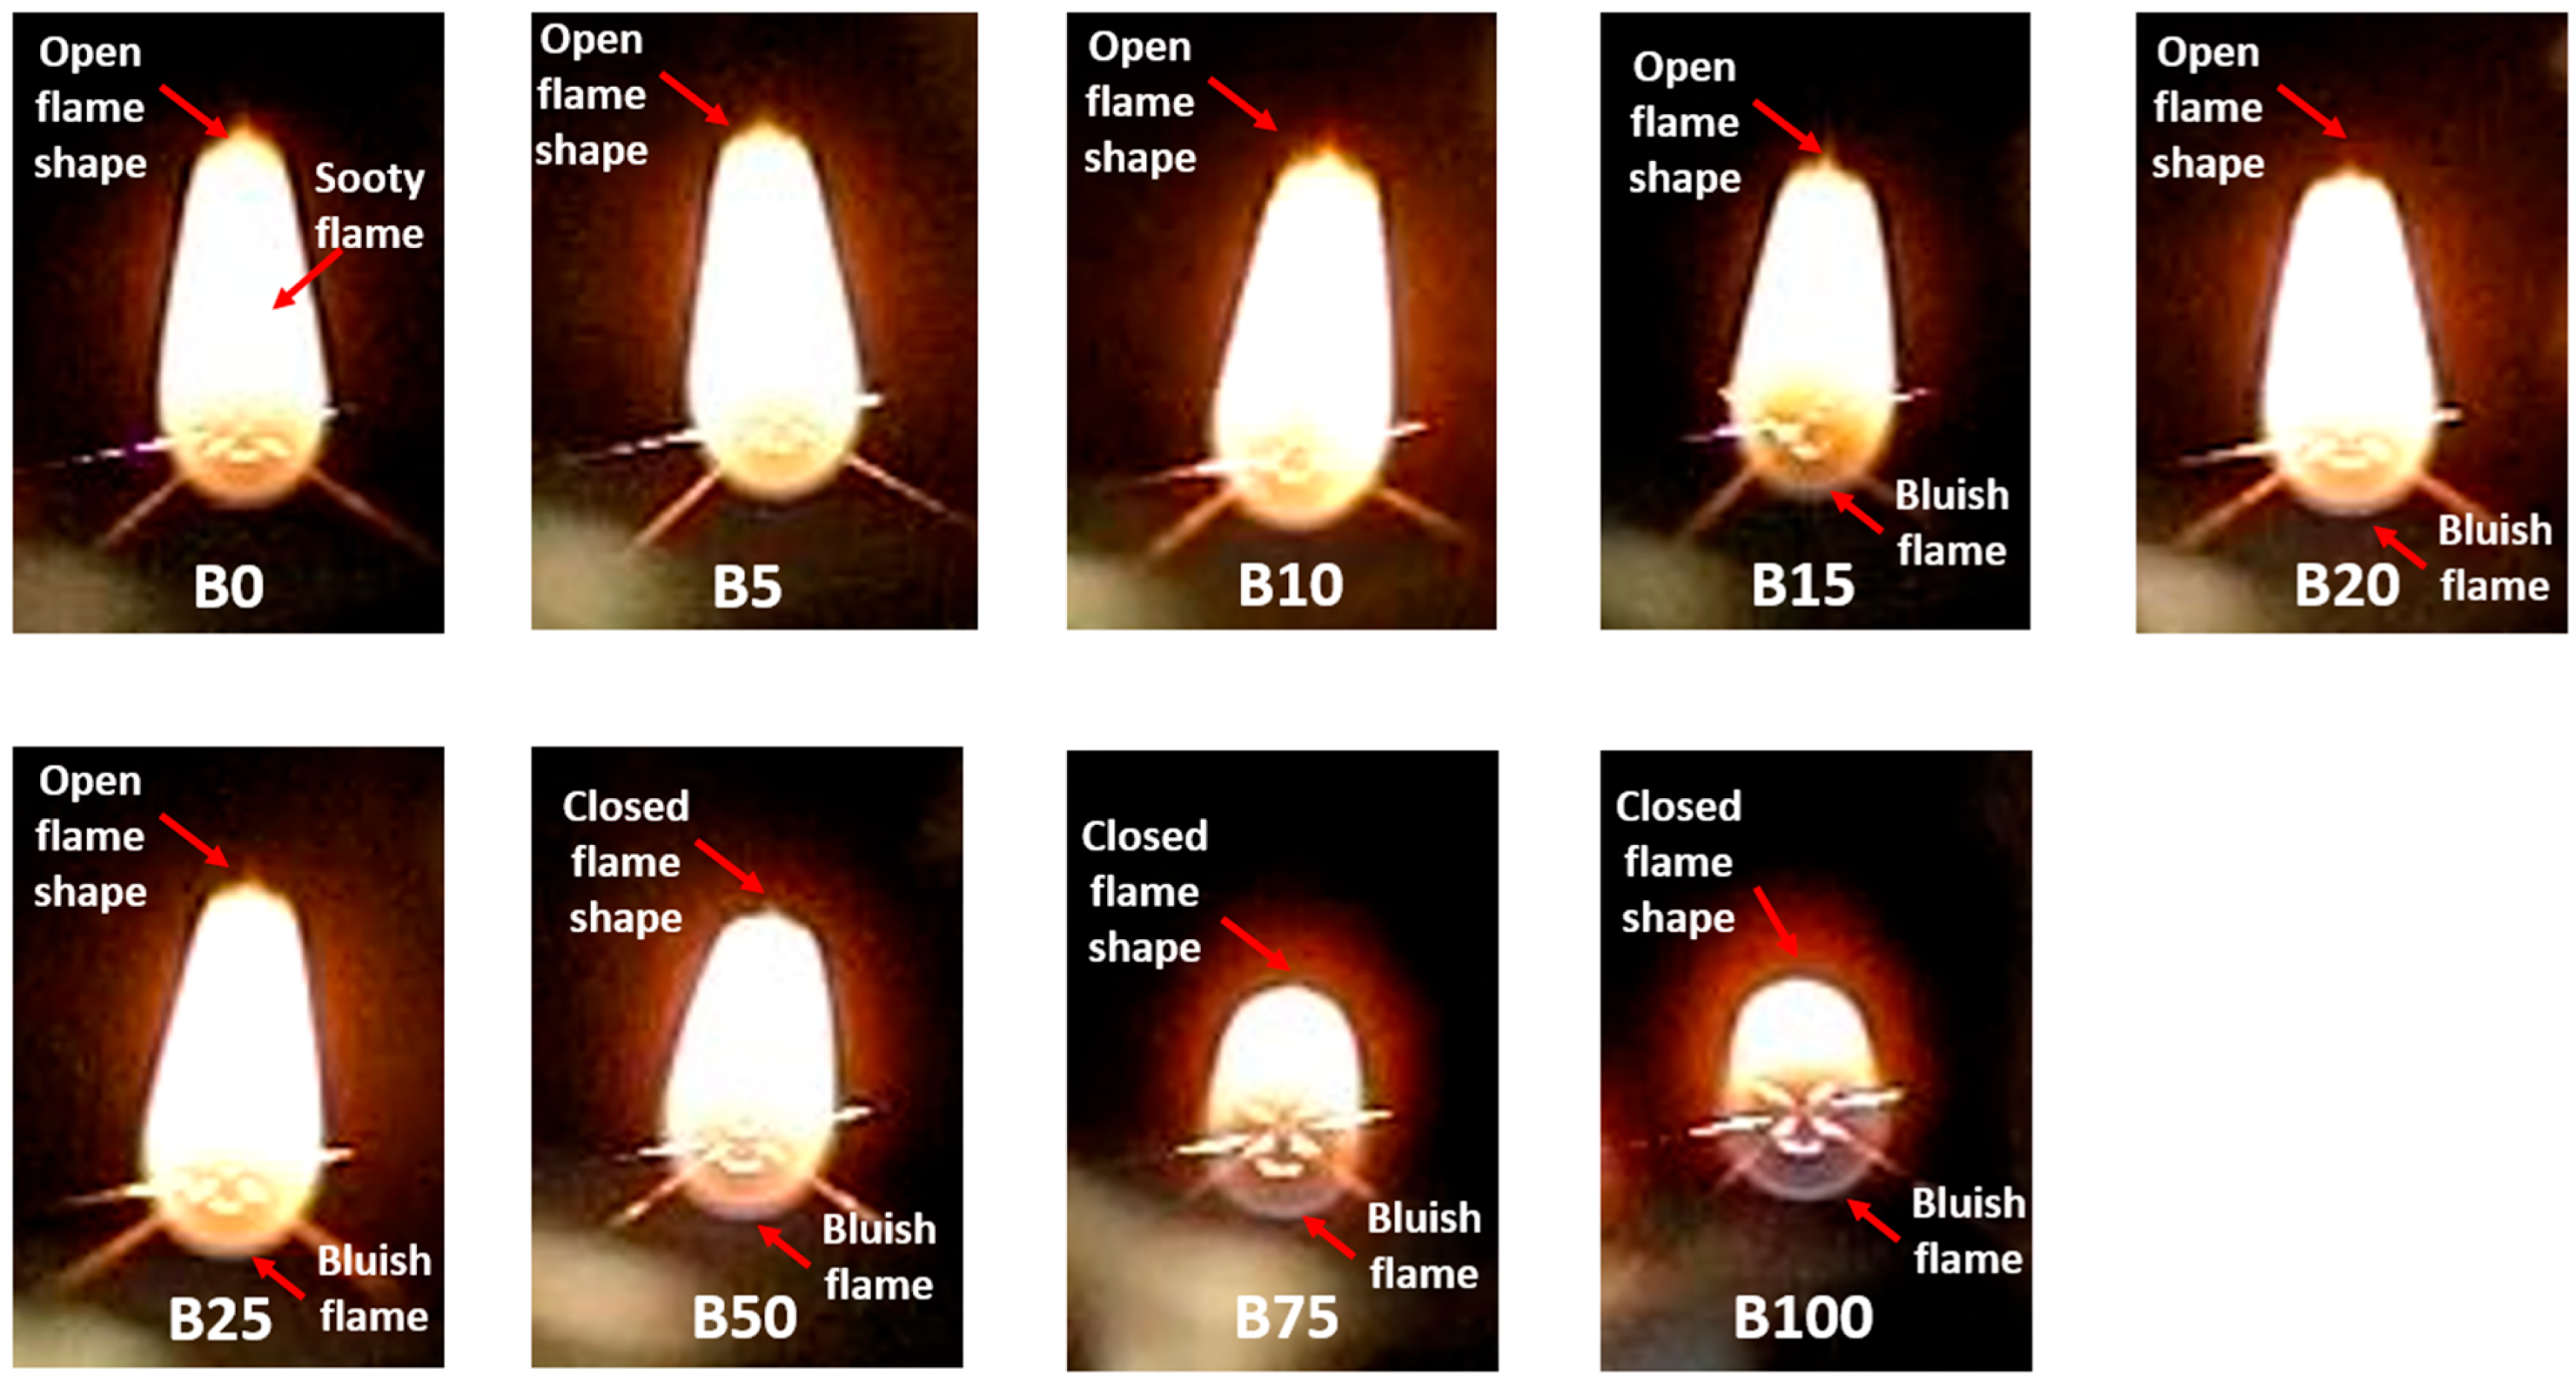
  • The overall impact of droplet dynamics and puffing was quantified based on combustion rate, pre-ignition time, and burning time. Diesel (B0) exhibited the lowest steady combustion rate, while biodiesel (B100) had the highest. The steady combustion rate increased linearly with biodiesel concentration due to the additional oxygen content, which promoted more complete and cleaner combustion, as evident from flame appearance and color.
  • The global combustion rate followed a non-linear trend with increasing biodiesel content. It initially increased, reaching a maximum at B10, then decreased up to B25. However, at B50 and B75, the global combustion rate increased again, suggesting that both high-intensity slow puffing and low-intensity rapid puffing can influence combustion rate. These results indicate that high-biodiesel blends can benefit from puffing, enhancing their viability for commercial applications.
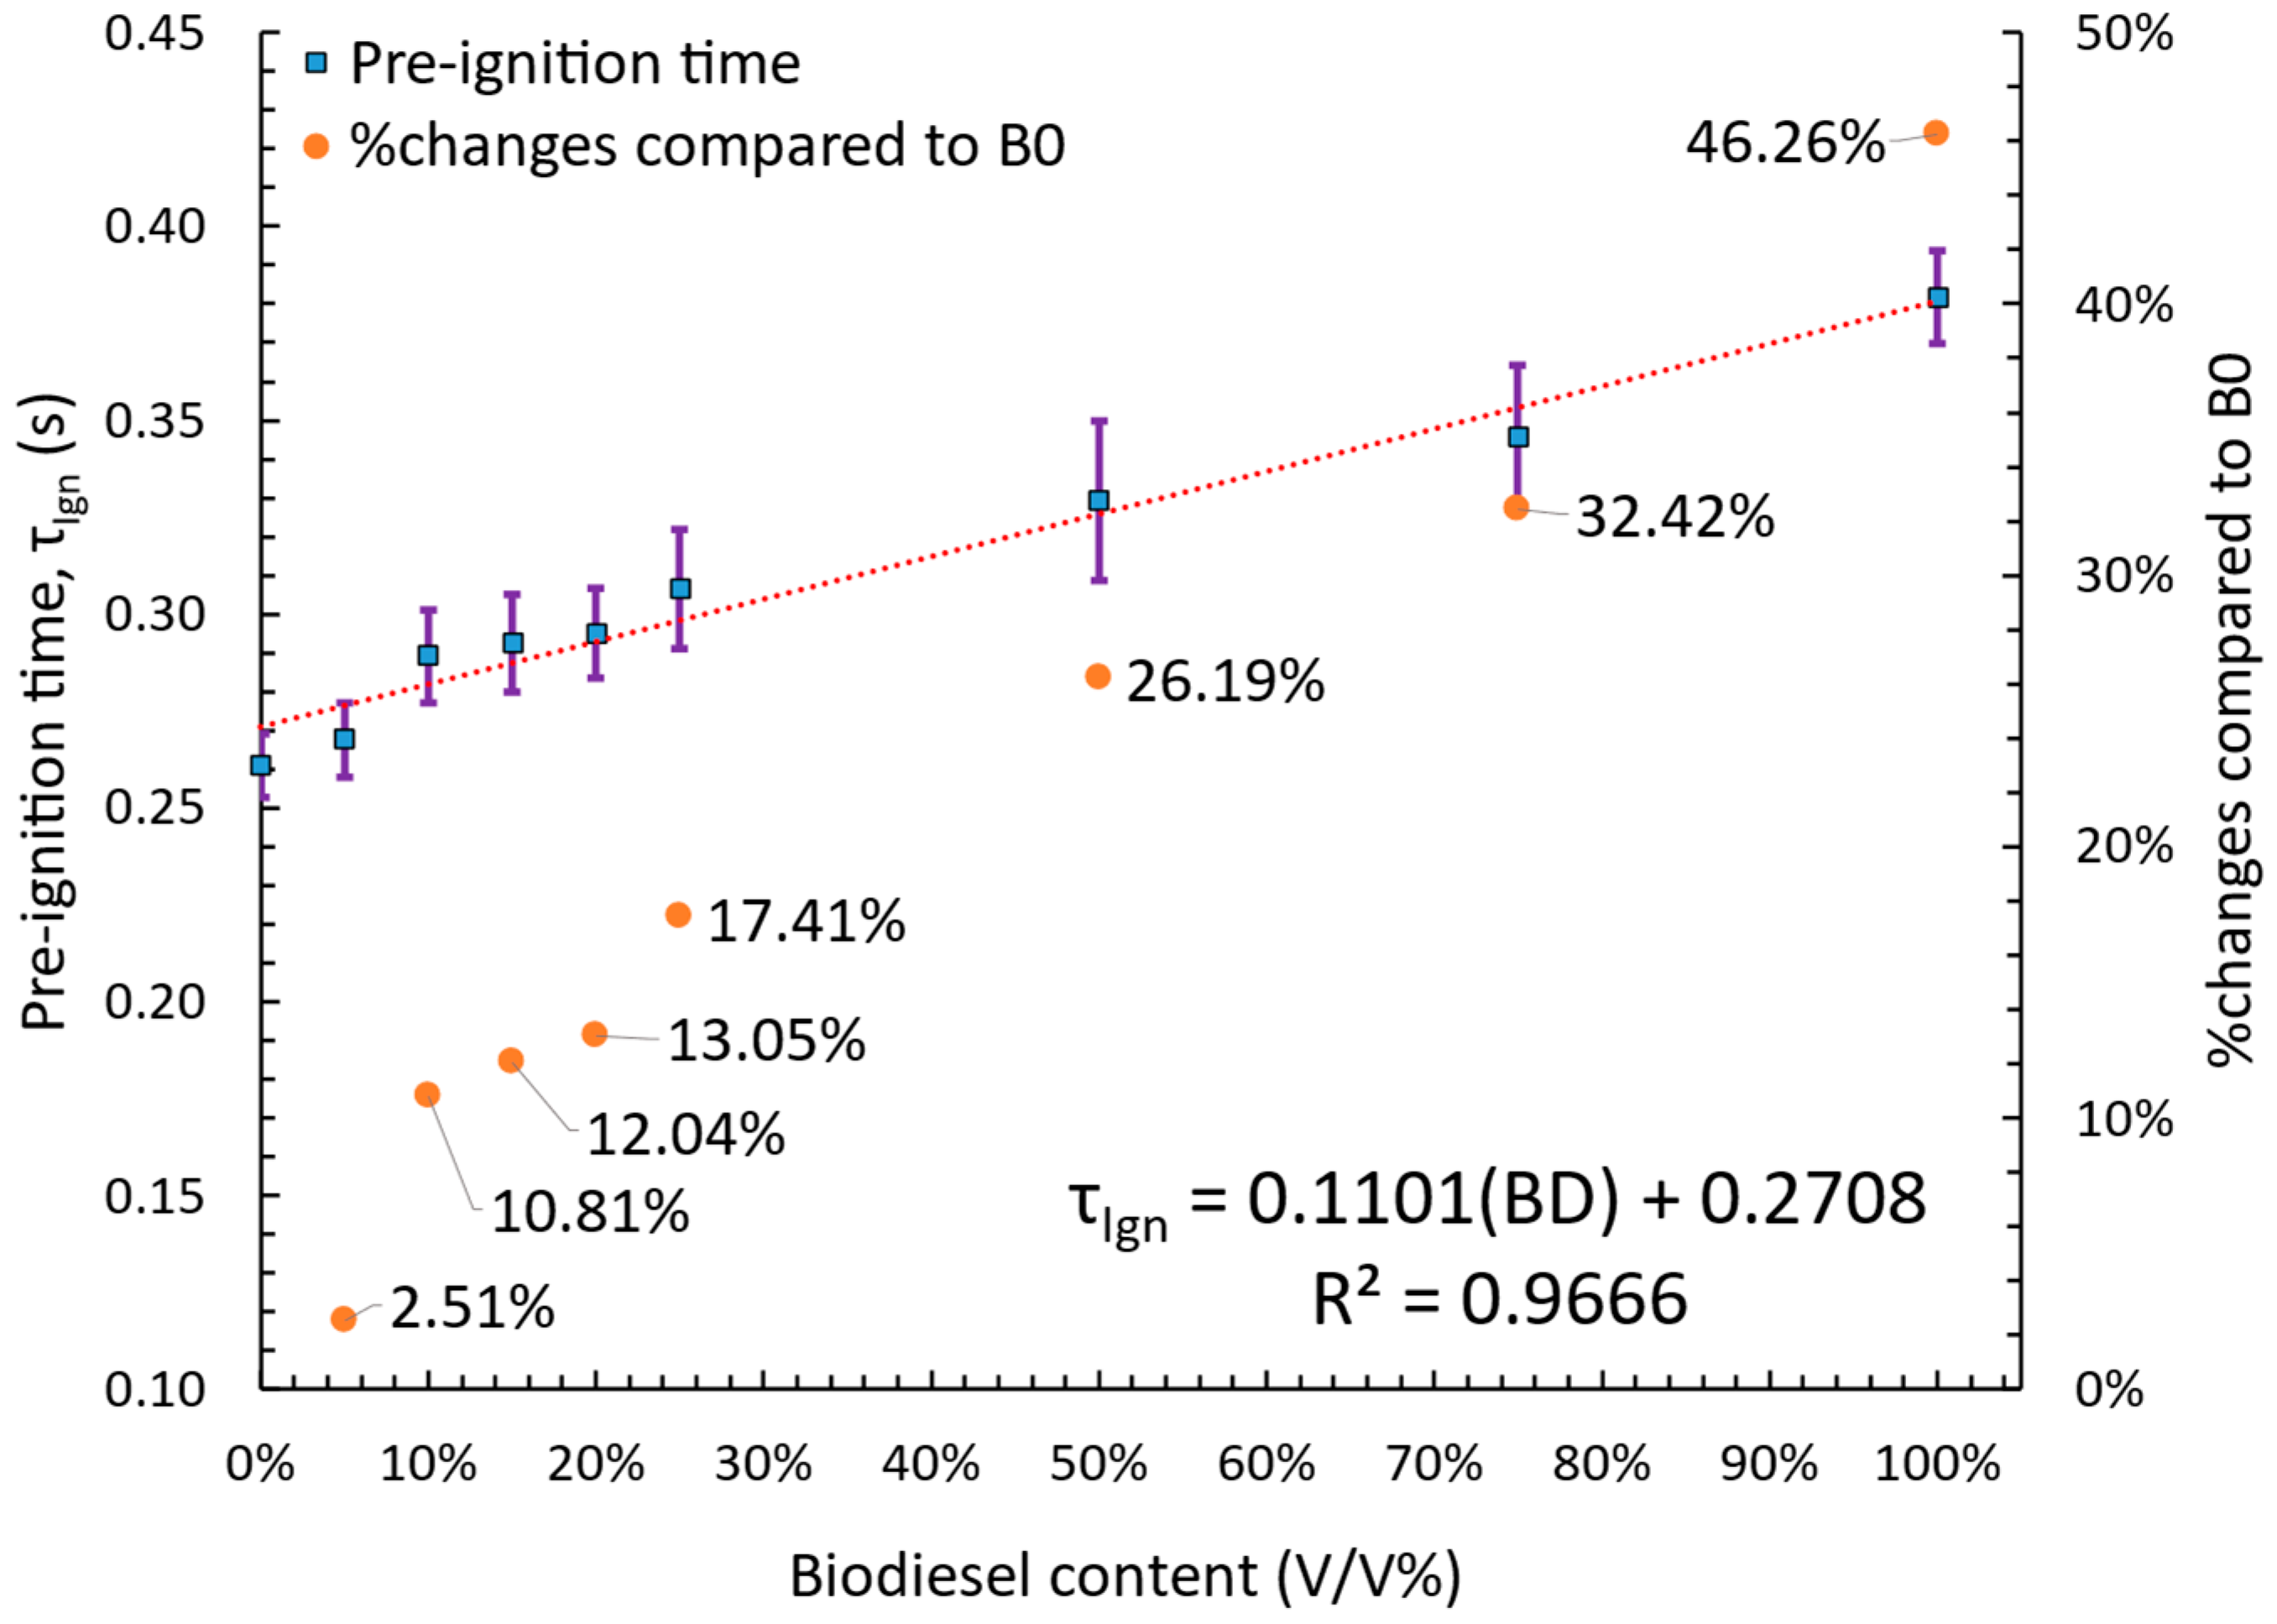
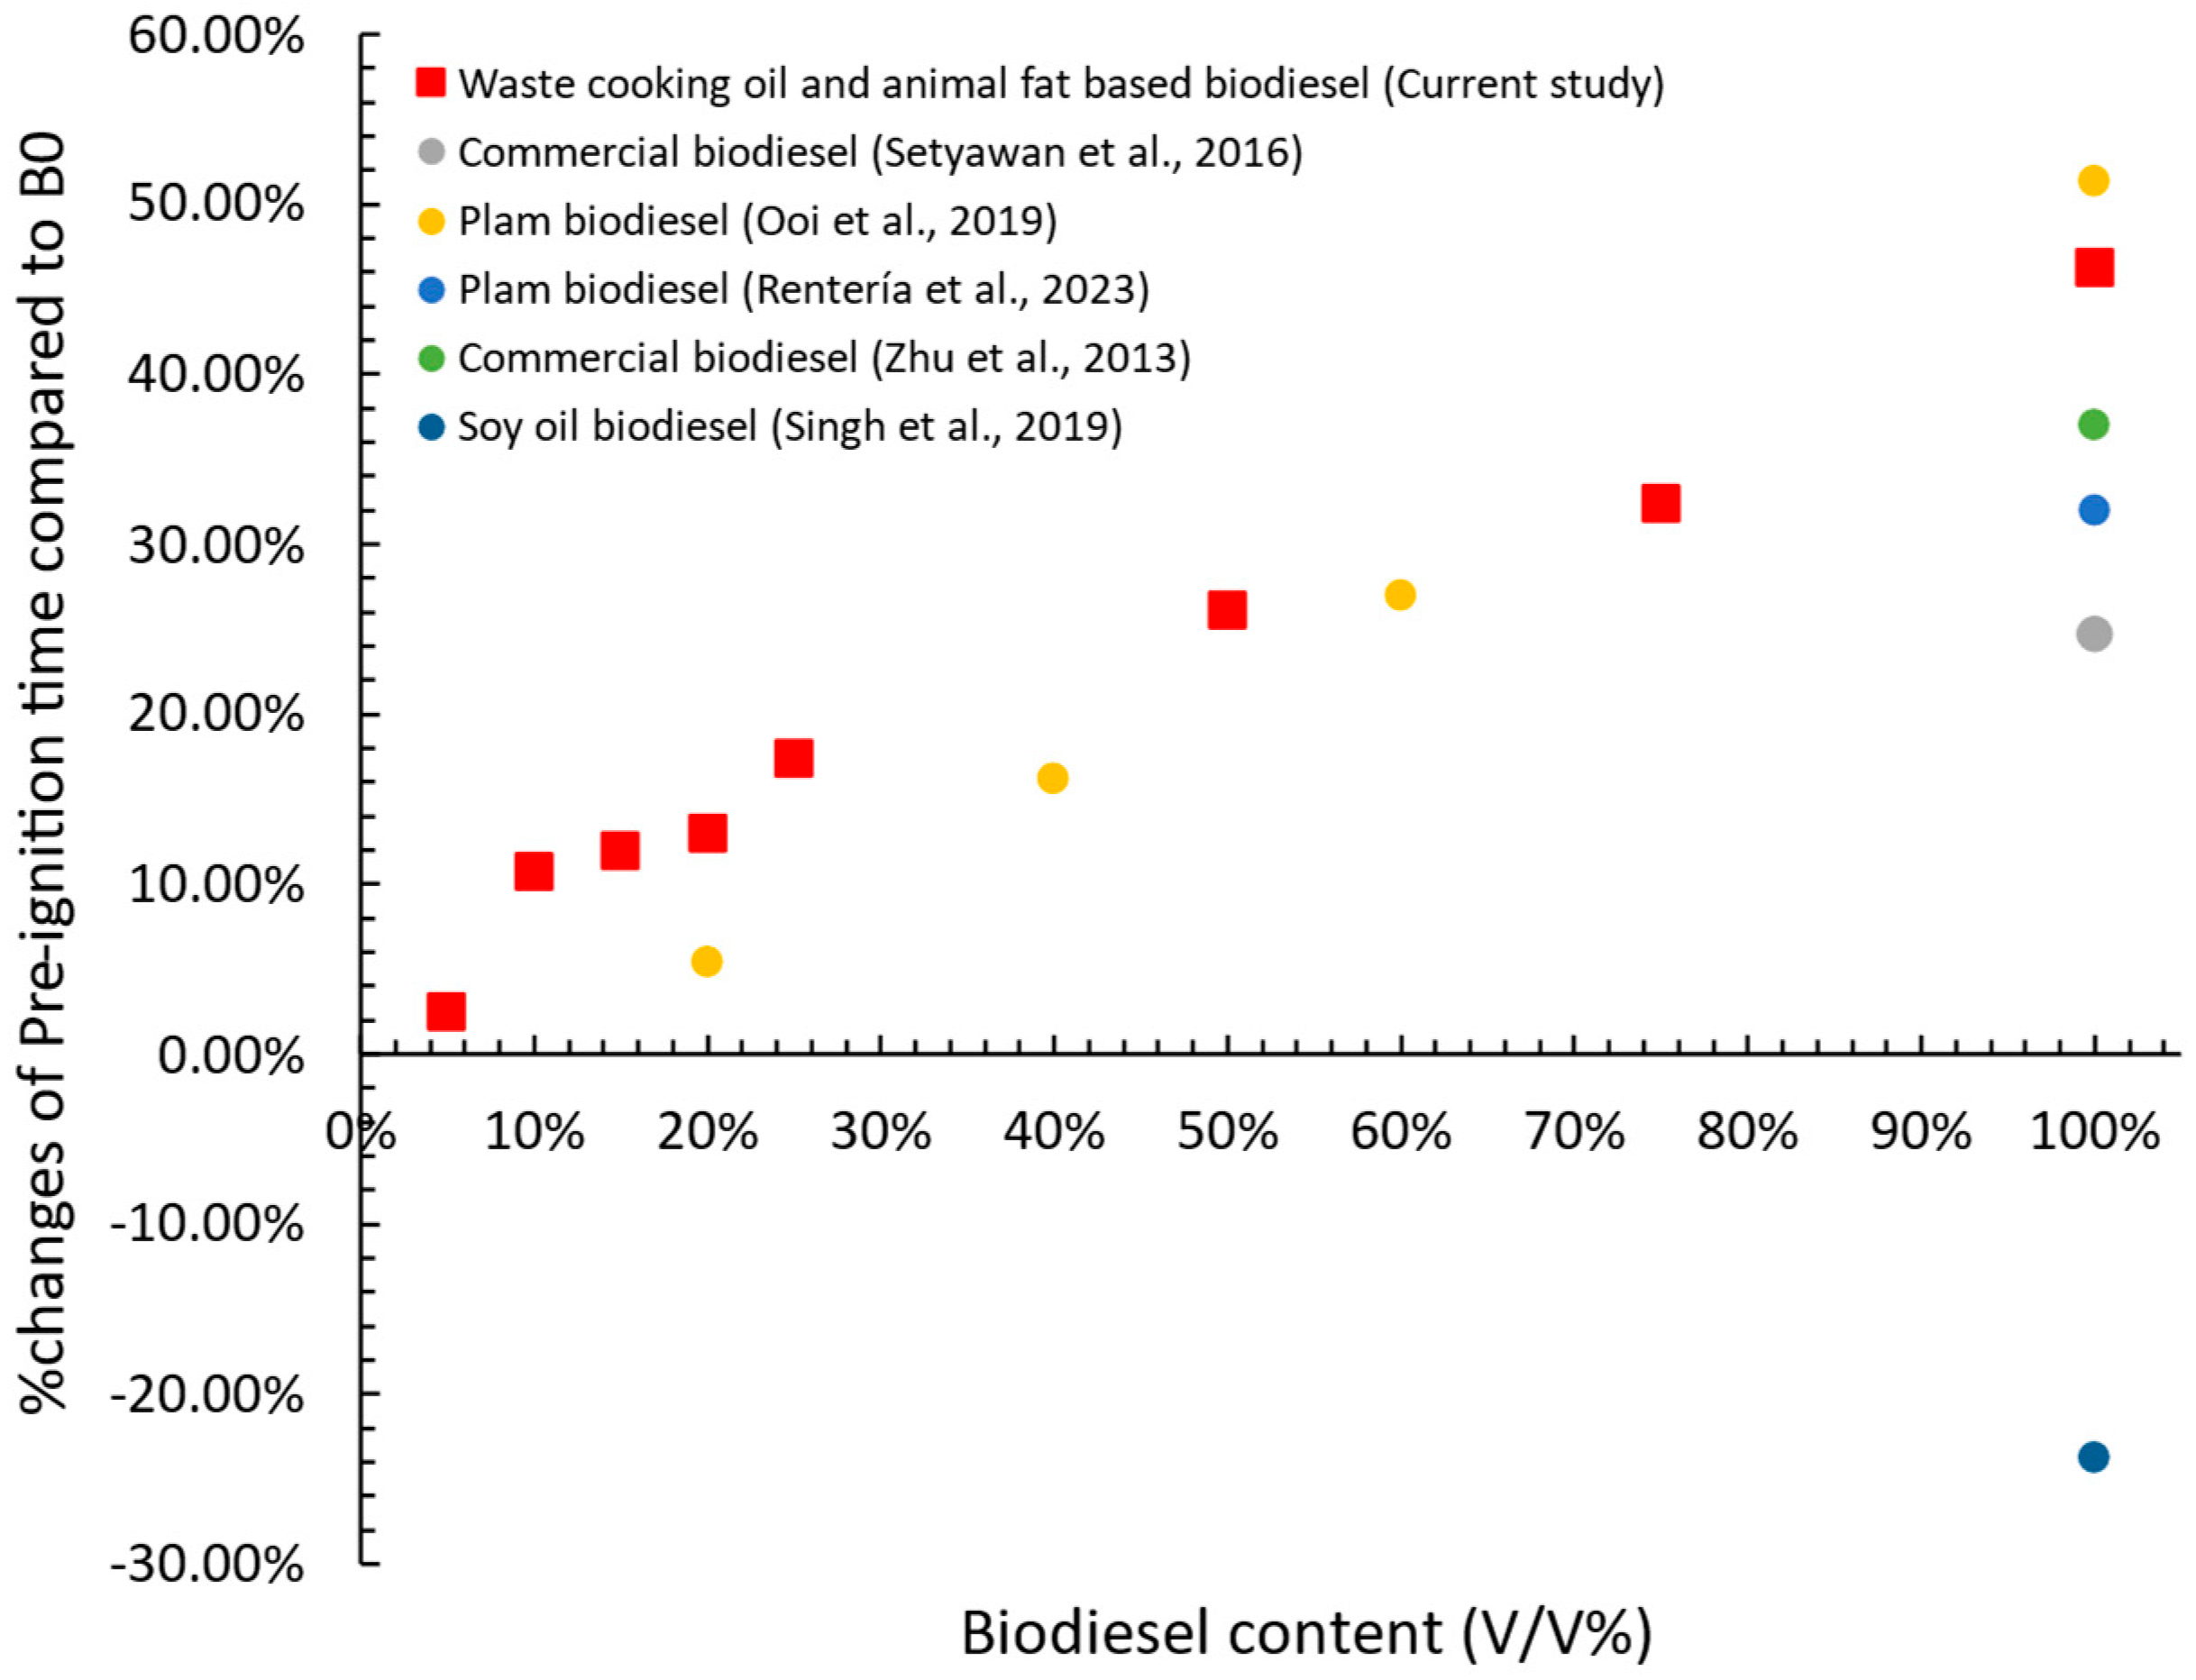
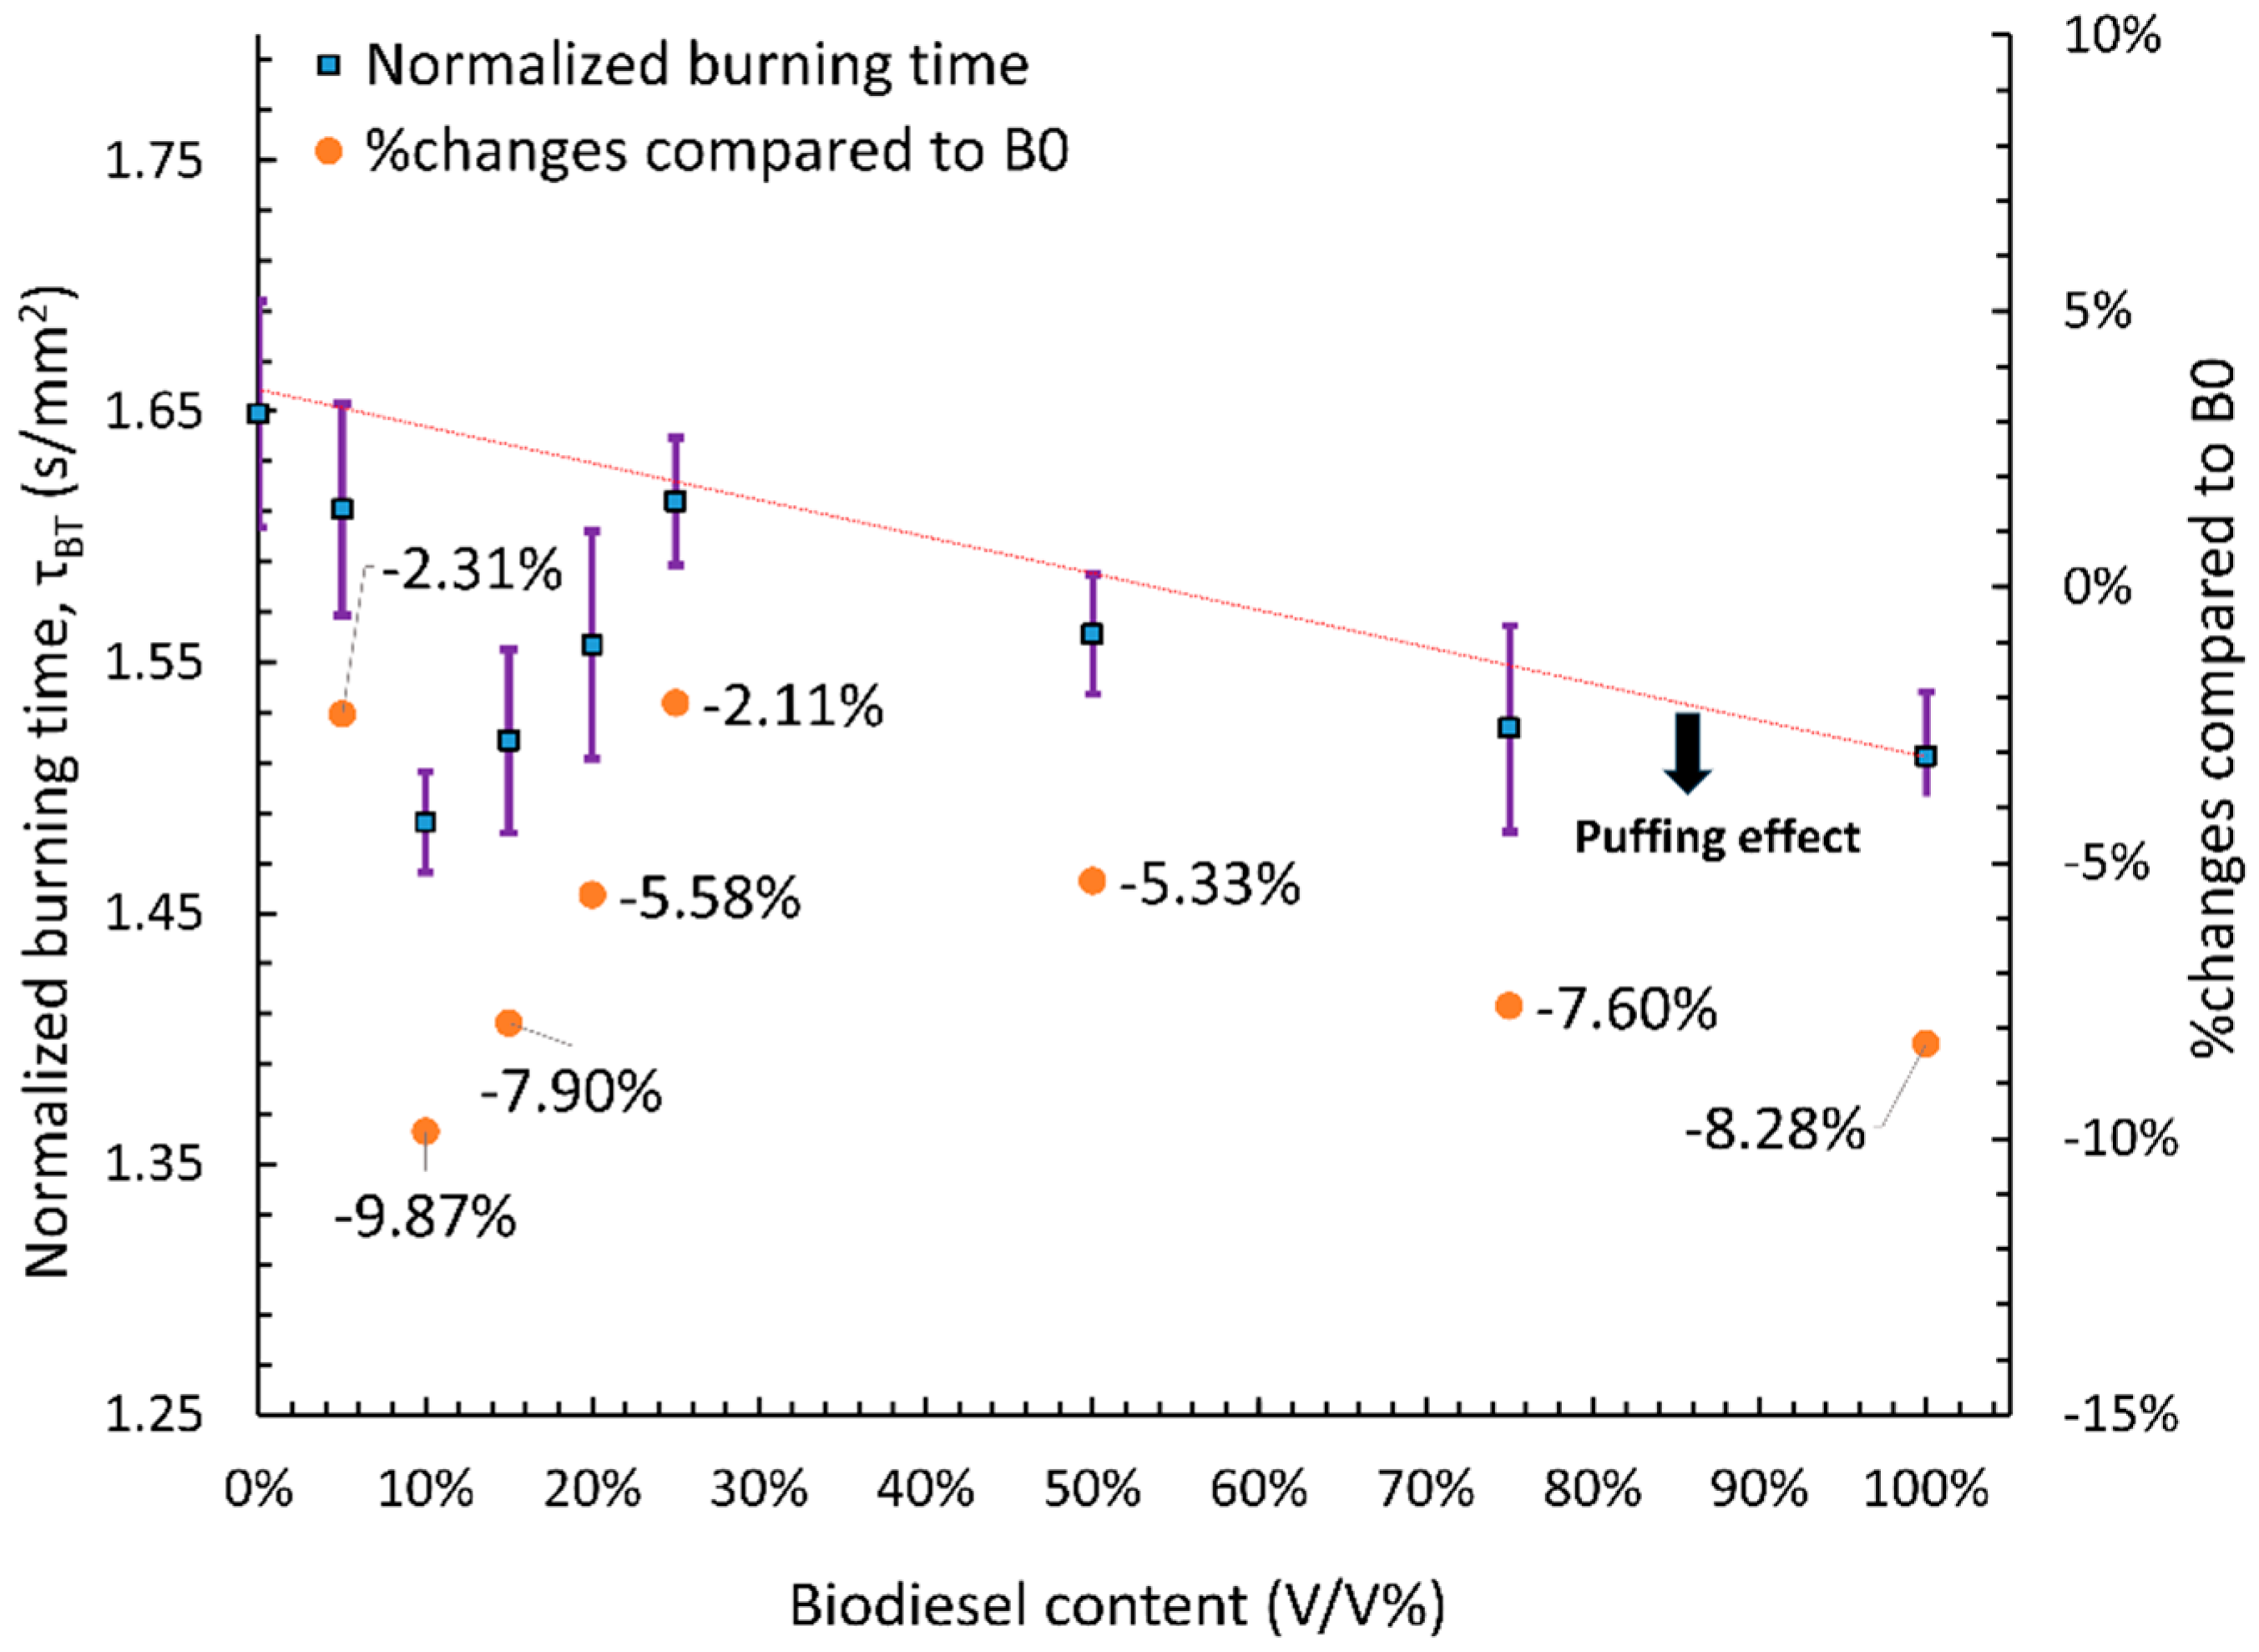
  • Pre-ignition time was primarily influenced by the thermo-physical properties of the fuel, such as boiling point, flash point, and surface tension. A linear increase in pre-ignition time was observed with rising biodiesel content, with the longest delay recorded for B100 and the shortest for B0, while blended fuels exhibited intermediate values. Burning time followed the opposite trend of global combustion rate, with fuels exhibiting higher global combustion rates having shorter burning times.
  • While these findings provide fundamental insights into droplet combustion, real-world systems operate under elevated pressures and temperatures, which can influence evaporation, ignition delay, and combustion efficiency. The results highlight how puffing enhances atomization, improving combustion rates in B10–B25, while B50–B75 benefit from distinct puffing behaviors that counteract atomization challenges. Future studies should explore high-pressure, high-temperature conditions to validate these trends in practical applications.
This study provides new insights into droplet combustion characteristics across a wide range of diesel–biodiesel blends, offering valuable data for optimizing biodiesel formulations. Moderate blends (B10–B25) exhibit peak combustion efficiency due to enhanced puffing, making them ideal for engine applications requiring effective fuel–air mixing. Higher blends (B50–B75) can benefit from optimized injection strategies and spray dynamics, improving their viability in diesel engines, gas turbines, and industrial combustion systems. By quantifying various droplet combustion behaviors, this study supports refinements in fuel injection strategies and combustion chamber design, enhancing energy efficiency and lowering emissions in sustainable fuel applications.

Supplementary Materials

The following supporting information can be downloaded at: https://www.mdpi.com/article/10.3390/en18071692/s1, Figure S1: d 2 -plot and combustion stage definition. References [51,52] are cited in supplementary material.

Author Contributions

A.S.M.S.P.: Conceptualization, methodology, investigation, software, formal analysis, data curation, writing—original draft, writing—review and editing. A.R.: Conceptualization, resources, supervision, project administration, funding acquisition, writing—review and editing. All authors have read and agreed to the published version of the manuscript.

Funding

This research was supported by the Mid-America Transportation Center through a grant from the U.S. Department of Transportation’s University Transportation Centers Program (Grant No. 69A3551747107) and partially funded by the KBIH Foundation. The authors gratefully acknowledge this support and extend their appreciation to Iowa Renewable Energy (IRE), LLC, for generously providing the biodiesel used in this study.

Data Availability Statement

Data will be made available on request.

Conflicts of Interest

The authors declare that they have no known competing financial interests or personal relationships that could have appeared to influence the work reported in this paper.

References

  1. DeCarolis, J.; LaRose, A. Annual Energy Outlook 2023; US Energy Information Administration: Washington, DC, USA, 2023.
  2. 2024 ExxonMobil Global Outlook Executive Summary. Available online: https://corporate.exxonmobil.com/-/media/global/files/global-outlook/2024/global-outlook-executive-summary.pdf (accessed on 21 February 2025).
  3. Suhara, A.; Karyadi Herawan, S.G.; Tirta, A.; Idris, M.; Roslan, M.F.; Putra, N.R.; Hananto, A.L.; Veza, I. Biodiesel sustainability: Review of progress and challenges of biodiesel as sustainable biofuel. Clean Technol. 2024, 6, 886–906. [Google Scholar] [CrossRef]
  4. Kaushik, V.; Swagatika Priyadarshini, L.A.; Kataria, R. Renewable Energy, Alternative Fuels, and Technological Innovations for Sustainable Development. In The Intersection of Global Energy Politics and Climate Change: A Comprehensive Analysis of Energy Markets and Economics; Springer Nature: Singapore, 2025; pp. 321–352. [Google Scholar]
  5. Manikandan, S.; Vickram, S.; Devarajan, Y. Cutting-Edge Technologies: Biofuel Innovations in Marine Propulsion Systems to lower black carbon emissions. Results Eng. 2025, 25, 104095. [Google Scholar] [CrossRef]
  6. Abdulwahab, M.R.; Al-attab, K.A.; Badruddin, I.A.; Bashir, M.N.; Lee, J.S. Biofuels spray and combustion characteristics in a new micro gas turbine combustion chamber design with internal exhaust recycling. Case Stud. Therm. Eng. 2025, 65, 105595. [Google Scholar] [CrossRef]
  7. Ennetta, R.; Soyhan, H.S.; Koyunoğlu, C.; Demir, V.G. Current technologies and future trends for biodiesel production: A review. Arab. J. Sci. Eng. 2022, 47, 15133–15151. [Google Scholar] [CrossRef]
  8. Pranta, M.H.; Cho, H.M. A comprehensive review of the evolution of biodiesel production technologies. Energy Convers. Manag. 2025, 328, 119623. [Google Scholar] [CrossRef]
  9. Yang, P.; Chen, Q.; Xu, W.; Jin, Y.; Sun, Y.; Xu, J. Strategic economic and energy analysis of integrated biodiesel production from waste cooking oil. Energy Convers. Manag. 2025, 325, 119354. [Google Scholar] [CrossRef]
  10. Alternaative Fuels Data Center. Available online: https://afdc.energy.gov/fuels/biodiesel-blends (accessed on 21 February 2025).
  11. Ghazali WN, M.W.; Mamat, R.; Masjuki, H.H.; Najafi, G. Effects of biodiesel from different feedstocks on engine performance and emissions: A review. Renew. Sustain. Energy Rev. 2015, 51, 585–602. [Google Scholar] [CrossRef]
  12. Yaqoob, H.; Teoh, Y.H.; Sher, F.; Farooq, M.U.; Jamil, M.A.; Kausar, Z.; Sabah, N.U.; Shah, M.F.; Rehman, H.Z.U.; Rehman, A.U. Potential of waste cooking oil biodiesel as renewable fuel in combustion engines: A review. Energies 2021, 14, 2565. [Google Scholar] [CrossRef]
  13. Loizides, M.I.; Loizidou, X.I.; Orthodoxou, D.L.; Petsa, D. Circular bioeconomy in action: Collection and recycling of domestic used cooking oil through a social, reverse logistics system. Recycling 2019, 4, 16. [Google Scholar] [CrossRef]
  14. Singh-Ackbarali, D.; Maharaj, R.; Mohamed, N.; Ramjattan-Harry, V. Potential of used frying oil in paving material: Solution to environmental pollution problem. Environ. Sci. Pollut. Res. 2017, 24, 12220–12226. [Google Scholar] [CrossRef]
  15. Xue, J. Combustion characteristics, engine performances and emissions of waste edible oil biodiesel in diesel engine. Renew. Sustain. Energy Rev. 2013, 23, 350–365. [Google Scholar]
  16. Zhang, Y.; Zhong, Y.; Lu, S.; Zhang, Z.; Tan, D. A comprehensive review of the properties, performance, combustion, and emissions of the diesel engine fueled with different generations of biodiesel. Processes 2022, 10, 1178. [Google Scholar] [CrossRef]
  17. Eremeeva, A.M.; Ilyushin, Y.V. Temperature Control During Storage of Raw Materials in the Process of Biodiesel Fuel Production. Inventions 2025, 10, 7. [Google Scholar] [CrossRef]
  18. Esmaeili, H.; Foroutan, R. Optimization of biodiesel production from goat tallow using alkaline catalysts and combining them with diesel. Chem. Chem. Technol. 2018, 12, 120–126. [Google Scholar]
  19. Daryono, E.D.; Jimmy, H.S. Production of Biodiesel Without Catalyst Separation with Palm Oil Interesterification Process Using Essential Oil Biocatalyst. Chemistry 2024, 18, 356–362. [Google Scholar] [CrossRef]
  20. Parveg, A.S.; Ratner, A. A comprehensive review of liquid fuel droplet evaporation and combustion behavior with carbon-based nanoparticles. Prog. Energy Combust. Sci. 2025, 106, 101198. [Google Scholar]
  21. Pham, P.X.; Nguyen, K.T.; Pham, T.V.; Nguyen, V.H. Biodiesels manufactured from different feedstock: From fuel properties to fuel atomization and evaporation. ACS Omega 2020, 5, 20842–20853. [Google Scholar]
  22. Ibadurrohman, I.A.; Hamidi, N.; Yuliati, L. The role of the unsaturation degree on the droplet combustion characteristics of fatty acid methyl ester. Alex. Eng. J. 2022, 61, 2046–2060. [Google Scholar]
  23. Zhou, W.; Wang, Z.; Liang, Y.; Zhang, X.; Yu, L.; Lu, X. The effect of the unsaturation degree on the gas-phase autoignition of methyl oleate and methyl linoleate: Experimental and modeling study. Combust. Flame 2024, 263, 113381. [Google Scholar]
  24. Benjumea, P.; Agudelo, J.R.; Agudelo, A.F. Effect of the degree of unsaturation of biodiesel fuels on engine performance, combustion characteristics, and emissions. Energy Fuels 2011, 25, 77–85. [Google Scholar]
  25. Muelas, Á.; Remacha, P.; Ballester, J. Droplet combustion and sooting characteristics of UCO biodiesel, heating oil and their mixtures under realistic conditions. Combust. Flame 2019, 203, 190–203. [Google Scholar] [CrossRef]
  26. Raghavan, V.; Mehta, P.S. Vaporization characteristics of suspended droplets of biodiesel fuels of Indian origin and their diesel blends–An experimental study. Int. J. Heat Mass Transf. 2015, 88, 28–41. [Google Scholar]
  27. Ooi, J.B.; Yap, J.H.; Tran, M.V.; Leong, J.C.K. Experimental investigation on the droplet burning behavior of diesel–palm biodiesel blends. Energy Fuels 2019, 33, 11804–11811. [Google Scholar] [CrossRef]
  28. Faik, A.M.D.; Zhang, Y. Multicomponent fuel droplet combustion investigation using magnified high speed backlighting and shadowgraph imaging. Fuel 2018, 221, 89–109. [Google Scholar]
  29. Li, T.X.; Zhu, D.L.; Akafuah, N.K.; Saito, K.; Law, C.K. Synthesis, droplet combustion, and sooting characteristics of biodiesel produced from waste vegetable oils. Proc. Combust. Inst. 2011, 33, 2039–2046. [Google Scholar]
  30. Faik, A.M.E.D. Quantitative Investigation of the Multicomponent Fuel Droplet Combustion Using High Speed Imaging and Digital Image Processing. Ph.D. Thesis, University of Sheffield, Sheffield, UK, 2017. [Google Scholar]
  31. Pan, K.L.; Li, J.W.; Chen, C.P.; Wang, C.H. On droplet combustion of biodiesel fuel mixed with diesel/alkanes in microgravity condition. Combust. Flame 2009, 156, 1926–1936. [Google Scholar]
  32. Singh, G.; Esmaeilpour, M.; Ratner, A. The effect of acetylene black on droplet combustion and flame regime of petrodiesel and soy biodiesel. Fuel 2019, 246, 108–116. [Google Scholar]
  33. ASTM D4052; Standard Test Method for Density, Relative Density, and API Gravity of Liquids by Digital Density Meter. ASTM International: West Conshohocken, PA, USA, 2022.
  34. ASTM D1298; Standard Test Method for Density, Relative Density (Specific Gravity), or API Gravity of Crude Petroleum and Liquid Petroleum Products by Hydrometer Method. ASTM International: West Conshohocken, PA, USA, 2022.
  35. ASTM D445; Standard Test Method for Kinematic Viscosity of Transparent and Opaque Liquids (and Calculation of Dynamic Viscosity). ASTM International: West Conshohocken, PA, USA, 2022.
  36. ASTM D7094; Standard Test Method for Flash Point by Modified Continuously Closed Cup (MCCCFP) Tester. ASTM International: West Conshohocken, PA, USA, 2022.
  37. ASTM D93C; Standard Test Methods for Flash Point by Pensky-Martens Closed Cup Tester, Procedure C. ASTM International: West Conshohocken, PA, USA, 2022.
  38. ASTM D240; Standard Test Method for Heat of Combustion of Liquid Hydrocarbon Fuels by Bomb Calorimeter. ASTM International: West Conshohocken, PA, USA, 2022.
  39. ASTM D86; Standard Test Method for Distillation of Petroleum Products and Liquid Fuels at Atmospheric Pressure. ASTM International: West Conshohocken, PA, USA, 2022.
  40. ASTM D1160; Standard Test Method for Distillation of Petroleum Products at Reduced Pressure. ASTM International: West Conshohocken, PA, USA, 2022.
  41. ASTM D524; Standard Test Method for Ramsbottom Carbon Residue of Petroleum Products. ASTM International: West Conshohocken, PA, USA, 2022.
  42. ASTM D4530; Standard Test Method for Determination of Carbon Residue (Micro Method). ASTM International: West Conshohocken, PA, USA, 2022.
  43. ASTM D613; Standard Test Method for Cetane Number of Diesel Fuel Oil. ASTM International: West Conshohocken, PA, USA, 2022.
  44. Parveg, A.S.; Zhou, Y.; Leblanc, R.M.; Ratner, A. Effects of gel-like carbon dots (G-CDs) and surfactant (Span80) on the droplet combustion dynamics of liquid fuels. Fuel 2025, 381, 133385. [Google Scholar]
  45. Wang, J.; Zhang, Q.; Wang, X.; Xu, J. Micro-explosion characteristics and mechanism of multi-component fuel droplet with high volatility differential. Fuel 2023, 333, 126370. [Google Scholar]
  46. Rao, D.C.K.; Karmakar, S.; Basu, S. Atomization characteristics and instabilities in the combustion of multi-component fuel droplets with high volatility differential. Sci. Rep. 2017, 7, 8925. [Google Scholar]
  47. Setyawan, H.Y.; Zhu, M.; Zhang, Z.; Zhang, D. Ignition and combustion characteristics of single droplets of a crude glycerol in comparison with pure glycerol, petroleum diesel, biodiesel and ethanol. Energy 2016, 113, 153–159. [Google Scholar]
  48. Zhu, M.; Ma, Y.; Zhang, D. Effect of a homogeneous combustion catalyst on combustion characteristics of single droplets of diesel and biodiesel. Proc. Combust. Inst. 2013, 34, 1537–1544. [Google Scholar] [CrossRef]
  49. Botero, M.L.; Huang, Y.; Zhu, D.L.; Molina, A.; Law, C.K. Synergistic combustion of droplets of ethanol, diesel and biodiesel mixtures. Fuel 2012, 94, 342–347. [Google Scholar] [CrossRef]
  50. Rentería, J.; Gallego, A.; Gamboa, D.; Cacua, K.; Herrera, B. Effect of amide-functionalized carbon nanotubes as commercial diesel and palm-oil biodiesel additives on the ignition delay: A study on droplet scale. Fuel 2023, 338, 127202. [Google Scholar]
  51. Huang, X.; Wang, J.; Wang, Y.; Qiao, X.; Ju, D.; Sun, C.; Zhang, Q. Experimental study on evaporation and micro-explosion characteristics of biodiesel/n-propanol blended droplet. Energy 2020, 205, 118031. [Google Scholar]
  52. Bennewitz, J.W.; Badakhshan, A.; Talley, D.G. Systematic measurement of hydrocarbon fuel droplet burning rate constants and ignition delays. J. Propuls. Power 2019, 35, 690–703. [Google Scholar]
Figure 1. A schematic representation of the experimental setup for studying the combustion of single, isolated fuel droplets [44]. Reproduced with permission from Parveg et al., Fuel; published by Elsevier, 2025.
Energies 18 01692 g001
Figure 2. Image post-processing and quantitative data extraction steps [44]. Reproduced with permission from Parveg et al., Fuel; published by Elsevier, 2025.
Energies 18 01692 g002
Figure 3. d 2 -plots of neat fuels (B0 and B100) and blended fuels (B5, B10, B15, B20, B25, B50 and B75). Representation of a single experiment.
Energies 18 01692 g003
Figure 4. d 2 -plots of neat fuels: (a) B0, (b) B100. Representation of a single experiment. Morphological evolution of droplet over time: (c) B0, (d) B100.
Energies 18 01692 g004aEnergies 18 01692 g004b
Figure 5. d 2 -plots of (a) B10, (b) B20. Representation of a single experiment. Morphological evolution of droplet over time: (c) B10, (d) B20.
Energies 18 01692 g005aEnergies 18 01692 g005b
Figure 6. d 2 -plots of (a) B25, (b) B75. Representation of a single experiment. Morphological evolution of droplet over time: (c) B25, (d) B75.
Energies 18 01692 g006aEnergies 18 01692 g006b
Figure 7. Combustion rate trends of tested fuels: (a) Steady combustion rate (KSteady), (b) global combustion rate (KGlobal,All).
Energies 18 01692 g007
Figure 8. Representative flame images of different tested fuels.
Energies 18 01692 g008
Figure 9. Comparison of combustion rates between this study and the existing literature [25,27,29,30,31,32,47,48,49].
Energies 18 01692 g009
Figure 10. Pre-ignition time trends of tested fuels.
Energies 18 01692 g010
Figure 11. Comparison of pre-ignition time between this study and the existing literature [27,32,47,48,50].
Energies 18 01692 g011
Figure 12. Normalized burning time trends of tested fuels.
Energies 18 01692 g012
Figure 13. Comparison of burning time between this study and the existing literature [27,32,47,48].
Energies 18 01692 g013
Figure 14. Schematic of puffing mechanism 1.
Energies 18 01692 g014
Figure 15. Schematic of puffing mechanism 2.
Energies 18 01692 g015
Figure 16. Schematic of puffing mechanism 3.
Energies 18 01692 g016
Figure 17. Schematic of puffing mechanism 4.
Energies 18 01692 g017
Figure 18. Definition of number of puffing occurrences (n), puffing intensity (PI) and puffing effectiveness (PE).
Energies 18 01692 g018
Figure 19. (a) Puffing occurrences (n) and percentage change compared to B0 for different biodiesel blends. (b) Puffing intensity (PI) and percentage change compared to B0 for different biodiesel blends.
Energies 18 01692 g019
Figure 20. Puffing intensity as a function of (a) puffing onset time (fraction of droplet lifetime) and (b) normalized droplet diameter for different fuel blends.
Energies 18 01692 g020
Figure 21. Puffing effectiveness (PE) and percentage change compared to B0 for different biodiesel blends.
Energies 18 01692 g021
Figure 22. Relationship between puffing intensity (PI) and puffing effectiveness (PE) for different biodiesel blends.
Energies 18 01692 g022
Figure 23. Comparison of combustion and puffing characteristics for different diesel–biodiesel blends. (a) Radar plot illustrating variations in steady combustion rate, global combustion rate, burning time, and pre-ignition time. (b) Radar plot showing the puffing occurrences, puffing intensity, and puffing effectiveness. Percentages are normalized relative to B0 (pure diesel).
Energies 18 01692 g023
Table 1. Properties of B0 and B100.
PropertiesTest MethodB0Test MethodB100
Density (298.15 K, kg/m3)ASTM D4052 [33]849.56ASTM D1298 [34]879.00
Kinematic viscosity @313.00K (mm2/s)ASTM D445 [35]2.60ASTM D445 [35]4.42
Flash point (K)ASTM D7094 [36]336.48ASTM D93 C [37]393.50
Heating value (MJ/kg)ASTM D240 [38]44.75ASTM D240 [38]40.03
Boiling point (K)ASTM D86 [39]450.15ASTM D1160 [40]603.12
Initial boiling point (K)ASTM D86 [39]450.15ASTM D1160 [40]603.12
Distillation 90 vol.% (°K)ASTM D86 [39]610.15ASTM D1160 [40]626.00
Final boiling point (K)ASTM D86 [39]629.15ASTM D1160 [40]630.17
Boiling point range (K)ASTM D86 [39]450.15–629.15ASTM D1160 [40]603.12–630.17
Carbon residue (% mass)ASTM D524 [41]0.08ASTM D4530 [42]0.01
Cetane numberASTM D613 [43]49.60ASTM D613 [43]56.80
Table 2. Coefficient of variation for combustion rate, pre-ignition time, burning time, and puffing characteristics across repeated experiments for each fuel.
ParameterCoefficient of Variation
B0B5B10B15B20B25B50B75B100
Steady combustion rate (mm2/s)3.47%3.53%4.11%4.41%4.84%2.83%4.76%2.07%1.39%
Global combustion rate (mm2/s)2.84%2.21%2.51%2.97%2.89%1.79%1.86%3.62%2.01%
Pre-ignition time (s)3.14%3.58%4.15%4.28%3.89%5.12%6.25%5.39%3.16%
Normalized burning time (s/mm2)2.73%2.61%1.35%2.41%2.92%1.57%1.53%2.70%1.69%
Puffing occurences 20.09%12.44%8.71%8.44%10.54%9.54%12.97%19.39%
Puffing intensity43.85%10.49%11.37%7.60%18.04%11.02%18.56%26.27%
Puffing effectiveness (mm2/s)8.24%39.81%14.39%18.49%15.07%9.71%11.24%13.38%
Disclaimer/Publisher’s Note: The statements, opinions and data contained in all publications are solely those of the individual author(s) and contributor(s) and not of MDPI and/or the editor(s). MDPI and/or the editor(s) disclaim responsibility for any injury to people or property resulting from any ideas, methods, instructions or products referred to in the content.

