Article

A Precision Monitoring Method and Control Strategy for a Proton Exchange Membrane Fuel Cell in the Power Generation System of the Antarctic Space Physics Observatory

1
Key Laboratory of Cleaner Intelligent Control on Coal & Electricity, Ministry of Education and College of Electrical and Power Engineering, Taiyuan University of Technology, Taiyuan 030024, China
2
Shanxi Energy Internet Research Institute, Taiyuan 030032, China
3
Ocean Research Center of Zhoushan, Zhejiang University, Zhoushan 316021, China
*
Author to whom correspondence should be addressed.
Energies 2025, 18(7), 1693; https://doi.org/10.3390/en18071693
Submission received: 20 February 2025 / Revised: 25 March 2025 / Accepted: 26 March 2025 / Published: 28 March 2025
(This article belongs to the Section B: Energy and Environment)

Abstract

:
Based on the requirement of the Antarctic Space Physics Observatory (ASPO) for a clean energy supply, this study proposes a clean energy generation system incorporating proton exchange membrane fuel cells (PEMFCs) within a “wind–solar–hydrogen-storage-load” framework, which complements inherent wind and solar power generation modes. Addressing the paucity of hydrogen low-temperature coupled-power-supply technology in renewable energy systems, and the insufficient accuracy of data monitoring and system control, electric power output and thermal balance models of PEMFCs are presented, and an analysis of PEMFCs’ operating mechanism was conducted. Simulations of a PEMFC’s internal mechanisms were carried out to address its need for reliable energy supply needs. Furthermore, a real-time monitoring and control strategy is proposed to obtain the operational status of a PEMFC power generation system. The monitored data exhibited high accuracy, with the error between the monitoring parameters and set values being less than 1%, including the voltage, current, electric power, temperature, and speed of the fans. These data are better than the monitoring error of the electrical parameters in Antarctica which is higher than 5%, fulfilling PEMFCs’ requirement for real-time monitoring of their operational parameters, which is necessary for their reliable operation. This precise control lays the foundation for the application of PEMFCs in energy systems at independent Antarctic observatory stations.

1. Introduction

Antarctic scientific research is highly dependent on establishing widely distributed, field-based independent observatories. However, powering these observing systems has become a challenge that must urgently be addressed, especially in the context of the Antarctic Treaty, which actively promotes the efficient use of clean energy. Consequently, there has been an increase in field observation research and the exploration of new sustainable clean energy applications. It is anticipated that by 2025, China will have established dozens of diverse types of field observatories in Antarctica, each responsible for the collection of crucial information such as ecosystem data, specific environmental conditions, atmospheric background information, and geographic mapping data. These data are crucial to China’s climate change response and disaster prevention efforts [1]. However, the current standalone battery-powered supply mode, coupled with the extremely low temperatures in Antarctica, poses significant challenges, including a limited power supply capacity and unreliable battery performance, which can result in the interruption of data transmission once the battery power is exhausted.
Many scholars have deployed wind power generation facilities of different sizes and capacities in various types of independent observatories. However, their spatial volume is limited, and consequently, the number and volume of storage batteries hinder energy storage when there are excess wind and solar resources. To make more efficient use of clean energy, the current preferred solution is to convert excess wind and solar energy into hydrogen for storage and to use hydrogen to generate electricity when there are insufficient wind and solar resources. The strategic importance of hydrogen as a core object of future energy research is evidenced by its capacity for energy storage and conversion, with its energy density being 3.0 times that of oil and 4.5 times that of coal. This renders it a pivotal element in facilitating the transition from traditional fossil fuels to green energy sources [2].
A proton exchange membrane fuel cell (PEMFC) is a device that directly converts the chemical energy of hydrogen and oxygen into electrical energy through an electrochemical reaction. The advantages of PEMFC technology include high energy conversion efficiency, zero emissions, and low noise [3]. PEMFC technology facilitates continuous power generation by only providing hydrogen, thus replacing the traditional and lithium battery power supply methods. The combined application of photovoltaic panels (PVs), lithium batteries, and fuel cells facilitates the provision of a stable and uninterrupted power supply to equipment, even in extreme environments characterized by high or low temperatures or inclement weather conditions, such as cloudy and rainy periods [4].
Tao et al. [5] developed a one-dimensional cold-start physical model to determine the changes in the heat transfer material, charge, and water phase in the cold-start process of PEMFCs, and proposed a simplified nonlinear cold-start model for PEMFCs based on a one-dimensional spatial distribution model. This model illustrated the coupling relationship between cold-start and heat and electricity. Niu et al. [6] used a three-dimensional mechanism model to simulate the cold-start process under constant-power startup and elucidated the evolution of voltage and current density at higher and lower current densities in this mode. The location of water accumulation in the PEMFC was analyzed in constant-power start mode to quantify the influence of different parameters on the cold-start process. Hu et al. [7] developed a comprehensive first-order cold-start mechanism model of a PEMFC and investigated the output performance of the PEMFC under different CL parameters and relative humidities. The results showed that reasonable control of the liquid water and water vapor ratios and an improvement in the CL structure can improve the cell’s performance. Xu, Lei et al. [8] established a semi-empirical model combining measured and fitted values through polarization curves, and they fitted the limiting current density to study the PEMFC mass transfer characteristics. Wu, H.-Y. et al. [9] developed a 10 kW stack model based on a Nafion membrane using a semi-empirical model and experimental data, and investigated the operation of a PEMFC at a higher-than-normal operating temperature and pressure. Wang, J.-F. et al. [10] constructed a dual surrogate function in which the surrogates were reciprocals of each other to solve the problem of the semi-empirical model having many unknown empirical parameters. Li et al. [11] built a distributed deep reinforcement learning-based optimal output voltage controller for a PEMFC and used an integrated gradient algorithm to control the output voltage, finding that this strategy improved the robustness and adaptability of the PEMFC system. In a related study, Kocaarslan et al. [12] designed a DC/DC cascaded boost converter for a PEMFC, with the objective of rapidly stabilizing the output voltage at a set value. This was achieved by integrating a classical proportional–integral controller to regulate the output voltage, thereby demonstrating the synergistic effect of multiple control methods.
Aiming to analyze the main problems faced in a cold start, Mao, L. et al. proposed an analytical model describing the thermal equilibrium, catalytic layer icing, and water transport during the cold-start phase of a fuel cell [13]. Wang Yun et al. established a one-dimensional lumped parameter model of PEMFC temperature and ice formation, and studied the effects of time constants and the Damkohler number on ice accumulation and catalyst activity decline during cold start-up of PEMFC. By studying the three stages of ice formation, accumulation, and melting, and describing the membrane hydration and electrical changes in the process, the parameters of a good cold start-up of PEMFC are obtained [14,15,16]. Li, L.-J. et al. utilized an externally assisted heating method, employing heating wires on the surface layer of the membrane electrodes of a fuel cell, to augment the initial temperature of the fuel cell stack, and to forestall the generation of water icing from precipitating the failure of the cold start [17]. Zhou, Y.-B. et al. proposed a variable-heating and -load control method to regulate the rapid increase in the temperature of a fuel cell stack [18]. Silva, R.-E. et al. applied a controlled short circuit between the electrodes of a fuel cell stack and controlled the metering factor of hydrogen and oxygen to heat the fuel cell stack and achieve a cold start [19]. Yao, G.-F. et al. performed a comparative analysis of cold-start models, concluding that coolant heating of the fuel cell stack is the most effective method [20]. Zheng, J.-S. et al. utilized hydrogen–oxygen catalytic combustion to generate heat for an electric pile, thereby addressing the issue of the prolonged warming of fuel cell stacks during the cold-start process [21]. In terms of monitoring, Calderon, A.J. et al. describe the design, construction, and experimental validation of a novel, scalable, and low-cost multi-channel monitoring system for PEMFC. The system is capable of non-invasive voltage measurement for each single cell in a PEMFC stack and is suitable for stacks ranging from 1 to 120 cells [22]. D. A. McKahn and X. Liu discussed the problem of the temperature observation of a miniature PEMFC under dry conditions. Two different dynamic control models (1 CV and 2 CV) were developed and experimentally verified, and their performance in open-temperature state observation was studied. These models were designed to enable thermal management and serve as optimized control strategies for micro-PEMFCs in low-power applications [23]. Kuan, YD. et al. developed a real-time diagnostic system for fuel cell vehicles based on LabVIEW and myRIO that enables real-time monitoring and control of the performance of fuel cell vehicles by monitoring the voltage, current, power, and other parameters of the fuel cell stack, as well as the state of the battery, motor, and DC–DC converter [24]. Magdalena Dudek et al. investigated the hydrogen demand and operational parameter monitoring of low-temperature fuel cell stacks in UAV applications and performed experiments to analyze the relationship between hydrogen consumption and the electricity generation and purification processes. They designed and tested a monitoring and control system that can manage the electrical parameters, temperature, and humidity of the fuel cell stack, and control the humidification degree of the film through a short-circuit unit [25]. Jeffrey Mishler and Yun Wang used the neutron radiography in situ measurement method to obtain thermal neutron beams sent by a 2.5 cm2 fuel cell through the receiver, and obtained images of the spatial distribution of water and ice in the fuel cell by analyzing the neutron decay. It is found that water and ice are mainly distributed in the cathode side of the fuel cell or MEA [26,27,28]. Zhang, W. analyzed the monitoring results of key FC parameters based on a data acquisition system with ATmega32 as its core, and achieved the monitoring and control of fuel cells through specific hardware (such as industrial computers, sensors, and data acquisition cards) and software design [29].
Many scholars, both domestically and internationally, have explored various approaches to address this issue, including auxiliary heating, catalytic combustion, and starting load control. These studies have revealed that a method employing auxiliary heat is more straightforward and direct than a method that does not, and it has less stringent temperature control requirements while being safer and easier to implement. However, it does necessitate additional energy consumption. The cold-start method of coolant-based heating and catalytic combustion is not suitable for low-power fuel cells and air-cooled PEMFCs. S. Strahl experimented on an open-cathode PEMFC system, combined with an experimental analysis and theoretical research, and designed a local PI temperature control algorithm designed to regulate the temperature to maximize the output voltage [30]. Li proposed an artificial neural network temperature control method [31], and Daniel used a mathematical model to establish a PI temperature controller, with the objective of adjusting the temperature of the fuel cell stack by modifying the cooling water flow [32]. Hu Peng designed a two-dimensional fuzzy temperature controller with an integral link to control PEMFC temperature within the ideal operating range [33]. Yin Liangzhen analyzed the controlling effect of an adaptive inverse controller on fuel cell temperature using a simulation model. The results demonstrated that the adaptive inverse control method can adjust the controller parameters online to achieve real-time tracking of the optimal cell temperature [34]. In another study, Wang, R.-F. et al. increased the thermal insulation layer on the outside of a fuel cell stack while using heat-insulating pipes to reduce heat loss from the stack [35]. Sun, J.-W. et al. employed saturated fatty acids and straight-chain alkanes as organic low-temperature phase-change heat storage materials, utilizing their reverse phase-change exotherm during low-temperature storage to elevate the temperature of a reactor [36]. In another study, Gao, Q.-Y. et al. placed resistance wires on the surface of an electric pile, energizing them to provide heat and thereby achieve PEMFC thermal insulation [37]. Wang Jin et al. carried out mechanism analysis and output control research on a 30 W air-cooled fuel cell established in previous work conducted at an Antarctic independent observation station, and obtained the best working state of a PEMFC [38]. Meanwhile, Wolfram Birk heated cooling water to increase the temperature of an electric pile, thus preventing the water from freezing [39]. The waste heat insulation method can achieve low-temperature storage to a certain extent, but it requires high ambient temperature, insulation materials, and insulation time.
The research on the control of PEMFCs has seen continuous development, with researchers exploring new models, control strategies, and system integration methods to enhance the performance and stability of PEMFCs and promote their application in the field of renewable energy. However, there is a global paucity of research on hydrogen low-temperature coupled-power-supply technology in renewable energy systems, and there are few comparisons of the accuracy of monitoring data and control applications based on the operation mechanism of PEMFCs. The present paper is based on the Space Physics Observatory (SPO). Research analyzing the low-temperature performance of PEMFCs in terms of their actual application scenarios and load demand is scarce, and there is a lack of targeted research on the reliability and stability of PEMFCs based on the obtained model. This paper proposes a 1 kW PEMFC power generation and monitoring system based on the results of a mechanistic study of a PEMFC, which lays the foundation for its stable and reliable operation in the energy system of the Space Physics Observatory (SPO). This system is capable of monitoring the operating status of PEMFCs in real time to determine the energy consumption of observation equipment at the SPO. The second part of this manuscript describes the composition of the Space Physics Observatory and the construction of the energy system, the third section establishes a PEMFC single-cell model and describes the finite element analysis performed in this study, the fourth section provides details of an analysis of the monitoring and control results, and the fifth and final section presents our conclusions.

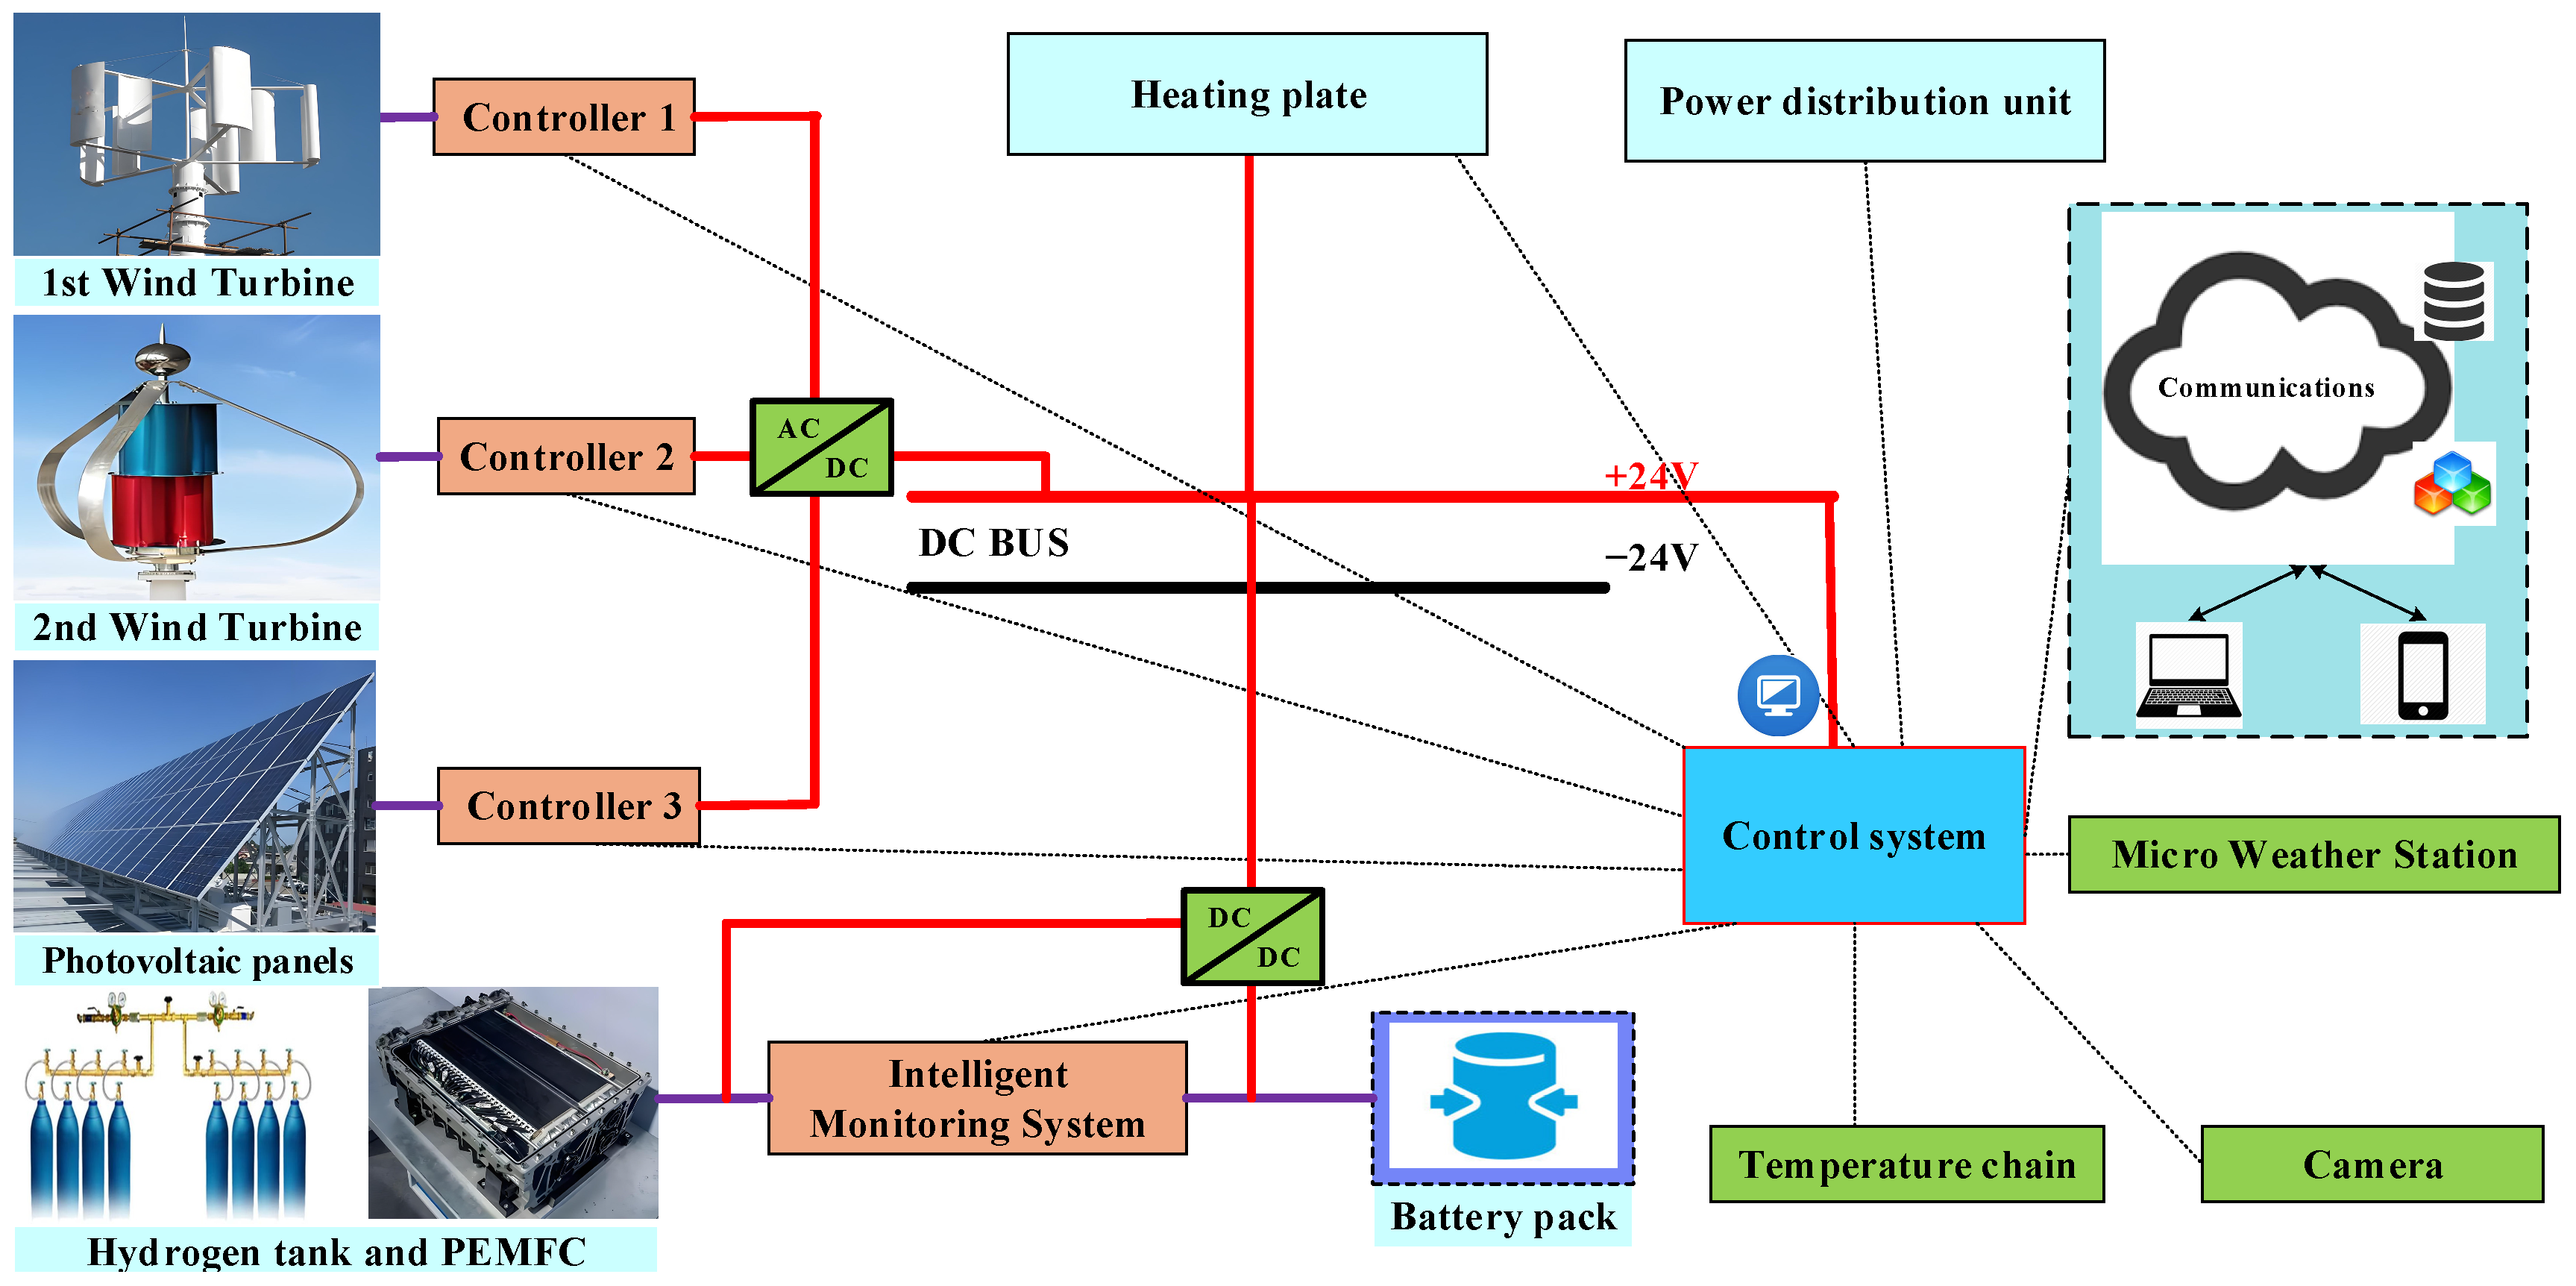
2. SPO Power Generation System

A stable and reliable power generation system is fundamental to support the SPO in the collection of key data on Antarctic space physics. As shown in Figure 1, the SPO mainly comprises a space physics observation cabin; power generation, energy storage, monitoring and acquisition, and control systems; a power conversion and thermal insulation device; and a communication module.
The power generation system includes wind turbines, photovoltaic panels, and hydrogen fuel cells, which collectively provide a reliable source of electrical energy for the monitoring and acquisition system. This system comprises modules such as temperature sensor chains, camera units, and micro-meteorological stations. Hydrogen fuel cells are promptly switched to the power supply line to provide power to the load when the electrical energy generated by the wind and sun is insufficient and the state of charge of the energy storage battery is poor, and they can also charge the energy storage battery. The electrical energy output and energy consumption of this system are shown in Equations (1) and (2).
P total ( t ) = P PEM + P wind ( t ) + P PV ( t ) + P charge ( t )
W total ( t ) = W sen + W heat ( t ) + W control ( t ) + W power ( t )
where Ptotal, PPEM, Pwind, PPV, and Pcharge represent the real-time total power supply of the system, the fuel cell power supply, the total power supply of the wind turbine, the total power supply of the photovoltaic panel, and the energy storage power of the battery, respectively.
During the mission to install the SPO during China’s 40th Antarctic expedition, considering the relatively abundant wind energy resources at the installation site, two wind turbines, namely Fan 1 and Fan 2, were installed, enabling effective power generation during both polar day and polar night. Based on the monitoring parameters and indicators required by the SPO, the overall energy consumption of the required sensors and control system was assessed and calculated. For details on the power distribution and energy consumption requirements, refer to Table 1. Among them, considering the use of hydrogen fuel cells alone to supply power to the entire load during some periods, an air-cooled PEMFC stack with a rated power of 1 kW was selected.

3. PEMFC Power Generation System

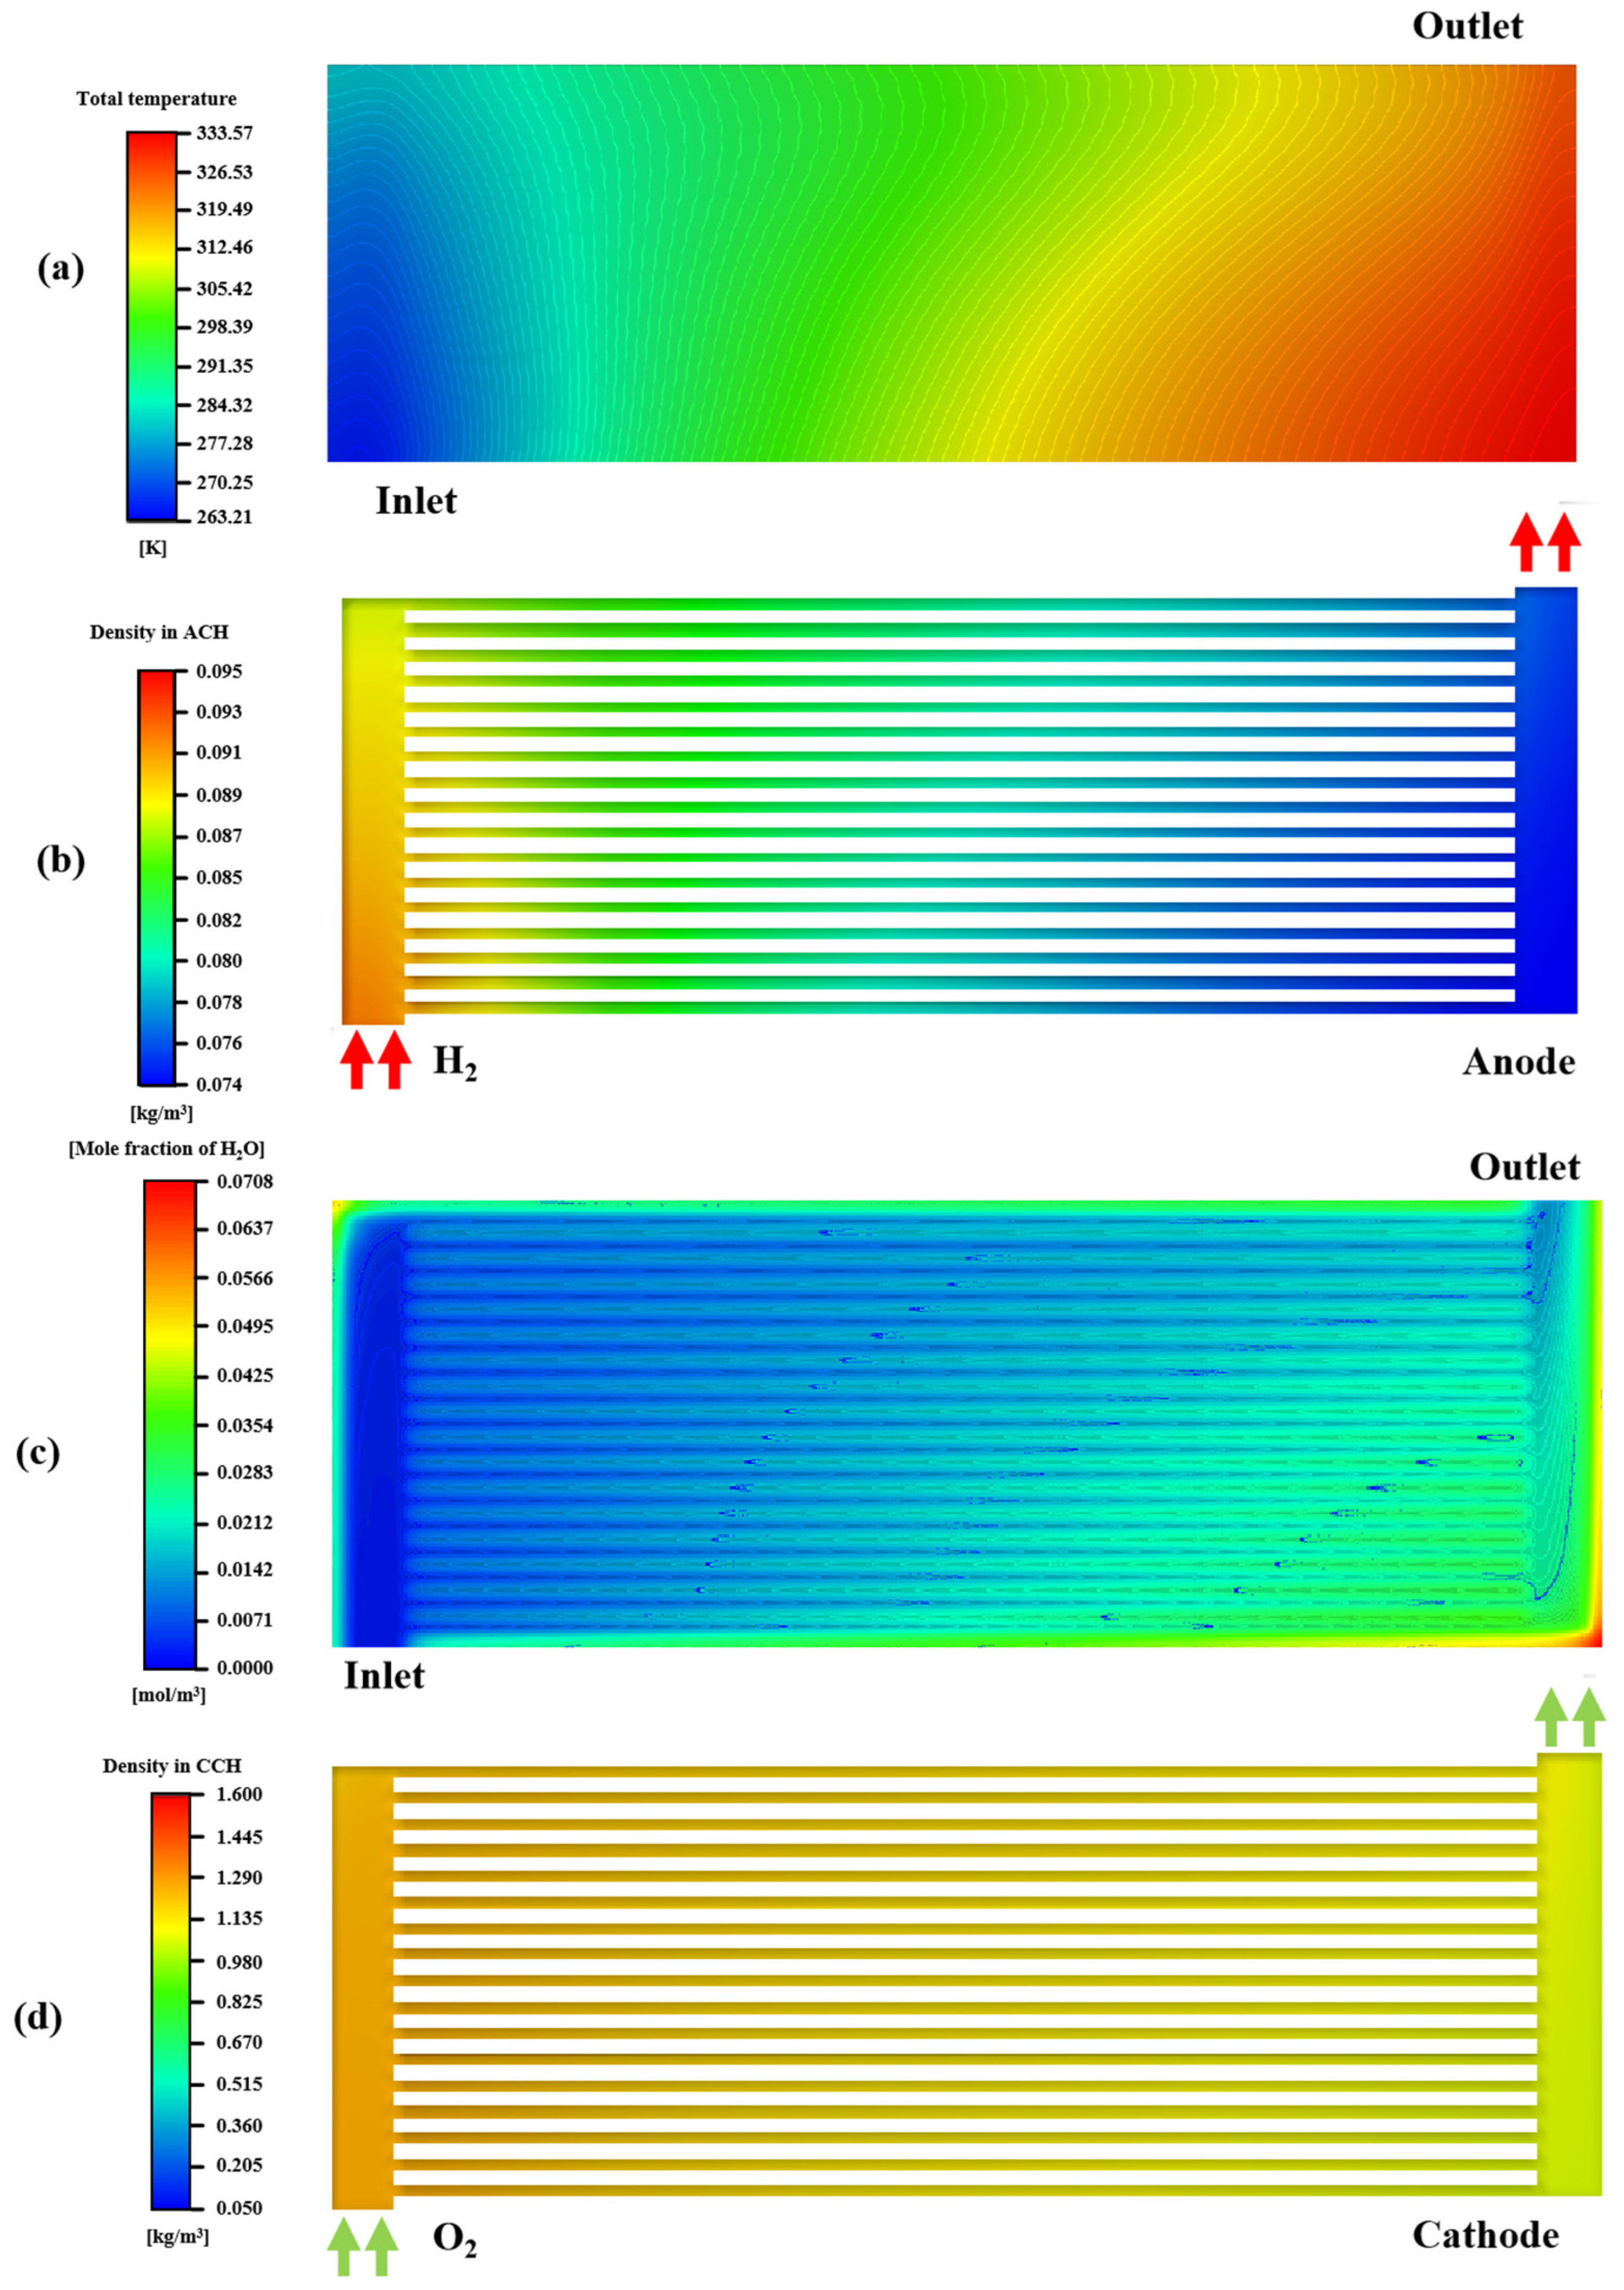
3.1. PEMFC Operation Mechanism

The PEMFC utilizes a proton exchange membrane as the divider between the anode and cathode. Under the catalytic action of the electrodes, hydrogen gas on the anode side is oxidized to form hydrogen ions. These protons pass through the proton exchange membrane and combine with oxygen on the cathode side to form water. Concurrently, the electrons lost at the anode travel through an external circuit to the cathode side, enabling the single fuel cell to generate electrical energy (see Equations (3) and (4)). Figure 2 illustrates a schematic diagram showing a single-cell PEMFC structure. In this diagram, ACH and CCH represent the anode and cathode flow channels of the cell, respectively; MEA denotes the membrane electrode assembly of the cell, which includes the proton exchange membrane used for the transport of protons; and ABP, CBP, AGDL, and CGDL are, respectively, the anode plate, cathode plate, anode diffusion layer, and cathode diffusion layer of the fuel cell. The gas at the inlet of the flow channel is catalyzed by the catalyst, and the separated hydrogen ions are transmitted to the cathode through the MEA, but the lost electrons reach the cathode through the external circuit to form a circuit for the external load. The MEA includes a membrane (MEM), an anode catalytic layer (ACL), and a cathode catalytic layer (CCL).
H 2 2 e 2 H + 1 2 O 2 + 2 e O 2 H 2 + 1 2 O 2 H 2 O I = 2 n e / F Δ t
Δ G = Δ H T Δ S = [ h H 2 O ( l ) ( h H 2 + 1 2 h O 2 ) ] T [ s H 2 O ( l ) ( s H 2 + 1 2 s O 2 ) ]
where n is the molar amount of hydrogen; F (C/mol) is Faraday’s constant; I (A/cm2) is the current density; ΔG (J/mol) is the change in Gibbs free energy between the product and the reactant, and ΔS (J/mol/K) is the change in entropy; T is the temperature of the PEMFC; hH2, hO2, and hH2O are the enthalpy (J/mol) of the formation of hydrogen, oxygen, and water in a standard state, respectively; and sH2, sH2, and sH2O are the formation entropy (J/mol) of hydrogen, oxygen, and water in standard states, respectively.
The parameters of a single cell are shown in Table 2.
When fuel cells serve as power generation units for electrical energy output, it is necessary to seal the gas inlet and outlet passages of the anode and cathode with a membrane. To achieve high-power electrical energy output, multiple single cells must be stacked and compressed to form a fuel cell stack. The output process of a PEMFC incurs irreversible voltage losses, which include activation losses due to the conversion of chemical energy into electrical energy overcoming energy barriers; ohmic losses due to protons overcoming the electroosmotic process during transport through the membrane electrode; and concentration losses due to the gradient difference in the gas concentration from the cell inlet to the membrane electrode at both electrodes. The output voltage can thus be represented as the sum of the reversible and irreversible voltages, with the irreversible voltage being negative. The electrochemical processes and the equations for output electrical energy are shown in Equations (5)–(10).
V sin ( t ) = E ner + E act ( t ) + E ASR ( t ) + E con ( t )
E ner ( t ) = Δ G 2 F + Δ S 2 F ( T T ref ) + R T 2 F [ ln ( c H 2 , CLa c H 2 , ref ) + 1 2 ln ( c O 2 , CLa c O 2 , ref ) ]
E act ( t ) = R T α c F ln ( i i 0 , c ) R T α a F ln ( i i 0 , a ) = R T α F ln ( i ext + i loss i 0 )
E con ( t ) = R T n F ln ( i L , a i L , a i ) R T n F ln ( i L , c i L , c i )
E ASR ( t ) = i ( R elec + R proton )
V out ( t ) = N cell V sin ( t ) = V 1 ( t ) = E 1 + E act , 1 + E ASR , 1 + E con , 1   + V 2 ( t ) = E 2 + E act , 2 + E ASR , 2 + E con , 2   + ......   + V Ncell ( t ) = E N + E act , N + E ASR , N + E con , N
where Vsin (V) represents the output voltage of a single cell; Eact, Econ, and EASR represent the activation losses, concentration losses, and ohmic losses of the single cell, respectively; T is the temperature of the cell; c denotes the concentration of hydrogen and oxygen; and i is the current density.
The continuous balance between the heat generated by energy conversion within the fuel cell and the heat dissipation required for stable operation of the fuel cell stack ensures reliable and stable functioning of the stack. The heat produced in every single cell at the membrane electrode includes the reversible heat released after completing the proton transfer and electrochemical reactions, the irreversible heat caused by the irreversible voltage loss processes, and the latent heat caused by the phase change in water, as shown in Equations (11)–(17).
Q total ( t ) = Q rev + Q irrev + Q sg
Q rev = ( T mea Δ S ) i A 2 F = ( T mea U 0 T ) i A
where ΔS is the entropy change in the whole reaction; i is the current density; and U0 is the equilibrium potential of the reaction.
U 0 = 1.23 9 × 10 4 ( T 298.15 )
Q irrev = ( U 0 V sin ( t ) ) I = ( U 0 E ner + E act ( t ) + E ASR ( t ) + E con ( t ) )
Heat is also released via the condensation of water during the low-temperature start-up process and absorbed during the ice melt phase; this is calculated as follows:
Q sg = ( h sg n ice H 2 O )
where hsg is the latent heat of the phase change in water condensation, and n ice H 2 O is the rate of water condensation.
Heat transfer diffusion is carried out between each single cell in the electric reactor operation and is calculated as follows:
Q 1 = Q total , 1 Q air , 1 Q 2 Q i = Q total , i Q total , i 1 Q total , i + 1 Q N = Q total , N Q air , N Q N 1
Q stack = Q 1 + Q 2 + ...... + Q N
where Qi is the heat of the ith single cell; Qtotal,i is the heat generated by the electrochemical reaction of the ith single cell; and Qstack is the total heat of the stack itself after heat transfer and heat dissipation.
Based on Equations (5)–(17), finite element analysis of the single cell was performed using the Fluent module in Workbench 2022 R1 to obtain a cloud diagram of the steady-state results of the PEMFC on a two-dimensional scale. Its three-dimensional view is shown in Figure 2 with a single-cell model. The anode and cathode gases enter the flow channel from the ‘Inlet’ of the ACH and CCH, respectively, (Figure 2) and are released through the exhaust to the atmosphere from the other end. The membrane water content and temperature distribution on the proton exchange membrane along the PEMFC’s flow channel direction are shown in the cloud diagram in Figure 3.
As can be seen in Figure 3, the temperature along the x direction of the flow channel shows a gradually increasing trend, which is due to the inlet gas flow rate being higher in the electrochemical reaction process of the stack, so that the catalytic process near the inlet of the flow channel is slower; with the gas fully entered into the flow channel, the catalytic and proton transport process is completed to release a large amount of heat. Figure 3b,d show a gradual decrease in density along the runner direction because the gas is fully consumed via the reaction inside the cell, making the gas concentration at the inlet of the runner larger than that at the outlet, while the water vapor content rises, and thus, the density of the gas mixture in the runner decreases. Meanwhile, the maximum water content at the outlet of the flow channel in Figure 3c also confirms the results of the other three cloud diagrams, and the faster and more intense the electrochemical reaction process inside the PEMFC, the more water is generated. Therefore, the model developed in this section can reasonably characterize the PEMFC operation mechanism.

3.2. PEMFC Control System

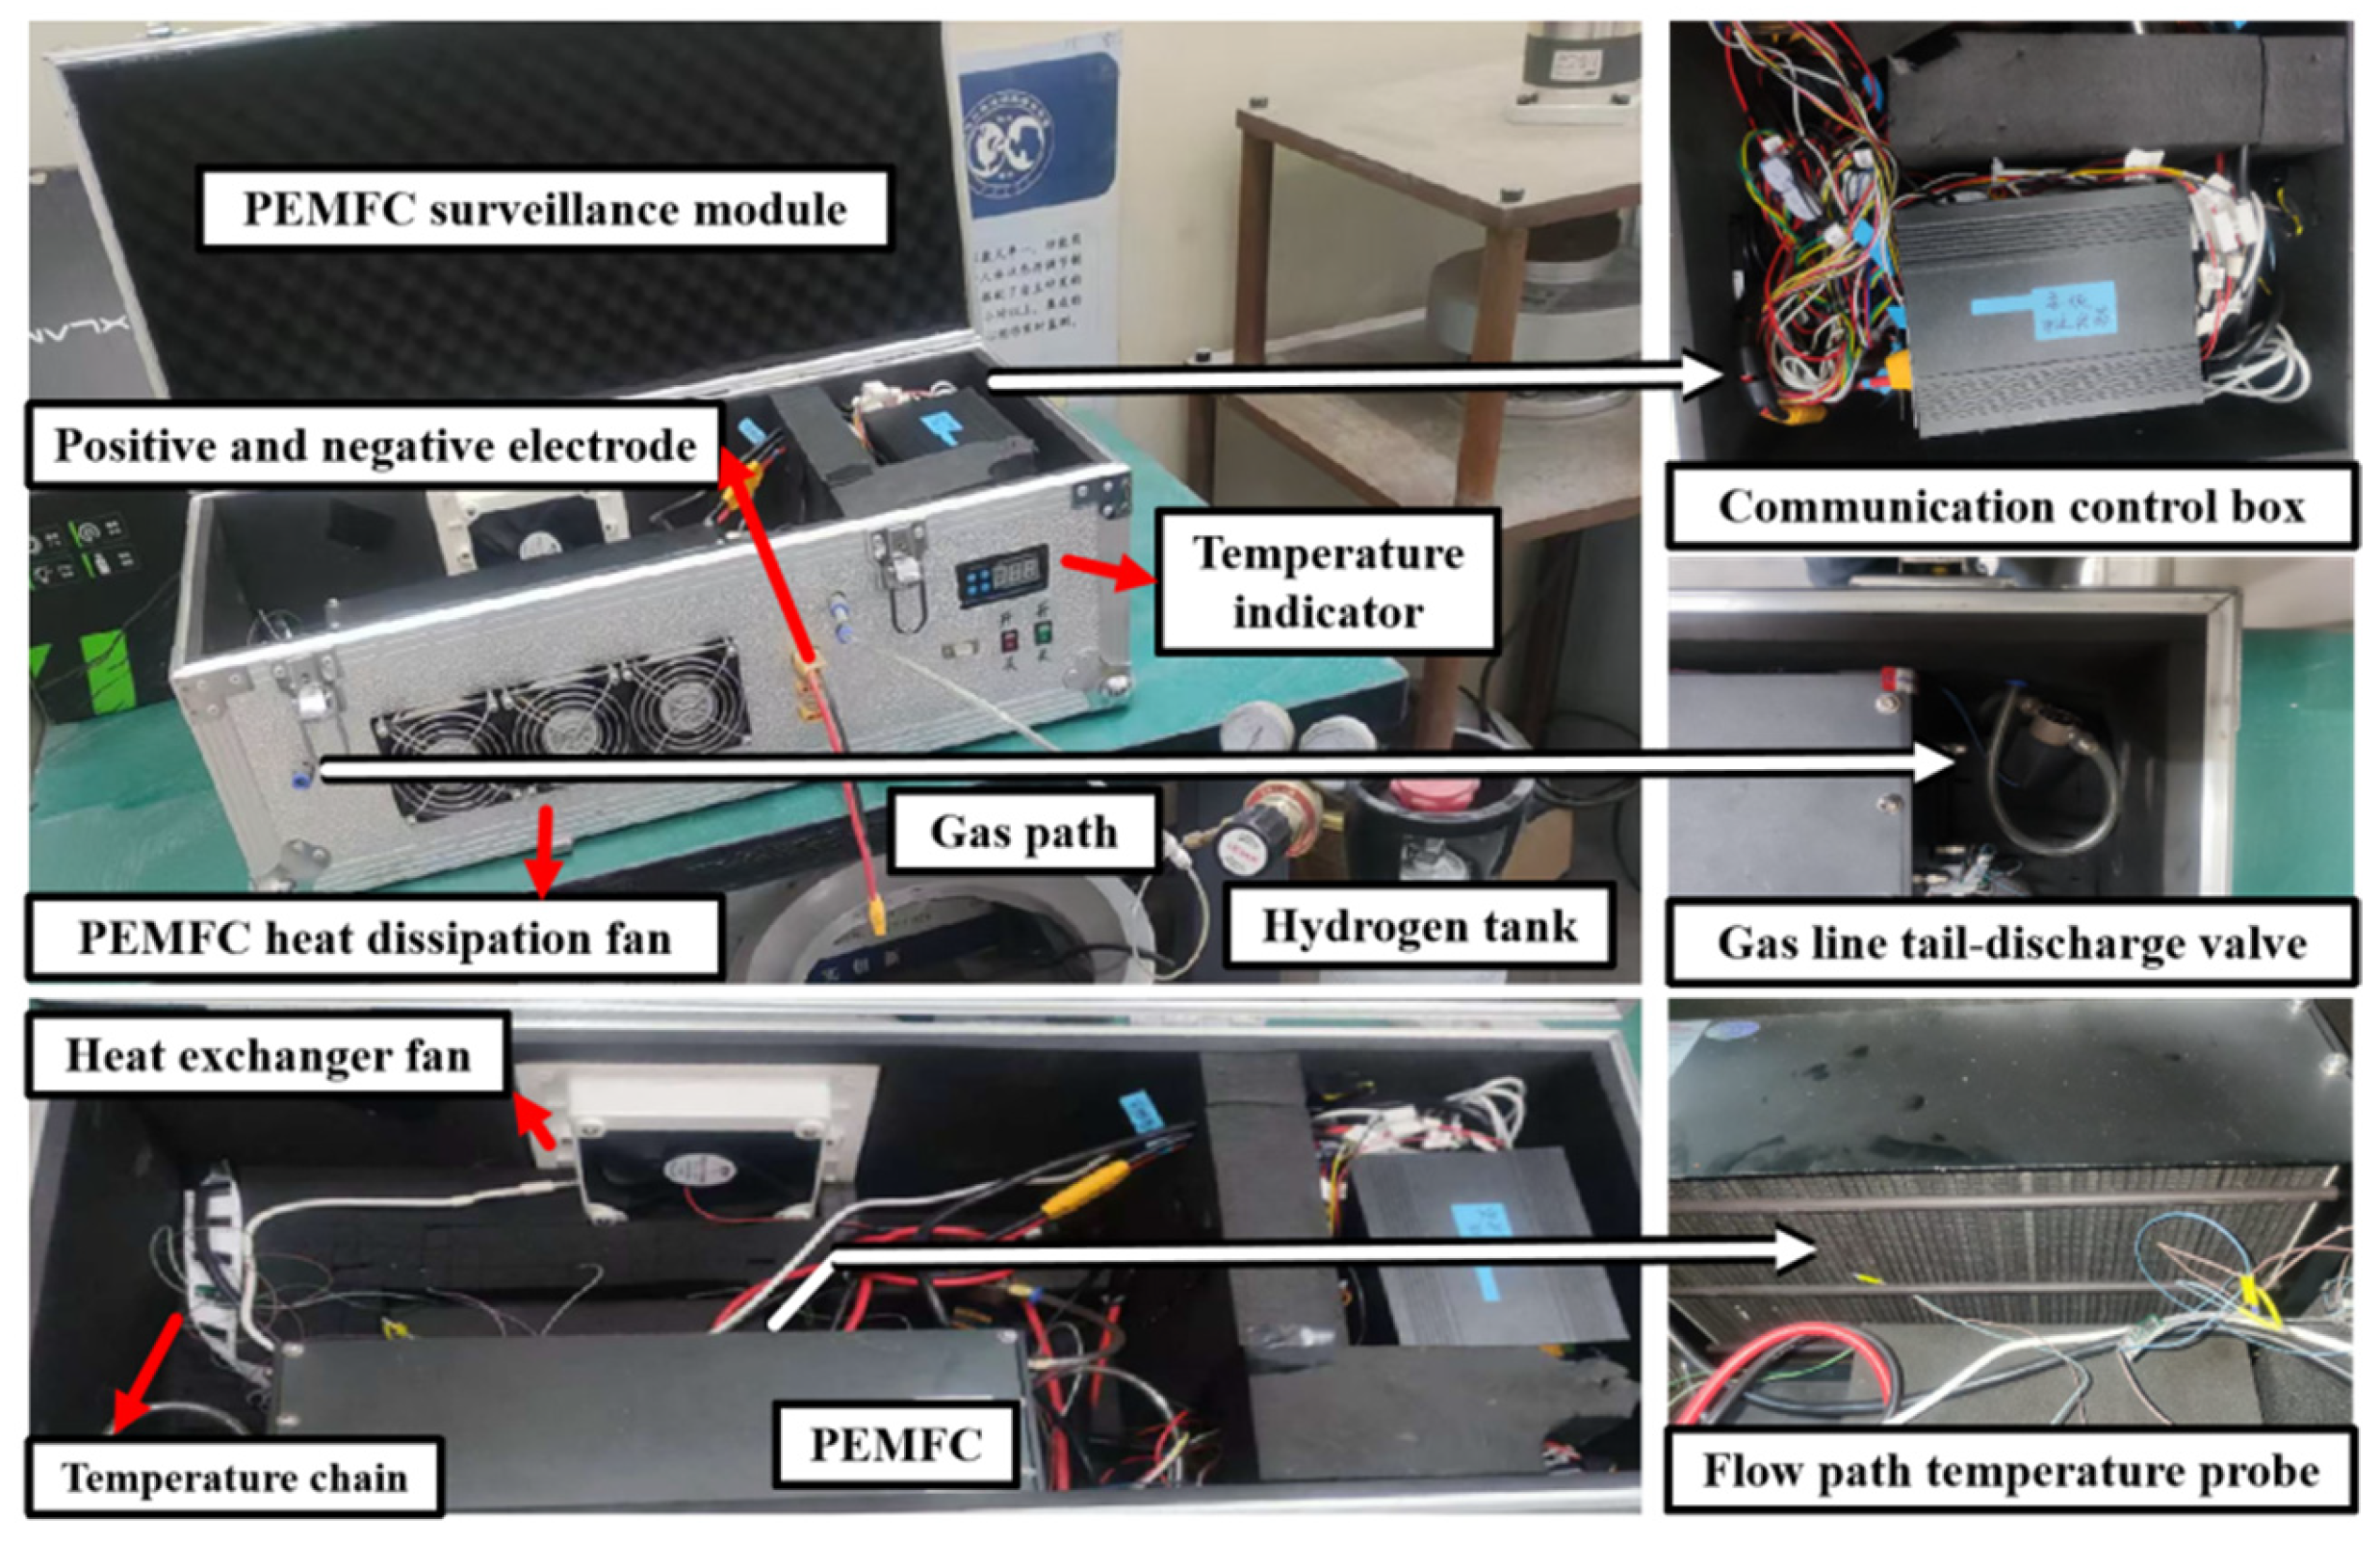
3.2.1. PEMFC Monitoring Module

This study focuses on an air-cooled PEMFC power generation system, which incorporates a stack cabin; fuel cell stack, hydrogen control circuit; air exchange and cooling fans; and data acquisition, display, and control modules. The system utilizes sensors and power-measurement units as electrical loads. As shown in Figure 4, the system monitors the stack temperature, voltage, current, inlet pressure, and ambient conditions of the stack cabin. This is achieved by controlling the inlet fan of the stack cabin, the fan of the fuel cell, and the inlet and exhaust valves of the fuel cell.
Cabin heat exchange is facilitated by the shutter fan, which functions as a fan during the initial start-up of the fuel cell stack when the system is off. This process is accompanied by the energizing of the heating pad, which serves to maintain the cabin temperature above 0 °C independently of external environmental factors that might otherwise cause a rapid temperature drop. During the fully ventilated activation of the fuel cell stack, the maximum open-circuit voltage of the fuel cell stack output is approximately 60 V. The DC–DC module installed in the communication control box reduces this voltage to the required 24 V and regulates the output voltage. The communication control box in Figure 4 controls the heat dissipation fan of the PEMFC and the heat exchange fan installed in the cabin body to keep the temperature in the cabin body in line with the real-time temperature monitoring data in the fuel cell stack and the cabin. The fan installed in the cabin body also plays a role in air exchange. When the ambient temperature is lower than 273.15 K, the heating sheet placed at the bottom of the cabin body will increase the temperature of the cabin body above freezing point as quickly as possible.

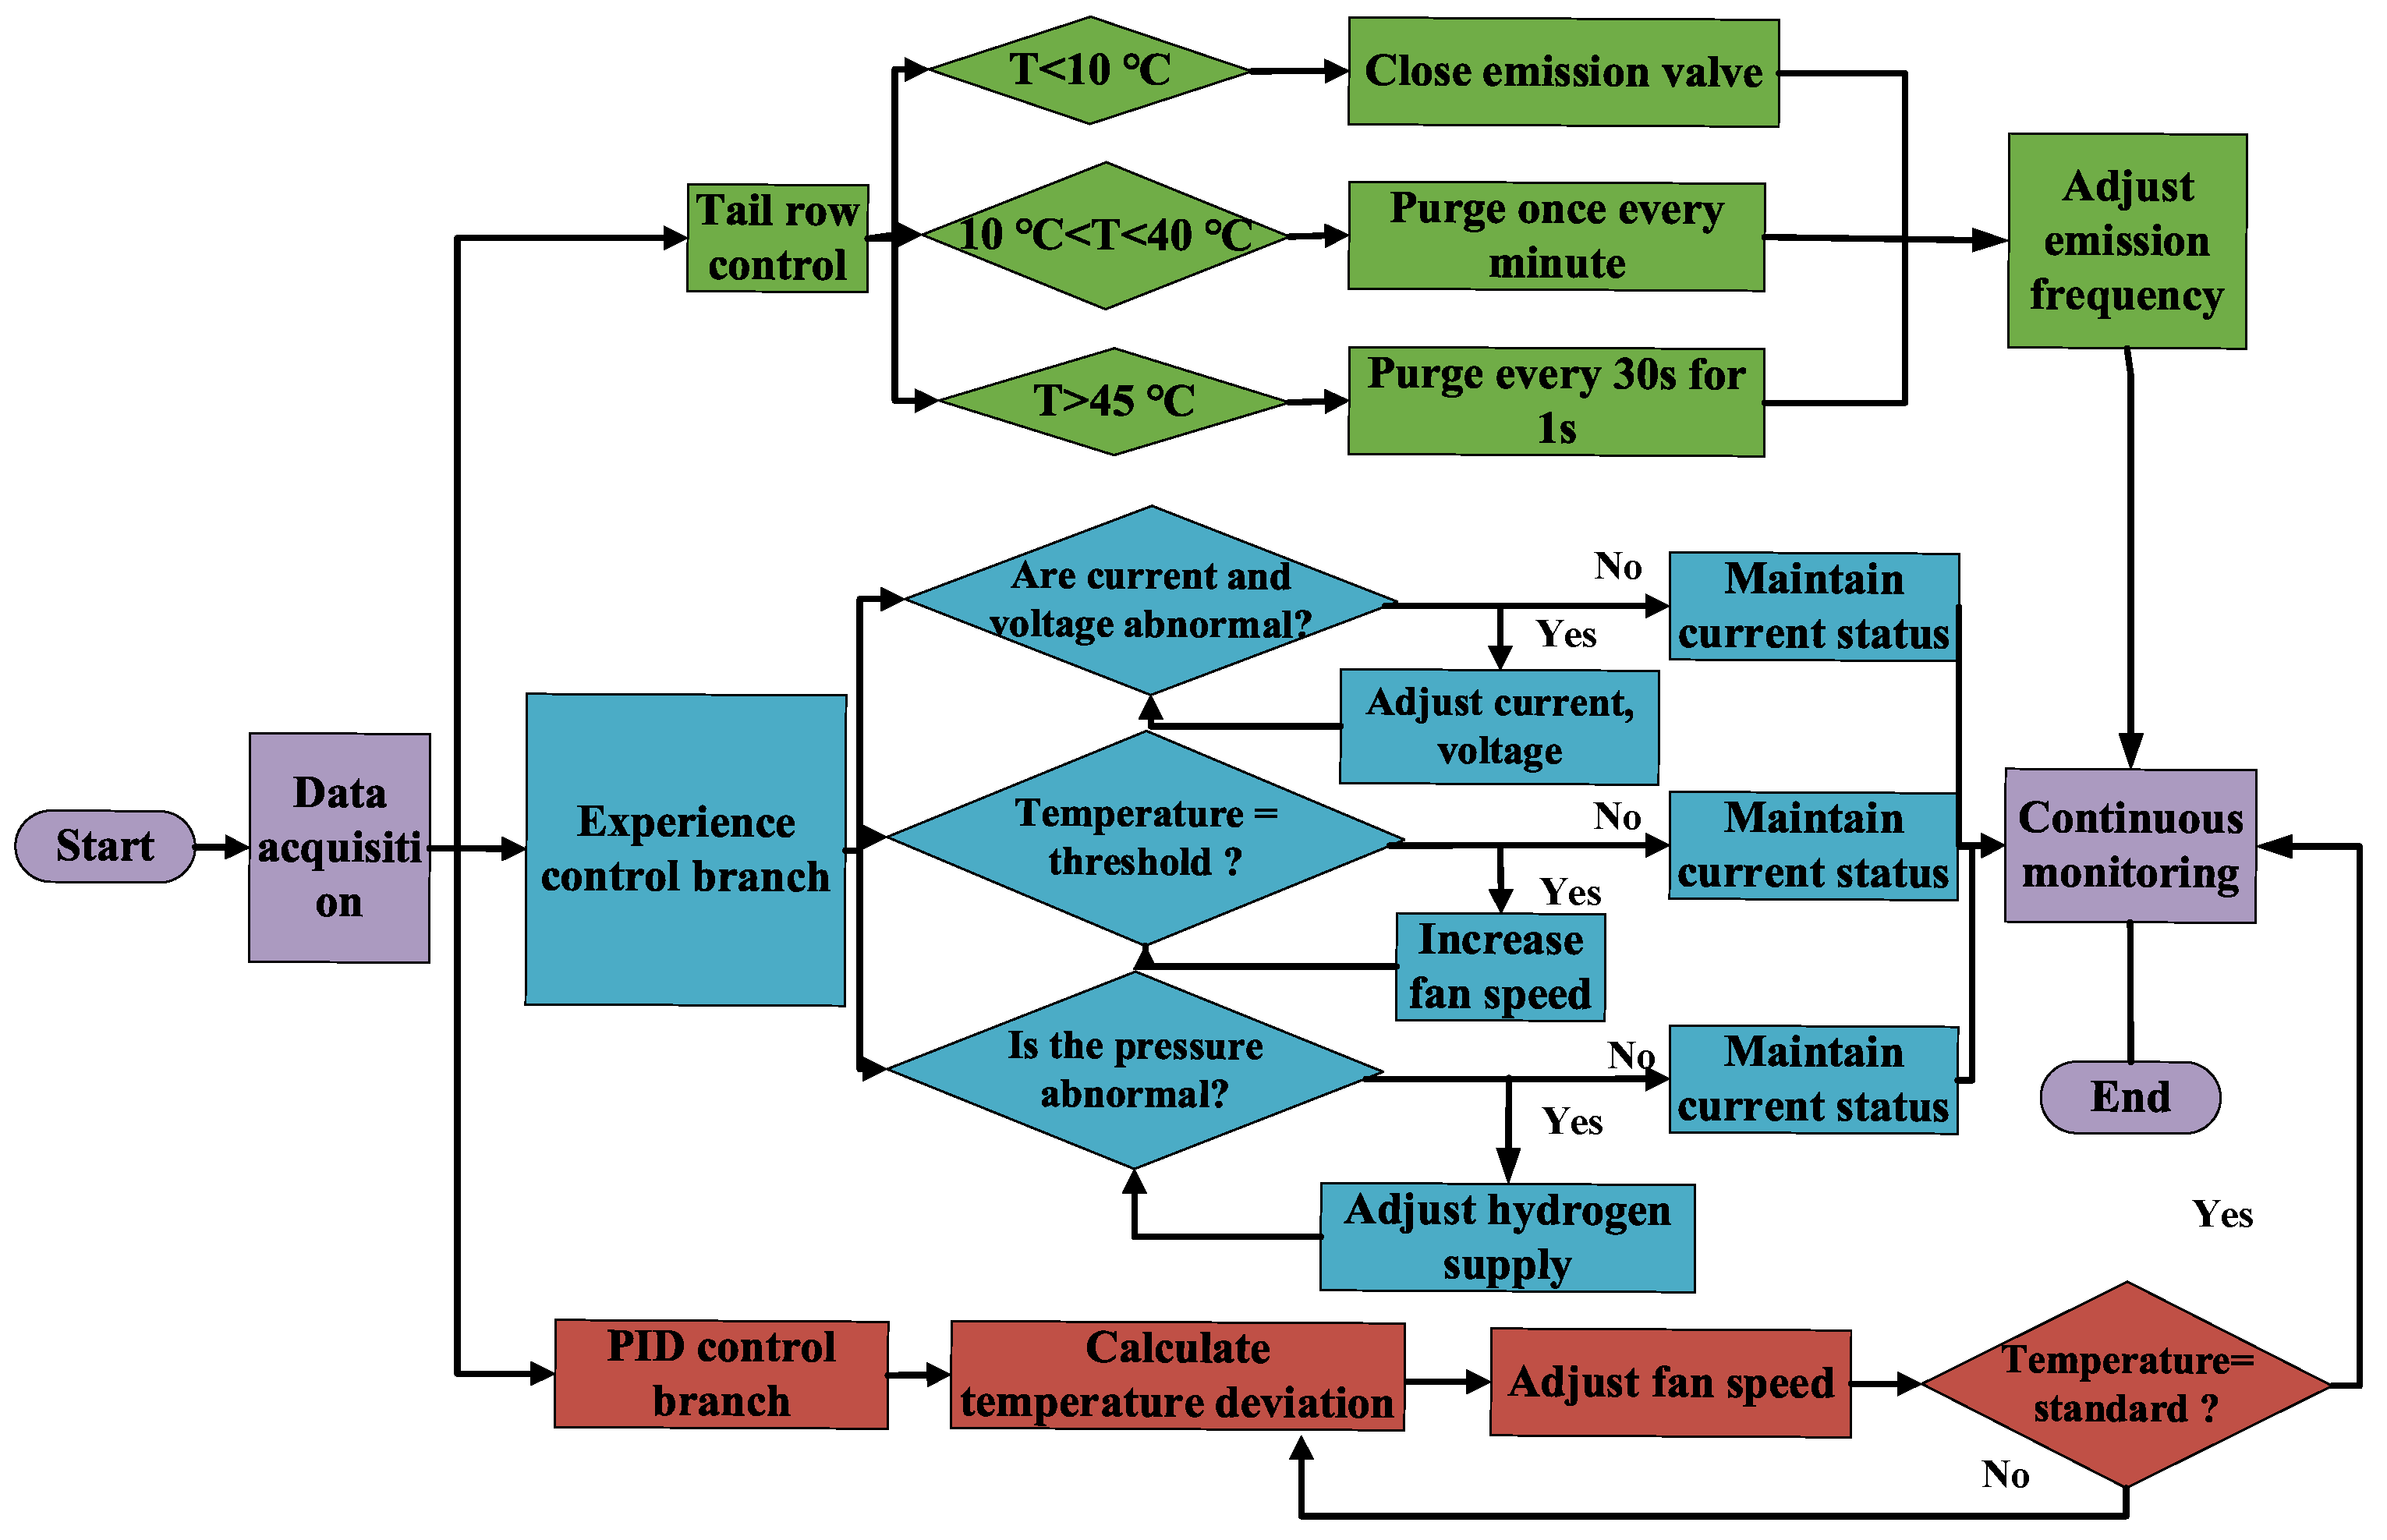
3.2.2. PEMFC Control Strategy

Based on the results pertaining to the PEMFC energy supply method for the SPO and its inherent mechanism, described in Section 2 and Section 3.1, a PEMFC monitoring strategy is established for the auxiliary system, as shown in Figure 5 (PEMFC system composition) and Figure 6 (overall control design).
As demonstrated in Figure 6, the introduction of hydrogen fuel and oxidant into the electric reactor is executed in a meticulous and regulated manner, ensuring precise temporal management of the reaction. Subsequent discharge of the heat generated during this reaction is executed quickly, and the auxiliary systems provide the requisite reaction conditions for the reactor’s efficient and stable operation.
In the operation of a PEMFC, a continuous and stable supply of hydrogen and air is essential for the continuous generation of electric energy. The performance of the fuel cell is susceptible to various factors, such as temperature fluctuations, changes in gas pressure, and humidity variations, which can lead to fluctuations in the output voltage. As illustrated in Figure 7, the system must collect and analyze the monitoring data from each sensor before initiation. Subsequently, once a predetermined value is attained, it must regulate the inlet and outlet valves, fan speed, and heater in the PEMFC tank step-by-step according to the load demand. Meanwhile, considering that PEMFC is easy to freeze at sub-zero temperatures and three stages of ice phase transition exist in the process of cold start, the control logic ensures that the temperature of PEMFC operation and maintenance chamber is kept above freezing point continuously when PEMFC operation and control actions are carried out according to the monitored parameters, so as to avoid the performance attenuation of PEMFC [14,15,16]. The system must then continuously monitor the key parameters of the tank and PEMFC in real time to achieve stable power output through numerous control adjustments. In instances where the load on the PEMFC system is abruptly increased, resulting in a decline in output voltage, the flow of hydrogen and air can be augmented to enhance the rate of the electrochemical reaction, thereby facilitating voltage recovery. However, if the voltage remains outside the normal range after this adjustment, further fine-tuning of the hydrogen and airflow is necessary until the voltage stabilizes within an acceptable range. With prolonged operation, the performance of the PEMFC gradually declines, leading to a slow decrease in voltage. Once the operating time and voltage reach predefined thresholds, it is imperative to reduce the load and optimize the catalyst’s working environment. This may involve adjusting the reaction temperature to the upper limit of the optimal range to compensate for the loss of voltage due to diminished performance.

4. Results and Analysis

Based on the real-time monitoring results and data collected from the monitoring and control system, i.e., the communication control box in Figure 4, an evaluation and analysis of its accuracy were conducted. When the system temperature was between 10 °C and 40 °C, the exhaust gas treatment system performed purging once every minute; when the system temperature exceeded 45 °C, purging was conducted every 30 s for 1 s each time; and when the system temperature was between 0 °C and 10 °C or below 0 °C, the exhaust valve remained closed at all times. Figure 8 illustrates a real-time acquisition and control curve of the output voltage, current, and power. As shown in Figure 8, when the output voltage was set to 24 V, the output value fluctuated slightly with a maximum deviation of 0.8 V. This was due to fluctuations in the total resistance caused by the low-temperature environment at the site, coupled with the fact that the camera in the SPO system does not capture images every second. When the set output voltage is constant, fluctuations in the load current therefore cause some variation in the voltage. As shown by the current curve in Figure 8, the maximum current fluctuation was about 2 A. It can be concluded that the monitoring module of this system meets the power output requirements, and the monitoring value was basically stable at about 1 kW.
A real-time acquisition and control curve of the stack fan speed is presented in Figure 9. The figure depicts a predetermined fan speed of 4600 r/min set by the control module when the PEMFC simultaneously powers the electrical units and charges the battery, with an output power of 980 W. The red curve represents the fan speed measured by a high-precision speed measurement module, serving as a comparison for the effectiveness of the monitoring module in this system. The fan speed monitored by this system fluctuated slightly around 4600 r/min, with a maximum fluctuation of 100 r/min. This was due to the slight fluctuations in the load voltage, which affected the electrochemical reactions inside the stack and caused fluctuations in heat production. To ensure that the stack operates in the optimal state, the system increases the sensitivity of the stack fan speed and adjusts it accordingly.
Figure 10 presents a real-time acquisition and control curve of the PEMFC’s temperature. The internal temperature of the stack is set to 20 °C. The fan speed of the stack changes according to fluctuations in the load and changes in heat production inside the battery resulting in a variation of approximately 0.2 °C in the internal temperature of the stack. Compared to the temperature measurement accuracy of a platinum resistor, the error was only 0.01%.

5. Conclusions

This study introduced a PEMFC power generation system specifically designed for the Antarctic Space Physics Observatory. Through analysis of its operational mechanism, visual distribution maps of the internal stack temperature and water vapor and membrane moisture contents were obtained. Based on this mechanism, monitoring and control strategies for the operational state of the PEMFC were designed and implemented. According to the results, the errors between the monitored parameters and their set values were all less than 1%; the average voltage and current errors were about 0.2 V and 1 A, respectively; the average fan speed error was about 10 r/min; and the temperature monitoring error was about 0.2 K. These data are better than the monitoring error of the electrical parameters in Antarctica which is higher than 5%, fulfilling PEMFCs’ requirement for real-time monitoring of their operational parameters, which is necessary for their reliable operation. Additionally, the system met the power consumption requirements of various modules at the space physics observatory. This study lays a solid theoretical and analytical foundation for the reliable application of PEMFCs in future independent observation systems in Antarctica.

Author Contributions

Conceptualization, G.Z. and J.W.; methodology, Y.D.; software, J.W.; validation, Y.D., G.Z. and J.W.; formal analysis, Y.D.; investigation, Y.R.; resources, G.Z.; data curation, Y.D.; writing—original draft preparation, G.Z.; writing—review and editing, J.W.; visualization, J.W.; supervision, Y.R.; project administration, Y.D.; funding acquisition, G.Z. All authors have read and agreed to the published version of the manuscript.

Funding

This research was funded by the National Key Research and Development Program of China, grant number 2021YFC2803304, the funder Guangyu Zuo; the National Natural Science Foundation of China, grant number 42306260, U23A20649, the funder Guangyu Zuo; the China Postdoctoral Science Foundation, grant number 2023M733042, the funder Guangyu Zuo; the Scientific and Technological Innovation Programs of Higher Education Institutions in Shanxi, grant number 2021L025, the funder Guangyu Zuo; and the Shanxi Provincial Key Research and Development Project, grant number 202102060301020, the funder Yinke Dou.

Data Availability Statement

The original contributions presented in the study are included in the article, further inquiries can be directed to the corresponding author.

Acknowledgments

The authors thank the Polar Research Institute of China for supporting the field data collection.

Conflicts of Interest

The authors declare no conflicts of interest.

References

  1. Chundong, G.; Honglin, H. The development potential of field scientific observation and research stations should be highly valued. Bull. Chin. Acad. Sci. 2019, 34, 344–348. (In Chinese) [Google Scholar]
  2. Hosseini, S.E.; Wahid, M.A. Hydrogen from solar energy, a clean energy carrier from a sustainable source of energy. Int. J. Energy Res. 2020, 44, 4110–4131. [Google Scholar]
  3. Sharaf, O.Z.; Orhan, M.F. An overview of fuel cell technology: Fundamentals and applications. Renew. Sustain. Energy Rev. 2014, 32, 810–853. [Google Scholar] [CrossRef]
  4. Wang, J.; Sun, T.-C.; Xu, Y. Current situation and prospect of PEMFC hydrogen power generation system. Power China 2006, 39, 37–41. [Google Scholar]
  5. Tao, J.J.; Wei, X.Z.; Ming, P.W.; Wang, X.; Jiang, S.; Dai, H. Order reduction, simplification and parameters identification for cold start model of PEM fuel cell. Energy Convers. Manag. 2022, 274, 116465. [Google Scholar]
  6. Niu, H.P.; Ji, C.W.; Wang, S.F.; Shi, M.; Zhang, H.; Liang, C. Analysis of the cold start behavior of a polymer electrolyte membrane fuel cell in constant power start-up mode. Int. J. Energy Res. 2021, 45, 19245–19264. [Google Scholar]
  7. Hu, G.L.; Li, G.N.; Zheng, Y.Q.; Zhang, Z.; Xu, Y. Optimization and parametric analysis of PEMFC based on an agglomerate model for catalyst layer. J. Energy Inst. 2014, 87, 163–174. [Google Scholar]
  8. Lei, X.; Bo, H.; Mingruo, H. Research on Mass Transfer Characteristics Based on semi-empirical Model of polarization Curve. Agric. Equip. Veh. Eng. 2023, 61, 166–168+172. [Google Scholar]
  9. Wu, H.; Lu, Y.; Yang, D. Simulation model and experimental study on performance of proton exchange membrane fuel cells under high temperature and pressure. Electr. Age 2023, S1, 95–102. [Google Scholar]
  10. Wang, J.; Chen, J.; Lan, F. Global Sensitivity Analysis of multi-scale parameter Double cost Function of Fuel cell Model. Automot. Eng. 2023, 45, 393–401. [Google Scholar] [CrossRef]
  11. Li, J.W.; Yu, T. Distributed deep reinforcement learning for optimal voltage control of PEMFC. IET Renew. Power Gener. 2021, 15, 2778–2798. [Google Scholar] [CrossRef]
  12. Kocaarslan, I.; Kart, S.; Genc, N.; Uzmus, H. Design and application of PEM fuel cell- based cascade boost converter. Electr. Eng. 2019, 101, 1323–1332. [Google Scholar] [CrossRef]
  13. Mao, L.; Wang, C.Y. Analysis of cold start in polymer electrolyte fuel cells. J. Electrochem. Soc. 2007, 154, B139–B142. [Google Scholar]
  14. Wang, Y. Analysis of the key parameters in the cold start of polymer electrolyte fuel cells. J. Electrochem. Soc. 2007, 154, B1041. [Google Scholar] [CrossRef]
  15. Wang, Y.; Mukherjee, P.P.; Mishler, J.; Mukundan, R.; Borup, R.L. Cold start of polymer electrolyte fuel cells: Three-stage startup characterization. Electrochim. Acta. 2010, 55, 2636–2644. [Google Scholar] [CrossRef]
  16. Chena, J.; Wang, Y.; Mukherjee, P.P. One Dimensional Analysis of Subzero Start-Up for Polymer Electrolyte Fuel Cells. J. Electrochem. Soc. 2008, 16, 273–284. [Google Scholar]
  17. Li, L.J.; Wang, S.X.; Yue, L.K.; Wang, G. Cold-start method for proton exchange membrane fuel cells based on locally heating the cathode. Appl. Energy 2019, 254, 113716. [Google Scholar]
  18. Zhou, Y.B.; Luo, Y.Q.; Yu, S.H.; Jiao, K. Modeling of cold start processes and performance optimization for proton exchange membrane fuel cell stacks. J. Power Sources 2014, 247, 738–748. [Google Scholar] [CrossRef]
  19. Silva, R.E.; Harel, F.; Jemeï, S.; Gouriveau, R.; Hissel, D.; Boulon, L.; Agbossou, K. Proton exchange membrane fuel cell operation and degradation in short-circuit. Fuel Cells 2014, 14, 894–905. [Google Scholar] [CrossRef]
  20. Yao, G. Overview of cold start simulation for proton exchange membrane fuel cells. J. Mar. Electr. Technol. 2014, 34, 63–65. [Google Scholar]
  21. Zheng, J.; Deng, P.; Ma, J. Low temperature start-up process of fuel cell for catalytic combustion assisted heating. J. Tongji Univ. (Nat. Sci. Ed.) 2013, 41, 910–914. [Google Scholar]
  22. Calderón, A.J.; González, I.; Calderón, M.; Segura, F.; Andújar, J.M. A New, Scalable and Low Cost Multi-Channel Monitoring System for Polymer Electrolyte Fuel Cells. Sensors 2016, 16, 349. [Google Scholar] [CrossRef] [PubMed]
  23. McKahn, D.A.; Liu, X. Comparison of Two Models for Temperature Observation of Miniature PEM Fuel Cells Under Dry Conditions. IEEE Trans. Ind. Electron. 2015, 62, 5283–5292. [Google Scholar]
  24. Kuan, Y.D.; Septiani, A.; Yuliane, A. Development of The Diagnostic System for Fuel Cell Vehicle using LabVIEW. In Proceedings of the 2018 International Conference on System Science and Engineering (ICSSE), New Taipei City, Taiwan, 28–30 June 2018. [Google Scholar]
  25. Dudek, M.; Raźniak, A.; Lis, B.; Siwek, T.; Adamczyk, B.; Uhl, D.; Kalawa, W.; Uhl, T. Monitoring of the Operating Parameters a Low-Temperature Fuel-Cell Stack for Applications in Unmanned Aerial Vehicles: Part II. In E3S Web of Conferences; EDP Sciences: Les Ulis, France, 2019; Volume 108, p. 01030. [Google Scholar]
  26. Pang, Y.; Wang, Y. Water spatial distribution in polymer electrolyte membrane fuel cell: Convolutional neural network analysis of neutron radiography. Energy AI 2023, 14, 2666–5468. [Google Scholar] [CrossRef]
  27. Mishler, J.; Wang, Y.; Mukundan, R.; Spendelow, J.; Hussey, D.S.; Jacobson, D.L.; Borup, R.L. Probing the water content in polymer electrolyte fuel cells using neutron radiography. Electrochim. Acta. 2012, 75, 1–10. [Google Scholar]
  28. Mishlera, J.; Wanga, Y.; Mukundan, R.; Borup, R.L.; Hussey, D.S.; Jacobson, D. In Situ Investigation of Water Distribution in Polymer Electrolyte Fuel Cell Using Neutron Radiography. ECS Trans. 2010, 33, 1443–1450. [Google Scholar]
  29. Zhang, W. Fuel Cell Test System Based on AVR Single-chip Computer. In Proceedings of the 2017 International Conference on Computer Network, Electronic and Automation (ICCNEA), Xi’an, China, 23–25 September 2017; pp. 3146–3349. [Google Scholar]
  30. Strahl, S.; Husar, A.; Puleston, P.; Riera, J. Performance Improvement by Temperature Control of an Open-Cathode PEM Fuel Cell System. Fuel Cells 2014, 14, 466–478. [Google Scholar]
  31. Li, Y.; Wang, H.; Dai, Z. Using Artificial Neural Network to Control the Temperature of Fuel Cell. In Proceedings of the International Conference on Communications, Circuits and Systems Proceedings, Guilin, China, 25–28 June 2006; pp. 2159–2162. [Google Scholar]
  32. O’Keefe, D.; El-Sharkh, M.Y.; Telotte, J.C.; Palanki, S. Temperature dynamics and control of a water-cooled fuel cell stack. J. Power Sources 2014, 256, 470–478. [Google Scholar]
  33. Peng, H.; Guangyi, C.; Xinjian, Z. Temperature model and fuzzy control for proton exchange membrane fuel cells. Control. Theory Appl. 2011, 28, 1371–1376. (In Chinese) [Google Scholar]
  34. Yin, L.; Li, Q.; Han, Y. Real-time optimal temperature adaptive inverse control for air cooled PEMFC power generation System. Chin. J. Sol. Energy 2017, 38, 2168–2175. [Google Scholar]
  35. Wang, R.; Qin, L.; Jiang, H.; Xun, L. A Device for Extending Low Temperature Storage Time of Fuel Cell Stack. China Patent 201758156, 9 March 2011. [Google Scholar]
  36. Sun, J.; Li, X.; Liu, C. Self-starting fuel cell power generation System. Power Grid Clean Energy 2011, 27, 72–75. [Google Scholar]
  37. Gao, Q.; Hou, Z.; Wang, K.; Sun, D.; Liu, C. A Fuel Cell Thermal Insulation System. China Patent 201946691U, 24 August 2011. [Google Scholar]
  38. Jin, W.; Dou, Y.; Zuo, G.; Fan, B.; Xing, Y. Improving Proton Exchange Membrane Fuel Cell Operational Reliability Through Cabin-Based Fuzzy Control in Costal Standalone Observation Systems in Antarctica. J. Mar. Sci. Eng. 2025, 13, 112. [Google Scholar] [CrossRef]
  39. Birk, W. Fuel Cell System and Method for Starting a Fuel Cell System. U.S. Patent 6756143 B2, 29 June 2004. [Google Scholar]
Figure 1. A diagram of the SPO and energy system architecture.
Energies 18 01693 g001
Figure 2. Diagram of single-cell PEMFC structure.
Energies 18 01693 g002
Figure 3. Cloud diagram showing internal mechanism of single-cell PEMFC: (a) temperature distribution; (b) anode flow density distribution; (c) membrane water content distribution; (d) cathode flow channel density distribution.
Energies 18 01693 g003
Figure 4. Fuel cell monitoring module.
Energies 18 01693 g004
Figure 5. Diagram of PEMFC system composition.
Energies 18 01693 g005
Figure 6. Link diagram of PEMFC monitoring.
Energies 18 01693 g006
Figure 7. PEMFC monitoring flowchart.
Energies 18 01693 g007
Figure 8. Real-time acquisition and control curve of output voltage.
Energies 18 01693 g008
Figure 9. Real-time collection and control curve of PEMFC’s fan speed.
Energies 18 01693 g009
Figure 10. Real-time acquisition and control curve of PEMFC’s temperature (293.15 K).
Energies 18 01693 g010
Table 1. SPO system energy consumption.
Power UnitQuantity (Units)TypePower (W)Monitoring UnitPower Consumption (W)Quantity (Sets)
Wind Turbine1Q-type1000Monitoring Unit1001
1H-type1000
Photovoltaic Panel1Flexible800Control Module201
Energy Storage Battery1Lead-acid battery1000Heater301
Hydrogen Fuel Cell1PEMFC1000Communication Module102
Hydrogen storage6 × 240 L × 13.5 Mpa
Table 2. The parameters of a single fuel cell.
ParametersValue
Length and width100 mm; 35 mm
Thickness of anode and cathode
(BP, CH, GDL, CL, MEM)
2 mm; 1 mm; 0.2 mm; 0.03 mm; 0.01 mm; 0.03 mm
Width of CH1 mm
Pressure of CH outlets1 atm
Pore radii of CL and GDL [29]1.2 × 10⁻⁸ and 3.89 × 10⁻⁵ m
Equivalent weight of membrane (EW)1.1 kg/mol
R; F8.314 J/mol/K; 96,485 C/mol
Disclaimer/Publisher’s Note: The statements, opinions and data contained in all publications are solely those of the individual author(s) and contributor(s) and not of MDPI and/or the editor(s). MDPI and/or the editor(s) disclaim responsibility for any injury to people or property resulting from any ideas, methods, instructions or products referred to in the content.

