Abstract
With the increasing adoption of renewable energy sources, such as solar and wind power, it is essential to achieve carbon neutrality. However, several shortcomings, including their intermittence, pose significant challenges to the stability of the electrical grid. This study explores hydrogen-based technologies, such as fuel cells and water electrolysis systems, as an effective solution to improve frequency stability and address the problems of power grid reliability. Using power system analysis programs, modeling and simulations performed on IEEE-25 Bus and Jeju Island systems demonstrate the potential of these technologies to mitigate reductions, reduce transmission constraints, and stabilize frequencies. The results show that hydrogen-based systems are important factors enabling sustainable energy transition.
1. Introduction
Since the 20th century, the excessive use of fossil fuels has intensified global warming, leading to rising sea levels and extreme weather changes. As a result, industries worldwide have been working toward the common goal of “carbon neutrality”. The power generation sector is no exception. The transition from fossil fuel-based thermal power generation to renewable energy sources, which do not emit carbon or other greenhouse gases, aims for complete carbon neutrality in power generation.
Among the representative renewable energy sources are solar and wind power generation. As of July 2024 [1], the domestic solar power generation capacity is approximately 25.6 GW, while wind power capacity is around 2.2 GW, making them the leading renewable energy sources in the country. Notably, in the case of solar power generation, the proportion of Korea Electric Power Corporation (KEPCO) and power generation subsidiaries is only about 1.7%, indicating a high share of Independent Power Producers (IPPs).
The increase in renewable energy sources is a positive change in terms of carbon neutrality. However, from the perspective of power system operators, the rise in renewable energy sources also increases instability. Since renewable energy sources, such as solar and wind power, are highly dependent on weather conditions, their power output is highly variable, introducing uncertainties in power system operations. This issue poses a major obstacle to the expansion of renewable energy. Maintaining the stability of power systems is crucial in modern society, and without proper countermeasures, the expansion of renewable energy could lead to serious technical challenges.
In a previous study by J. Lee [2,3], the optimal location for installing Frequency Regulation Energy Storage Systems (FR-ESSs) was determined based on frequency sensitivity indices in the event of grid disturbances. J. Lee’s study was conducted on the selection of the optimal location of FR-ESSs, an auxiliary power system. Through this study, the installation location of ESSs contributing to the power system frequency was proposed, but it was limited to battery-based ESSs. B. H. Park implemented and simulated PEMFC with high response speed as Simulink in consideration of the characteristics of power and boost converter [4]. Although this fuel cell model reflects its characteristics, it has not been implemented to connect and contribute to the power system. In addition, D. H. Kwon implemented the HVDC model composed of PSCAD/EMTDC in PSS/E to reduce errors [5]. The advantage of PSS/E is that the calculation time of PSS/E is shortened by significantly reducing errors. This study performed dynamic modeling in PSCAD with excellent compatibility, but did not perform fuel cell modeling reflecting the latest research trends.
Additionally, previous studies have separately analyzed voltage stability and frequency stability. However, this research considers both factors simultaneously to identify optimal locations for installation, ensuring stable responses to output fluctuations [6,7]. The findings aim to propose a technological alternative and practical applications for integrating fuel cells and water electrolysis systems in maintaining frequency stability during the expansion of renewable energy sources.
South Korea is gradually implementing energy conversion through the biennial basic plan for power supply and demand, and the key is to increase the proportion of renewable energy generation. Comparing the detailed power generation by power source in 2030 compared to the 10th, it is estimated that new and renewable energy will increase by 4.3 tWh in 2030 compared to the 10th. Through this, it can be confirmed that efforts are being made to achieve the National Greenhouse Gas Reduction Target (NDC), but the share of renewable energy generation in Korea is still very low, at about 7.4%. This means that the domestic power system has several problems in the energy conversion to new and renewable energy [8], and we categorized them into three main categories, as shown in Figure 1. The first is the intermittence of renewable energy.

Figure 1.
Problems of the power system due to the expansion of RES.
The definition of intermittence is ‘change in power generation due to weather conditions’, and unlike nuclear power generation, which is a representative power generation source using renewable energy in Korea, the amount of solar and wind power generation fluctuates frequently depending on weather conditions; so, an energy storage system (ESS) is essential to ensure a stable output [6]. From the perspective of system managers, various algorithms using big data have been developed and applied to predict the power generation of new and renewable power generation sources whose power generation fluctuates in real time. However, in serious cases, circulation failure occurs due to prediction failure. Circulation failure caused by a single prediction failure causes serious adverse effects on the national economy and causes people’s trust in system managers to decrease. In this regard, catching up with the stability of the system of the existing fossil fuel-based power generation system is an important task to move toward a carbon-neutral power generation system.
The second problem is curtailment. Curtailment is implemented when power supply is higher than power demand, especially in Jeju Island. Due to the nature of renewable power generation sources, whose power generation increases rapidly during a specific time period, many output restrictions are being implemented due to the imbalance between supply and demand at that time period. According to the ‘July 2024 Electricity Statistics Monthly Report’ [1] in Jeju Island, 1421 MW of the total 1941 MW correspond to a new and renewable power generation source, accounting for about 64%. Therefore, the problem that occurs as the proportion of renewable power sources increases is preceded by the land system, and output control is typically being implemented by the generation of power from new and renewable power sources that are more than the load currently required. Table 1 presents the current status of curtailment implemented for three years in the Jeju area [8].

Table 1.
Amount of curtailment in Jeju area in 3 years.
In order to resolve the growing curtailments, HVDC reverse transmission in Jeju, especially HVDC #3, can be transmitted in both directions with HVDC voltage; so, there is a high expectation to resolve the output control, but the new and renewable power source currently scheduled to be installed in Jeju cannot be completely resolved beyond that. Some are concerned that the curtailment could be implemented more than 1900 times a year in 2030 due to the continuous increase in new and renewable power sources in Jeju.
Transmission constraints are the third issue. More than 60% of solar generators, which account for the largest facility capacity among renewable power sources in the land system, are distributed in the Honam and Yeongnam regions. However, since more than 70% of the domestic electricity demand is concentrated in the metropolitan area, the electricity produced in non-metropolitan areas, including the Honam and Yeongnam regions, must be transmitted to the metropolitan area through transmission lines. However, since the current transmission network of the domestic power system cannot meet all the electricity produced in the non-metropolitan area, it is essential to build additional transmission networks. However, due to the need for various procedures and the consent of local residents in the construction of power lines, it is difficult to keep up with the rapidly increasing capacity of new and renewable power sources, even in a series of processes.
These problems cause the expansion of renewable power sources and, furthermore, the carbon neutrality of the power generation system to be delayed, and from the perspective of system managers, they create many problems.
To solve these problems, the authors propose fuel cells and water electrolysis facilities as alternatives. Fuel cells generate electricity through hydrogen, and water electrolysis facilities generate hydrogen based on power and water, and these two facilities are the core of hydrogen-based systems. In what follows, the authors list how hydrogen-based fuel cells and water electrolysis facilities can solve the problems of the Korean power system.
First, fuel cells can provide a continuous and constant output if only hydrogen is supplied constantly. Of course, the operating time (lifespan) of the power generation fuel cell is about 50,000 h, and it is necessary to estimate the state of the stack and verify the long-term durability when connecting the power system. To this end, it is necessary to extend the stack quality guarantee period of the fuel cell in the short term, and research is being conducted to improve the durability in the long term.
Also, Korea is the world’s leading fuel cell powerhouse, and a total of more than 1 GW of facilities are currently deployed in the system. And 60% of fuel cells for power generation are distributed in the metropolitan area, including Seoul. In addition, in the ‘10th Basic Plan for Power Supply and Demand’, which was announced in January 2023, fuel cells are classified as distributed power sources, so that energy can be supplied stably even in small installation areas in urban areas, especially in power-intensive areas.
Research on water electrolysis facilities is also underway, but it has been conducted with an eye on the production of green hydrogen using water electrolysis facilities linked to renewable energy. If a large green hydrogen production facility succeeds in commercialization beyond demonstration, it will have the price competitiveness of green hydrogen based on renewable energy. Therefore, the authors determined that the problem can be solved if the above two hydrogen-based systems are applied within the system.
In addition, the opportunities for fuel cells to contribute to the power system have recently expanded. In 2023, Korea implemented the world’s first general hydrogen bidding market to promote commercial use by ensuring the economic benefits of hydrogen-based power generation systems, including fuel cells, create an environment in which fuel cells can stably contribute to the system, and conducted a successful pilot project for one year. Furthermore, from 2024, the market is expanding by implementing a clean hydrogen bidding market using clean hydrogen (green hydrogen, blue hydrogen).
Moreover, fuel cells for power generation can be installed in urban areas due to low operating noise and small required sites that can be installed for buildings. From June 2023, fuel cells for power generation can be installed at gas stations due to the revision of the “Detailed Standards for Safety Management of Dangerous Goods Act”. This is evaluated as an opportunity for fuel cells to complement the stability of the power system and play an important role in achieving carbon neutrality goals. With such a policy and environmental basis in place, if the number of fuel cells installed near the power demand area increases, the problem of intermittent renewable energy and transmission constraints can be solved.
As shown in Table 2, carbon neutrality can be accelerated if the expansion of fuel cells and water electrolysis facilities can also contribute to the frequency stability of the power system in a situation where policy and environmental foundation are established.

Table 2.
Fuel cell and water electrolysis facility environment/policy/research status.
2. Body
2.1. Fuel Cell Model Configuration
When power system auxiliary facilities, such as generators using renewable energy, energy storage systems (ESSs), and static synchronous converters (STATCOM), are linked to the system, specific technical standards (Grid Code) must be observed to ensure a stable and efficient operation. The technical standards in Korea are named ‘New and Renewable Generator Transmission System Linkage Technology Standards’ [6,9], which is an essential element to maintain the reliability of the power system and cope with the volatility of new and renewable power generation resources. Due to the expansion of new and renewable power generation resources, it was enacted in March 2021 and then the second revision occurred in February 2024. There are three main technical standards for the connection of the transmission system of new and renewable generators.
First, it requires frequency and voltage stability. Renewable generators connected to the transmission system must react sensitively to frequency and voltage fluctuations in the power system. The generator must be able to adjust the effective power in response to frequency fluctuations.
The second is the Fault Ride-Through function. When an accident occurs in the system of the generator, the voltage fluctuates, and the connection must be maintained for a certain period of time, even in low and high voltage situations. It plays a role in preventing secondary and tertiary accidents in the system.
The third is effective and reactive power control. Renewable generator operators must be able to adjust the effective power to meet the demand of the power system and the supply of reactive power to ensure the voltage stability of the power system.
In addition, the generator that meets these three conditions must be modeled as PSS/E, a power system analysis program and submitted to the institution. In addition, it should be composed of a system-linked model suitable for the characteristics of each renewable power source, and the dynamic model configuration of the fuel cell that complies with the above criteria is shown in Table 3 [6].

Table 3.
Fuel cell’s dynamic model standards.
Each model should be designed to control the output of the fuel cell to match frequency and voltage fluctuations. For example, a frequency control algorithm, such as Drop control, which will be described later, enables a stable power supply by adjusting the generator output according to the frequency fluctuations in the system.
Therefore, in order to connect the fuel cell to the system, it is necessary to design it to contribute to the system frequency while observing the relevant technical standards, reflecting the characteristics of the fuel cell, and simulating the interaction with the system based on the fuel cell’s parameters. This process plays an important role in the system linkage evaluation and verification process and is a key factor in ensuring that the fuel cell can operate safely and efficiently in the power system.
First, in order to find out the characteristics of the fuel cell model in PSS/E, a power system analysis program, it is necessary to check the fuel cells classified according to their characteristics. Fuel cells are largely classified into low-temperature fuel cells and high-temperature fuel cells. Low-temperature fuel cells include PEMFC and PAFC, and high-temperature fuel cells include MCFC and SOFC.
Because low-temperature fuel cells operate at low temperatures, they can fluctuate quickly. Among them, PEMFC is mainly used in hydrogen cars because the operating temperature is as fast as 80 °C. PEMFC used in hydrogen vehicles will actually be used as a fuel cell for power generation connected to the system. And since PAFC-based fuel cell power plants account for the highest proportion of domestic fuel cell power plants, the possibility of achieving fuel cells that follow system frequencies using low-temperature fuel cells is considered sufficient.
As mentioned in Table 3, fuel cell modeling consists of three models, and each block diagram is composed of about 20 to 50 parameters within the block diagram. The third model among them, REPCA1, serves as frequency fluctuation control and voltage stability.
In the third model in Figure 2 [6], the main functions of REPCA1, a generator/plant control model, consist of frequency variation control and voltage stability. First, Tfltr is the time constant of the voltage and reactive current measurement filter, and Dup and Ddn are representative frequency-related parameters, each of which is the reciprocal of the Droop coefficient for over/low frequency conditions. The Droop coefficient represents the output ratio according to the frequency change.
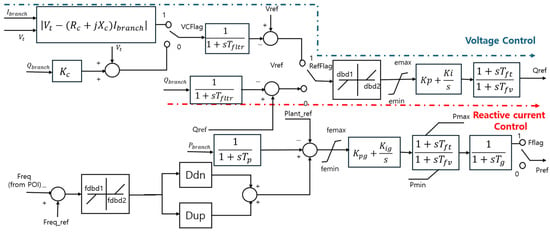
Figure 2.
REPCA1’s block diagram.
As can be seen from Equation (1), as D increases, the width of the increase or decrease in output increases when the frequency increases/decreases, which is a parameter that contributes to frequency stability. As an example, the change in the effective power output of the generator by droop coefficient was compared when the generator was eliminated within a simple system.
The graph in Figure 3 shows a comparison of the effective power output of the generator in the case of an accident in 1 s (red: 0, green: 20, yellow: 33.3, blue: 50, gray: 100) by varying the Dup coefficient of the renewable generator model at the same location in the test system. The red line has the lowest Dup coefficient of 0, and the output of the generator does not increase beyond 1 s, which is the point of occurrence of a random accident in the system. In this case, it is evaluated that it cannot contribute to the system frequency because UFLS may occur as the system frequency collapses before the reserve power resources are introduced. From the graphs of green, yellow, blue, and gray lines with increased Dup coefficients, it was confirmed that the output was continuously increased. Therefore, through this graph, it can be confirmed that the higher the Dup coefficient of the generator, the more it contributes to frequency recovery in the case of an accident in the system.
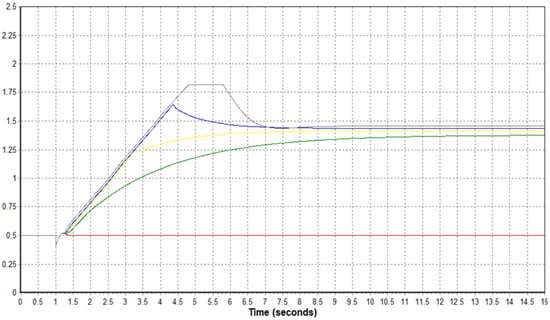
Figure 3.
Changes in the generator effective power output by D (Dup).
The technology standards linked to the transmission system of new and renewable generators are specified as shown in Table 4.

Table 4.
Frequency tracking operation setting range.
The above criteria allow renewable generators to react sensitively to the system by not following the system frequency to a minimum and generating the output as it is, but to adjust the output accordingly when the system frequency increases or decreases and the deadband is not set significantly. Table 5 shows a comparison with overseas cases [10].

Table 5.
Droop and deadband standard of overseas electric trust organization.
Domestic standards are similar to those of overseas. In the case of most solar generators or wind power generators that do not provide synthetic inertia, the insensitivity band is set to ±36 mHz in compliance with the above criteria, but Dup (the reciprocal of Droop under low frequency conditions) among Droops is designated as 0. This is because, according to the Droop coefficient, these generators can reduce the output during over-frequency but cannot increase the output in low-frequency situations. In addition, fuel cells are excluded from the standard of Table 4, which is the frequency-tracking standard within the technology standard linked to the transmission system of new and renewable generators revised in February 2024.
This presents the fuel cell as a rigid power source (a power generation source where increases or decreases in output are impossible, except for On/Off) [11]. In fact, at the beginning of the fuel cell generator’s connection to the system, high-temperature fuel cells are mainly used; so, fuel cells operating at 600 °C or higher are classified as rigid power sources. However, among low-temperature fuel cells, PAFC has an operating temperature of about 150 °C, and a response time of about 44 s. This is faster than the secondary reserve power operation (response within 10 min) and faster than the pumping-up power generation (3 to 5 min) with the fastest frequency control ability to secure the stability of the domestic system. Furthermore, the PEMFC-based fuel cell power plant, which is currently being commercialized, will be able to play a role of more than the faster primary reserve power (response time of 2–10 s) response time and quick response resource (maintaining the output for more than 4 h) as it is in charge of the engine of the hydrogen vehicle with an operating temperature of about 80 °C.
Therefore, the Ddn and Dup parameters of the fuel cell constituting the modeling were configured at 33.3 (output adjustment rate of 3%), and the fuel cell was modeled as one that adjusts the output within the technology standards linked to the transmission system of new and renewable generators. fdbd1,2, which represents the upper and lower threshold values of the frequency control insensitivity band, also corresponded to ±0.0006 (±36 mHz), which complies with domestic standards.
2.2. Water Electrolysis Model Configuration
Hydrogen energy is an important factor for sustainable energy conversion and has become a clean and efficient energy source. Hydrogen can be produced from a variety of energy sources, and in particular, water electrolysis facilities using renewable energy contribute greatly to the production of green hydrogen. A water electrolysis facility is a process of electrolyzing water into hydrogen and oxygen, and depending on the catalyst, it is largely classified into alkali electrolysis (AWE), polymer electrolyte membrane water electrolysis (PEMWE), and solid oxide water electrolysis (SOEC). Among them, in Korea, research on polymer electrolyte membrane water electrolysis in connection with renewable generators is being actively conducted, centered at the Energy Technology Research Institute.
Polymer electrolyte membrane water electrolysis (PEMWE) uses a polymer electrolyte membrane with a structure in which a sulfonic acid group is attached to a polymer chain as an electrolyte and reacts at a relatively low temperature, with a reaction temperature from 50 °C to 80 °C. It is considered suitable as a water electrolysis facility to address the volatility problem of renewable energy because it can produce high-purity hydrogen and has a relatively good stability even if power from renewable energy, which has a high reaction rate and fluctuates in voltage, is supplied.
The system connection of these water electrolysis facilities can solve the problem of highly volatile renewable energy, such as solar and wind power generators. In particular, in the case of Jeju Island, where many renewable generators are installed, the water electrolysis facility is installed to execute the curtailment, and if surplus power from renewable power sources is used for hydrogen production, the curtailment can be resolved and further linked to more solar and wind power facilities.
In the case of a water electrolysis facility, it is composed of PEMWE, which is easy to link with renewable energy. Currently, there are no regulations related to the system connection of water electrolysis facility, but standards for system connection will arise as the commercial operation of facilities expands in the future. In fact, research is underway not only on water electrolysis facilities but also on modeling, and a water electrolysis facility is considered a ‘Load’ within PSS/E. We will construct a model that models the power generated by renewable energy as a dynamic load that consumes but can respond to frequency. R. Zhang simulated the dynamic modeling of the overall load using a composite load model called CLOD [12]. Since this study only models the water electrolysis facility, it will consist of a model in which the load changes according to the increase or decrease in the frequency input to the bus called ‘LDFRBL’ as it is intended to construct a load contributing to the system frequency among the load dynamic models [10].
However, for close modeling in the existing water electrolysis facility, the facility capacity in the specification manual of famous overseas water electrolysis facility manufacturers, the Lamp Rate, was referenced. In fact, in the case of PlugPower’s facility ‘EX-2125D’ [13] and Siemens Energy’s facility ‘Elyzer P-3001’ [14], which are leading overseas water electrolysis facilities, the capacities are up to 5 MW and 17.5 MW, respectively, and the load follow-up of EX-2125D operates very quickly, from minimum load to maximum load for 60 s when ramping up, and less than 15 s when ramping down. The Elizer P-3001 can follow the frequency when connecting to the system, with both ramps up/down being around 10 s.
Based on the above evidence, a ‘LDFRBL’ model was constructed [15]. The parameters of the model are four (m, n, r, s). Among them, the expressions for the effective power and the input/output of the effective current are shown in Equations (2a) and (2b):
Among the parameters of the above model, in order to design a load model that contributes to the grid frequency, the parameters of the effective power (m), which is the index value of (2a), and the effective current (r), which is the index value of (2b), must be increased. In the case of P (effective power), if the current frequency () rises in relation to the reference frequency () 60 Hz in the system, the effective power absorbed by the load is increased according to the frequency sensitivity (m) to increase power consumption, and if the current frequency falls, the load is reduced to reduce power consumption, and the effective power, reactive power, effective current, and reactive current are all composed of the same formula. By configuring a model that operates in response to the grid frequency, it is possible to respond quickly to the fluctuating frequency [16].
2.3. Dynamic Stability-Index
There are two main factors to evaluate the stability of the power system. They are voltage stability and frequency stability, and these two stabilities are used to evaluate the stability of the system.
First, voltage stability refers to the ability to maintain the allowable voltage in all bus lines of the power system after disturbance. The factors that can lead to voltage instability include track drop and generator drop, but the voltage drop occurs at the load end due to voltage instability.
From the perspective of voltage when the generator is dropped, a voltage drop occurs in the surrounding bus due to a decrease in the supply of reactive power. On the other hand, when the line is dropped, the flow path of power is changed, and voltage drops and increases may occur within a specific region due to the redistribution of reactive power. Such voltage fluctuations are as shown in Equation (3) [17].
A voltage drop may occur in areas where reactive power was supplied through a track that was eliminated due to a change in the reactance of the track, and the voltage may rise if the overload is eliminated.
In the case of renewable generators, to protect the device and maintain the system connection, the standard for the system connection maintenance time at low/overvoltage in the transmission system connection in Section 2.1 of the linkage technology standard is specified [18]. The criteria are shown in Table 6 [6].

Table 6.
Power system voltage maintenance criteria.
As such, it can be confirmed that modeling that complies with the above criteria should be performed in that it maintains the connection and prevents serial accidents even if voltage fluctuations occur due to a disturbance in the system.
There are two main indices for frequency stability to determine whether it is possible to recover from frequency fluctuations caused by power generation and load imbalance, and they are the frequency change rate, RoCoF (Rate of Change in Frequency), and the lowest point (Nadir Point) [19,20]. In the case of RoCoF, the frequency that fluctuates rapidly at the time of the accident is quantified, and the equation is shown in (4) [21].
The larger the RoCoF, the more rapidly the frequency changes, and the lack of system inertia mentioned in Section 1: 2 causes the system frequency to plunge in the event of an accident, preventing the system from being stably maintained. In other words, since RoCoF is the rate of change in frequency over time, the larger the RoCoF, the greater the instability of the system. In summary, RoCoF and system inertia become inversely proportional.
In the case of overseas systems, where the ratio of new and renewable power sources based on inverters is high, RoCoF is high due to rapid frequency fluctuations because the system inertia is lowered in the power generation system. Accordingly, as shown in Table 7, standards for RoCoF are stipulated to prepare for rapid frequency fluctuations. And overseas, the standard in Equation (4) is generally defined as 0.2~0.5 [s].

Table 7.
International RoCoF standard.
The lowest frequency point is the lowest point at which the frequency drops due to generator dropout or other disturbances. It is important to increase the lowest frequency point because a lower frequency point may negatively affect the system reliability and economic feasibility, such as damage to facilities including generators connected to the system, disconnection of generators, voltage drop, and load cutoff.
This paper proposes a technique for selecting the optimal location of a fuel cell by considering both the voltage stability and frequency stability, which are generally classified and evaluated [22,23]. By calculating the voltage change rate () and frequency change rate through the line drop scenario, which is a dynamic simulation that determines the voltage stability in the system, we propose a Dynamic Stability-index () that contributes to both device protection by location and system frequency through voltage stability.
In the formula, for the same line fault, voltage change () and frequency change () in the event of a generator accident are calculated in units of [PU] to list the rankings, and the lower the index, the more integrated it can be used as an indicator that contributes to system stability (voltage stability, frequency stability). After calculation, the three best places will be selected by listing the lowest positions (bus lines) in the metropolitan area system, and the system frequency stability before and after fuel cell input will be compared to the existing renewable generator model.
3. Case Study
3.1. Water Electrolysis Model Simulation
It is possible to verify the hydro-electrolysis facility modeling that can contribute to the stable operation and reliability of the power system while confirming and supplementing the parameter setting problems through the input and simulation of the simulation system before the system input. The simulation system is constructed for verification, but the capacity of each facility is assumed to be slightly larger than the input capacity in the actual system so that the operation of the water electrolysis facility can be confirmed.
In this study, the power system test (25 bus) system provided by IEEE was used as the simulation system. The reason for using the IEEE test system is as a pre-procedure to better analyze the impact of output fluctuations and system frequencies on the model in the event of an accident before it is introduced in land or Jeju systems. In Figure 4, the fuel cell and water electrolysis facility are placed in the green and blue positions, respectively, and the position of the black box is selected as the observation bus. In this section, we will verify the water electrolysis facility modeling.
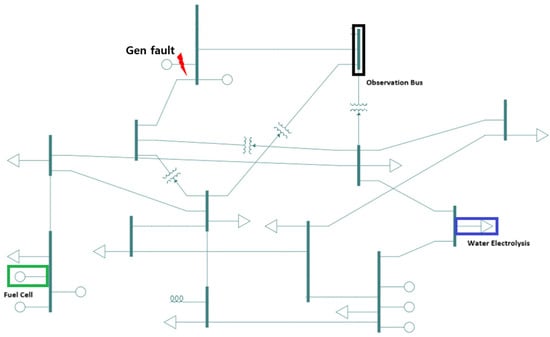
Figure 4.
IEEE 25 bus test system.
The simulation was conducted by assuming a generator failure (fault) scenario, and a complex scenario was briefly expressed through the flowchart in Figure 5.
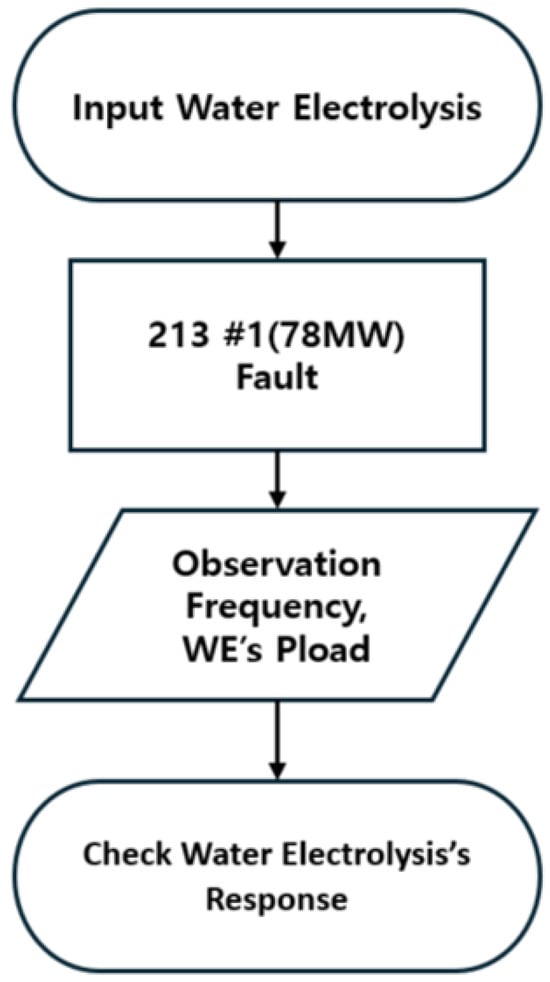
Figure 5.
Water electrolysis test scenario.
In the case of the water electrolysis load facility, it was composed of 92.5 MW, and the margin to increase or decrease the load was confirmed. The dynamic modeling of the water electrolysis facility was carried out by inputting it to one load. The location of the facility model was selected as the load on the bus shown in Figure 4. The channel to observe the results of this simulation compared the frequency of the observed bus, the general load, and the variation in the absorption of the effective power of the water electrolysis load. The results are shown in Figure 6.
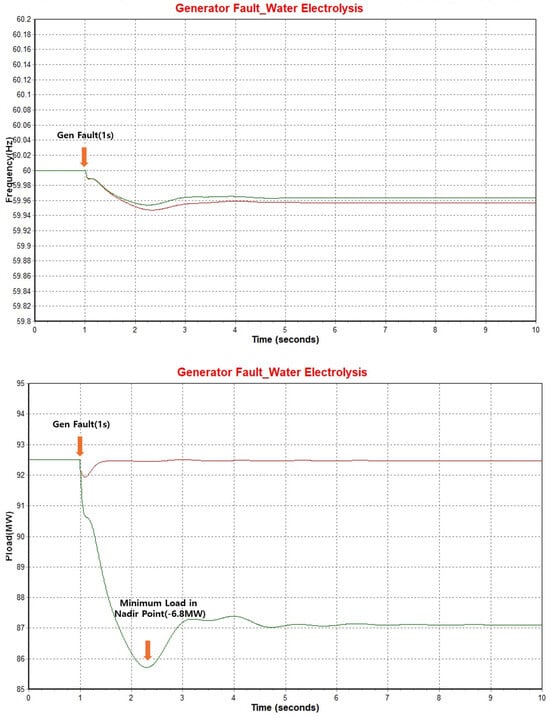
Figure 6.
Power system frequency and water electrolysis active power load variation in the simulation system scenario.
In the frequency graph in Figure 6, the lowest frequency of the water electrolysis load (green line) was 59.95 Hz, which was observed to be slightly higher than that of the system with the general load (red line). This is because, in the case of the water electrolysis equipment, in order to contribute to the system frequency as a load, it is necessary to contribute to frequency recovery by reducing the load (demand) according to the falling supply in the event of a generator dropout accident.
In the load change graph in Figure 6, it is possible to confirm the load changes in the general load and the water electrolysis load model. The water electrolysis load (green line) reduced the load immediately after the generator was dropped, and when the frequency point reached the Nadir Point, it decreased by 6.8 MW from the existing load of 92.5 MW to 85.7 MW. The perturbation in the modeling of the water electrolysis facility in the event of a generator failure was confirmed.
In the event of a track drop-off, another system accident, as mentioned at the beginning of Section 1, there is no significant change in the effective power of the system. Therefore, no clear change can be observed in small systems (e.g., test system, abbreviated system). Since the focus of this study is on observing and contributing to the frequency, the track drop-off accident will only be carried out in the actual land system. If the voltage fluctuates greatly in the event of an accident and does not converge, the stability of the system will be considered so that the devices, including the generators in the system, do not demodulate the system for facility protection.
In conclusion, when linking the simulation within the simulation system to the system of the water electrolysis facility, the type of response due to the failure of the generator and the fall of the track, which are accidents to be explained later, was confirmed to contribute to the frequency in the process.
The power system of Jeju Island was abbreviated, and the water electrolysis facility was introduced into a dynamic load model, and the effect in the event of disturbance was checked and compared to the existing load model.
In order to solve the curtailment, which is a problem of the power system in Jeju, the input of a water electrolysis facility responding to the system frequency was simulated. In the case of Jeju, the increase in the number of curtailment has been evaluated as the most considerable problem of the Jeju power system, and the role of hydrogen acting as an energy carrier is becoming important to achieve CFI (carbon-free island) status in 2030 [24]. Therefore, many hydrogen production facilities are required, and the increase in water electrolysis facilities is indispensable.
In this simulation, the power system in Jeju was abbreviated in the form shown in Figure 7, and the ‘LDFRBL’ model was introduced into the load. The reason for the abbreviation of the Jeju system is that the system would be very complex and the impact on water electrolysis facilities would be insufficient. Therefore, it was intended to maintain the position of major generators (including HVDCs) and their loads and to secure the reliability of meaningful results by using a contraction system tailored to the actual operation performance of the Jeju area. The total load of this system was 1.09 GW, which is equivalent to the peak load level in Jeju, and the generator was set to six units including a Swing generator (including HVDC). The parameters of the effective power (m) and effective current (r) affecting the frequency were set to 10, and a dynamic model was introduced into a 50 MW load (blue box) near Jocheon, where the actual demonstration operation of the green hydrogen production facility has been in effect since 2023.
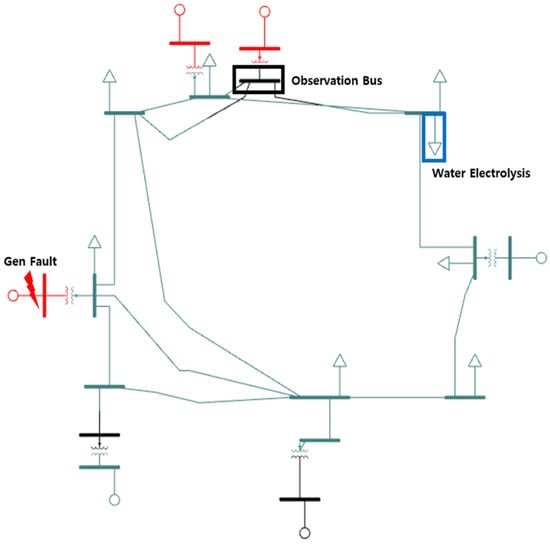
Figure 7.
Jeju abbreviated power system.
The simulation of this water electrolysis facility perturbation scenario is shown in Figure 8 as a flowchart. The scenario was assumed to drop out the 150 MW class generator in one second, and the scenario was carried out as it was judged that the model that responded to the frequency in the system that would operate as a large power generation equivalent to about 14% of the above system was eliminated.
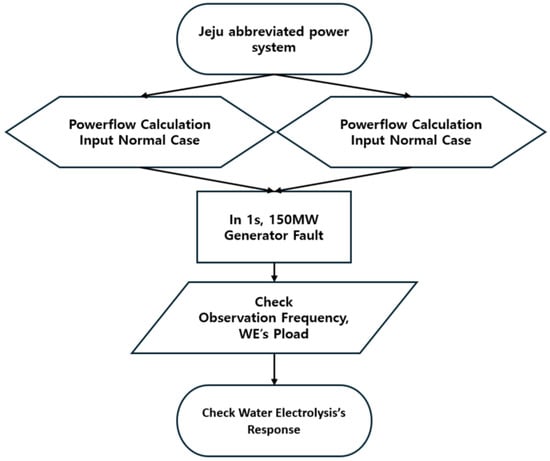
Figure 8.
Analysis of the water electrolysis impact of the Jeju scenario.
In the scenario in Figure 8, the western generator (150 MW class) in Figure 7 was eliminated, and in Figure 9, the system frequency in the observation bus and the change in the effective power load of the water electrolysis installation simulation load were compared.
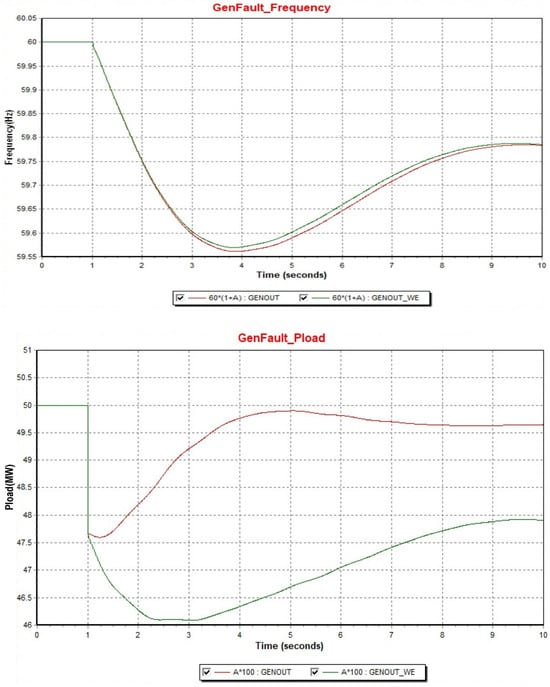
Figure 9.
General load system vs. water electrolysis load system in the case of a generator fault in the Jeju scenario.
In Figure 9, the lowest frequency point (Nadir Point) of the Jeju system, which is linked to the water electrolysis load model (green line) that responds to the frequency, decreases slightly when the generator is dropped. The cause can be confirmed in the graph below, and the two loads temporarily reduce the load at the time of the accident, but in the case of the general load (red line), it increases again and does not contribute to the system frequency recovery, whereas in the case of the water electrolysis load model (green line) that responds to the frequency, it is confirmed that the load is reduced to a maximum of 3.43 MW compared to the general load while decreasing the load until the frequency drop decreases. To check the frequency stability, the RoCoF and Nadir Point of NL (normal load) system and WE (Water Electrolysis) system were compared, as shown in Table 8.

Table 8.
Comparison of the RoCoF, Nadir Point to the general load system, and water electrolysis system in the case of a generator fault.
In Table 8, it was confirmed that the water electrolysis facility model responding to the frequency was fine when introduced into the system, but RoCoF and Nadir Point decreased.
3.2. Fuel Cell Model Simulation
In this section, prior to the actual land system input, a fuel cell responding to a frequency is input into the green box in the simulated system of Figure 4 and the system frequency contribution with a general renewable generator is compared. In Section 1, the same accident as the perturbation test of the hydro-electrolysis facility in the simulated system is assumed and the frequency of the observed bus and the effective power output of the generator are compared to the observed channel.
In the case of a generator accident, if a generator with an excessively large generation capacity is eliminated, there is a risk that the system itself will collapse; so, a scenario in which one 78 MW class generator is eliminated from 1 s was envisioned, as shown in Figure 10.
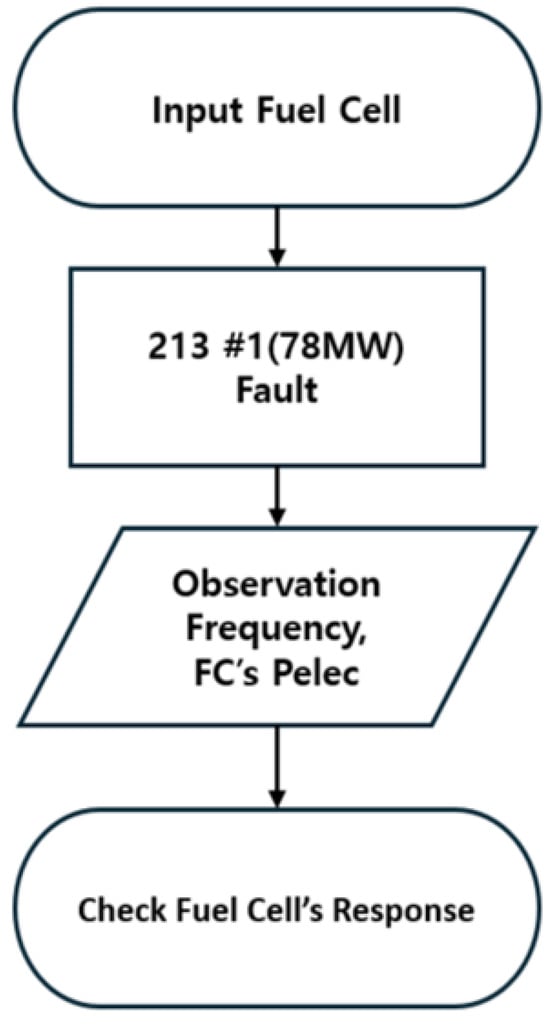
Figure 10.
Fuel cell model test scenario.
In order to confirm the increase in the output of the fuel cell, the initial output Pgen was set to 79 MW, and the maximum effective power value Pmax was set to 100 MW. In the scenario, the grid frequency at the observation bus 212 and the change in the active power output (Pelec) of the fuel cell were checked, and the results are shown in Figure 11.
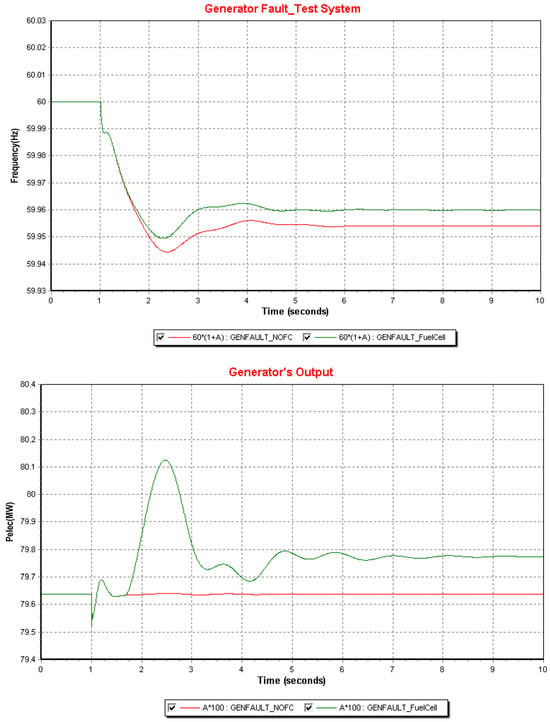
Figure 11.
Graph of the system frequency and fuel cell effective power in the test scenario.
As mentioned above, since it is not an accident at the level of collapsing the system, the Nadir Point of the system (green line) connected to the fuel cell was observed to be 59.95 Hz. However, it was confirmed that, instead of the fuel cell, the system (red line) connected to other renewable generators that do not respond to the frequency caused differences in the frequency drop and recovery. And looking at the effective power output graph of the two generators, it can be seen that the output falls at the time of the first accident. This temporarily decreases the voltage of the bus to which the renewable generator, including the fuel cell, is connected at the time of the accident, thereby increasing the output of the reactive power (Q), and the effective power (P) temporarily decreases according to Equation (6) [25].
In the case of fuel cells and existing renewable generator models, the effective power temporarily decreases but quickly increases again and reaches the lowest point of the frequency, and it can be seen that the effective power reaches 80.1 MW, an increase of about 0.5 MW in normal time. The speed operation of other synchronous generators did not require the fuel cell to cover all the generating power of the failed generator, but this simulation confirmed that the fuel cell responds to the frequency in the event of a disturbance in the system. In fact, after selecting the optimal location among the locations where the fuel cells can be introduced into the 10th electric-based land system, the impact of the existing system and the fuel cell in the event of an N−2+a serial generator accident in the existing system was compared.
The simulation within the land system was carried out in the summer load peak system in 2024 based on the ‘10th Basic Power Supply and Demand Plan’. In the system, 1347 generators (15% of spare power) including distributed power sources (including 10 kW units) connected to the distribution system and 98.6 GW of total load are distributed.
In order to analyze the effect of the fuel cell within the actual land system, the procedure of selecting the optimal location to be installed in the system was first performed. In order to select the optimal location, we tried to calculate the (dynamic stability index) mentioned in Section 2. The arbitrarily selected 24 bus lines in the Gyeonggi area where fuel cells will be installed performed the same accident within them and tried to derive a value and calculate a ranking. The accident was assumed to be a flexible line with the largest amount of power flowing to the metropolitan area, and a second line dropout accident was assumed. The line to be dropped was selected as 1020 (Sinpgayeong7), one of the 765 kV lines in the metropolitan area, and second-line dropouts (fault removal after five cycles).
When the 765 kV line 2 is eliminated, two nuclear power plants (Hanul #5, Shin Hanul #1) are eliminated by performing the SPS (Special Protection System) protection operation after four cycles (0.667 s) after removing the failure to protect the system. The operation of the SPS was included in the simulation. The fuel cells to be simulated were distributed power sources, and 24 out of 22.9 kV bus lines in the metropolitan area were selected for the purpose of satisfying the power demand in the metropolitan area and connected to the actual 22.9 kV system after manufacturing the dummy bus in the form of Figure 12.
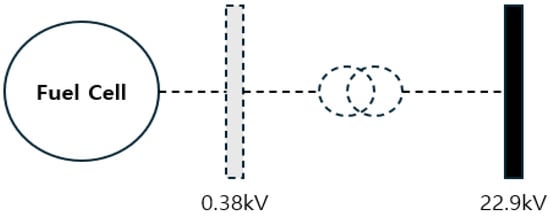
Figure 12.
Fuel cell linkage scenario by the dummy bus.
Based on the above explanation, the DS-i calculation procedure is shown in Figure 13.
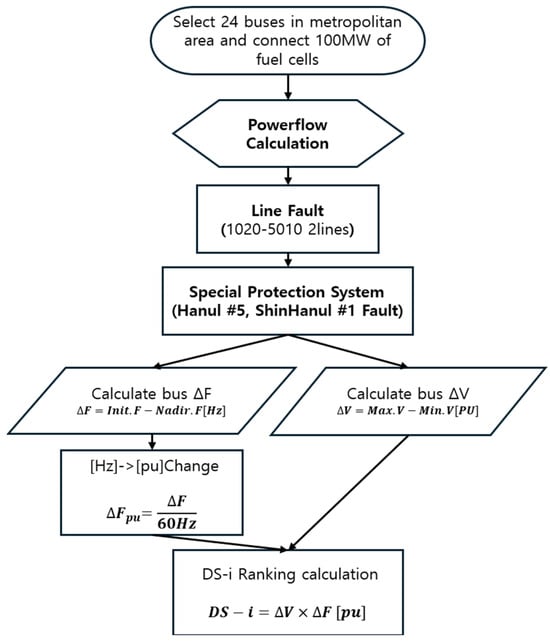
Figure 13.
DS-i calculation procedure.
In this way, the same accident occurred, and the results of observing the voltage of the dummy bus in the event of an accident are shown in Figure 14. The rankings for each voltage change in the graph above are summarized in Table 9.
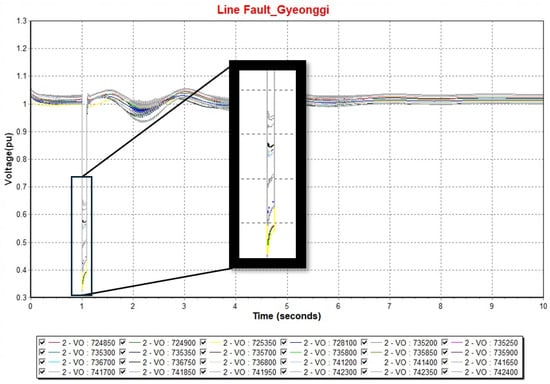
Figure 14.
Graph of the bus voltage linked to fuel cells when the line (1020-5010) is faulty.

Table 9.
Ranking of changes in bus voltage linked to fuel cells when the line (1020-5010) is faulty.
Therefore, as a result of the above, the bus that is the most stable to protect the device when linking the system is the 741650 bus. After listing the rankings in the above manner, the frequency fluctuation at each dummy bus was confirmed in the case of the same accident. In this accident, since there is no change in the total effective power in the system and the short time frequency fluctuates, the difference between the initial frequency (Init. Frequency) and the lowest frequency (Nadir Point) was compared and recorded as Δ Frequency, and the results are shown in Figure 15 and Table 10.
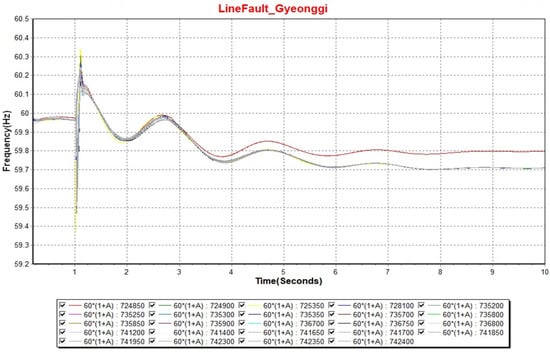
Figure 15.
Fuel cell bus frequency graph when line (1020-5010) is faulty.

Table 10.
Ranking of fuel cell bus when line (1020-5010) is faulty.
In this way, ΔV and ΔF were calculated through the track dropout accident. Finally, as in the last column of Table 10, the results of unifying ΔF in units of [PU] and listing it as DS-i (dynamic stability index) are shown in Table 11.

Table 11.
DS-i ranking in the metropolitan area.
The lower the bus voltage and frequency fluctuations are, the smaller the voltage fluctuation and frequency fluctuation in the bus, so that output fluctuations in the event of disturbance in the system may contribute to the device protection of the power facility that contributes to the power system frequency. Therefore, using the above index, fuel cells will now be introduced into the top three bus lines (735850 (Sunggok), 736750 (Jungsihwa), and 736700 (Sihwa)), which have the lowest dynamic stability index.
The presumptive accident compares the system frequency fluctuations caused by the N − 2 + a generator fault accident, which is a generator accident in which the effective power in the system is directly reduced, compared to the case where a general renewable generator model and a fuel cell are linked.
Since the fuel cells were introduced into the system where the existing fuel cell model was not installed, three fuel cells capable of outputting effective power up to 100 MW for Pgen and 150 MW for maximum output were introduced into the three lower bus points after a reduction of 300 MW for the photovoltaic generator of the same output. Two nuclear power plants and the additional generators were eliminated in a chain, and the eliminated generators were Saeul Nuclear Power Plant #1 and #2 located in Ulsan, which is an important nuclear power plant that generates 2.8 GW of total effective power. One second after the above plant was removed, the failure scenario frequency of the system with added fuel cells and the existing system was designated as the observation bus, as shown in Figure 16.
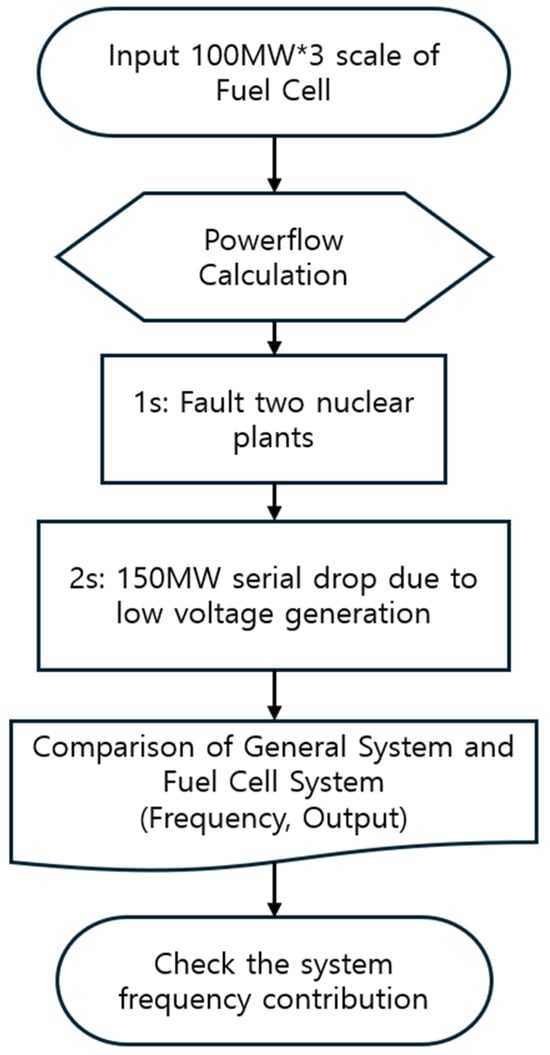
Figure 16.
General power system vs. fuel cell power system when there is a generator fault.
In the graph of Figure 17, two nuclear power plants (Saeul #1 and #2) were eliminated in one second, temporarily shortening the effective power of 2.8 GW (2.84% of the effective power of this system), and the system frequency decreased. Therefore, it was out of the system normal frequency (60 ± 0.2 Hz), but in the case of the frequency (green line) of the system in which 300 MW of the fuel cell was input, the frequency drop was significantly lower than the system (red line) in which 300 MW of the conventional photovoltaic generator was input. Based on Figure 17, the analysis was performed using RoCoF and Nadir Point, the power system frequency stability evaluation criteria. In the case of RoCoF, RoCoF was calculated as 0.5 s using the equation. In the case of the lowest frequency point, the lowest frequency point was measured when performing the dynamic simulation for 10 s in which the simulation was performed, and the difference is shown in Table 12.
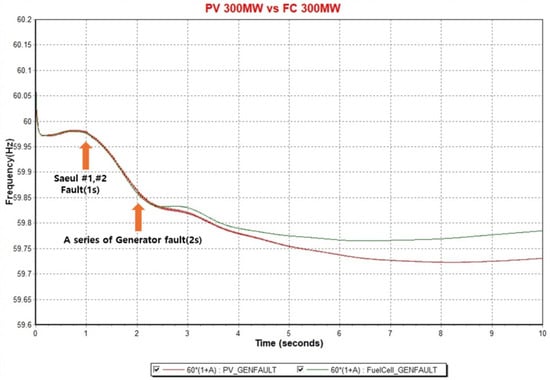
Figure 17.
Power system frequency when there is a generator fault.

Table 12.
Comparing RoCoF and Nadir Point of the general renewable generator model vs. fuel cell model when the generator is faulty.
As a result, it could be confirmed that the system in which the fuel cell was introduced had a 0.003 Hz/s drop in RoCoF and 0.042 Hz increase in frequency Nadir Point, and the system frequency became more stable.
Figure 18 shows the change in the effective power output of the three fuel cells installed in the metropolitan area in the event of an accident. In the graph of Figure 17, it was also confirmed that the fuel cell briefly reduced the active power to maintain the voltage immediately after the N-2 accident and then increased the output like other synchronous generators in the situation where the generator is faulty.
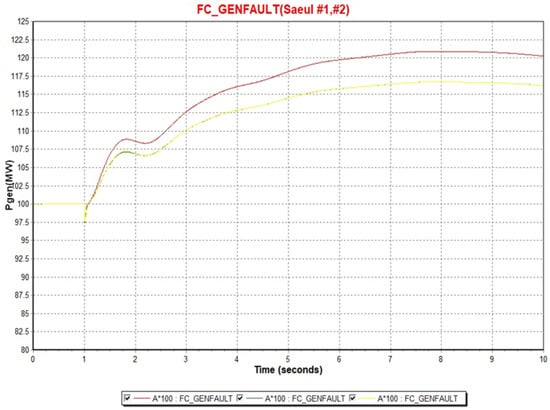
Figure 18.
Fuel cell active power output change when there are generator faults.
4. Conclusions
This paper proposed a fuel cell/water electrolysis system as a key factor that can solve problems in the power system in the current energy conversion process from the power generation system to carbon neutrality. Technological improvements are needed, but fuel cells and water electrolysis facilities will increase in the future within the system. The general purpose model that can be used in the power system analysis program was modeled based on the device data according to the actual criteria, as the impact on the system will increase due to the increase in fuel cells and water electrolysis facilities in the context of the policy and environmental foundation.
Currently, fuel cells are considered a rigid power source within the technical standards associated with the transmission system of renewable generators, and the frequency-tracking criteria are also relaxed compared to other renewable power sources. However, because low-temperature fuel cells, such as PAFC and PEMFC, are sufficiently capable of responding to the frequency, some of the parameters were changed in the general purpose model to model the response to the primary reserve power level comparable to that of FR-ESSs. In the case of water electrolysis systems, since there is currently no system connection standard, we used a load model that can respond to the frequency. As a basis for supporting the reactivity of the water electrolysis facility, the parameters were prepared by referring to the Ramp Rate in the PEMFC specification manual of Plugpower and Siemens Energy.
In order to confirm the operation of the above two models, the IEEE 25 bus system was used to confirm the operation of the generator in the case of failure. The reason for using the IEEE test system is that it is a preliminary procedure to better analyze the output fluctuations in the event of an accident before being introduced into the actual land or Jeju system and the influence of the system frequency by the model. Responding to both accidents, we completed the frequency contribution verification and presented the dynamic stability index that encompasses the stability of the power system (voltage stability, frequency stability) before introducing it into the actual system (Jeju Abbreviated System, Land System). We introduced the water electrolysis facility into the demonstration operating location of the Jeju Abbreviated System and conducted the accident within the system. (The impact may differ slightly as it cannot have 100% accuracy while accumulating.) In addition, we compared RoCoF and Nadir Point with the general load system that contributes to the system frequency by increasing or decreasing the effective power absorption of the hydro-electrolysis load.
Based on the 2024 summer load peak system, three bus lines were selected by calculating the dynamic stability index using the dropout of the flexible line at the location where the fuel cell to be used as a distributed power source in the metropolitan area. These buses are the ones that help protect the equipment of the power assistance system, which will respond flexibly in the event of an accident in the power system. Then, 100 MW of fuel cells were introduced into each of the above three busbars to be used as distributed power sources.
An N − 2 + a accident occurred in which two nuclear power plants and nearby photovoltaic generators were removed. This is a dangerous accident within the system, which is a level that can check the output fluctuations in fuel cells as well as power aids in a robust power system. In the event of this accident, the frequency of the system linked to the general renewable generator and the system with the fuel cells installed on three bus lines were checked. As a result, it was confirmed that it contributed to the frequency stability (RoCoF, Nadir Point) compared to the system in which the existing renewable generator model was introduced. However, it was clear that the points to be supplemented in this study and subsequent studies were confirmed.
First, it is judged that a more detailed modeling of fuel cells and water electrolysis facilities is necessary. The model currently proposed by the authors focuses on frequency perturbation based on actual data, but if detailed internal specifications are adjusted through dialogue with current workers, it will be able to contribute not only to frequency but also to various aspects of the power system.
Second, in Table 11, which calculates the dynamic stability index presented by the author, ΔF is located in the third decimal place, but ΔV is located in the first decimal place; so, the gap between the two data is large. Therefore, it is judged that a correction value considering the importance of ΔF is necessary.
Third, the basis is still poor compared to the existing voltage stability and frequency stability techniques. The voltage and frequency of the same bus are measured and calculated at the same track drop-off accident, but it is necessary to verify the accuracy of the above index based on more calculation examples and mathematical grounds in consideration of the regional characteristics of voltage and the overall system characteristics of frequency. Based on this, supplementing the above index and using it as an index to select the installation location of the power system auxiliary equipment will contribute to planning a reasonable power system operation plan.
Further research should improve the problems pointed out above. Also there are still a number of technical challenges for fuel cells and water electrolysis systems to make an ideal contribution to frequency in the system. However, research on improving fuel cell lifespan and response speed is currently underway, and a large-scale hydrogen production complex will be established in Jeju by 2026.
Therefore, it is expected that future studies will be able to conduct research that proposes a hydrogen system that improves voltage stability in the real system and plays the role of virtual inertia based on more improved models in PSS/E.
Author Contributions
Methodology, J.L.; Investigation, G.K.; Writing—original draft, Y.J.; Writing—review & editing, S.H. All authors have read and agreed to the published version of the manuscript.
Funding
This work was supported by the Gachon University research fund of 2020 (GCU-202008450007) and the Korea Institute of Energy Technology Evaluation and Planning (KETEP) and the Ministry of Trade, Industry & Energy (MOTIE) of the Republic of Korea (No. 20223A10100030).
Data Availability Statement
The original contributions presented in this study are included in the article. Further inquiries can be directed to the corresponding author.
Conflicts of Interest
The authors declare no conflict of interest.
Correction Statement
This article has been republished with a minor correction to the Funding statement. This change does not affect the scientific content of the article.
Abbreviations
The following abbreviations are used in this manuscript:
| IPPs | Independent Power Producers |
| KEPCO | Korea Electric Power Corporation |
| FERC | Federal Energy Regulatory Commission |
| ERCOT | Energy Reliability Council of Texas |
| CAISO | California Independent System Operator |
| PJM | Pennsylvania, New Jersey, and Maryland |
| IESO | Independent Electricity System Operator |
| AWE | Alkaline Water Electrolysis |
| SOEC | Solid Oxide Electrolysis Cell |
| PEMWE | Polymer Electrolyte Membrane Water Electrolysis |
| DS-i | Dynamic Stability Index |
| RES | Renewable Energy Source |
References
- KEPCO. Monthly Electricity Statistics for July 2024. Available online: https://home.kepco.co.kr/kepco/KO/ntcob/ntcobView.do?pageIndex=1&boardSeq=21068267&boardCd=BRD_000097&menuCd=FN05030101&parnScrpSeq=21061361&categoryCdGroup=®DateGroup1= (accessed on 9 March 2025).
- Lee, J. A Study on the Selection of FR-ESS Installation Locations with Maximum Frequency Response in Case of Contingency Failure Using Active Power Sensitivity. Master’s Thesis, Gachon University Graduate School, Seoul, Republic of Korea, 2023. Available online: https://dl.nanet.go.kr/search/searchInnerDetail.do?searchType=INNER_SEARCH&resultType=INNER_SEARCH_DETAIL&searchMehtod=L&searchClass=S&controlNo=KDMT12023000027765&queryText=%EC%9D%B4%EC%A2%85%ED%9B%88%3AALL_NI_TOC%3AAND&prevQueryText=%EC%9D%B4%EC%A2%85%ED%9B%88%3AALL_NI_TOC%3AAND&zone=ALL_NI_TOC&fieldText=&prevPubYearFieldText=&languageCode=&synonymYn=&refineSearchYn=N&ddcPopSearchYn=&pageNum=&pageSize=&orderBy=&topMainMenuCode=KDMT_ALL&topSubMenuCode=KDMT&totalSize=4250&totalSizeByMenu=337&seqNo=&hanjaYn=Y&knowPub=&isdb=&isdbsvc=&tt1=&down=&frgnLangMtrlYn=N&targetLangCode=&checkedDbIdList=&baseDbId=&selectedDbIndexIdList=&caller=&asideState=&dpBranch=ALL&journalKind=&selZone=ALL_NI_TOC&searchQuery=%EC%9D%B4%EC%A2%85%ED%9B%88 (accessed on 9 March 2025).
- Lee, J.; Han, S.; Lee, D. Optimizing the Location of Frequency Regulation Energy Storage Systems for Improved Frequency Stability. Batteries 2023, 9, 592. [Google Scholar] [CrossRef]
- Park, B.H.; Choi, J.Y.; Choy, I.; Lee, S.C.; Lee, D.H. Fuel Cell Modeling with Output Characteristics of Boost Converter. J. Korean Sol. Energy Soc. 2014, 34, 91–97. Available online: https://www.dbpia.co.kr/journal/articleDetail?nodeId=NODE10499327&language=ko_KR&hasTopBanner=true#none (accessed on 9 March 2025). [CrossRef]
- Kwon, D.; Kim, Y.; Moon, S.; Kim, C. Modeling of HVDC System to Improve Estimation of Transient DC Current and Voltages for AC Line-to-Ground Fault—An Actual Case Study in Korea. Energies 2017, 10, 1543. [Google Scholar] [CrossRef]
- KPX, Annual Performance of Power System Operation in Jeju Island in 2023. 2024. 03. Available online: https://epsis.kpx.or.kr/epsisnew/selectEkifBoardList.do?menuId=080200&boardId=020000 (accessed on 9 March 2025).
- KEPCO. Management Research Institute, KEMRI Electricity Economy REPORT July 2022. Available online: https://home.kepco.co.kr/kepco/KR/ntcob/ntcobView.do?pageIndex=3&boardSeq=21058034&boardCd=BRD_000271&menuCd=FN3120&parnScrpSeq=0&searchCondition=total&searchKeyword= (accessed on 9 March 2025).
- Ministry of Trade, Industry and Energy. Working on 11th Basic Electricity Supply and Demand Plan; SHIN & KIM LLC: Seoul, Republic of Korea, 2024. Available online: https://www.motie.go.kr/kor/article/ATCL3f49a5a8c/169132/view (accessed on 9 March 2025).
- Choi, W.Y.; Jo, G.R.; Lee, J.H.; Kook, K.S.; Choi, I.K. An Impact Study of the Grid-Code based Frequency Response from RES on the Frequency Responsive Characteristics of the Power System; The Korean Institute of Electrical Engineers: Seoul, Republic of Korea, 2020; pp. 292–293. Available online: https://www.dbpia.co.kr/journal/articleDetail?nodeId=NODE10440173 (accessed on 9 March 2025).
- Jung, J. A Study on the Evaluation of System Inertia Impact and Stability Improvement Plan According to Renewable Energy Expansion. Trans. Korean Inst. Electr. Eng. 2021, 70, 1263–1273. Available online: https://www.dbpia.co.kr/journal/articleDetail?nodeId=NODE10602052 (accessed on 9 March 2025). [CrossRef]
- KEPCO. Renewable Energy Technical Connection Code for Transmission Level. 2024. Available online: https://online.kepco.co.kr/TEM110D00 (accessed on 9 March 2025).
- Zhang, R.; Xu, Y.; Dong, Z.Y.; Wong, K.P. Measurement-based dynamic load modeling using time-domain simulation and parallel evolutionary search. IET Gener. Transm. Distrib. 2016, 10, 3893–3900. Available online: https://www.researchgate.net/publication/305627216_Measurement-based_Dynamic_Load_Modeling_using_Time-Domain_Simulation_and_Parallel-_Evolutionary_Search (accessed on 9 March 2025). [CrossRef]
- PlugPower. The Plug Ex-2125D. Available online: https://www.plugpower.com/wp-content/uploads/2021/10/EX-2125D_F041122.pdf (accessed on 9 March 2025).
- Siemens Energy. Hydrogen and Power-to-X Solutions. Available online: https://p3.aprimocdn.net/siemensenergy/3baa4ffa-f1f1-422f-a770-b08300c0f2b0/Datasheet-Silyzer300-pdf_Original%20file.pdf (accessed on 9 March 2025).
- Siemens. Model Library PSS®E 34.9.0, 495. Available online: https://www.siemens.com/global/en/products/energy/grid-software/planning/pss-software/psse-model-library-download-request.html (accessed on 9 March 2025).
- Youssef, A.R.; Mallah, M.; Ali, A.; Shaaban, M.F.; Mohamed, E.E. Enhancement of Microgrid Frequency Stability Based on the Combined Power-to-Hydrogen-to-Power Technology under High Penetration Renewable Units. Energies 2023, 16, 3377. [Google Scholar] [CrossRef]
- Kundur, P. Power System Stability and Control; McGraw Hill: New York, NY, USA, 1994; Available online: https://dl.poweren.ir/downloads/PowerEn/Book/2019/Jun/Power%20System%20Stability%20and%20Control%20-%20Prabha%20Kundur%20%28PowerEn.ir%29.pdf (accessed on 9 March 2025).
- Hosseini, S.E.; Wahid, M.A. Hydrogen production from renewable and sustainable energy resources: Promising green energy carrier for clean development. Renew. Sustain. Energy Rev. 2016, 57, 850–866. [Google Scholar] [CrossRef]
- Muhammed, Y. Worku, Islanding Detection Methods for Microgrids: A Comprehensive Review. Mathematics 2021, 9, 3174. [Google Scholar] [CrossRef]
- Li, H. Power system frequency nadir prediction based on data-driven and power-frequency polynomial fitting. Front. Energy Res. 2024, 12, 1501181. [Google Scholar] [CrossRef]
- Fransico, G. Investigation of Inertia Response and Rate of Change of Frequency in Low Rotational Inertial Scenario of Synchronous Dominated System. Electronics 2021, 10, 2288. [Google Scholar] [CrossRef]
- Das, P. Frequency Fluctuation Mitigation in a Single-Area Power System Using LQR-Based Proportional Damping Compensator. Energies 2023, 16, 4804. [Google Scholar] [CrossRef]
- Guo, X. Multi-Time Scale Energy Storage Optimization of DC Microgrid Source-Load Storage Based on Virtual Bus Voltage Control. Energies 2024, 17, 5626. [Google Scholar] [CrossRef]
- Kang, Y. Predictions for Power Control in New Renewable Energy and Policy Perspectives of Green Hydrogen P2G under CFI 2030. Asia-Pac. J. Bus. Commer. 2024, 16, 3–28. [Google Scholar] [CrossRef]
- Saadat, H. Power System Analysis; McGraw Hill: New York, NY, USA, 1999; Available online: https://elearn.daffodilvarsity.edu.bd/pluginfile.php/1147551/mod_book/intro/eee333-book-hadi.pdf (accessed on 9 March 2025).
Disclaimer/Publisher’s Note: The statements, opinions and data contained in all publications are solely those of the individual author(s) and contributor(s) and not of MDPI and/or the editor(s). MDPI and/or the editor(s) disclaim responsibility for any injury to people or property resulting from any ideas, methods, instructions or products referred to in the content. |
© 2025 by the authors. Licensee MDPI, Basel, Switzerland. This article is an open access article distributed under the terms and conditions of the Creative Commons Attribution (CC BY) license (https://creativecommons.org/licenses/by/4.0/).