Article

Coupling Effects of Microstructure Characteristics on Stress Distribution for Pore-Scale Gas Diffusion Layers

1
Faculty of Maritime and Transportation, Ningbo University, Ningbo 315211, China
2
Automobile Technology and Service College, Wuhan City Polytechnic, Wuhan 430064, China
*
Authors to whom correspondence should be addressed.
The authors contribute equally to this work.
Energies 2025, 18(7), 1561; https://doi.org/10.3390/en18071561
Submission received: 10 February 2025 / Revised: 9 March 2025 / Accepted: 14 March 2025 / Published: 21 March 2025
(This article belongs to the Special Issue Advances in Fuel Cells: Materials, Technologies, and Applications)

Abstract

:
A gas diffusion layer (GDL) is an essential component for the efficient operation of proton exchange membrane fuel cells, requiring stable mechanical strength and uniform stress distribution to achieve higher durability. The various microstructure characteristics of GDLs have coupled and complex effects on mechanical properties, which have not been fully considered in previous studies. In this study, we have combined stochastic reconstruction techniques, explicit dynamics compression simulation, and orthogonal design methods to evaluate and optimize the coupling effects of carbon fiber diameter, porosity, GDL thickness, and fiber orientation coefficient on the mechanical properties of pore-scale GDLs. Finally, mathematical expressions have been developed to predict stress distribution under compression. The results show that the impact of fiber diameter and porosity is greater than that of GDL thickness and fiber orientation coefficient. Average stress and stress uniformity increase with increases in fiber diameter, fiber orientation coefficient, and GDL thickness, but porosity shows an opposite trend. We achieved a remarkable reduction of 292% in optimal average stress and a significant enhancement of 278% in stress uniformity. The mathematical expressions have been validated for accuracy by considering the simultaneous coupled effects of various microstructural characteristics. This work provides valuable engineering tools for enhancing the performance and durability of GDLs and fuel cells.

1. Introduction

Proton exchange membrane fuel cells (PEMFCs), as an efficient and clean energy conversion technology [1,2], have attracted widespread attention. The gas diffusion layer (GDL), as a crucial component affecting the performance of PEMFCs [3], is composed of carbon fiber, binder and PTFE. The diameter of carbon fiber ranges from 6 to 10 μm. The GDL is primarily used to manage the transport of hydrogen and oxygen [4], providing pathways for the conduction of electrons and heat [5], while simultaneously offering mechanical support to the internal membrane [6]. However, under clamping forces, the GDL undergoes significant stress and deformation due to the relatively low Young’s modulus in the thickness direction [7]. This stress and deformation directly affect the gas–liquid transport and thermal–electric conduction inside the GDL, thereby further altering the ultimate output performance of the fuel cell stack [8,9]. Consequently, characterizing and quantifying the mechanical behavior of the GDL and designing an appropriate microstructure of a GDL hold paramount significance for the optimization of PEMFCs.
Typical microstructural characteristics of the GDL include carbon fiber diameter [10], porosity, thickness, probability distribution of fiber orientations, PTFE content, and adhesive content [11,12,13]. Among these, fiber diameter, bulk porosity, thickness, and probability distribution of fiber orientations have a significant impact on the stress distribution of GDLs under compression, exerting substantial effects on the overall performance of fuel cells [14,15]. Sylvie Escribano et al. [16] concluded that minimizing the pressure applied to GDLs is crucial for reducing mass transfer losses at high current densities and low voltages. Jie Zhang et al. [17] investigated the effect of uniformity of contact pressure on cell performance for single and multi-cells, and the results showed that the more uniform the contact pressure is, the more favorable it is for the internal chemical reaction of the fuel cell. Among them, the stress concentration is mostly found at the corners of the GDL. Therefore, exploring the impact of different microstructural characteristics on the mechanical behavior of pore-scale GDLs holds immense significance.
Recently, X-ray computed tomography (X-CT) was employed to investigate the microstructural characteristics of the GDL [18,19]. For instance, Tötzke et al. [20] utilized XCT to observe the microstructure changes of a GDL under different compression loads. James et al. [21] and Kotaka et al. [22] reconstructed the microstructure of a compressed GDL using XCT and analyzed the impact of compression on transport properties. The results indicate that non-uniform compression significantly affects the performance of GDLs. Banerjee et al. [23] utilized XCT to study the influence of compression on the dual-layer GDL structure and its porosity distribution. Zenyuk et al. [11] employed XCT to investigate the pore size distribution, porosity, and tortuosity of several GDLs under different compression ratios. Although direct observation of the GDL microstructure is convenient and accurate, the time and money required for XCT is relatively high. Therefore, many studies combine XCT with simulation techniques to investigate the relationship between GDL microstructure and compression behavior. For instance, Xiao et al. [24] combined XCT with compression simulations to investigate the effects of different microstructural characteristics on the stress distribution of pore-scale GDLs.
However, some simplifications and assumptions have been made in the compression simulation of other studies. Espinoza et al. [25] and Schulz et al. [26] developed a voxel displacement algorithm that assumes parallel movement of fiber voxels in the through-plane (TP) direction. Gaiselmann et al. [27] estimated an optimal vector field using a simulated annealing algorithm to simulate fiber movement in the TP direction under compression conditions. Fronting et al. [28] assumed that fibers would penetrate each other during the compression process. Xiao et al. [19,29], pioneering the combination of explicit dynamics and finite element method (FEM), calculated the stress distribution of carbon fibers by considering dynamic contact, frictional motion, and extrusion deformation among fibers during the compression process. It is noted that their models did not consider the coupled effects of various microstructures on the mechanical properties of GDLs, such as stress distribution and displacement distribution. Therefore, understanding the coupled effects of different microstructural characteristics on stress distribution inside GDLs and optimizing the stress uniformity are of crucial significance.
Orthogonal design method (ODM) is an experimental design approach aimed at studying experiments with multiple factors and levels. It selects a representative subset of experimental combinations based on orthogonality, allowing for a rapid identification of optimal combinations and a significant reduction in time consumption [30,31]. Lin et al. [32] investigated the influence of micro-porous layers on fuel cell performance under different factors using ODM. Wang et al. [31] employed ODM to study the effect of relative humidity inside the electrode on fuel cell performance. The results revealed that appropriate humidity significantly enhances the performance of PEMFCs, and the optimal humidity condition varies with different operating conditions. Liu et al. [33] studied the impact of operating parameters on the output performance of PEMFCs using ODM. They found that the effects of cathode stoichiometry and operating temperature on output voltage are more significant than the relative humidity. Xia et al. [30] used ODM to rank the impact of various parameters on fuel cell performance and proposed the optimized combinations of different operating parameters under different current densities. It is noted that the studies mentioned above aimed to optimize the output performance of PEMFCs based on macroscale, which have not considered the coupling effect of different microstructure characteristics of GDLs. To address this issue, Xiao et al. [34] combined reconstruction techniques, pore-scale modeling and ODM to study the coupling effects of various microstructural characteristics on transport properties for GDLs. However, the coupled effect of these microstructural characteristics on the mechanical behavior was not investigated.
To fully leverage the strengths of previous research and address its shortcomings, this study innovatively introduces an integrated approach that combines reconstruction techniques, orthogonal design method (ODM), and finite element method (FEM) to comprehensively assess and optimize the internal stress distribution within pore-scale gas diffusion layers (GDLs). By employing ODM to concurrently consider the coupled effects of various microstructural characteristics, we are able to reconstruct GDL models based on different combinations of these characteristics. Subsequently, FEM and explicit dynamics simulations are utilized to investigate the stress response and uniformity of these reconstructed models under a range of compression ratios (CRs). The core objective of this research is to develop and validate a set of innovative mathematical expressions that can accurately predict and optimize the mechanical properties of GDLs, especially when accounting for the complex interactions of microstructural features such as carbon fiber diameter, porosity, GDL thickness, and fiber orientation coefficient, which have often been inadequately considered in past studies. Our research outcomes not only deepen the theoretical understanding of mechanical property quantification at the pore scale but also provide a powerful tool for the performance enhancement and rapid optimization of GDLs, offering significant innovative value and application prospects.

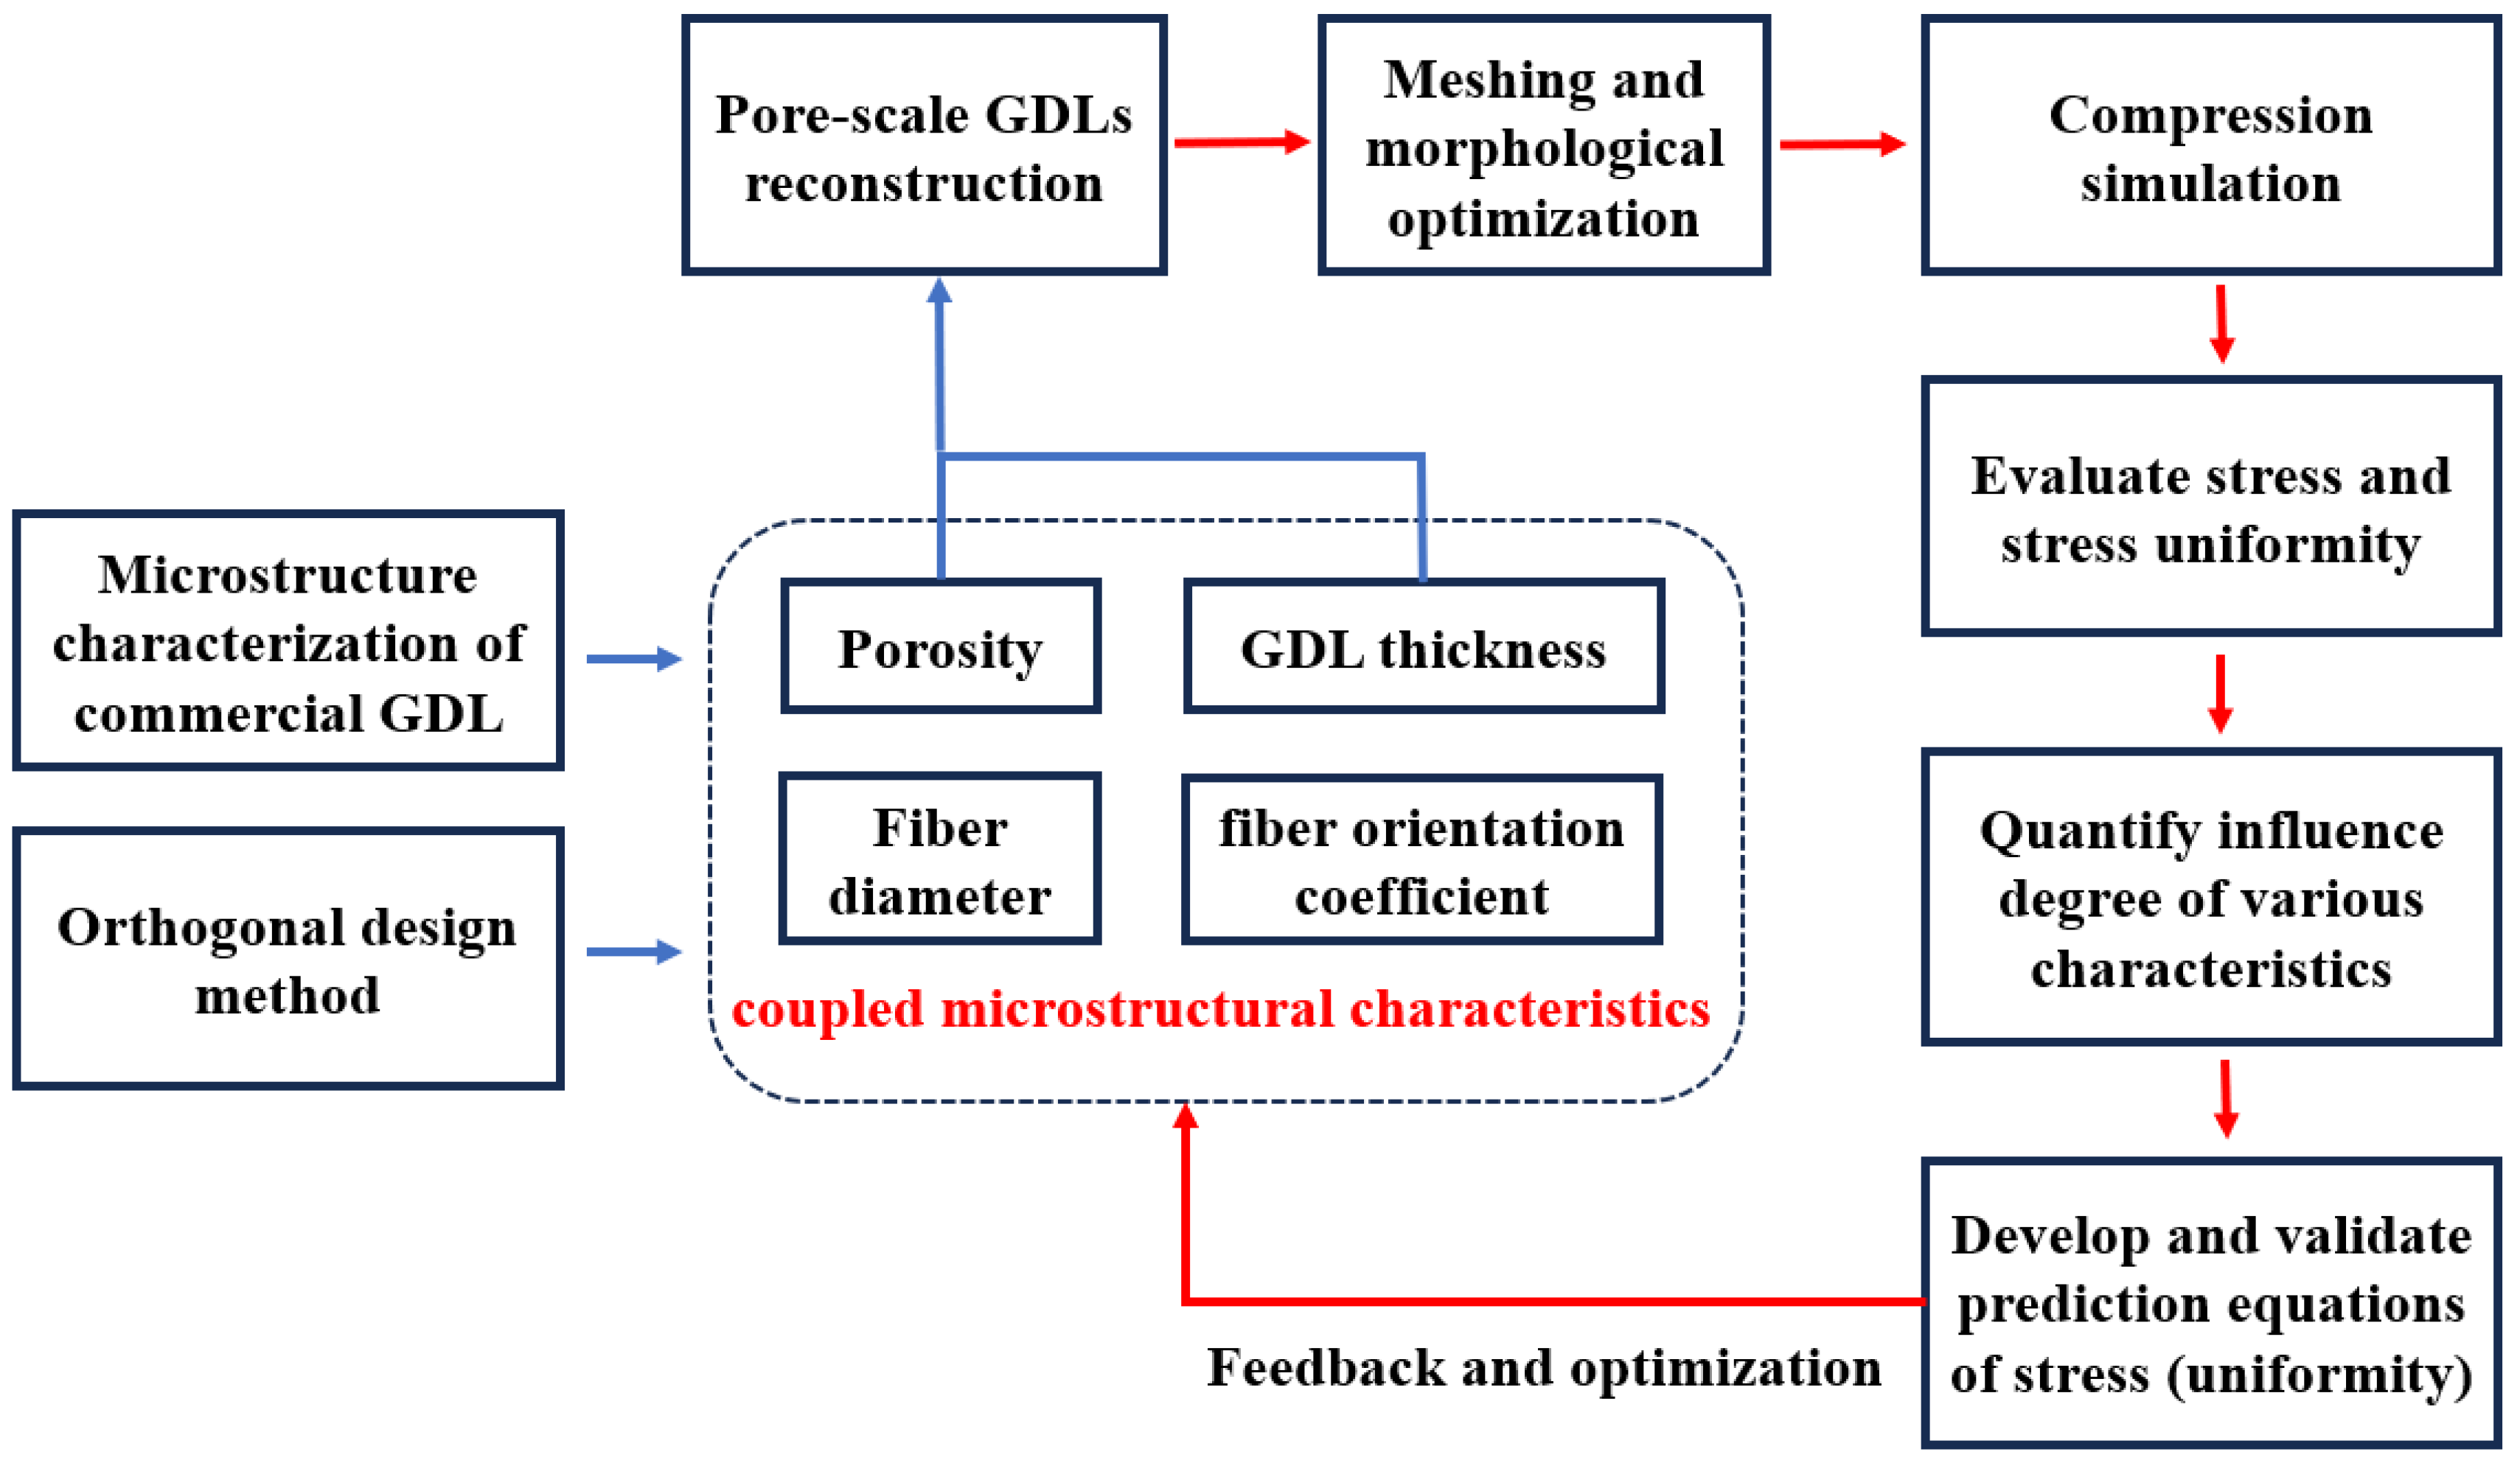
2. Numerical Methods

In this work, the stochastic reconstruction technique, ODM, FEM and explicit dynamics methods are employed to evaluate and optimize the stress distribution of pore-scale GDLs. The pore-scale GDLs are reconstructed based on different combinations of microstructural characteristics [10,12]. The workflow of this work can be divided into four stages, as illustrated in Figure 1. Firstly, the value of microstructure characteristics is chosen from the experimental data of commercial GDLs in other published studies, and the combinations of various microstructure characteristics are determined using ODM. Secondly, three-dimensional pore-scale GDLs are reconstructed considering the coupled effect of various microstructure characteristics. Thirdly, the FEM and explicit dynamic method are used to evaluate the compression response under different CRs, such as the stress and stress uniformity. In addition, the influence degree of different microstructure characteristics can be quantified. Finally, regression analysis based on ODM is conducted to develop and validate new prediction equations of the stress and stress uniformity of pore-scale GDLs with different combinations of microstructural characteristics.

2.1. Stochastic Reconstruction

Drawing from a range of experimental studies on GDLs [10,35,36,37,38,39], microstructural characteristics including fiber diameter, GDL thickness, porosity, and the statistical distribution of fiber orientations have been determined. These parameters are employed to guide the reconstruction of GDL microstructures. To facilitate the convergence of this reconstruction process, some assumptions have been adopted. Firstly, the fiber framework of GDLs is composed solely of carbon fibers and pore space, with fibers being straight and cylindrical with constant diameter. Secondly, fibers are permitted to overlap in the in-plane (IP) direction of the GDL, and a probability density function is introduced to describe the fiber orientation [13,40]:
p z θ = 1 2 β sin θ ( 1 + ( β 2 1 ) c o s 2   θ ) 3 2
where β denotes the fiber orientation coefficient, θ represents the angle between the carbon fiber and the x-axis (see Figure 2a), and the probability distributions of different β values are presented in Figure 2b. The fiber orientation angle ranges from 0° to 180°. When β = 0, all the carbon fibers will be expected to align parallel to the through-plane direction. As β gradually increases, the distribution of carbon fibers will tend to be consistent in the in-plane direction. In this work, fibers are assumed to locate in the IP direction layer by layer, and β is used to express the probability of fiber orientation angle in the IP surface. To obtain carbon fiber probability distribution that more closely matches the observation under XCT scanning, we found that with values of 1, 2, and 3, the fiber orientation is evenly distributed in all (x-y-z) directions and is close to the image of the carbon fiber distribution generated based on XCT scanning data in Figure 2a.

2.2. Explicit Dynamics Method

GDLs are subjected to compression stress by the clamping force exerted by the bipolar plates during assembling or vibration. This compression is critical for achieving proper sealing and minimizing the contact resistance [41,42]. In this work, the explicit dynamics method and FEM are employed to compute the stress distribution of carbon fibers, taking into account dynamic contact, frictional forces, and extrusion among fibers during compression simulation. These compression simulations are carried out with the assumptions of material continuity, full elasticity, homogeneity, and isotropy. This part has been elaborated in detail in our previous studies [19,29]. The stress simulation in this study is governed by kinematic, geometric, and physical equations.
Kinematic equations:
σ i j , j + f i = ρ u ¨
where σ represents the stress, ρ is the material density, f i is the body force caused by the clamping force, and u ¨ is the acceleration.
Geometric equations:
ε i j = 1 2 u i , j + u j , i
where ε denotes the strain, and u denotes the displacement of the fiber element.
Physical equations:
σ i j = β ε k k δ i j + 2 μ ε i j σ k k = 3 β + 2 μ ε k k
where δ i j is the Kronecker symbol, and β and μ are the first and second Lame constants, which can be calculated as
β = E v 1 + v 1 2 v
μ = E 2 1 + v
where E and ν are the elastic modulus and Poisson’s ratio of the material, respectively.
Boundary conditions:
u i x , t = u ¯ i x , t p i x , t = p ¯ i x , t
where u ¯ i ( x , t ) and p ¯ i ( x , t ) are the boundary conditions for displacement and stress.
Initial conditions:
u x , 0 = u 0 x u x , 0 = u 1 x
where u 0 ( x ) and u 1 ( x ) are given functions. The Hamiltonian variational principle and central difference methods for time discretization are used to solve the displacement and stress distribution of fiber elements at every moment by integrating Equations (2)–(4) with the boundary and initial conditions.

2.3. Orthogonal Design Method

The ODM is a systematic approach for investigating the effects of multiple factors and multiple levels based on the principles of orthogonality and mathematical statistics [43]. Orthogonality entails the selection of a set of representative points across numerous test combinations, distinguished by their even distribution and systematic arrangement. These points are then synthesized and evaluated within a multi-factor and multi-level framework, utilizing an orthogonal table for analysis [44]. The ODM is adept at capturing the intrinsic patterns within data with its fewest test combinations. Consequently, this technique is particularly well suited for scenarios characterized by various influencing factors [43,45,46]. Therefore, ODM is applied to investigate the coupled effect of various microstructure characteristics of GDLs in this work. Range analysis is performed to evaluate and quantify the impact degree of different microstructure characteristics on the stress behavior of GDLs. Range analysis, a technique for assessing parameter sensitivity, operates by calculating the range or the disparity in the data collected from orthogonal tests. A significant impact degree suggests a more substantial effect of the parameter on the output results [47]. The formula of range analysis is as follows [8,9,10]:
K i = K m
k i = K ¯ i
R = m a x k 1 , k 2 , k 3 m i n k 1 , k 2 , k 3  
where K i equals the sum of the corresponding test results with level i , k i is the arithmetic mean of K i , and R represents the impact degree of the corresponding factor.
The regression orthogonal design method (ODM) formulates regression equations that correlate the test indicators with various factors, thereby delineating the primary and secondary influences of each factor on the test indicators. The test indicator is denoted as y, and multiple influencing factors are denoted as   x i ( i = 1, 2, 3……n), where n is the total number of influencing factors. Furthermore, the range from the lowest to the highest level for each influencing factor is determined, and their arithmetic means are established.
x i 0 = x i 1 + x i 2 2
where x i 0 is the zero level of factor xi. The interval changes for factor x i , which is the difference between the highest level and the zero level, are designated as i . Subsequently, a linear transformation is applied to each level of x i by Equation (14):
i = x i 2 x i 0
z i = x i x i 0 i
where z i is the encoding of a factor. This equation is applied to ensure that each level of each factor varies within the range from the lowest to the highest level. Additionally, the regression coefficients also indicate the “positive” or “negative” effects of each factor.
The regression equation describes the relationship between the test indicator (y) and test factors x 1 , x 2 , x 3 , ……, x m by Equation (15). The regression coefficients are determined by Formulas (16) and (17) based on the least squares principle.
y ^ = a + j m b j x j + k < j b k j x k x j , k = 1,2 , ,   m 1 j k  
a = 1 n i = 1 n y i = y ¯
b j = i = 1 n z j i y i m c , j = 1,2 , ,   m
where z j means various factors, and z j i indicates the encoding of different levels for the z j factor.

3. Results and Discussion

This section describes the model development, the evaluation of the coupling effect of various microstructure characteristics, the quantification of the impact degree of different microstructure characteristics, the optimization of stress and stress uniformity at different CRs, and mathematical prediction model development and validation using a regression orthogonal design approach.

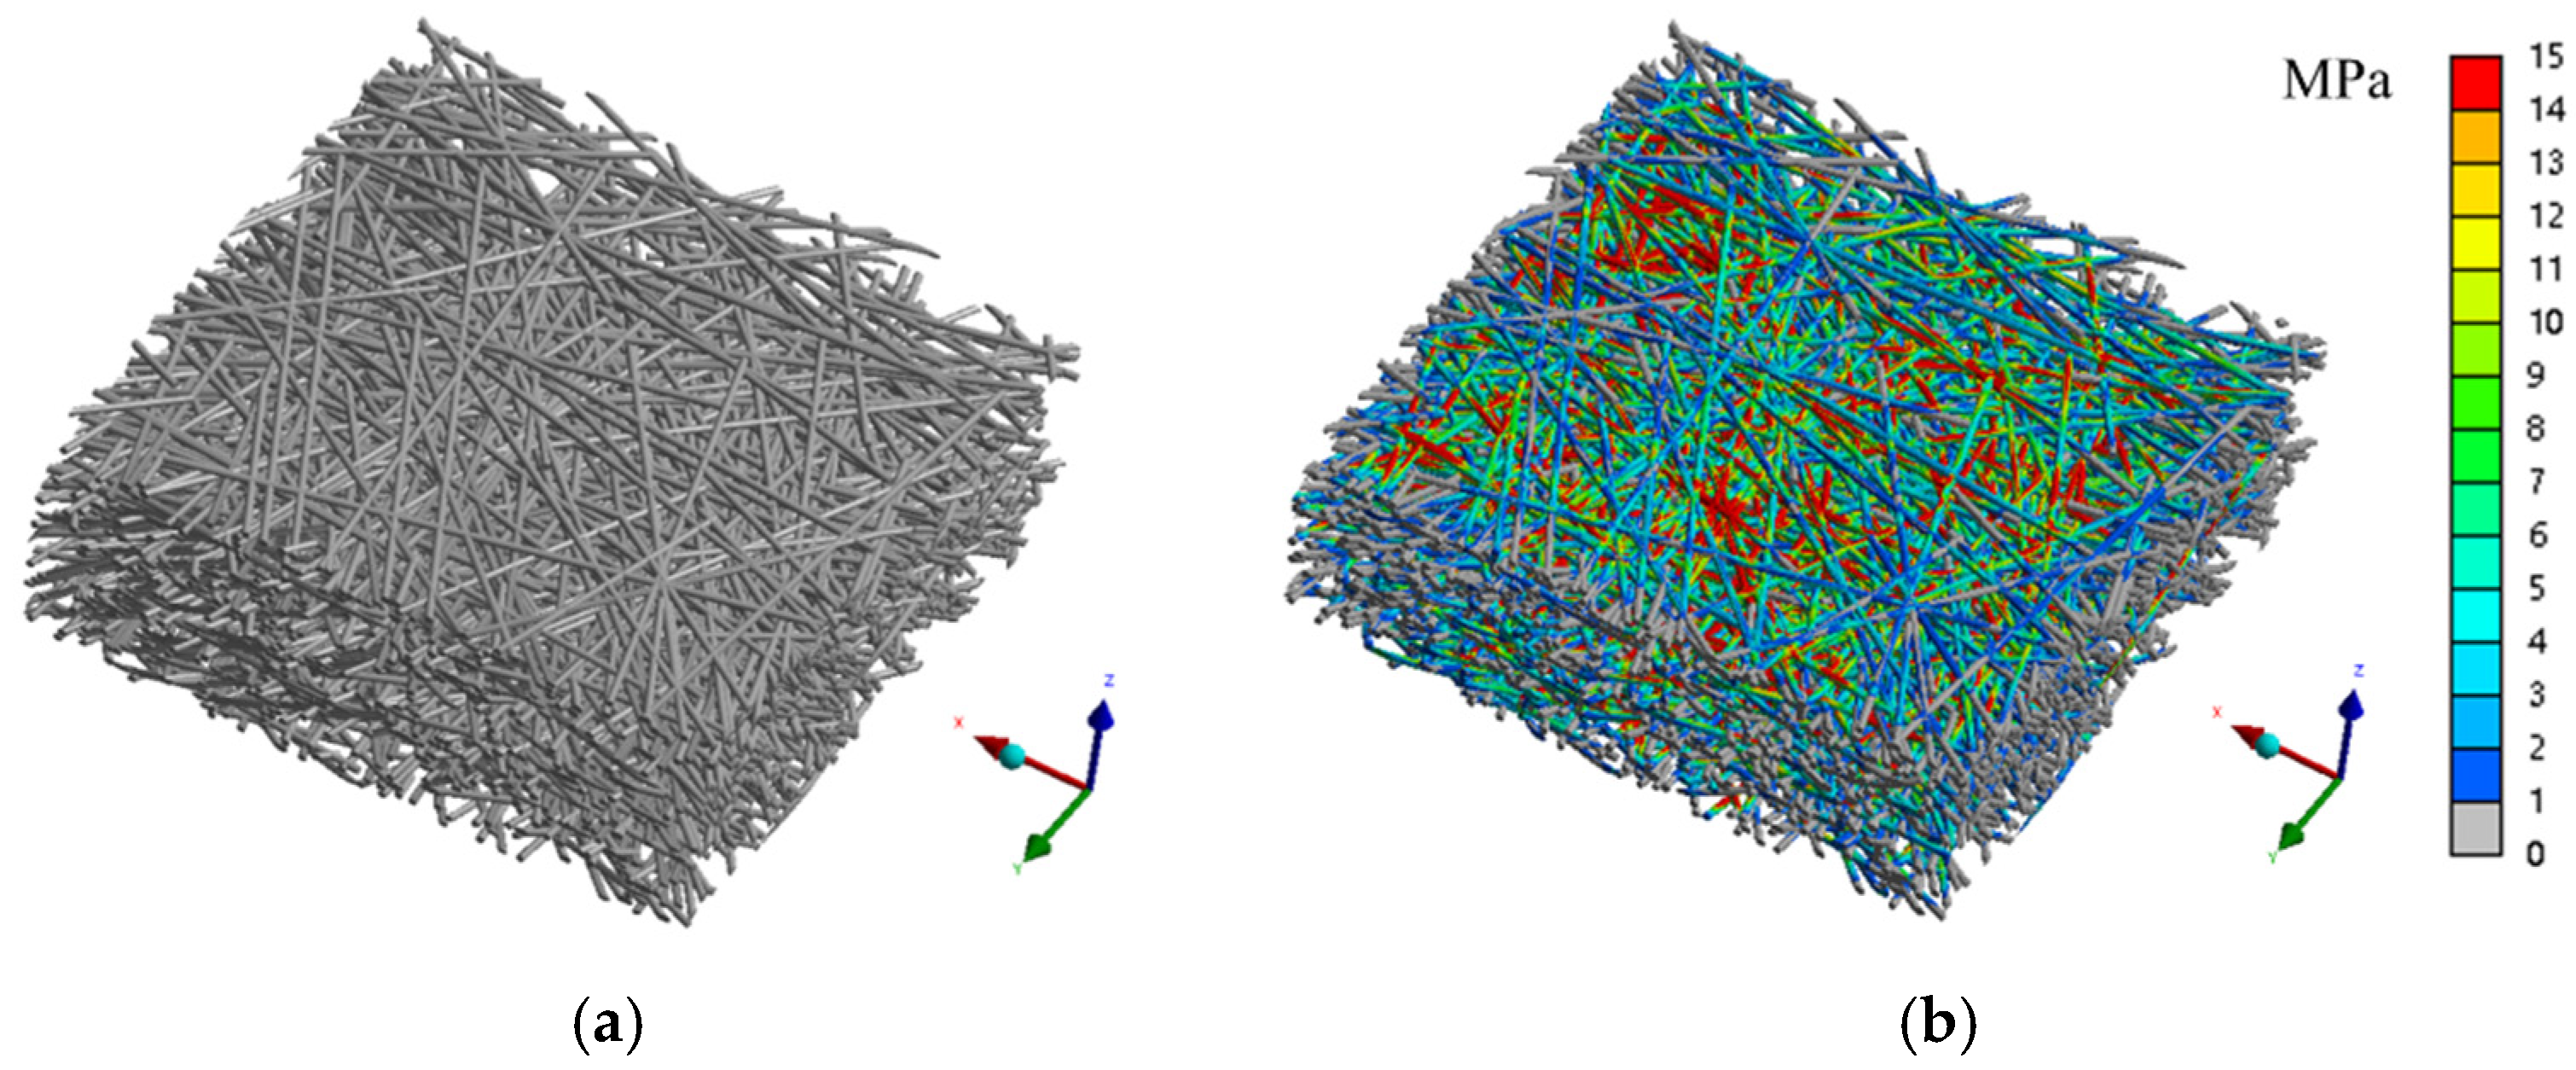
3.1. Model Description

To ensure the precision of the reconstructed GDL model and reduce the computational cost for compression simulations, different domain sizes are compared and validated. In this study, a computational domain size of 500 × 500 μm was selected, which offers higher accuracy and a more faithful porosity distribution alignment with experimental data compared to domain sizes of 200 × 200 μm and 300 × 300 μm [10].
In previous studies of macroscopic compression models of GDLs, the Young’s modulus of GDL was set to around 10 MPa, and the density was set to around 1000 kg/m3 [48,49,50], which is not applicable to the microscopic model of GDL based on microstructural characteristics. Li [51] pointed out that the Young’s modulus of the carbon fiber based on Toray PAN is 230 GPa, and the density is 1.76 g/cm3. It is worth noting that a higher Young’s modulus and a lower compression speed will greatly increase the resource consumption of simulation calculations. Xiao [12] compared the stress and strain distribution of carbon fibers with different compression speeds and Young’s moduli under compression. The results showed that at a low compression ratio, a higher degree of precision can be achieved when the GDL’s Young’s modulus is set to 6.5 GPa. To balance the computational cost and precision, different magnitudes of displacement constraints were applied to the top surface of the GDL model in the through-plane direction downward. At the same time, fixed constraints were set on the bottom surface of the GDL. The material parameters of fibers are shown in Table 1.
Subsequently, the ODM was applied to evaluate the coupling effect of various microstructure characteristics on the stress behavior of GDLs. Different factors and different levels of various microstructure characteristics are listed in Table 1. The four selected factors are carbon fiber diameter (CFD), GDL thickness ( T G D L ), porosity ( ϕ ), and fiber orientation coefficient ( β ). Three levels of four factors were determined by a literature review [12,52], ensuring an efficient consideration of the combined effects across different levels. Finally, orthogonal combinations based on four factors and three levels were determined. Case 1 to case 9 represent nine orthogonal combinations, which include different microstructure characteristics. Then, nine pore-scale GDL models were reconstructed by stochastic reconstruction techniques based on nine orthogonal combinations; see Figure 3a. The reconstructed models were then used for compression simulation, and then the corresponding stress distribution models at different CRs were obtained; see Figure 3b.

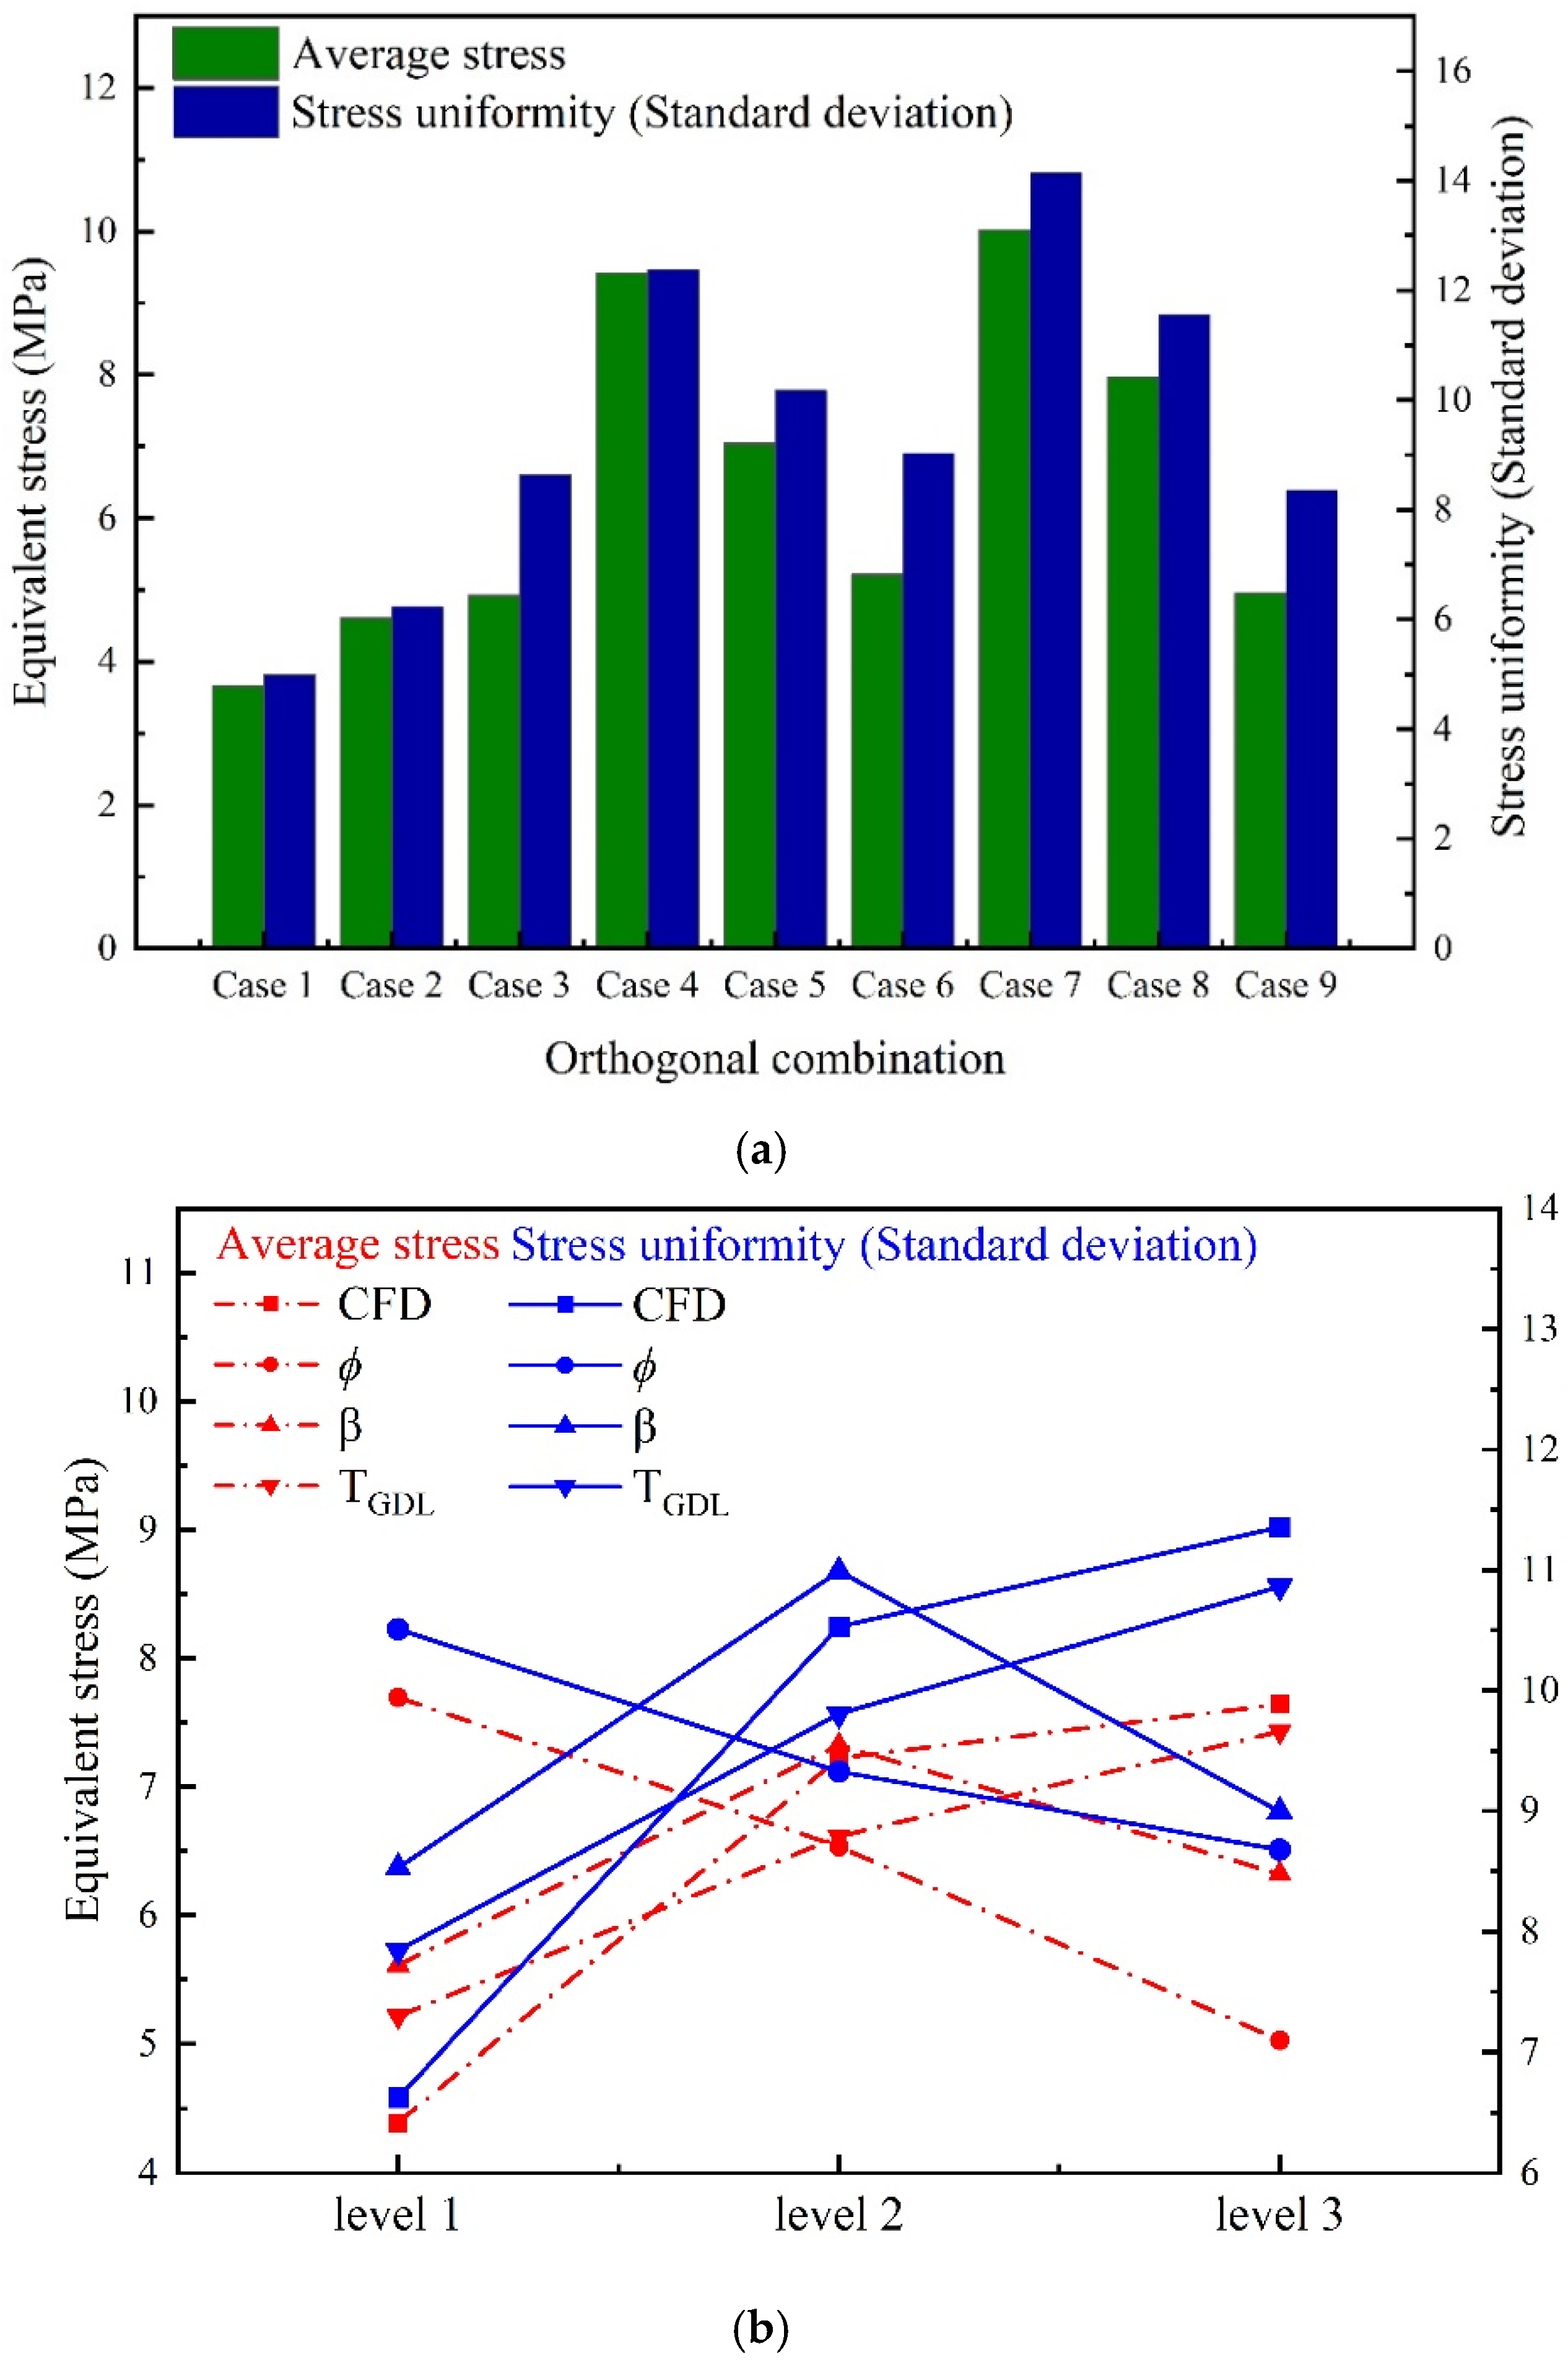
3.2. Stress Distribution with CR = 10%

In this part, the FEM and explicit dynamics method are combined to investigate the coupled effect and the impact degree of various microstructure characteristics on the average stress and stress uniformity of the GDL at CR = 10%. In addition, the optimal combination is proposed and compared with the initial results.
Figure 4a shows the average stress and stress uniformity of nine orthogonal combinations at CR = 10%. The green color represents average stress and blue color represents standard deviation. Here, the stress uniformity is defined by the standard deviation, which provides a way to quantify how much each data point in a data set deviates from its mean value. The larger the standard deviation of the stress uniformity, the greater the deviation of the data point from the mean value. A smaller value of the standard deviation indicates a higher concentration of data points with respect to the mean value, which represents better uniformity of stress distribution inside GDL microstructure. The standard deviation is calculated by the following formula:
σ S D = N i 1 X i X ¯ 2 N
where σ S D corresponds to standard deviation, X i corresponds to the stress of every fiber element inside GDL models, X ¯ corresponds to average stress, and N represents the total number of meshing elements.
One can see from Figure 4a that the average stress of case 7 is 173% higher than that of case 1, and the stress uniformity of case 7 is 183% higher than that of case 1. This indicates that the stress distribution of GDLs with different microstructure characteristics differs significantly, and the optimization of the microstructure characteristics is meaningful for reducing the internal stress and improving the uniformity of stress distribution inside GDLs.
Figure 4b shows the arithmetic mean values of average stress and stress uniformity with different factors at CR = 10%. The factors in this study include fiber diameter, porosity, GDL thickness and fiber orientation coefficient. Red color represents average stress and blue color represents stress uniformity. For fiber diameters, levels 1, 2, and 3 represent 6, 8, and 10 microns, respectively. For level 1 of fiber diameter, ki represents the arithmetic mean of average stress or stress uniformity for cases 1, 2, and 3 according to Table 2. For porosity, levels 1, 2, and 3 correspond to 70%, 75%, and 80%, respectively. For level 1 of porosity, ki represents the arithmetic mean of average stress or stress uniformity for cases 1, 4, and 7 according to Table 2. Excessive stress and non-uniform stress may lead to breakage or poor contact of carbon fibers, which reduces the conductivity. Long-term exposure to excessive stress and non-uniform stress may lead to fatigue and damage, which affects the durability of GDLs [16,17]. Therefore, the optimal combination should have the lowest stress and stress uniformity, which can be inferred from Figure 4b: CFD (1), ϕ   (3), TGDL (1), β (1). The numbers represent different levels. Then, an optimal GDL model was reconstructed based on the optimal combination, which was further used for compression simulation. The results shown in Table 3 indicate that the optimal average stress (3.15 MPa) is reduced by 16% and 218% compared to the initial minimum average stress (3.66 MPa) and maximum average stress (10.02 MPa). The optimal stress uniformity (4.83) is reduced by 3% and 193% compared to the initial minimum stress uniformity (4.99) and maximum stress uniformity (14.15).
Figure 4c shows the impact degree of four factors on average stress and stress uniformity based on the regression analysis equation at CR = 10%. Red color represents average stress and black color represents stress uniformity. It is concluded that the order of the primary and secondary factors affecting the average stress is as follows: CFD > ϕ > TGDL > β. The order of primary and secondary factors affecting the stress uniformity is as follows: CFD > TGDL > β > ϕ . The results show that the influence of carbon fiber diameter and porosity on the average stress are more significant than other factors, and the effect of fiber diameter and GDL thickness on the stress uniformity is more obvious. The stress and stress uniformity increases as the fiber diameter and GDL thickness increase, but porosity shows the opposite trend. This is because the stress take place through the solid material, especially between the interface of different fibers. As the fiber diameter and GDL thickness increase, the stiffness of the whole GDL and fibers increases, which results in more difficult-to-bend fibers and more obvious stress concentration during compression. Fibers with smaller diameter can increase the number of contact points (or the contact surface) between fibers in unit volume, which will further decrease the stress. Higher porosity and thinner GDL are relatively soft and can more easily adapt to stress, resulting in lower stress and more uniform stress distribution.

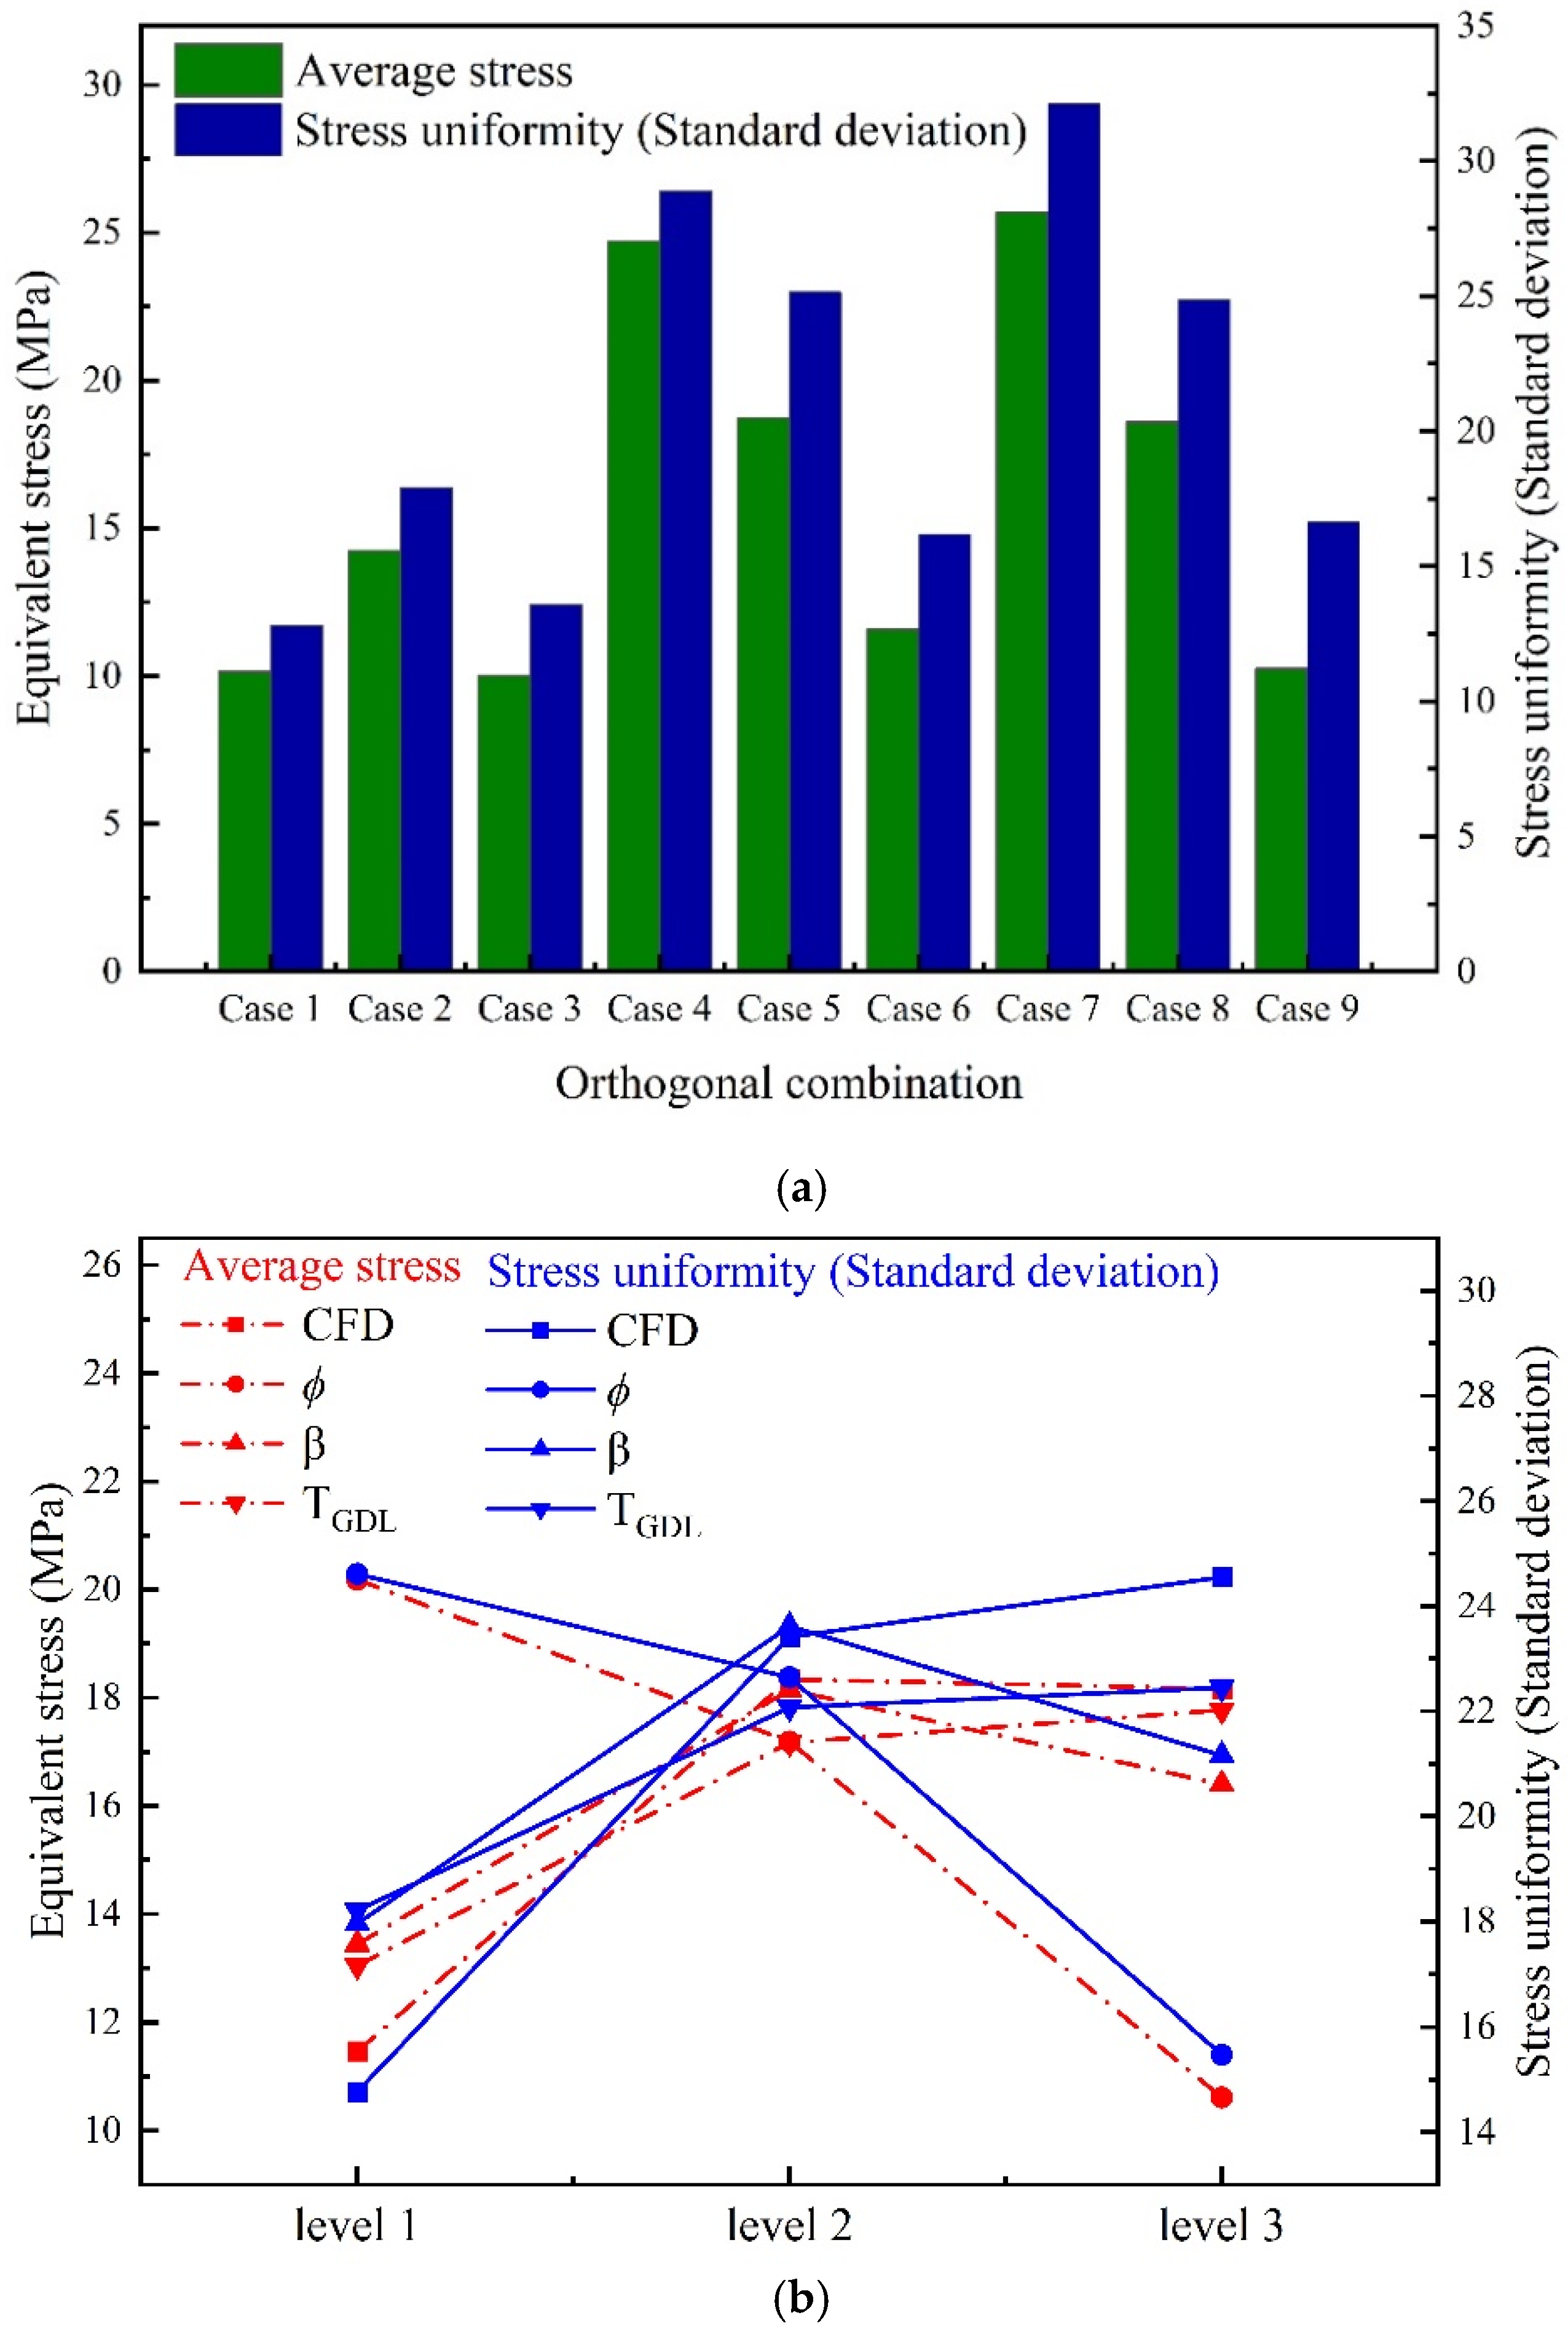
3.3. Stress Distribution with CR = 20%

In this part, the coupled effect and the impact degree of various microstructure characteristics on average stress and stress uniformity of the GDL at CR = 20% are investigated. In addition, the optimal combination is proposed and compared with the initial results.
Figure 5a shows the average stress and stress uniformity of nine orthogonal combinations at CR = 20%. Green color represents average stress and blue color represents stress uniformity. Figure 5b shows the arithmetic mean values of average stress and stress uniformity with different factors at CR = 20%. Red color represents average stress and blue color represents stress uniformity. Figure 5c shows the impact degree of four factors on average stress and stress uniformity based on the regression analysis equation at CR = 20%. Red color represents average stress and black color represents stress uniformity.
One can see from Figure 5a that the average stress of case 7 is 109% higher than that of case 1, and the stress uniformity of case 7 is 150% higher than that of case 1. This indicates that the stress distribution of GDLs with different microstructure characteristics differs significantly, and the optimization of the microstructure characteristics is meaningful for reducing the internal stress and improving the uniformity of stress distribution inside GDLs.
The optimal combination should have the lowest stress and stress uniformity, which can be inferred from Figure 5b: ϕ (3), CFD (1), TGDL (1), β (1). The optimal combination of CR = 10% is the same as that of CR = 20%. Subsequently, an optimal GDL model was reconstructed based on the optimal combination, which was further used for compression simulation. The results show that the optimal average stress (6.54 MPa) is reduced by 55% and 292% compared to the initial minimum average stress (10.16 MPa) and maximum average stress (25.68 MPa). The optimal stress uniformity (8.49) is reduced by 51% and 278% compared to the initial minimum stress uniformity (12.82) and maximum stress uniformity (32.12).
It is concluded from Figure 5c that the order of the primary and secondary factors affecting the average stress of CR = 20% is ϕ > CFD > TGDL > β, which is slightly different from that of CR = 10%: CFD > ϕ > TGDL > β. The order of primary and secondary factors affecting the stress uniformity of CR = 20% is CFD > ϕ > β > TGDL, which is slightly different from that of CR = 10%: CFD > TGDL > β > ϕ . The results show that the influence of carbon fiber diameter and porosity is more significant than that of other factors. The stress and stress uniformity increase as the fiber diameter and GDL thickness increase, but porosity shows the opposite trend. The reasons are the same as for CR = 10%.
The difference from the results of CR = 10% is that the impact degree of porosity becomes higher. Higher porosity is relatively soft and can more easily adapt to stress changes, resulting in a lower stress and more uniform stress distribution. Besides that, the optimization amplitude of CR = 20% is much higher than that of CR = 10%. In engineering practice, the compression ratio is generally about 20%, which should be paid more attention to. The optimal combination for both CR = 10% and 20% is ϕ (3), CFD(1), TGDL(1), and β(1). The thinner GDL, higher porosity, smaller fiber diameters, and smoother probability distributions of fiber orientation have the lowest average stress and best stress uniformity during compression.

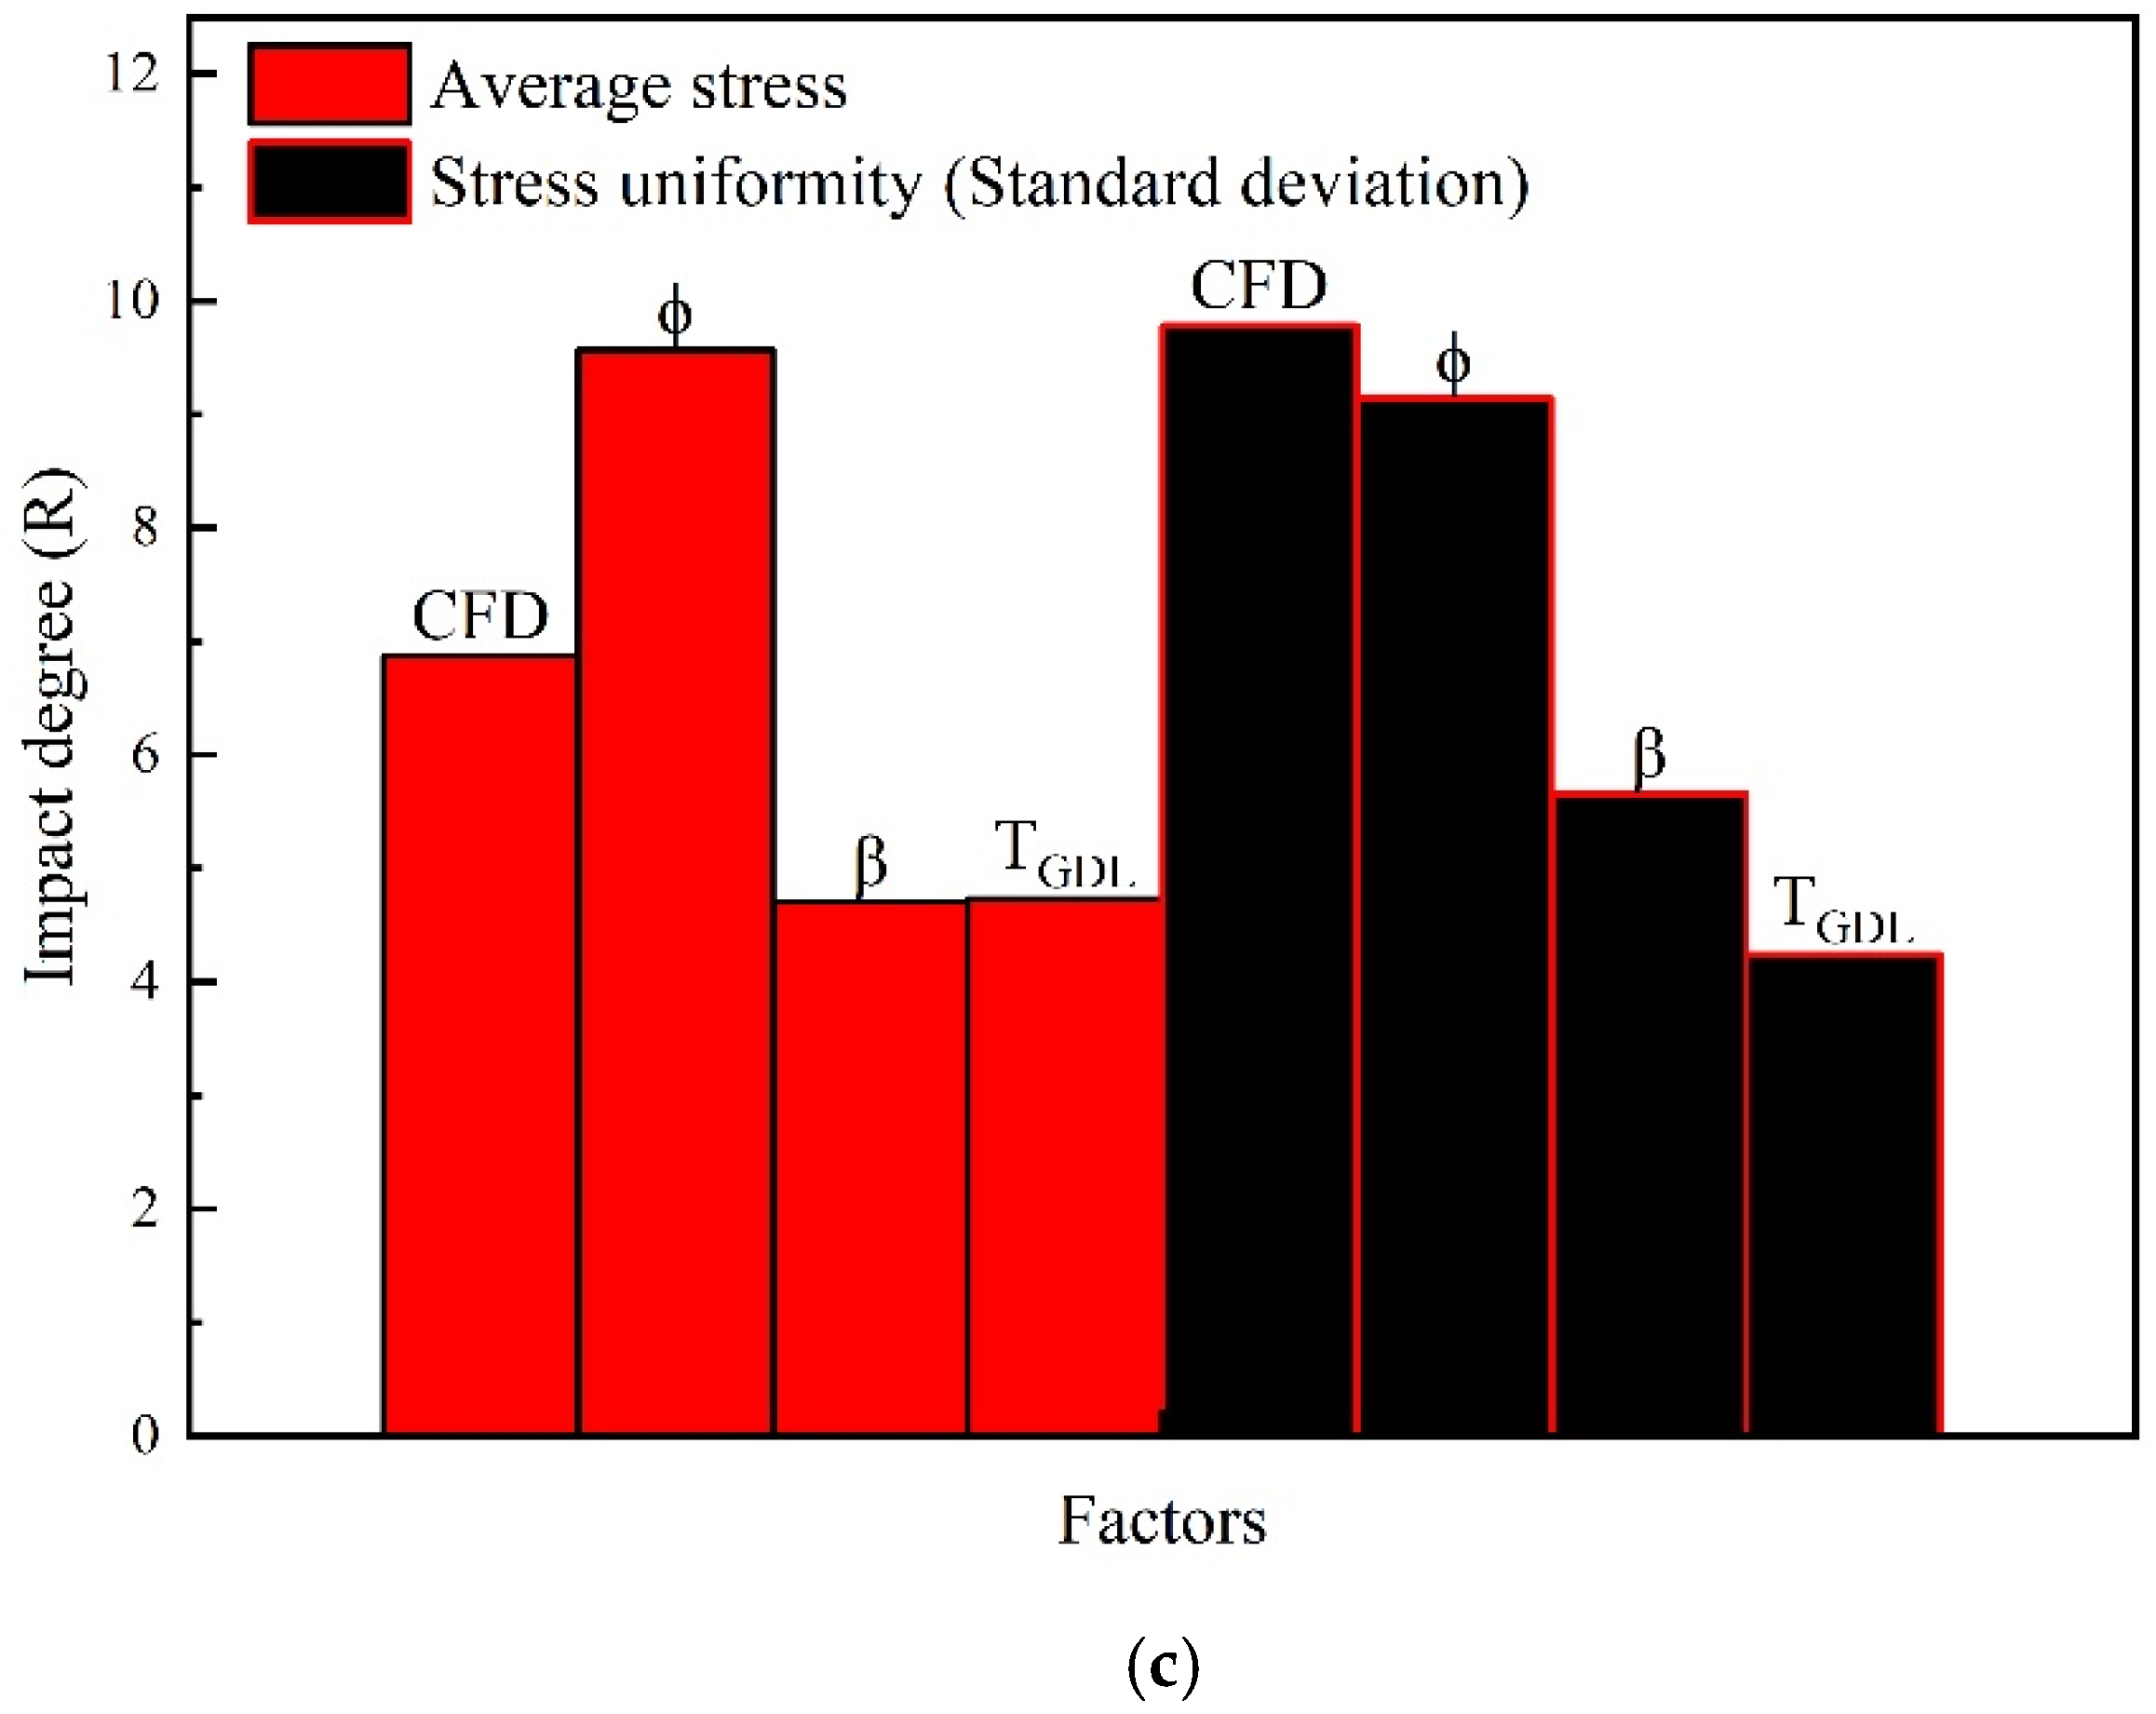
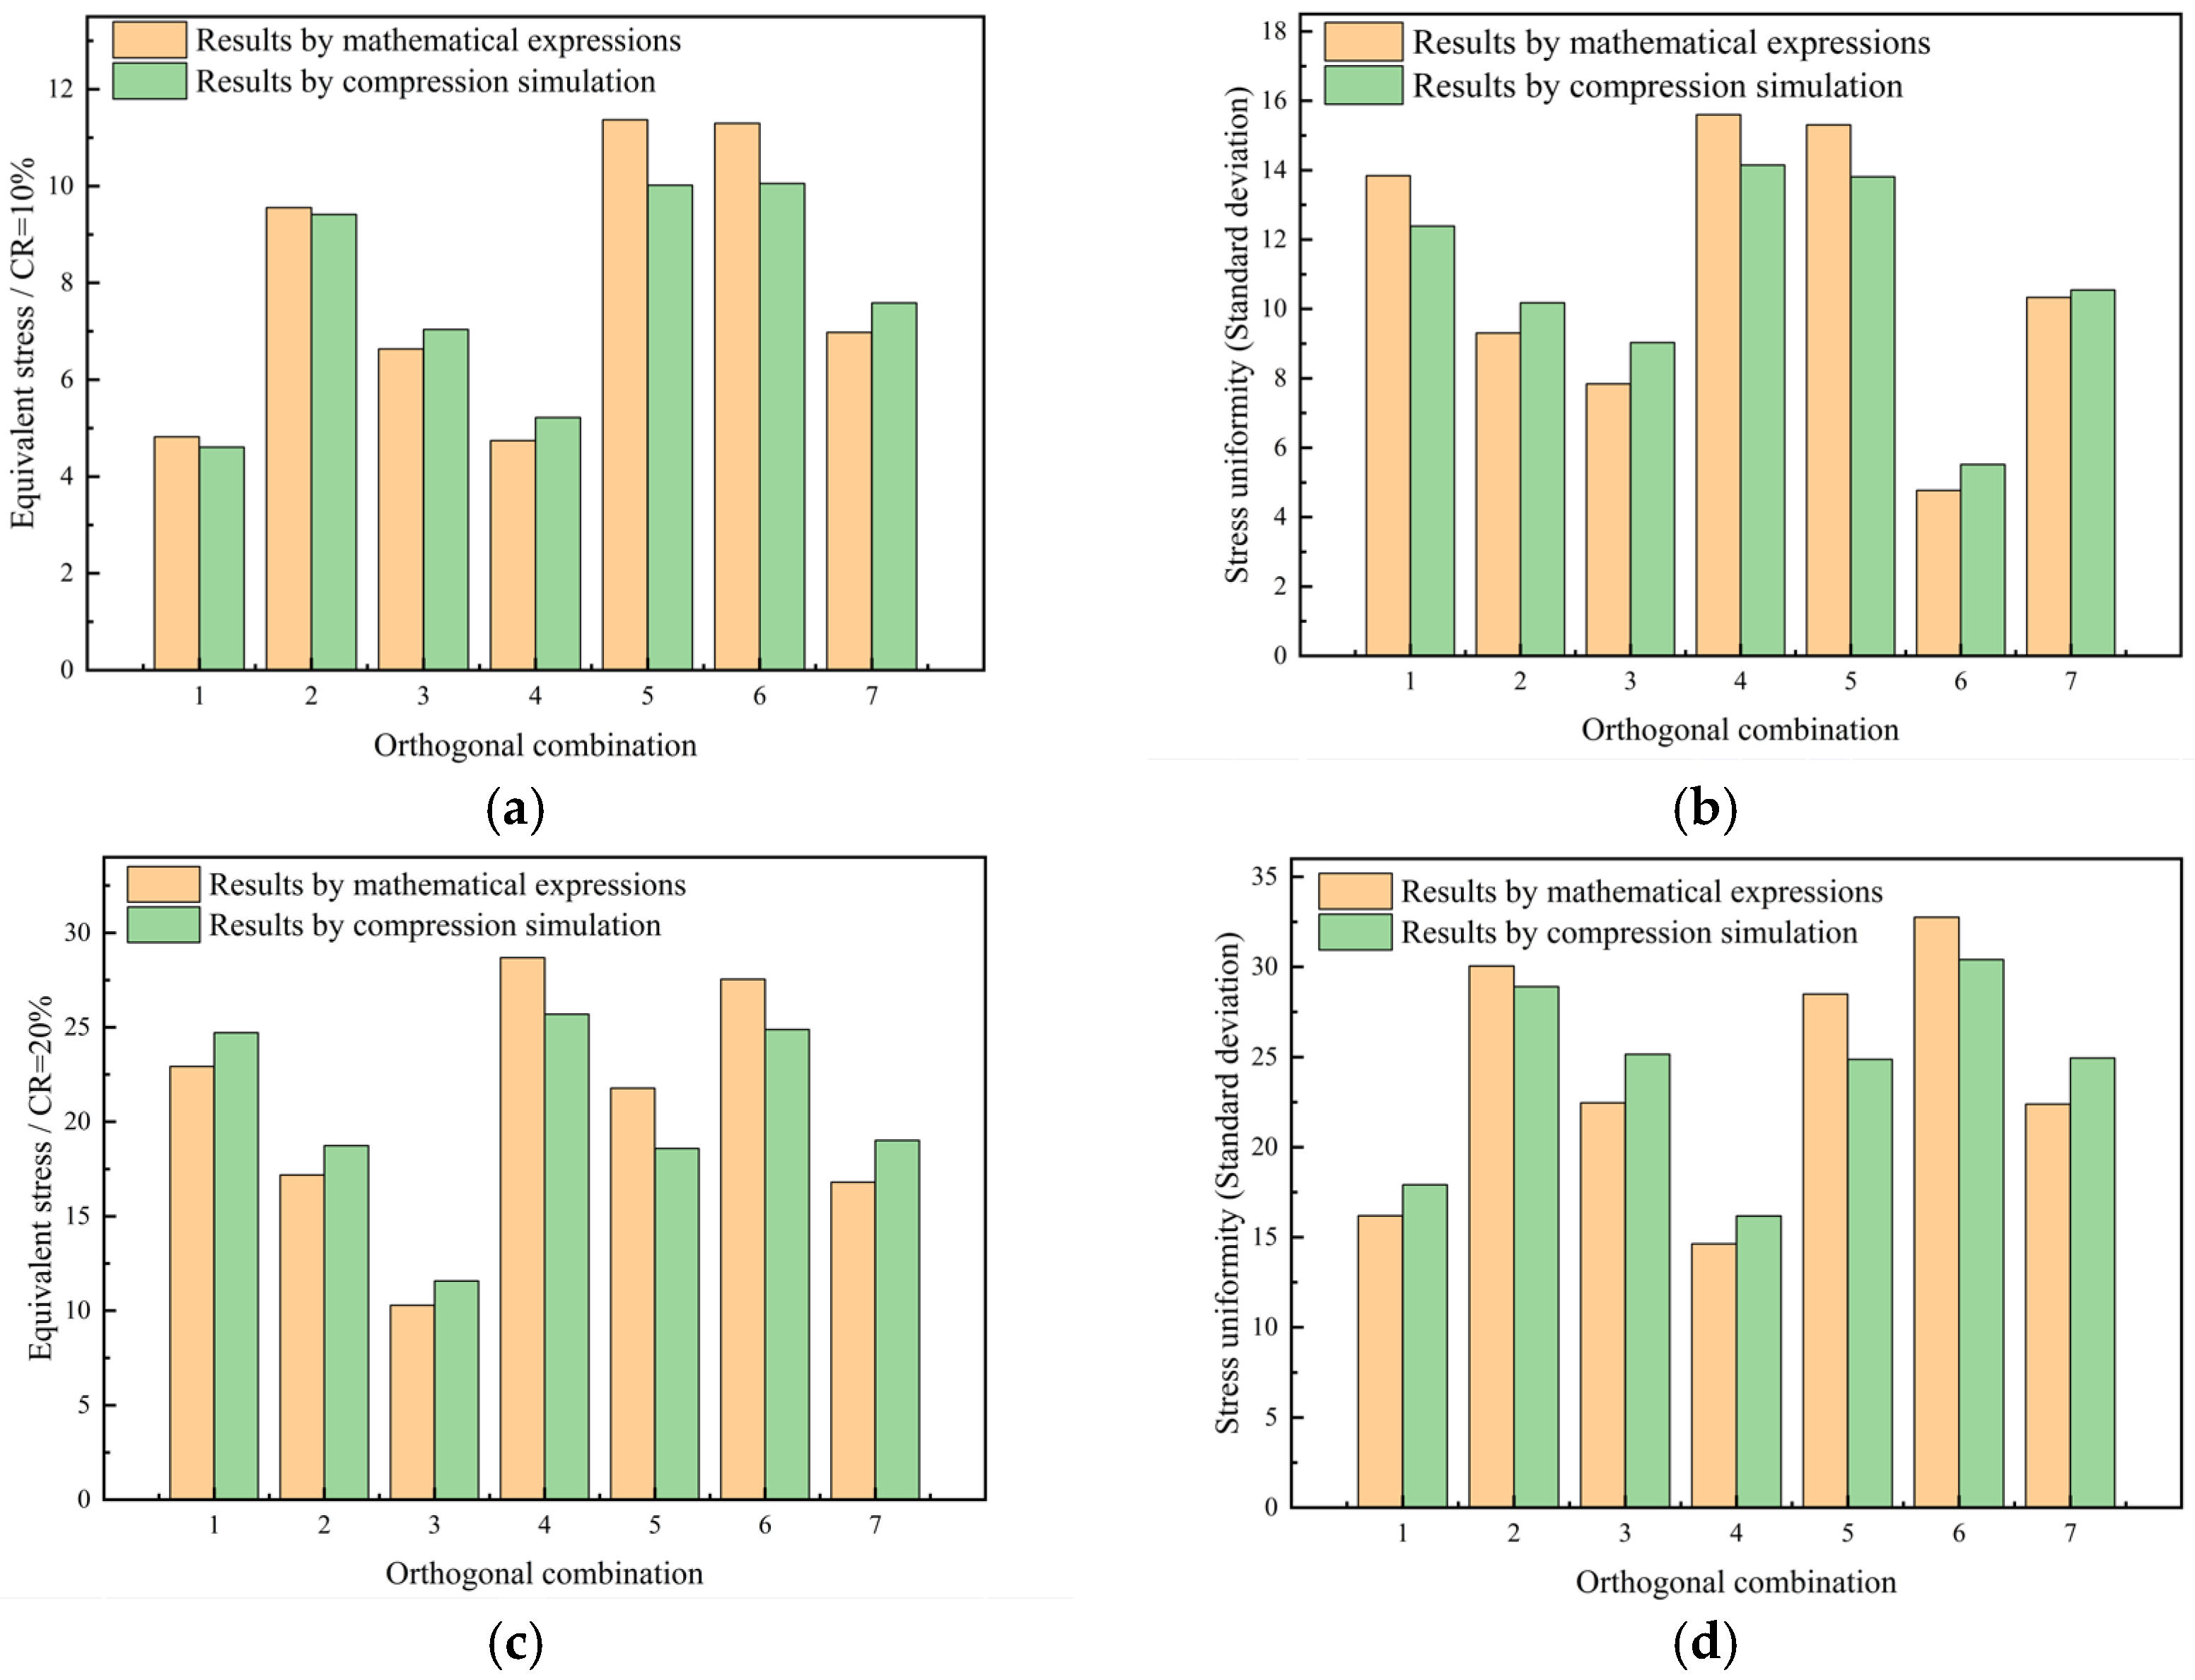
3.4. Mathematical Prediction Using Regression Orthogonal Design Method

The objective of this part is to develop and validate new mathematical expressions for predicting and optimizing the mechanical properties of GDLs rapidly and accurately by considering the coupled effect of carbon fiber diameter, porosity, GDL thickness, and fiber orientation coefficient, which have not been adequately considered in previous studies. The regression ODM formulates regression equations that correlate the test indicators with different factors, thereby delineating the primary and secondary influences of each factor on the test indicators. Additionally, the regression coefficients also indicate the “positive” or “negative” effect of each factor.
The test indicator y is defined, which means the average stress and stress uniformity at different CRs, and four factors x i ( i = 1,2,3,4) are identified for investigation, see Table 4. For instance, the range of the CFD factor is defined as [ x 11 , x 12 ] = [6 μ m , 10 μ m ], which means [lowest level, highest level]. Then, the level of 8 μm is defined as the zero level, and their variation interval is 2 μm. The level of all factors is shown in Table 5. Equation (14) is applied to ensure that each level of each factor varies within [−1, 1], see Table 6. In addition, three sets of zero level cases are added to improve the accuracy of the regression orthogonal calculation. Finally, the natural regression variable equations are derived from the data in Table 6 using the first-order regression ODM.
The regression equation describes the relationship between the test indicator (y) and test factors x 1 , x 2 , x 3 , ……, x m   by Equation (15). The regression coefficients are determined by Formulas (16) and (17) based on the least squares principle.
Then, the natural regression equations of average stress (CR = 10%) y 1 , stress uniformity (CR = 10%) y 2 , average stress (CR = 20%) y 3 , and stress uniformity (CR = 20%) y 4 can be obtained.
y 1 = 1.28815 x 1 0.36329 x 2 + 0.41773 x 3 + 0.01140 x 4 + 20.69022
y 2 = 1.75539 x 1 0.35169 x 2 + 0.72988 x 3 + 0.03408 x 4 + 14.04766
y 3 = 3.06209 x 1 1.15124 x 2 + 0.75515 x 3 0.01291 x 4 + 79.84664
y 4 = 3.83496 x 1 1.25163 x 2 + 1.48418 x 3 0.00241 x 4 + 83.11572
To validate the precision of the mathematical expressions above, a comparison was made between the results of compression simulation and prediction expressions; see Figure 6. The orange bars represent the results obtained from mathematical expressions, while the green bars denote the results from compression simulations. The results show that the errors fall within 1% to 10%. This indicates that the mathematical expressions are capable of providing an accurate and rapid evaluation and optimization of stress distribution for GDLs by considering the coupled effect of carbon fiber diameter, porosity, GDL thickness, and fiber orientation coefficient simultaneously.

4. Conclusions

In this study, the coupling effects of carbon fiber diameter, porosity, GDL thickness, and fiber orientation coefficient on the mechanical properties of pore-scale GDLs were evaluated and optimized by combining stochastic reconstruction techniques, explicit dynamics compression simulation, and the orthogonal design method. Finally, we developed and validated new mathematical expressions to predict the average stress and stress uniformity. This work not only holds important theoretical and practical significance for the quantification of mechanical properties, but also provides a valuable tool for the optimization and performance improvement of industrial GDLs. The main findings were as follows:
(1)
With the increases in fiber diameter, fiber orientation coefficient, and GDL thickness, the stress-bearing capacity and distribution uniformity of GDLs were significantly enhanced, while the increase in porosity counteracted this trend.
(2)
Among all the microstructural characteristics examined, the carbon fiber diameter and porosity have a particularly significant impact on the mechanical properties of GDLs, outweighing the influence of other factors. From the results, it can be seen that when designing the GDL, one should avoid the phenomena of high average stress caused by too low porosity and non-uniform stress distribution caused by an excessively large carbon fiber diameter.
(3)
A significant reduction of 292% was achieved in optimal average stress, and a substantial improvement of 278% was made in stress uniformity.
(4)
The mathematical expressions are capable of providing an accurate and rapid evaluation of stress distribution for GDLs by considering the coupled effect of various microstructure characteristics simultaneously.

Author Contributions

Conceptualization, Y.S.; Software, Y.S.; Validation, Y.S. and P.D.; Formal analysis, M.B. and H.M.; Investigation, P.D.; Writing—original draft, Y.S.; Writing—review & editing, L.X.; Visualization, H.H.; Supervision, H.M. and H.H.; Project administration, L.X.; Funding acquisition, L.X. All authors have read and agreed to the published version of the manuscript.

Funding

This work is supported by the State Key Laboratory of Advanced Technology for Materials Synthesis and Processing (Wuhan University of Technology) (No. 2023-KF-20), the National Natural Science Foundation of China (No. 52106254), the Ningbo Natural Science Foundation (No. 2023J094), and the ‘Mechanics+’ Interdisciplinary Top Innovative Youth Fund Project of Ningbo University (No. GC2024004).

Data Availability Statement

The original contributions presented in this study are included in the article. Further inquiries can be directed to the corresponding authors.

Conflicts of Interest

The authors declare no conflict of interest.

References

  1. Majlan, E.H.; Rohendi, D.; Daud, W.R.W.; Husaini, T.; Haque, M.A. Electrode for proton exchange membrane fuel cells: A review. Renew. Sustain. Energy Rev. 2018, 89, 117–134. [Google Scholar] [CrossRef]
  2. Zhang, Q.; Lin, R.; Técher, L.; Cui, X. Experimental study of variable operating parameters effects on overall PEMFC performance and spatial performance distribution. Energy 2016, 115, 550–560. [Google Scholar] [CrossRef]
  3. Lin, J.-H.; Chen, W.-H.; Su, Y.-J.; Ko, T.-H. Effect of gas diffusion layer compression on the performance in a proton exchange membrane fuel cell. Fuel 2008, 87, 2420–2424. [Google Scholar] [CrossRef]
  4. Wilberforce, T.; Ijaodola, O.; Khatib, F.N.; Ogungbemi, E.O.; El Hassan, Z.; Thompson, J.; Olabi, A.G. Effect of humidification of reactive gases on the performance of a proton exchange membrane fuel cell. Sci. Total Environ. 2019, 688, 1016–1035. [Google Scholar] [CrossRef]
  5. Kurnia, J.C.; Sasmito, A.P.; Shamim, T. Performance evaluation of a PEM fuel cell stack with variable inlet flows under simulated driving cycle conditions. Appl. Energy 2017, 206, 751–764. [Google Scholar] [CrossRef]
  6. Ge, J.; Higier, A.; Liu, H. Effect of gas diffusion layer compression on PEM fuel cell performance. J. Power Sources 2006, 159, 922–927. [Google Scholar] [CrossRef]
  7. Zhang, Z.; He, P.; Dai, Y.-J.; Jin, P.-H.; Tao, W.-Q. Study of the mechanical behavior of paper-type GDL in PEMFC based on microstructure morphology. Int. J. Hydrogen Energy 2020, 45, 29379–29394. [Google Scholar] [CrossRef]
  8. Sassin, M.B.; Garsany, Y.; Gould, B.D.; Swider-Lyons, K. Impact of Compressive Stress on MEA Pore Structure and Its Consequence on PEMFC Performance. J. Electrochem. Soc. 2016, 163, F808–F815. [Google Scholar] [CrossRef]
  9. Chang, W.R.; Hwang, J.J.; Weng, F.B.; Chan, S.H. Effect of clamping pressure on the performance of a PEM fuel cell. J. Power Sources 2007, 166, 149–154. [Google Scholar] [CrossRef]
  10. Xiao, L.; Bian, M.; Yin, Z.; Wen, X.; Zhao, C.; Sui, P.-C.; Yuan, J.; Zhang, H. Combined effects of microstructural characteristics on anisotropic transport properties of gas diffusion layers for PEMFCs. Int. J. Hydrogen Energy 2022, 47, 37978–37989. [Google Scholar] [CrossRef]
  11. Zenyuk, I.V.; Parkinson, D.Y.; Connolly, L.G.; Weber, A.Z. Gas-diffusion-layer structural properties under compression via X-ray tomography. J. Power Sources 2016, 328, 364–376. [Google Scholar] [CrossRef]
  12. Xiao, L.; Yin, Z.; Bian, M.; Bevilacqua, N.; Zeis, R.; Yuan, J.; Sui, P.-C. Microstructure reconstruction using fiber tracking technique and pore-scale simulations of heterogeneous gas diffusion layer. Int. J. Hydrogen Energy 2022, 47, 20218–20231. [Google Scholar] [CrossRef]
  13. Simaafrookhteh, S.; Shakeri, M.; Baniassadi, M.; Sahraei, A.A. Microstructure Reconstruction and Characterization of the Porous GDLs for PEMFC Based on Fibers Orientation Distribution. Fuel Cells 2018, 18, 160–172. [Google Scholar] [CrossRef]
  14. Ozden, A.; Shahgaldi, S.; Li, X.; Hamdullahpur, F. A review of gas diffusion layers for proton exchange membrane fuel cells—With a focus on characteristics, characterization techniques, materials and designs. Prog. Energy Combust. Sci. 2019, 74, 50–102. [Google Scholar] [CrossRef]
  15. Park, J.; Oh, H.; Ha, T.; Lee, Y.I.; Min, K. A review of the gas diffusion layer in proton exchange membrane fuel cells: Durability and degradation. Appl. Energy 2015, 155, 866–880. [Google Scholar] [CrossRef]
  16. Escribano, S.; Blachot, J.-F.; Ethève, J.; Morin, A.; Mosdale, R. Characterization of PEMFCs gas diffusion layers properties. J. Power Sources 2006, 156, 8–13. [Google Scholar] [CrossRef]
  17. Zhang, J.; Hu, Y.; Han, C.; Zhang, H. Stress response and contact behavior of PEMFC during the assembly and working condition. Int. J. Hydrogen Energy 2021, 46, 30467–30478. [Google Scholar] [CrossRef]
  18. Andisheh-Tadbir, M.; Orfino, F.P.; Kjeang, E. Three-dimensional phase segregation of micro-porous layers for fuel cells by nano-scale X-ray computed tomography. J. Power Sources 2016, 310, 61–69. [Google Scholar] [CrossRef]
  19. Xiao, L.; Luo, M.; Zhu, L.; Duan, K.; Bevilacqua, N.; Eifert, L.; Zeis, R.; Sui, P.-C. Pore-Scale Characterization and Simulation of Porous Electrode Material for Vanadium Redox Flow Battery: Effects of Compression on Transport Properties. J. Electrochem. Soc. 2020, 167, 110545. [Google Scholar] [CrossRef]
  20. Tötzke, C.; Gaiselmann, G.; Osenberg, M.; Bohner, J.; Arlt, T.; Markötter, H.; Hilger, A.; Wieder, F.; Kupsch, A.; Müller, B.R.; et al. Three-dimensional study of compressed gas diffusion layers using synchrotron X-ray imaging. J. Power Sources 2014, 253, 123–131. [Google Scholar] [CrossRef]
  21. James, J.P.; Choi, H.W.; Pharoah, J.G. X-ray computed tomography reconstruction and analysis of polymer electrolyte membrane fuel cell porous transport layers. Int. J. Hydrogen Energy 2012, 37, 18216–18230. [Google Scholar] [CrossRef]
  22. Kotaka, T.; Tabuchi, Y.; Mukherjee, P.P. Microstructural analysis of mass transport phenomena in gas diffusion media for high current density operation in PEM fuel cells. J. Power Sources 2015, 280, 231–239. [Google Scholar] [CrossRef]
  23. Banerjee, R.; Hinebaugh, J.; Liu, H.; Yip, R.; Ge, N.; Bazylak, A. Heterogeneous porosity distributions of polymer electrolyte membrane fuel cell gas diffusion layer materials with rib-channel compression. Int. J. Hydrogen Energy 2016, 41, 14885–14896. [Google Scholar] [CrossRef]
  24. Xiao, L.; Bian, M.; Zhu, L.; Duan, K.; Leng, W.; Zeis, R.; Sui, P.-C.; Zhang, H. High-density and low-density gas diffusion layers for proton exchange membrane fuel cells: Comparison of mechanical and transport properties. Int. J. Hydrogen Energy 2022, 47, 22532–22544. [Google Scholar] [CrossRef]
  25. Espinoza, M.; Andersson, M.; Yuan, J.; Sundén, B. Compress effects on porosity, gas-phase tortuosity, and gas permeability in a simulated PEM gas diffusion layer. Int. J. Energy Res. 2015, 39, 1528–1536. [Google Scholar] [CrossRef]
  26. Schulz, V.P.; Becker, J.; Wiegmann, A.; Mukherjee, P.P.; Wangb, C.-Y. Modeling of two-phase behavior in the gas diffusion medium of PEFCs via full morphology approach. J. Electrochem. Soc. 2007, 154, B419–B426. [Google Scholar] [CrossRef]
  27. Gaiselmann, G.; Tötzke, C.; Manke, I.; Lehnert, W.; Schmidt, V. 3D microstructure modeling of compressed fiber-based materials. J. Power Sources 2014, 257, 52–64. [Google Scholar] [CrossRef]
  28. Froning, D.; Brinkmann, J.; Reimer, U.; Schmidt, V.; Lehnert, W.; Stolten, D. 3D analysis, modeling and simulation of transport processes in compressed fibrous microstructures, using the Lattice Boltzmann method. Electrochim. Acta 2013, 110, 325–334. [Google Scholar] [CrossRef]
  29. Xiao, L.; Luo, M.; Zhang, H.; Zeis, R.; Sui, P.-C. Solid Mechanics Simulation of Reconstructed Gas Diffusion Layers for PEMFCs. J. Electrochem. Soc. 2019, 166, F377–F385. [Google Scholar] [CrossRef]
  30. Xia, S.; Lin, R.; Cui, X.; Shan, J. The application of orthogonal test method in the parameters optimization of PEMFC under steady working condition. Int. J. Hydrogen Energy 2016, 41, 11380–11390. [Google Scholar] [CrossRef]
  31. Wang, B.; Lin, R.; Liu, D.; Xu, J.; Feng, B. Investigation of the effect of humidity at both electrode on the performance of PEMFC using orthogonal test method. Int. J. Hydrogen Energy 2019, 44, 13737–13743. [Google Scholar] [CrossRef]
  32. Lin, R.; Diao, X.; Ma, T.; Tang, S.; Chen, L.; Liu, D. Optimized microporous layer for improving polymer exchange membrane fuel cell performance using orthogonal test design. Appl. Energy 2019, 254, 113714. [Google Scholar] [CrossRef]
  33. Liu, D.; Xia, S.; Tang, H.; Zhong, D.; Wang, B.; Cai, X.; Lin, R. Parameter optimization of PEMFC stack under steady working condition using orthogonal experimental design. Int. J. Energy Res. 2018, 43, 2571–2582. [Google Scholar] [CrossRef]
  34. Xiao, L.; Bian, M.; Sun, Y.; Yuan, J.; Wen, X. Transport properties evaluation of pore-scale GDLs for PEMFC using orthogonal design method. Appl. Energy 2024, 357, 122445. [Google Scholar] [CrossRef]
  35. Anyanwu, I.S.; Niu, Z.; Jiao, D.; Najmi, A.-U.-H.; Liu, Z.; Jiao, K. Liquid Water Transport Behavior at GDL-Channel Interface of a Wave-Like Channel. Energies 2020, 13, 2726. [Google Scholar] [CrossRef]
  36. Zhou, X.; Niu, Z.; Li, Y.; Sun, X.; Du, Q.; Xuan, J.; Jiao, K. Investigation of two-phase flow in the compressed gas diffusion layer microstructures. Int. J. Hydrogen Energy 2019, 44, 26498–26516. [Google Scholar] [CrossRef]
  37. Wang, H.; Yang, G.; Li, S.; Shen, Q.; Liao, J.; Jiang, Z.; Zhang, G.; Zhang, H.; Su, F. Effect of Binder and Compression on the Transport Parameters of a Multilayer Gas Diffusion Layer. Energy Fuels 2021, 35, 15058–15073. [Google Scholar] [CrossRef]
  38. Gao, Y.; Jin, T.; Wu, X.; Zhang, T. The Effect of Fiber Orientation on Stochastic Reconstruction and Permeability of a Carbon Paper Gas Diffusion Layer. Energies 2019, 12, 2808. [Google Scholar] [CrossRef]
  39. Chen, W.; Jiang, F. Impact of PTFE content and distribution on liquid–gas flow in PEMFC carbon paper gas distribution layer: 3D lattice Boltzmann simulations. Int. J. Hydrogen Energy 2016, 41, 8550–8562. [Google Scholar] [CrossRef]
  40. Yiotis, A.G.; Kainourgiakis, M.E.; Charalambopoulou, G.C.; Stubos, A.K. Microscale characterisation of stochastically reconstructed carbon fiber-based Gas Diffusion Layers; effects of anisotropy and resin content. J. Power Sources 2016, 320, 153–167. [Google Scholar] [CrossRef]
  41. Zhou, Y.; Lin, G.; Shih, A.J.; Hu, S.J. Assembly pressure and membrane swelling in PEM fuel cells. J. Power Sources 2009, 192, 544–551. [Google Scholar] [CrossRef]
  42. Radhakrishnan, V.; Haridoss, P. Effect of cyclic compression on structure and properties of a Gas Diffusion Layer used in PEM fuel cells. Int. J. Hydrogen Energy 2010, 35, 11107–11118. [Google Scholar] [CrossRef]
  43. Li, Y.; She, L.; Wen, L.; Zhang, Q. Sensitivity analysis of drilling parameters in rock rotary drilling process based on orthogonal test method. Eng. Geol. 2020, 270, 105576. [Google Scholar] [CrossRef]
  44. Li, X.; Hao, J. Orthogonal test design for optimization of synthesis of super early strength anchoring material. Constr. Build. Mater. 2018, 181, 42–48. [Google Scholar] [CrossRef]
  45. Luo, J.; Shao, X.; Cao, J.; Xiong, M.; Fan, W. Transverse bending behavior of the steel-UHPC lightweight composite deck: Orthogonal test and analysis. J. Constr. Steel Res. 2019, 162, 105708. [Google Scholar] [CrossRef]
  46. Hu, C.-B.; Zhang, X.-B. Influence of multiple structural parameters on interior ballistics based on orthogonal test methods. Def. Technol. 2019, 15, 690–697. [Google Scholar] [CrossRef]
  47. Gao, X.; Zhang, Y.; Zhang, H.; Wu, Q. Effects of Machine Tool Configuration on Its Dynamics Based on Orthogonal Experiment Method. Chin. J. Aeronaut. 2012, 25, 285–291. [Google Scholar] [CrossRef]
  48. Zhou, Y.; Jiao, K.; Du, Q.; Yin, Y.; Li, X. Gas diffusion layer deformation and its effect on the transport characteristics and performance of proton exchange membrane fuel cell. Int. J. Hydrogen Energy 2013, 38, 12891–12903. [Google Scholar] [CrossRef]
  49. Zhou, P.; Wu, C.W. Numerical study on the compression effect of gas diffusion layer on PEMFC performance. J. Power Sources 2007, 170, 93–100. [Google Scholar] [CrossRef]
  50. Liu, D.; Peng, L.; Lai, X. Effect of dimensional error of metallic bipolar plate on the GDL pressure distribution in the PEM fuel cell. Int. J. Hydrogen Energy 2009, 34, 990–997. [Google Scholar] [CrossRef]
  51. Li, D.; Wang, H.; Wang, X. Effect of microstructure on the modulus of PAN-based carbon fibers during high temperature treatment and hot stretching graphitization. J. Mater. Sci. 2007, 42, 4642–4649. [Google Scholar] [CrossRef]
  52. Fadzillah, D.M.; Rosli, M.I.; Talib, M.Z.M.; Kamarudin, S.K.; Daud, W.R.W. Review on microstructure modelling of a gas diffusion layer for proton exchange membrane fuel cells. Renew. Sustain. Energy Rev. 2017, 77, 1001–1009. [Google Scholar] [CrossRef]
Figure 1. Workflow of this study.
Energies 18 01561 g001
Figure 2. (a) Fiber orientation angle θ and (b) probability distribution of different fiber orientation coefficients β .
Energies 18 01561 g002
Figure 3. (a) A 3D rendering of the reconstructed GDL model by stochastic reconstruction technique, and (b) stress distribution model by compression simulation.
Energies 18 01561 g003
Figure 4. (a) Stress and stress uniformity of 9 orthogonal combinations. (b) Arithmetic mean of stress and stress uniformity for different influencing factors and levels. (c) Impact degree of 4 factors affecting the stress and stress uniformity at CR = 10%.
Energies 18 01561 g004aEnergies 18 01561 g004b
Figure 5. (a) Stress and stress uniformity of 9 orthogonal combinations; (b) arithmetic mean of stress and stress uniformity for different influencing factors and levels; (c) impact degree of 4 factors affecting the stress and stress uniformity at CR = 20%.
Energies 18 01561 g005aEnergies 18 01561 g005b
Figure 6. Comparison between prediction expressions and compression simulations for (a) average stress, (b) stress uniformity with CR = 10%, (c) average stress, and (d) stress uniformity with CR = 20%.
Energies 18 01561 g006
Table 1. Material parameters of the fibers.
MaterialsFrictional
Coefficient
Young’s
Modulus [Pa]
Poisson’s RatioDensity
[g/cm3]
Fiber0.16.5 × 1090.2561.76
Table 2. Values of microstructure characteristics with 4 factors and 3 levels.
CFD ϕ β T G D L
A/μmBCD/μm
670%1180
875%2210
1080%3240
Table 3. Orthogonal combinations and corresponding stress distribution with different CRs.
Case NumberCFD ϕ β T G D L Average StressStress Uniformity (Standard Deviation)Average StressStress Uniformity (Standard Deviation)
(CR = 10%)(CR = 20%)
A/μmBCD/μmMPa(CR = 10%)MPa(CR = 20%)
1670%11803.65914.992410.155312.822
2675%32104.60686.240714.240017.9117
3680%22404.91858.646710.022913.5792
4870%32409.416612.384824.714128.9013
5875%21807.039810.177918.737225.1538
6880%12105.21719.028711.581616.1833
71070%221010.018114.149925.684432.1245
81075%12407.960111.563318.590624.8747
91080%31804.94898.360610.242816.6604
Table 4. Range of variation of test factors.
Factors CFD   ( μ m ) ϕ β T G D L ( μ m )
    x i x1x2x3x4
range6–1070–80%1–3180–240
Table 5. Factor level coding table.
Normative Variables CFD   ( μ m )
x 1
ϕ
x 2
β
x 3
T G D L   ( μ m )
x 4
Highest level
(1)
1080%3240
Lowest level
(−1)
670%2180
Zero level
(0)
875%1210
Variation interval
i
25%130
Table 6. Regression orthogonal test design and calculation results.
CaseCFD ϕ β T G D L Average StressStress Uniformity (Standard Deviation)Average StressStress Uniformity (Standard Deviation)
CR = 10%CR = 20%
Z1Z2Z3Z4MPaCR = 10%MPaCR = 20%
111115.938610.249411.259217.0573
21−11−19.882413.809225.907632.184
31−1−1110.052313.85924.884230.4059
4−111−13.57665.51638.777111.8487
5−11−113.17986.34426.37358.957
6−1−1−1−13.65914.992410.155312.822
700007.586310.546419.016024.9429
800007.586310.546419.016024.9429
900007.586310.546419.016024.9429
Disclaimer/Publisher’s Note: The statements, opinions and data contained in all publications are solely those of the individual author(s) and contributor(s) and not of MDPI and/or the editor(s). MDPI and/or the editor(s) disclaim responsibility for any injury to people or property resulting from any ideas, methods, instructions or products referred to in the content.

