Abstract
Annual energy consumption has surged due to suboptimal energy efficiency, resulting in an electricity supply shortage in Sulaimani, an Iraqi city in a temperate climate zone. This mixed-methods study aims to optimise energy efficiency in Sulaimani’s office buildings using IDA Indoor Climate and Energy (IDA ICE) dynamic simulation software v4.8. First, we collected data and developed 204 scenarios based on three prevalent plan typologies, linear (T1), concentric (T2), and courtyard (T3), utilising common materials such as Alucobond (M1), cement plaster (M2), Styropor (M3), and a curtain wall (M4). Afterwards, we performed relevant analyses employing External Venetian Blinds (EVBs) to reduce cooling load and/or Expanded Polystyrene (EPS) to reduce heating load. Notably, the results proved that EPS was more effective than EVBs in reducing both heating and cooling loads in the temperate climate zone, achieving reductions of up to 38% for T1. Meanwhile, EPS contributed to a heating load reduction of up to 52% for T3, and this adversely impacted overall energy consumption. Both EVBs and EPS could reduce total energy consumption by up to 30% in T2. In conclusion, the total energy consumption increased in temperate climate zones when EVBs were utilised, but this effect varied based on the various typologies of office buildings.
1. Introduction
In a world where energy consumption is growing at an alarming rate, concerns are rising due to global warming, the depletion of energy resources, and supply difficulties [1,2,3]. Currently, the building sector accounts for approximately 36% of global energy consumption alone, which is expected to increase to 50% by 2050 [4,5,6]. People spend a colossal amount of their lives in different spaces, accounting for around 90% of an individual’s lifespan spent indoors, working, and sleeping [7]. In particular, office buildings are exceptionally important indoor spaces that play a crucial role in human creativity and productivity. Thermal comfort is another critical aspect of building performance to optimise, as it directly affects the well-being and productivity of occupants [8].
Heating and cooling in office buildings are major contributors to total energy consumption, particularly in temperate climate zones that have moderate temperatures. However, certain characteristics, such as long, sunny summers; intense solar radiation; urban heat island effects; poor building design; and sudden climatic variations during transitional seasons, can lead to overheating and a high cooling load in buildings.
The expected increase in energy demand will not only lead to higher energy consumption and carbon dioxide (CO2) emissions but can also negatively impact productivity and human comfort due to overheating and overcooling issues [9]. To address these issues and reduce high energy demand, several effective approaches can be implemented. One such approach is the use of a double-skin façade [10], which has been proven to be effective in reducing energy consumption [11]. A study in Turkey used this strategy to reduce cooling energy consumption, resulting in a 27% cooling energy reduction [12].
Other strategies, such as the use of double-glazing windows, thermal insulation sheets, and horizontal shading, have also successfully reduced energy consumption for office buildings in Iran by 14%, 18%, and 13%, respectively [13]. The use of phase change materials (PCMs) has led to an 8% to 15% reduction in cooling energy consumption in Iraq [14]. Recently, Twana et al. [15] developed a fixed shading device that mimics the curvatures of a cactus plant, which is capable of reducing cooling energy consumption by up to 31% in Iraq using IDA ICE dynamic energy simulation software v4.8.
In Guangzhou city in China, Huo et al. [16] reduced cooling energy demand by 38% with three-pane glazing. External shading elements, such as EVBs, were tested in eight cities in China; EVBs have also been found to be a significant factor in reducing energy demand by 30% to 50%. Fedorczak-Cisak et al. [17] analysed the effects of using EVBs on users’ thermal comfort in highly glazed office rooms in a transition season of a temperate zone in Poland. They reduced employees’ thermal discomfort hours by 30% on chilly but sunny days. Their approaches could result in a reduction in the cooling system’s operating hours from 12 h to even less than 4 h a day.
A significant rise in heating demand was noted while reducing cooling load in a study in Australia by Bunning et al. [18]. They identified some shading methods as effective in reducing cooling energy requirements, but these shading methods increased heating demand by 24.9% in Melbourne and 24% in Brisbane while reducing cooling demand. These shading methods could only reduce the cooling demand by utilising vertical and/or horizontal shading devices during the summer, which led to increased heating and lighting demands during the winter.
As a strategy, other researchers have also explored ways to reduce the amount of heating needed in buildings. In Turkey, an energy design method that utilises different types of glass resulted in a 19.7% decrease in annual energy consumption for cooling processes and a 34.4% decrease in annual energy consumption for heating processes [19]. In Iran, a 4 cm insulation thickness resulted in energy savings of 13% in cooling demand and between 12.8% and 69% in heating demand, with a payback cost between 3.8 and 10.8 years [20]. In Jordan, EPS thermal insulation was identified as the best energy-saving solution with a payback cost of over 10 years [21]. The effects of various typologies and some other variables on total energy reduction via EVBs, EPS, and EVBs + EPS in a specific climate zone, such as a temperate climate zone, have not been fully explored.
The electricity consumption of Sulaimani as the study area, a city in a temperate climate zone, ranged from 2523 megawatts in January to 1236 megawatts in October, with an electrical supply producing a capacity of 900 megawatts in 2021. The levels (minimum and maximum) of the electricity supply shortage were significant at 37% and 180% in October and January, respectively. See Figure 1 for the details of electricity consumption in Sulaimani in 2021.
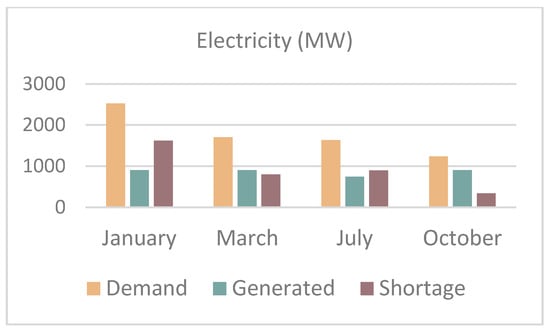
Figure 1.
Electricity consumption in Sulaimani in 2021.
During national electricity cut-off periods, most buildings used their electrical generators, which resulted in increased fossil fuel consumption and pollution levels. Consequently, the national electrical supply was continuously cut off throughout the year and was replaced by community generators [22]. The energy consumption of split heating, ventilation, and air conditioning (HVAC) systems affected the primary energy source for heating and cooling buildings in the study area. Since they lack a passive strategy to reduce energy consumption, electricity consumption increased. A lack of electricity and increased power outages were recorded due to rising demand surpassing supply, particularly in the summer and winter seasons.
To effectively overcome these issues, both EPS and EVBs are widely used in insulation due to their thermal properties, cost-effectiveness, and lightweight nature [22,23]. Both contribute to lower carbon emissions and are increasingly popular as the construction industry shifts toward sustainability. Across various office building typologies in temperate climate zones, the literature lacks comprehensive insights into how EPS, EVBs, and their combination (EPS + EVBs) affect cooling, heating, overall energy reduction, and thermal comfort. This study uses IDA ICE dynamic simulation software to highlight the effects of applying EVBs, EPS, and EVBs + EPS on cooling, heating, and total energy reduction across various office building typologies in temperate climate zones. IDA ICE, as a dynamic energy simulation software, models time-dependent variations in building performance, such as temperature, energy use, and comfort. This software was used to incorporate interactions between systems, materials, weather, and occupant behaviours for accurate, time-based analysis.
2. Study Area
Sulaimani is one of the major cities in the Kurdistan region of Iraq in a temperate climate zone [24]. The master plan of the city is bounded by two mountain ranges, Goizha and Baranan, which are 1700 m and 1100 m above mean sea level (MSL), respectively. Additionally, the Goizha series is located in the 38° N zone of the Universal Transverse Mercator (UTM) projection. The latitudes and longitudes of the series are 35.567° N and 45.416° E with an average elevation of 880 m above the MSL [25]. Figure 2 shows the climate zones of Iraq.
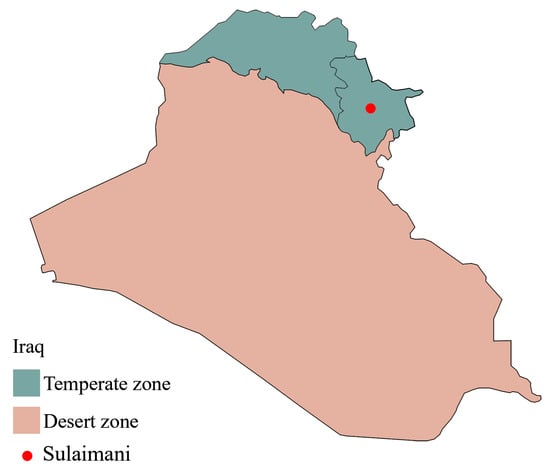
Figure 2.
The climate zones of Iraq.
Temperature
Based on Figure 3, two average temperatures at day and night were reported for the monthly average temperature in 2021. Interestingly, a high temperature value ≥39 °C was observed in June, July, and August, while a low temperature value ≤1 °C was observed in December, February, and March [26].
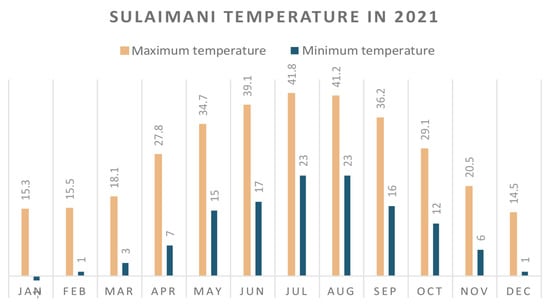
Figure 3.
The temperature of Sulaimani in 2021.
3. Materials and Methods
This study utilised mixed methods to assess heating and cooling for various office building typologies, employing a field survey to gather office building data in Sulaimani, Iraq. Through IDA ICE software, 204 different scenarios were modelled and optimised, and a Seek Thermal Compact Pro Fastframe IOS 53494 camera (Seek Thermal, Santa Barbara, CA, USA) was used to capture thermal images in real time under stable weather conditions using spectrum setting. The data were visually assessed and post-processed in order to verify the simulation outcomes.
3.1. Data Collection
A survey of 359 office buildings in the study area was conducted between March and April 2022. The survey utilised video recordings to compile data and determine variables, such as their typology [which is depicted in Figure 4], building type [which is shown in Figure 5] and materials, and orientation. Therefore, the prevalence of the currently detailed typologies is precisely identified in Table 1 as follows:
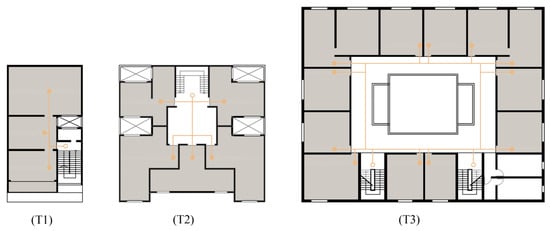
Figure 4.
Common office building typologies in Sulaimani.
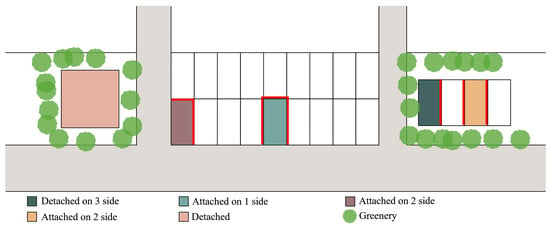
Figure 5.
Building attachments of office building typologies.

Table 1.
The prevalence of various variables and typologies along with their descriptions.
3.2. Boundary Conditions
Based on the survey, general boundary conditions were defined in this study as follows:
- The external environment, such as the temperate climate zone.
- The areas of T1, T2, and T3 are 220 m2, 400 m2, and 1050 m2, respectively.
- The number of floors is taken as five for each typology. Then, the middle (3rd) floor of height 3.4 m is simulated.
- All windows of the office buildings are assumed to be non-opened (as mentioned in the IDA ICE software settings).
- The indoor temperature is kept between 21 °C and 25 °C, according to ASHRAE 55 [27].
- Daylight in workplaces is provided at 500 lux, according to ASHRAE 55 [27].
3.3. Data Processing and Simulation
The IDA ICE energy simulation software is a validated dynamic energy simulation tool capable of simulating rectilinear shading devices as well as curvilinear shading devices, the latter simulated with the AutoCAD-SketchUp-IDA ICE method [15].
IDA ICE software can simplify the building simulation model and simulate multiple zones simultaneously for the entire building. Thus, this study utilised IDA ICE 4.8 software as a reliable energy simulation software to measure the performance of buildings.
The software maintains pre-set occupant comfort and calculates the needed energy while accurately simulating geometries, structures, systems, and controls [28]. Based on the typical design of each typology in Figure 4, the structure specifications and opening characteristics were implemented into the simulation software for each design scenario. The annual climate data in the study area were simulated from 1 January to 31 December 2021.
The boundary condition inputs into the software were the following: The temperature range was set from 21 to 25 °C, which is the expected comfortable standard temperature during working hours [29]. Additionally, the air handling unit (AHU) operates during the daily working hours of 8:00 to 17:00. The software also has all the windows set to ‘never open’, and the expected illumination is set to 500 lux; for the material of the wall, it was set as shown in Figure 6.
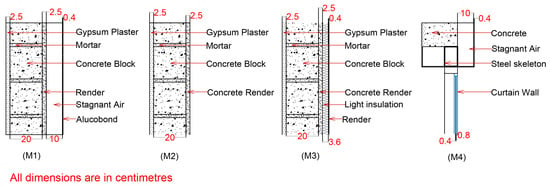
Figure 6.
The cross-section of the wall materials for all scenarios.
3.4. Formulating Possible Design Scenarios and Solutions
Rare and repeated samples from the 359 surveyed samples were excluded. Then, 204 possible scenarios were formulated. Moreover, the prevalence of variables in the survey samples was coded, such as typology (T1, T2, and T3), building type (B0, B1, B2, and B3), building material (M1, M2, M3, and M4), and orientation (N, NE, NES, NESW, NS, and WN; E, ES, ESW, ESWN, and EW; S, SW, SWN, SWNE, SN, and SE; and W, WN, WNE, WNES, WE, and WS).
Following this, the codes for the four variables were combined to reflect the definite possibility of the design scenario. For instance, the code design scenario T3B3M3E designates an office building of the courtyard typology (T3), attached on three sides (B3), with Styropor as the primary building material façade (M3) and its direction towards the east. The 204 design scenarios, as illustrated in the methodology diagram in Figure 7, were formulated for the energy simulation of typologies T1, T2, and T3 following the prevalence items in the 359 surveyed samples.
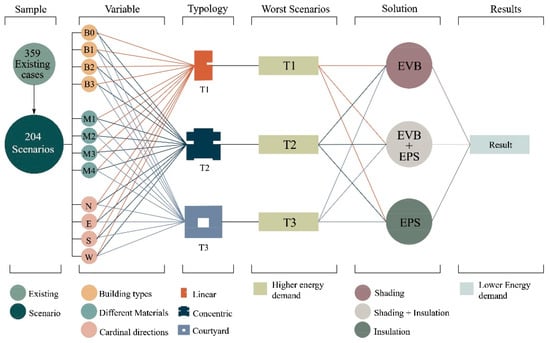
Figure 7.
Methodology diagram of this study.
Afterwards, three solutions of EVBs, EPS, and combined EVBs and EPS were used for all scenarios to simulate their annual heating, cooling, and total energy consumption, as shown in Figure 7. EVBs are a template in IDA ICE, 7 cm wide, with a vertical interval of 10 cm. The shading angle is set to 45 degrees to prevent sunlight from entering the space; see Figure 8.
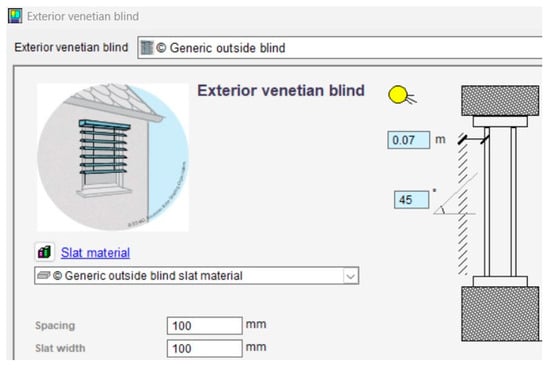
Figure 8.
The detailed EVBs from IDA ICE software.
4. Results
Initially, this study focused on the prevalence of the variables of office building typologies, consequently paving the way for the formulation and energy simulation of potential scenarios using IDA ICE software. Then, the scenario with the maximum energy consumption for each typology was selected; EVBs, EPS, or both were added; and then the scenario was simulated using IDA ICE.
4.1. Energy Consumption Analysis and Thermal Image
The results of the 204 simulated scenario designs were divided into three categories based on the typologies of office buildings (T1, T2, and T3). The minimum and maximum energy consumptions of the three typologies were 82 and 275 kWh/m2 for T1, 78 and 221 kWh/m2 for T2, and 86 and 150 kWh/m2 for T3, respectively (see Figure 9).
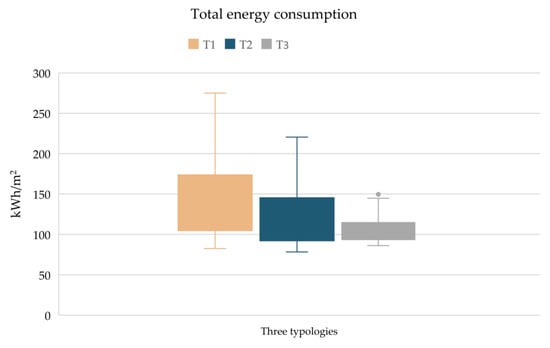
Figure 9.
The total energy consumption of the design scenarios.
On 4 December 2022, at a temperature of 5 °C, a photo was taken with a thermal camera to demonstrate the thermal bridges (T2B3M1S and T1B2M2WN with energy consumptions of 80 and 205 kWh/m2, respectively), which are depicted in Figure 10. The intense red hue of the thermal image (maximum energy consumption scenario) and minimal red colour (minimum energy consumption scenario) confirmed the energy consumption estimation using IDA ICE software.
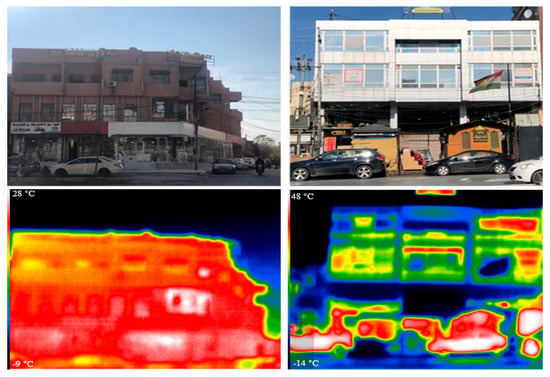
Figure 10.
Normal and thermal images of heating energy losses in winter season.
4.2. Impact of EVBs and EPS on Energy Performance in Office Buildings
The cooling load during summer consumes a huge amount of total energy; after applying EVBs, the cooling load is reduced by up to 38%, as shown in Table 2.

Table 2.
The effects of EVBs on the energy performance of office building typologies and their comparisons to the base models.
The heating load during winter consumes a significant amount of the total energy; after applying EPS, the heating load is reduced by up to 52% for T3, as shown in Table 3. EPS can also reduce the cooling load during the summer by up to 13% for T2.

Table 3.
The effects of EPS on the energy performance of office building typologies and their comparisons to the base models.
The effects of EVBs + EPS on total energy reduction varies based on typology, as shown in Table 4. The application of EVBs + EPS reduced total energy consumption by 23%, 30%, and 25% in T1, T2, and T3, respectively. The bar graph represents the effects of EVBs, EPS, and EVBs + EPS on the cooling and heating loads for three typologies, as shown in Figure 11. The application of EPS on the T1 and T2 typologies had the highest total energy saving rates, while the application of EVBs + EPS on the T3 typology had the highest total energy saving rates.

Table 4.
The effects of EVBs + EPS on the energy performance of office building typologies and their comparisons to the base models.
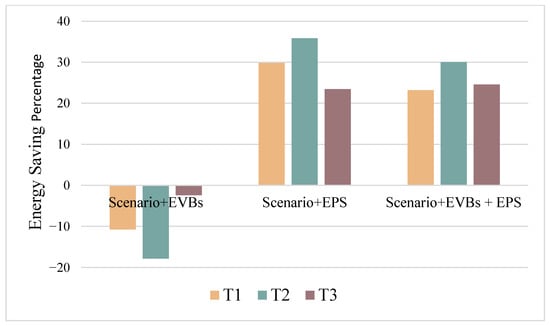
Figure 11.
The effects of EVBs, EPS, and EVBs + EPS on the total energy consumption of office building typologies with the highest total energy consumption.
4.3. Impact of EVBs and EPS on Thermal Comfort in Office Buildings
For the best-performing scenarios (T1B3M1S, T2B3M1S, and T3B3M1N), thermal comfort was evaluated with and without the implementation of EVBs and EPS. For T1 (South-Facing Orientation), the use of EVBs + EPS resulted in a significant increase in thermal comfort compliance by reducing unacceptable thermal hours from 594 to 0; see Figure 12. In a similar manner, for T2 (South-Facing Orientation), the intervention led to a reduction in unacceptable hours from 576 to 0; see Figure 13. In contrast, for T3 (North-Facing Orientation), the impact was insignificant as unacceptable hours only decreased from 829 to 827; see Figure 14.
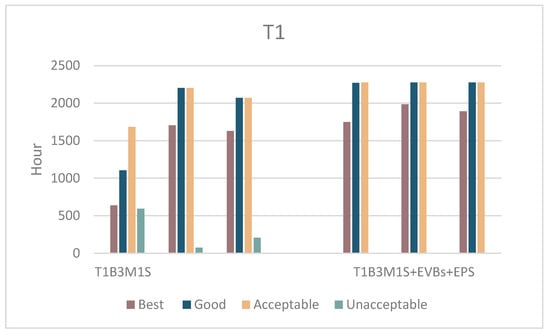
Figure 12.
The effects of EVBs + EPS on thermal comfort in terms of office building typology (T1B3M1S).
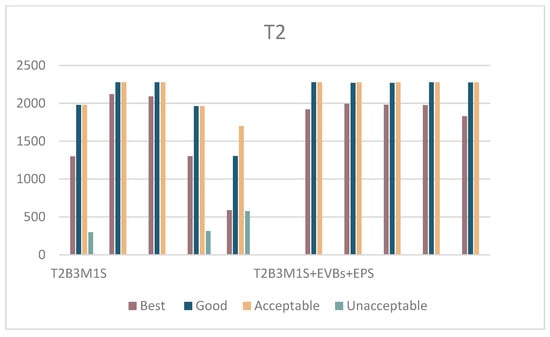
Figure 13.
The effects of EVBs + EPS on thermal comfort in terms of office building typology (T2B3M1S).
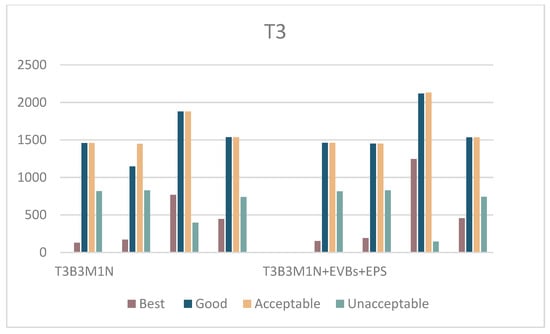
Figure 14.
The effects of EVBs + EPS on thermal comfort in terms of office building typology (T3B3M1N).
5. Discussion
Energy consumption is a critical concern in modern times, and office buildings in Iraq are no exception. Our study conducted a comprehensive data analysis focused on Sulaimani, a city in a temperate climate zone (cold semi-arid steppe climate). After collecting data from 359 office buildings, we created 204 scenarios, which were simulated using IDA ICE dynamic energy simulation software v4.8. These 204 formulated scenarios encompassed three prevalent office building typologies (T1, T2, and T3), four building types (B0, B1, B2, and B3), the most used building materials (Alucobond, cement plaster, Styropor, and curtain wall), and four cardinal directions.
The scenario with the lowest energy consumption for the T1 typology was attached on three sides (Alucobond–south) at 82 kWh/m2, while for the T2 typology, it was attached on three sides (Alucobond–north) at 78 kWh/m2, and for the T3 typology, it was attached on three sides (Alucobond–north) at 86 kWh/m2. In contrast, the highest energy consumption for the T1 typology was observed with detached cement plaster at 274 kWh/m2. Regarding the T2 and T3 typologies, the highest energy consumption was observed with detached cement plaster at 251 kWh/m2 and 150 kWh/m2, respectively.
The simulation results are corroborated by thermal camera images that show wall heat transfer for both the best and worst-case scenarios. In the worst case, where low wall quality led to increased heat loss, excessive red areas on the camera suggest poor thermal performance. And in the best case, the images showed effective heat retention, confirming good insulation.
EVBs are useful for reducing the cooling load of buildings; however, their effects on total energy consumption in temperate climate zones change greatly with building typologies. Implementing EVBs resulted in a cooling energy reduction of 37%, 22%, and 23% for the T1, T2, and T3 typologies, respectively. In 2023, Huo et al. [16] tested EVBs in eight different cities, including Kunming city with a temperate climate. They used triple glazing with less than 50% transmission with EVBs, which reduced cooling energy by 30% to 50% at a 0-degree angle [totally closed], while our study used two-pane glazing with 70% transmission at a 45-degree angle.
In our study, the heating demand increased due to the implementation of EVBs by 28%, 31%, and 19% for the T1, T2, and T3 typologies, respectively. In 2019, in the temperate zone of Izmir City in Turkey, EVBs reduced total energy by 14% [30], while in our study, the total energy consumption showed an 11%, 18%, and 2% increase for the T1, T2, and T3 typologies, respectively. Our investigation showed that linear typologies (T1) had the highest increase in total energy consumption, while courtyard typologies (T3) had the lowest increase in total energy consumption. The low quality of the wall increased the energy consumption of the typologies with EVBs, and the office building typologies started consuming more heating energy, which in turn caused negative total reduction values; see Figure 11.
A study in Iraq applied a bio-curvilinear shading device inspired by Cacti, which reduced cooling load by 22% to 31% on the same three office building typologies (T1, T2, and T3) without an insulation layer [15]. Meanwhile, Nicoletti et al. [31] reduced the cooling load by 27.6% to 38.7% by applying EVBs using an artificial neural network in Rome. The existing literature emphasises using EVBs for shading to reduce cooling demand and EPS for insulation in buildings to save energy [32,33,34]. However, while EVBs decrease cooling demand in temperate zones, they increase heating and lighting energy consumption.
The application of a 5 cm EPS in our study led to heating energy reductions of 45%, 51%, and 52% for the T1, T2, and T3 typologies, respectively. According to Zhu et al. [35], the optimum thicknesses of EPS in Beijing, Shanghai, and Kunming in temperate climate zones are 21.6 cm, 20.5 cm, and 16.3 cm, respectively. The application of EPS on these typologies had a higher total energy saving rate compared to EVB application on these typologies; see Figure 11. Therefore, EPS is recommended as a superior solution for reducing both heating and cooling demand compared to EVBs. However, when EVBs and EPS were applied to cement plaster material with a Window-to-Wall Ratio (WWR) of 50%, it resulted in a total energy reduction of 23%, 30%, and 25% for the T1, T2, and T3 typologies, respectively. Applying EVBs + EPS is the most effective method for cooling energy reduction and improving thermal comfort, while solely applying EPS can significantly reduce heating and total energy consumption.
Thermal comfort was evaluated with and without the implementation of EVBs + EPS for the best-performing scenarios (T1B3M1S, T2B3M1S, and T3B3M1N). The results suggest that there are differences in the levels of improvement attained across different building types and orientations. In the T1 and T2 typologies (South-Facing Orientation), unacceptable thermal hours were reduced to 0. This demonstrates the effectiveness of EVBs + EPS in increasing indoor comfort. However, in T3, the impact was insignificant because of the orientation and other design factors.
These results emphasise the importance of EVBs + EPS in increasing thermal comfort in south-facing buildings where the complete elimination of unacceptable hours was achieved. However, for T3, the north-facing typology, the improvement was minimal, showing that to enhance thermal performance, other methods need to be implemented. To enhance thermal comfort, strategies such as comfort-based thermostats and shading devices help regulate temperature, mitigate solar radiation effects, and improve energy efficiency [36]. The reliance on the IDA ICE dynamic simulation software, which uses fixed boundary conditions (such as set indoor temperatures and non-openable windows), may limit this study and not fully capture the real-world variability in occupant behaviour, building operations, and weather fluctuations. Future studies can focus on in-depth economic analysis, such as cost–benefit assessments or payback period evaluations, to promote more sustainable designs.
6. Conclusions
This study explored the energy performance of and thermal comfort enhancement in office buildings in Sulaiman in a temperate climate zone using dynamic simulations in IDA ICE v4.8. This study focused on three predominant typologies of office buildings such as linear (T1), concentric (T2), and courtyard (T3) typologies, and the effectiveness of External Venetian Blinds (EVBs) and Expanded Polystyrene (EPS) on heating, cooling, total energy usage, and thermal comfort was evaluated.
We concluded that while EVB usage is useful in reducing energy consumption in temperate zones, EVBs perform poorly compared to EPS. EPS usage resulted in a heating demand reduction of over 52%, while EVB usage was able to reduce cooling loads by up to 38%. However, there was an overall increase in total energy consumption using EVBs, especially in linear typologies (T1).
The combination of EVBs and EPS could achieve an energy reduction of as high as 30%, notably in the concentric typologies (T2). On the contrary, when only EVBs were used, the total energy consumption increased, which meant that they are not appropriate for use in temperate climates.
In conclusion, the application of EVBs + EPS together can significantly improve thermal comfort, while solely applying EPS can significantly reduce energy consumption. These findings underscore the value of having a holistic view of the design of energy-efficient buildings. Focusing on the technologies that will follow this study, it would be beneficial to consider adding insulation to shading devices to increase cooling and energy efficiency and boost thermal comfort. Moreover, assessing energy performance in real time alongside conducting cost–benefit analyses could provide useful information on the feasibility of sustainable building practices over time.
Author Contributions
Conceptualisation, T.R.F.; methodology, T.R.F.; software, T.R.F.; validation, B.B. (Bálint Baranyai); formal analysis, T.R.F.; investigation, T.R.F. and B.B. (Bálint Baranyai); data curation, T.R.F.; writing—original draft preparation, T.R.F.; writing—review and editing, T.R.F., T.J.K., B.B. (Bálint Bachmann), and B.B. (Bálint Baranyai); visualisation, T.R.F.; supervision, T.J.K. and B.B. (Bálint Baranyai); funding acquisition, B.B. (Bálint Bachmann). All authors have read and agreed to the published version of the manuscript.
Funding
The APC was funded by the University of Pécs.
Data Availability Statement
The original contributions presented in the study are included in the article, further inquiries can be directed to the corresponding author.
Acknowledgments
The research in this publication was supported by the Faculty of Engineering and Information Technology, the University of Pécs.
Conflicts of Interest
The authors declare no conflicts of interest.
Nomenclature
| AHU | Air handling unit |
| B0 | Detached building |
| B1 | Building attached on one side |
| B2 | Building attached on two sides |
| B3 | Building attached on three sides |
| CO2 | Carbon dioxide |
| EPS | Expanded Polystyrene |
| EVBs | External Venetian Blinds |
| HVAC | Heating, ventilation, and air conditioning |
| IDA ICE software | IDA Indoor Climate and Energy software |
| M1 | Alucobond material |
| M2 | Cement plaster material |
| M3 | Styropor material |
| M4 | Curtain wall material |
| MSL | Mean sea level |
| PCM | Phase change material |
| T1 | Linear typology |
| T2 | Concentric typology |
| T3 | Courtyard typology |
| U-value (thermal transmittance) | (W/m²·K)—where R is the thermal resistance of the material or assembly |
| UTM | Universal Transverse Mercator |
| WWR | Window-to-Wall Ratio |
References
- Wei, S.; Tien, P.W.; Calautit, J.K.; Wu, Y.; Boukhanouf, R. Vision-Based Detection and Prediction of Equipment Heat Gains in Commercial Office Buildings Using a Deep Learning Method. Appl. Energy 2020, 277, 115506. [Google Scholar] [CrossRef]
- Ramesh, T.; Prakash, R.; Shukla, K.K. Life Cycle Energy Analysis of Buildings: An Overview. Energy Build. 2010, 42, 1592–1600. [Google Scholar] [CrossRef]
- Bilgili, F.; Ozturk, I.; Kocak, E.; Kuskaya, S.; Cingoz, A. The Nexus between Access to Electricity and CO2 Damage in Asian Countries: The Evidence from Quantile Regression Models. Energy Build. 2022, 256, 111761. [Google Scholar] [CrossRef]
- Shaviv, E.; Yezioro, A.; Capeluto, I.G. Energy Code for Office Buildings in Israel. Renew. Energy 2008, 33, 99–104. [Google Scholar] [CrossRef]
- V. P. Wright World Energy Outlook; International Energy Agency: Paris, France, 2022; pp. 23–28.
- Koç, S.G.; Maçka Kalfa, S. The Effects of Shading Devices on Office Building Energy Performance in Mediterranean Climate Regions. J. Build. Eng. 2021, 44, 102653. [Google Scholar] [CrossRef]
- Klepeis, N.E.; Nelson, W.C.; Ott, W.R.; Robinson, J.P.; Tsang, A.M.; Switzer, P.; Behar, J.V.; Hern, S.C.; Engelmann, W.H. The National Human Activity Pattern Survey (NHAPS): A Resource for Assessing Exposure to Environmental Pollutants. J. Expo. Sci. Environ. Epidemiol. 2001, 11, 231–252. [Google Scholar] [CrossRef]
- d’Ambrosio Alfano, F.R.; Olesen, B.W.; Pepe, D.; Palella, B.I. Working with Different Building Energy Performance Tools: From Input Data to Energy and Indoor Temperature Predictions. Energies 2023, 16, 743. [Google Scholar] [CrossRef]
- Alnuaimi, A.; Natarajan, S.; Kershaw, T. The Comfort and Energy Impact of Overcooled Buildings in Warm Climates. Energy Build. 2022, 260, 111938. [Google Scholar] [CrossRef]
- Ascione, F.; Bianco, N.; Iovane, T.; Mastellone, M.; Mauro, G.M. The Evolution of Building Energy Retrofit via Double-Skin and Responsive Façades: A Review. Sol. Energy 2021, 224, 703–717. [Google Scholar] [CrossRef]
- Kuru, A.; Oldfield, P.; Bonser, S.; Fiorito, F. Biomimetic Adaptive Building Skins: Energy and Environmental Regulation in Buildings. Energy Build. 2019, 205, 109544. [Google Scholar] [CrossRef]
- Sultan Qurraie, B.; Arslan, B. Investigation of Thermal and Energy Performance of Double Skin Facades in Hot Climate Regions in Turkey. Comput. Res. Prog. Appl. Sci. Eng. 2022, 8, 1–14. [Google Scholar] [CrossRef]
- Fathalian, A.; Kargarsharifabad, H. Actual Validation of Energy Simulation and Investigation of Energy Management Strategies (Case Study: An Office Building in Semnan, Iran). Case Stud. Therm. Eng. 2018, 12, 510–516. [Google Scholar] [CrossRef]
- Al-Yasiri, Q.; Szabó, M. Phase Change Material Coupled Building Envelope for Thermal Comfort and Energy-Saving: Effect of Natural Night Ventilation under Hot Climate. J. Clean. Prod. 2022, 365, 132839. [Google Scholar] [CrossRef]
- Fattah, T.R.; Jalal, S.J.; Katona, T.J.; Baranyai, B. Bio-Curvilinear Shading Device for Cooling Load Reduction in Office Buildings Assessed by a Novel Energy Simulation Framework. Results Eng. 2024, 23, 102493. [Google Scholar] [CrossRef]
- Huo, H.; Xu, W.; Li, A.; Wu, J.; Guo, J. A Simple Evaluation Method of External Venetian Blind Shading Performance for Nearly Zero Energy Buildings. Renew. Energy 2023, 218, 119260. [Google Scholar] [CrossRef]
- Fedorczak-Cisak, M.; Nowak, K.; Furtak, M. Analysis of the Effect of Using External Venetian Blinds on the Thermal Comfort of Users of Highly Glazed Office Rooms in a Transition Season of Temperate Climate—Case Study. Energies 2019, 13, 81. [Google Scholar] [CrossRef]
- Bunning, M.E.; Crawford, R.H. Directionally Selective Shading Control in Maritime Sub-Tropical and Temperate Climates: Life Cycle Energy Implications for Office Buildings. Build. Environ. 2016, 104, 275–285. [Google Scholar] [CrossRef]
- Eskin, N.; Türkmen, H. Analysis of Annual Heating and Cooling Energy Requirements for Office Buildings in Different Climates in Turkey. Energy Build. 2008, 40, 763–773. [Google Scholar] [CrossRef]
- Rosti, B.; Omidvar, A.; Monghasemi, N. Optimal Insulation Thickness of Common Classic and Modern Exterior Walls in Different Climate Zones of Iran. J. Build. Eng. 2020, 27, 100954. [Google Scholar] [CrossRef]
- Batiha, M.A.; Marachli, A.A.; Rawadieh, S.E.; Altarawneh, I.S.; Al-Makhadmeh, L.A.; Batiha, M.M. A study on optimum insulation thickness of cold storage walls in all climate zones of Jordan. Case Stud. Therm. Eng. 2019, 15, 100538. [Google Scholar] [CrossRef]
- Meddage, D.P.P.; Chadee, A.; Jayasinghe, M.T.R.; Rathnayake, U. Exploring the Applicability of Expanded Polystyrene (EPS) Based Concrete Panels as Roof Slab Insulation in the Tropics. Case Stud. Constr. Mater. 2022, 17, e01361. [Google Scholar] [CrossRef]
- Baghoolizadeh, M.; Rostamzadeh-Renani, M.; Rostamzadeh-Renani, R.; Toghraie, D. Multi-Objective Optimization of Venetian Blinds in Office Buildings to Reduce Electricity Consumption and Improve Visual and Thermal Comfort by NSGA-II. Energy Build. 2023, 278, 112639. [Google Scholar] [CrossRef]
- Kottek, M.; Grieser, J.; Beck, C.; Rudolf, B.; Rubel, F. World Map of the Köppen-Geiger Climate Classification Updated. Meteorol. Z. 2006, 15, 259–263. [Google Scholar] [CrossRef]
- Knoema Knoema. Available online: https://knoema.com/atlas/Iraq (accessed on 14 December 2024).
- Metar & Taf Weather in Sulaymaniyah. Available online: https://metar-taf.com/climate/sulaymaniyah?utm_source=chatgpt.com (accessed on 11 February 2025).
- ANSI/ASHRAE Standard 55: Thermal Environmental Conditions for Human Occupancy. Available online: https://www.ashrae.org/technical-resources/bookstore/standard-55-thermal-environmental-conditions-for-human-occupancy (accessed on 2 May 2024).
- Forlano, L. Posthumanism and Design. She Ji J. Des. Econ. Innov. 2017, 3, 16–29. [Google Scholar] [CrossRef]
- ASHRAE. ASHRAE Handbook—Fundamentals; ASHRAE: Atlanta, GA, USA, 2023. [Google Scholar]
- Kirimtat, A.; Krejcar, O.; Ekici, B.; Fatih Tasgetiren, M. Multi-Objective Energy and Daylight Optimization of Amorphous Shading Devices in Buildings. Sol. Energy 2019, 185, 100–111. [Google Scholar] [CrossRef]
- Nicoletti, F.; Kaliakatsos, D.; Parise, M. Optimizing the Control of Venetian Blinds with Artificial Neural Networks to Achieve Energy Savings and Visual Comfort. Energy Build. 2023, 294, 113279. [Google Scholar] [CrossRef]
- Khoukhi, M.; Hassan, A.; Abdelbaqi, S. The Impact of Employing Insulation with Variant Thermal Conductivity on the Thermal Performance of Buildings in the Extremely Hot Climate. Case Stud. Therm. Eng. 2019, 16, 100562. [Google Scholar] [CrossRef]
- Shi, J.; Zhao, L.; Zhang, Y.; Han, H.; Zhou, L.; Wang, C. Optimizing the Composition Design of Cement-Based Expanded-Polystyrene (EPS) Exterior Wall Based on Thermal Insulation and Flame Retardance. Polymers 2022, 14, 5229. [Google Scholar] [CrossRef]
- Azizian, M.; Tafreshi, S.N.M.; Darabi, N.J. Experimental Evaluation of an Expanded Polystyrene (EPS) Block-Geogrid System to Protect Buried Pipes. Soil Dyn. Earthq. Eng. 2020, 129, 105965. [Google Scholar] [CrossRef]
- Zhu, P.; Huckemann, V.; Fisch, M.N. The Optimum Thickness and Energy Saving Potential of External Wall Insulation in Different Climate Zones of China. Procedia Eng. 2011, 21, 608–616. [Google Scholar] [CrossRef]
- Hwang, R.-L.; Chen, W.-A. Creating Glazed Facades Performance Map Based on Energy and Thermal Comfort Perspective for Office Building Design Strategies in Asian Hot-Humid Climate Zone. Appl. Energy 2022, 311, 118689. [Google Scholar] [CrossRef]
Disclaimer/Publisher’s Note: The statements, opinions and data contained in all publications are solely those of the individual author(s) and contributor(s) and not of MDPI and/or the editor(s). MDPI and/or the editor(s) disclaim responsibility for any injury to people or property resulting from any ideas, methods, instructions or products referred to in the content. |
© 2025 by the authors. Licensee MDPI, Basel, Switzerland. This article is an open access article distributed under the terms and conditions of the Creative Commons Attribution (CC BY) license (https://creativecommons.org/licenses/by/4.0/).