Abstract
With the energy consumption of data centers continuously increasing in recent years, green data centers as a transformative solution have grown increasingly significant. In this paper, a proton exchange membrane fuel cell-based combined cooling, heating, and power (PEMFC-CCHP) system coupled with wind and solar energy is proposed to ensure an energy supply that matches the dynamic load requirements of data centers. Taking a data center located in Guiyang, China, as a case study, a TRNSYS 18 simulation model for the integrated energy system is developed, and the analysis on the energy, economic, and environmental performance of the system is performed. The results demonstrate that the integrated energy system can effectively accommodate the load fluctuations of data centers through multi-energy complementarity. The PEMFC-CCHP system achieves a high energy utilization efficiency of 0.85–0.90. Furthermore, the payback period of the integrated energy system is estimated to be between 8.2 and 13.1 years, yielding an annual reduction in CO2 emissions of 1847 t.
1. Introduction
In the era of the digital economy, data centers have become the core digital infrastructure supporting social operations, undertaking massive data processing tasks for cutting-edge technologies such as cloud computing and big data [1,2]. With the accelerated global digitalization process, the number and scale of data centers have experienced explosive growth, while their problems of high energy consumption and high carbon emissions have become increasingly prominent [3,4]. Under the dual constraints of global carbon emission reduction goals and the energy supply–demand contradiction, the construction of high-efficiency and low-consumption green data centers has transformed from an optional path to an inevitable requirement for the sustainable development of the industry [3,5,6,7].
To address the energy dilemma of data centers, academia and industry have carried out extensive explorations in the application of renewable energy, forming clean energy substitution solutions dominated by solar photovoltaic, geothermal, and wind energy [8]. In response to the intermittent characteristics of renewable energy, relevant studies have proposed adaptive technologies such as server-level power management and photovoltaic prediction scheduling frameworks, while certain progress has also been made in waste heat recovery and hybrid energy configuration [9,10,11,12,13]. However, existing technologies still struggle to achieve efficient matching between energy supply and demand, creating an urgent need for an integrated energy solution. Consequently, the proton exchange membrane fuel cell-based combined cooling, heating, and power (PEMFC-CCHP) technology has come into the research spotlight [14].
Currently, research on the comprehensive utilization of renewable energy based on PEMFC-CCHP is still in its nascent stage, with obvious research gaps and limitations. Most studies focus on partial optimization on the demand side of data centers, such as the improvement of cooling systems and the enhancement of chip heat dissipation, while few attempt to construct a systematic hybrid renewable energy system from the macro energy supply side [15,16,17,18]. Even the research related to renewable energy power supply for data centers mostly remains at the qualitative analysis stage of technical feasibility verification, lacking in-depth, refined quantitative modeling and analysis of the total cost of ownership and energy consumption structure of data centers [19,20,21,22]. A mature, universal, and economically optimal methodology for system design and operation has not yet been established [23,24,25,26,27,28].
Aiming to fill the aforementioned research gaps, this study intends to verify the technical feasibility and energy-saving and emission-reduction benefits of the wind–solar–hydrogen–storage integrated energy system based on PEMFC-CCHP in data center applications through rigorous simulation analysis and case studies. The specific objectives include first, optimizing the capacity configuration of each component in the system to achieve continuous power supply for data centers at the lowest cost; second, quantitatively analyzing the carbon emission reduction and fossil energy substitution effects of this integrated system compared with traditional power supply modes; and third, exploring its role in reducing data centers’ reliance on traditional energy sources and unstable power grids, thereby providing a technical pathway and practical paradigm for the construction of truly sustainable green data centers.
2. Methodology
A diagram of the cogeneration system proposed for green data centers that relies on wind, solar, and hydrogen energy is shown in Figure 1. A wind energy conversion system generates electric power to satisfy a demand. If the wind energy exceeds the demand, it powers an electrolyzer to produce hydrogen gas. When wind energy is less than the load, a fuel cell consumes stored hydrogen gas to produce electricity. A diesel engine generator set provides backup power if the hydrogen tank is low and there is not enough wind energy available to meet the load. The power of hydrogen gas compressor is provided either directly from a PV array or from a battery backup. The battery is recharged when excess energy is available from the PV. If there is insufficient power available from the battery and the PV, then a second diesel generator is brought online to meet the gas compressor’s load. The PEMFC, fueled by hydrogen and oxygen, features a thermal storage tank and a single-effect H2O/LiBr absorption cooling system.
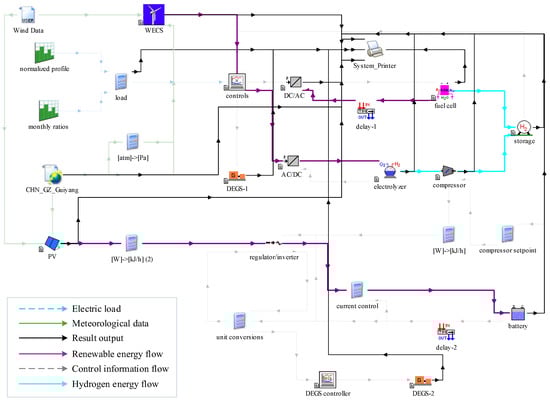
Figure 1.
Illustration of a simulation model of a cogeneration setup for green data center.
The integrated energy system involves using renewable energy to generate hydrogen for electrical needs and a PEMFC cogeneration system to supply cooling and heating to a data center and adjacent buildings. The application of more sophisticated models is described as follows.
The wind energy conversion system model is shown in the following formula:
where PWECS(v) is the output power of WECS, which is a function of the actual wind speed; v is the actual wind speed, obtained from measured meteorological data; vin is the cut-in wind speed from the equipment manual; vrat is the rated wind speed from the equipment manual; Prat is the rated power of the wind turbine from the equipment manual; c1 to c4 are dimensionless empirical coefficients of the power curve fitted from the manufacturer’s power curve data.
The PV array power generation model is shown in the following formula:
where IPV(U,GT,T) is the output current of the PV array, a function of voltage, solar irradiance, and temperature; U is the output voltage of the PV array, a simulated or measured value; GT is the incident solar irradiance from measured meteorological data; T is the PV cell temperature derived from ambient temperature; Iph is the photocurrent, dependent on GT and T; Isat is the diode reverse saturation current, dependent on T; RS is the series resistance, an intrinsic parameter of the single-diode model; Rsh is the shunt resistance, an intrinsic parameter of the single-diode model; AT is the temperature-dependent fitting parameter dependent on T; Acell is the PV cell area from the equipment manual; ηPV is the dimensionless PV cell efficiency, the ratio of output power to incident energy.
The calculation of renewable energy utilization rate is shown in the following formula [29]:
where ηPV is utilization rate of renewable energy; Eres is renewable energy generation capacity; Esup is power supply capacity of total system; Ewecs is power generation capacity of wind energy conversion system; Epv is power generation capacity of PV array model; Epemfc is power supply capacity of PEMFC; Edies is power supply capacity of diesel engine generator.
The hydrogen compressor model is shown in the following formula:
where Wploy,i is the polytropic work of the i-th compression stage describing the energy consumption of each stage in the multi-stage polytropic compression process; N is the dimensionless polytropic compression factor, a key parameter reflecting the thermodynamic process of gas compression; R is the universal gas constant; Tlow is the initial temperature of hydrogen at the compressor inlet; pi and pi+1 are the hydrogen pressures at the inlet and outlet of the i-th stage, respectively; n is the number of compression stages determined by the pressure requirement of the hydrogen storage system; Wcomp,tot is the total compression work of the hydrogen compressor representing the total energy input required for compression; is the mass flow rate of hydrogen at the compressor inlet determined by the electrolyzer’s hydrogen production rate; ηisen is the dimensionless isentropic efficiency of the compressor, a core indicator of compression performance; Wisen,tot is the total isentropic work; pin and pout are the hydrogen pressures at the compressor’s overall inlet and outlet, respectively.
The PEMFC model is shown in the following formula [19]:
where UPEMFC is the PEMFC single-cell voltage; E is the thermodynamic potential, dependent on T and gas partial pressures; T is the PEMFC operating temperature, corrected from 298 K to 298.15 K (standard temperature); pH2 and pO2 are the H2 and O2 partial pressures; p0 is the standard atmospheric pressure, fixed at 101,325 Pa; ηact is the activation overvoltage, dependent on current I and T; ηohm is the ohmic overvoltage including electrolyte and contact losses; I is the PEMFC operating current determined by load demand; ηPEMFC is energy efficiency of PEMFC; Qpemfc is heating and cooling supply capacity of PEMFC; Eelec is energy supply capacity of electrolyzer; A, B, C are empirical coefficients, respectively.
The absorption chiller model is shown in the following formula:
where hLiBr(X,T) is the specific enthalpy of the LiBr-H2O solution, a function of solution temperature T and LiBr mass concentration X, used to solve energy balance equations for the absorber and generator of the absorption chiller; a1, a2, b1, b2, c1, c2, c3, c4 are dimensionless fitting coefficients for enthalpy calculation, determined by experimental data of LiBr-H2O solution properties; X is the mass concentration of LiBr in the solution between 0 and 0.65, to avoid crystallization, a key parameter affecting solution absorption and refrigeration performance; T is the temperature of the LiBr-H2O solution varying across the absorber, generator, condenser, and evaporator of the chiller; εcool is the dimensionless cooling efficiency of the chiller, defined based on the total fuel supply rate; is the mass flow rate of refrigerant water; x is the mass fraction of water vapor at the outlet of the expansion valve; hvap is the specific latent heat of vaporization of water, dependent on evaporator temperature; is the mass flow rate of fuel for heat input, from PEMFC waste heat; LHVfuel is the lower heating value of the fuel; COPAC is the coefficient of performance of the absorption chiller, a core indicator of refrigeration efficiency; Qcool is the cooling capacity output by the chiller to meet cooling load; and is the heat input to the chiller reflecting the utilization of waste energy.
The electrolyzer model is shown in the following formula:
where UEC is the single electrolyzer cell voltage; Urev is the reversible voltage dependent on T and pressure p; rT, sT, tT are temperature-dependent polarization coefficients; Aelec is the electrolyzer electrode area; I is the electrolyzer operating current determined by the power supply system; is the H2 production rate; ηF is the dimensionless Faraday efficiency; NEC is the number of series-connected electrolyzer cells; F is the Faraday constant fixed at 96,485 C/mol; ηE is the dimensionless energy efficiency; Utn is the thermoneutral voltage under standard conditions; ηtot is the dimensionless total electrolyzer efficiency, the product of ηF and ηE.
The hydrogen gas tank model is shown in the following formula:
where pHT is the hydrogen tank pressure; n is the molar amount of H2 balanced by EC production and PEMFC consumption; R is the universal gas constant fixed at 8.314 J/(mol·K); Tg is the H2 temperature in the tank; VHT is the hydrogen tank volume; and are Van der Waals constants calculated from H2 critical parameters; Tcr is the critical temperature of hydrogen gas; pcr is the critical pressure of hydrogen gas.
The battery model is shown in the following formula:
where VLB,dis and VLB,ch are the discharge and charge voltages distinguished by operation state; Voc is the open-circuit voltage dependent on state of charge H and T; Vzp is the additional voltage term, an intrinsic battery parameter; kd and kc are the discharge and charge voltage coefficients; H is the dimensionless state of charge with a range of 0 to 1; Idis and Ich are the discharge and charge currents determined by load or charging system; rdis and rch are the discharge and charge internal resistances; and are the dimensionless discharge and charge characteristic coefficients, intrinsic battery parameters; Qdis and Qch are the discharge and charge capacities; Qrat is the rated capacity from the equipment manual; T is the battery operating temperature affecting internal resistance and capacity.
To quantify the economic feasibility of the PEMFC-CCHP-based wind–solar–hydrogen–storage integrated energy system, a mathematical framework is established around three core dimensions: initial investment cost, annual operating cost, and annual revenue [30,31]. The economic assessment model is shown in the following formula:
where ICtot is the total initial investment; Ck is the unit cost of the k-th component from market quotations; Qk is the capacity of the k-th component optimized by TRNSYS simulation; Cint is the system integration cost explicitly separated from the original rate; fint is the dimensionless integration rate; fins is the dimensionless installation rate; OCann,0 is the initial annual operating cost; OCmain,0, OCfuel,0, OClab,0 and OCmisc,0 are the initial annual maintenance costs, initial annual fuel costs, initial annual labor and miscellaneous costs; rmian is the dimensionless annual maintenance rate; OCann,t is the annual operating cost in year t; finf is the annual comprehensive inflation rate; Rann,0 is the initial annual total revenue; Re,0n and RCO2,0 are the initial annual energy-saving revenues and initial annual carbon reduction revenues; Esave and MCO2 are the annual energy saving and CO2 reduction, respectively, from simulated results; Pen,0 and PCO2,0 are the initial electricity price and initial carbon price from local policy data; Rann,t is the annual total revenue in year t; NetPt is the annual net profit in year t; NPVt is the annual net value in year t; PBPstat and PBPdyn are the static and dynamic payback periods in years, core economic indicators; i and t are the dimensionless discount rate and assessment period.
3. Case Study
This study focuses on a specific case of a data center located in Guiyang City, Guizhou Province, China, which experiences a cold climate. The energy supply for this data center employs an integrated system combining wind power, photovoltaic power generation, and hydrogen technology—specifically, an energy storage and combined heat and power system based on PEMFC, designed to meet its continuous energy demands. The integrated energy system incorporates a suite of core domestically manufactured components. Specifically, the system includes a 600 kW wind turbine provided by Goldwind Science & Technology Co., Ltd. (Urumqi, Xinjiang, China), a 35 kW PV array supplied by LONGi Green Energy Technology Co., Ltd. (Xi’an, Shaanxi, China), and a 10 kW hydrogen gas compressor manufactured by Shenyang Blower Works Group Co., Ltd. (Shenyang, Liaoning, China). Power conversion and utilization are supported by a 300 kW PEMFC system developed by Beijing HTFC Power Co., Ltd. (Beijing, China) and a 150 kW absorption chiller produced by Broad Air Conditioning Co., Ltd. (Changsha, Hunan, China). Hydrogen production and storage are enabled by a 120 kW electrolyzer supplied by Sungrow Power Supply Co., Ltd. (Hefei, Anhui, China) and a 50 m3 hydrogen storage tank manufactured by CIMC Enric Holdings Ltd. (Shenzhen, Guangdong, China). Electrical energy storage is provided by a 150 kWh battery system from Contemporary Amperex Technology Co., Limited (Ningde, Fujian, China), while auxiliary power generation is ensured by a 360 kW diesel engine supplied by Weichai Power Co., Ltd. (Weifang, Shandong, China).
The annual total energy consumption of this data center reaches 3.65 × 10⁷ kWh. Within this total, the annual electricity consumption of the cooling system, which is crucial for maintaining the operational environment of the equipment, amounts to 7.63 × 10⁶ kWh. This figure represents 20.9% of the total energy consumption, highlighting the significant portion attributed to the cooling system within the data center’s energy structure. The annual variation in electricity demand and the corresponding load factor curve for the data center are detailed in Figure 2.
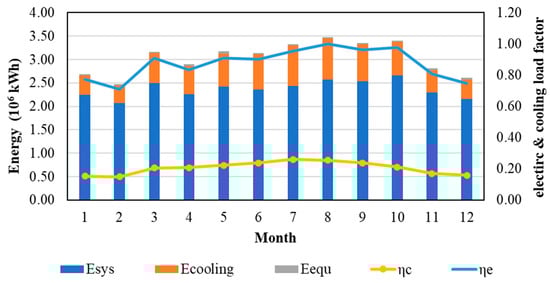
Figure 2.
Yearly energy consumption pattern of a standard data center in Guiyang, Guizhou Province, China: Esys, energy consumption of servers; Ecooling, energy consumption of cooling system; Eequ, energy consumption of lighting and auxiliary equipment; ηe, electric load factor; ηc, cooling load factor.
Local meteorological conditions are also considered in the analysis. The annual profiles of Direct Normal Irradiance (DNI) and ambient Dry Bulb Temperature (DBT) are presented in Figure 3. Specific data indicates that the maximum summer DBT reaches 35 °C, while the minimum winter temperature drops to approximately −4.7 °C. Regarding solar radiation, the maximum DNI value in summer is 3063.6 kJ/h·m2, and the winter maximum is slightly higher at 3229.2 kJ/h·m2. These datasets provide critical inputs for assessing the potential of renewable energy sources.
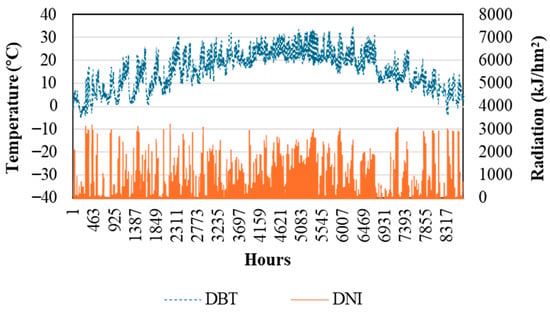
Figure 3.
Typical meteorology of DBT and DNI in Guiyang, Guizhou Province, China.
In summary, the detailed analysis of the energy consumption characteristics of this specific data center, combined with the comprehensive local meteorological data from Guiyang, establishes a solid foundation for the subsequent simulation research phases. These key input parameters and characteristic analyses will directly support core research activities in the follow-up studies, such as the optimal sizing of components within the wind–solar–hydrogen hybrid energy system and the analysis of the system’s thermal performance under both annual and transient operating conditions.
By integrating the data center load profile and meteorological data into the TRNSYS model, the optimal capacity of system components is determined through simulation analysis. The optimal capacity configuration of the wind–solar–hydrogen integrated energy system based on PEMFC, as derived from the TRNSYS model simulation, is detailed in Table 1.

Table 1.
Model parameters of this case.
This study inputs the optimized capacity configuration data of the wind–solar–hydrogen system, along with the corresponding DC load profile, solar radiation intensity, and ambient temperature data into the TRNSYS simulation model. This methodology aims to conduct an in-depth investigation into the transient thermal performance of the system under cold climate conditions.
Based on the simulation run of the TRNSYS model under the specified operating and climatic conditions, the annual output power curve of the power supply components detailed in Figure 4 and the annual load profile of the PEMFC detailed in Figure 5 were generated. These results provide a critical basis for evaluating the system’s thermal behavior and energy distribution throughout the year.
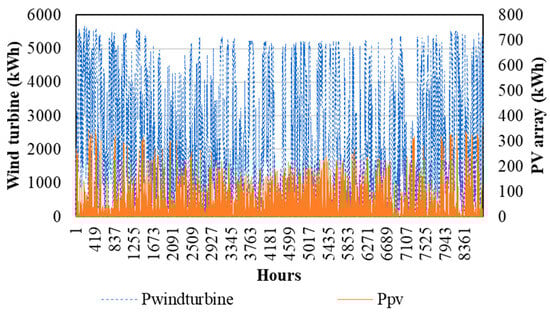
Figure 4.
Annual profile of power generation of wind turbine and PV array.
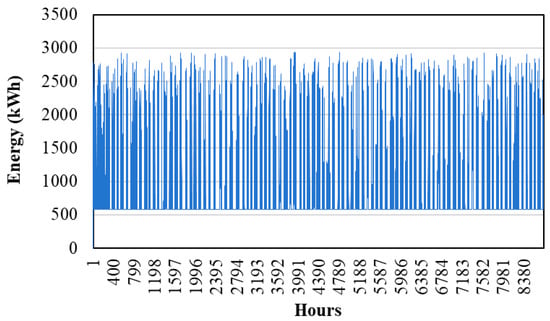
Figure 5.
Annual load profile of PEMFC.
4. Results and Discussion
Data analysis reveals pronounced seasonal fluctuations in the monthly performance of various system components, as illustrated in Figure 6. Electricity consumption peaks during the summer months (June to August), ranging from 3.247 to 3.728 GWh. In contrast, the load is lower in the winter and spring-related months (January, February, November, and December), ranging from 2.391 to 2.871 GWh. This summer peak load is primarily attributable to the additional cooling load from air conditioning systems, superimposed on the base power load required for operating IT equipment. Statistical analysis of the case model indicates that the system’s diesel generators operate for 3208 h annually, generating 17.12 GWh, which accounts for 46.9% of the total annual power supply.
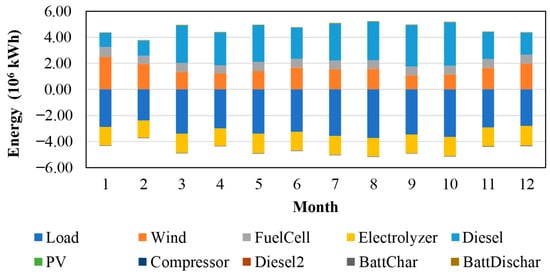
Figure 6.
Monthly Energy Balance of the Integrated System.
Wind power output is significantly higher in winter than in spring. Specifically, generation reaches 2.483 GWh in January and 1.971 GWh in December, compared to 1.344 GWh in March and 1.211 GWh in April during spring. This disparity aligns closely with the climatic characteristics of higher average wind speeds and richer wind resources in winter. PV power generation performs better in summer, with output of 35.5 MWh in July and 37.1 MWh in August. Generation is relatively lower in winter, with 28.9 MWh in January and 24.4 MWh in February. This distribution pattern corresponds perfectly with the characteristics of longer daylight hours and stronger solar radiation in summer.
On an annual basis, the total power generation from the wind and photovoltaic renewable energy systems amounts to 19.384 GWh. The clean energy system delivers power via an integrated configuration comprising wind–photovoltaic generation, PEMFC-CCHP unit, and battery storage discharge. The respective contributions from these subsystems are 19.384 GWh, 15.164 GWh, and 0.151 GWh, resulting in a total annual gross generation of 34.7 GWh. Internal energy consumption within the system originates from three primary processes: electricity demand for wind-powered hydrogen production (14.82 GWh), compressor operation (0.31 GWh), and battery charging (0.18 GWh). This sums to a total internal consumption of 15.31 GWh, yielding a net annual output of 19.38 GWh. Given an annual data center energy demand of 36.5 GWh, the clean energy system meets 53.1% of the total load. The remaining 46.9% is supplied by supplementary diesel generators integrated within the overall system.
Data analysis indicates significant seasonal disparities in the monthly utilization rate of renewable energy, as shown in Figure 7. Specifically, the utilization rate in winter, 0.454 in December and 0.573 in January, is markedly higher than that in spring, 0.278 in March and 0.281 in April. The primary reason for this higher winter utilization is the combination of typically strong wind resources, leading to abundant wind power generation, and a concurrently lower data center power load. This favorable condition of high generation–low load enables the system to absorb and utilize renewable energy sources like wind power more effectively.
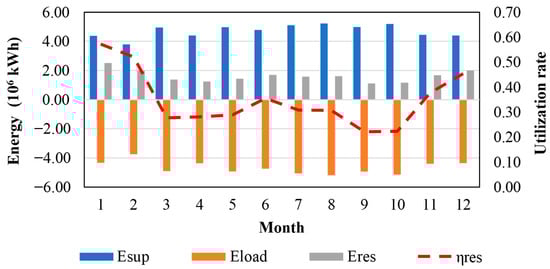
Figure 7.
The seasonal utilization rate of renewable energy.
The utilization rate of renewable energy exhibits distinct seasonal characteristics, with values being significantly higher in winter than in spring. This discrepancy is primarily attributable to superior climatic conditions, such as stronger winds, coupled with lower energy demand during the winter season. The proportion of renewable energy, defined as the ratio of wind and PV generation to the total system energy supply, was determined to be 0.35. Wind and PV generation contributed 19.384 GWh. The total system supply, comprising wind–PV generation, PEMFC-CCHP output, battery discharge, and diesel generation, amounted to about 56.0 GWh.
The energy efficiency of the PEMFC system exhibits discernible seasonal variation. Specific data indicate that the efficiency level in winter, 0.902 in January and 0.865 in December, is higher than that in summer, 0.891 in July and 0.892 in August, as illustrated in Figure 8. The primary reason for this discrepancy lies in the utilization method of the system’s waste heat across different seasons. In winter, the recovered waste heat can be fully and directly used for space heating, achieving high-efficiency energy utilization, as evidenced by the heating supply of 664.9 MWh in January. Conversely, in summer, the same waste heat must be converted into cooling energy, for instance, via absorption chillers, to be utilized, with the cooling supply in July being 234 MWh. This conversion process from thermal energy to cooling energy incurs a minor energy penalty, leading to a relatively lower overall system efficiency. In terms of annual performance, the PEMFC system generated a total of 8.181 GWh of electricity while simultaneously providing 2.971 GWh of thermal energy and 1.605 GWh of cooling energy.
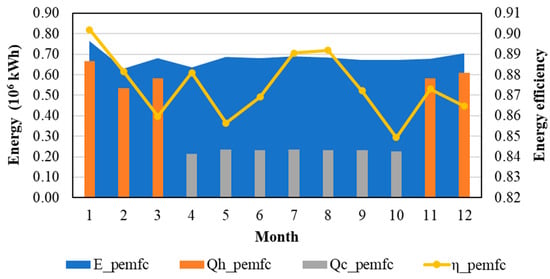
Figure 8.
The seasonal energy efficiency of PEMFC: E_pefmc, electrical output of PEMFC; Qh_pemfc, heating output of PEMFC; Qc_pemfc, cooling output of PEMFC; η_pemfc, energy efficiency of PEMFC.
The PEMFC system’s energy efficiency demonstrates a seasonal pattern of being higher in winter than in summer. This is primarily attributed to the distinct utilization pathways for the system’s waste heat: direct heating in winter yields higher efficiency, whereas conversion to cooling in summer results in slightly lower efficiency due to associated conversion losses. The system achieves an annual comprehensive energy efficiency of 0.87 and accomplishes simultaneous, sizable cogeneration of electricity, heating, and cooling. In this study, cooling supply is prioritized during summer operation, resulting in a calculated average coefficient of performance (COP_AC) of 0.45 by the developed absorption chiller model. After integrating combined cooling and heating, the system performance in winter and summer becomes comparable.
This study conducted a feasibility analysis on the application of an integrated energy system, based on PEMFC-CCHP coupled with wind–solar–hydrogen storage, in a green data center. This system is designed to replace the traditional grid, reliant primarily on fossil fuel power generation. Leveraging annual renewable power generation of 1.885 GWh from wind and photovoltaic sources, along with zero-carbon power from the PEMFC, the system reduces CO2 emissions by 1847 tons annually, demonstrating significant environmental benefits. The PEMFC-CCHP system achieves cascading utilization of energy for power, heat, and cooling, achieving a comprehensive energy utilization rate of 0.85–0.9. This significantly surpasses the 30–40% efficiency of traditional power generation. The system utilizes approximately 5.8 GWh of recovered waste heat annually for energy supply, directly displacing the energy traditionally consumed by data center HVAC systems for heating. This results in an overall energy saving rate exceeding 40% and avoids the significant waste heat dissipation inherent in traditional power generation.
During July operation, for instance, the PEMFC system provided 234 MWh of cooling via waste heat conversion. Supplying an equivalent amount of cooling using conventional electric chillers would have consumed approximately 78 MWh of electricity, thereby effectively conserving high-grade power for the data center. The PEMFC can flexibly adjust its power output, ranging from 629.1 MWh to 764.6 MWh monthly, according to the load demand. Furthermore, its waste heat output aligns well with the data center’s seasonal needs for providing heating in winter and cooling in summer, thereby significantly enhancing the overall stability and reliability of the integrated energy system. Comprehensive calculations show that within the year, the energy savings converted from waste heat recovery amounted to 9.9 MWh for heating and 5.3 MWh for cooling. The total achieved electricity savings reached 1.52 GWh.
The analysis demonstrates that the application of the integrated energy system based on PEMFC-CCHP and wind–solar–hydrogen storage in green data centers is entirely feasible. This system performs exceptionally well in multiple dimensions, including carbon emission reduction, enhancing comprehensive energy utilization efficiency, achieving significant energy savings, and improving system supply stability. It proves to be an effective replacement for the traditional energy supply model characterized by high energy consumption and high emissions.
Assume that the inflation rate is 2% and the discount rate is set at 8%. Based on the above model parameters and simulated results, the following Table 2, Table 3, Table 4 and Table 5 present detailed economic calculations.
Table 2.
Initial investment cost.
Table 3.
Initial annual operating cost.
Table 4.
Initial annual revenue.
Table 5.
Payback period.
The integrated energy system based on PEMFC-CCHP coupled with wind, solar, and hydrogen storage demonstrates significant advantages in green data center applications. By enabling synergy and complementarity among multiple energy sources, the system effectively adapts to the dynamic power load fluctuations of the data center. Furthermore, it achieves outstanding energy-saving and emission-reduction benefits, with annual CO2 emission reductions of 1847 tons. From both technical and economic perspectives, the system is highly feasible. Its key economic indicator, the investment payback period, is projected to be between 8.2 and 13.1 years, which falls within an acceptable range. Operationally, the system’s reliability meets the stringent requirements for power supply continuity and stability in data centers.
The feasibility of this system is determined and supported by two core metrics: Firstly, the Renewable Energy Utilization Rate directly dictates the extent to which the system displaces conventional fossil fuels and is key to assessing its environmental benefits. Secondly, the comprehensive energy utilization rate of the PEMFC-CCHP system reflects the depth and efficiency of cascading energy use, serving as the core measure of its technical advancement and economic performance. These two metrics are mutually reinforcing and collectively form the cornerstone of the system’s viability.
In summary, the application of this integrated energy system in green data centers not only presents clear advantages but also demonstrates comprehensive feasibility across multiple dimensions, including technical, economic, and environmental aspects. The synergistic effect between the two core metrics provides a solid technical, theoretical foundation and decision-making basis for its future large-scale deployment and application in the green data center sector.
5. Conclusions
To address energy and carbon emission issues related to data centers, a PEMFC-based cogeneration system coupled with wind and solar energy is proposed in this paper. The technical feasibility of the integrated energy system has been verified through a case study conducted at a data center in Guiyang, China.
The study demonstrates that the integrated energy system employs a multi-energy complementary architecture to ensure a flexible and reliable energy supply, with a comprehensive renewable energy utilization rate of about 0.35, which can effectively accommodate the load fluctuations of data centers. In detail, the PEMFC-CCHP has a high comprehensive energy efficiency of 0.85–0.90. By effectively recovering waste heat for cooling and heating purposes, the system achieves an energy saving rate of over 40%. The investment payback period of the system ranges from 8.2 to 13.1 years, meeting the long-term cost-effectiveness requirements of data center operation. In addition, with respect to environmental benefits, the integrated energy system offers a significant reduction in CO2 emissions, cutting 1847 tons annually.
Furthermore, it should be noted that this study only assesses the technical feasibility of the integrated energy system through numerical simulation, and experimental validation remains the subject of future work.
Author Contributions
Conceptualization, X.W.; Data curation, Z.T., Z.C. and Y.X.; Formal analysis, Y.X.; Investigation, X.W. and N.W.; Methodology, Z.T.; Resources, Y.X.; Software, Y.X.; Supervision, X.W. and N.W.; Validation, Z.T., X.W. and N.W.; Visualization, Z.C.; Writing—original draft, Z.T.; Writing—review and editing, Z.C. and N.W. All authors have read and agreed to the published version of the manuscript.
Funding
This work was supported by the key technology project of China Southern Power Grid Corporation (GZKJXM20240009).
Data Availability Statement
The original contributions presented in this study are included in the article. Further inquiries can be directed to the corresponding author.
Conflicts of Interest
All authors were employed by the company Electric Power Research Institute of Guizhou Power Grid Co., Ltd. The remaining authors declare that the research was conducted in the absence of any commercial or financial relationships that could be construed as a potential conflict of interest. The authors declare that this study received funding from China Southern Power Grid Corporation. The funder was not involved in the study design, collection, analysis, interpretation of data, the writing of this article or the decision to submit it for publication.
References
- Jones, N. How to stop data centres from gobbling up the world’s electricity. Nature 2018, 561, 163–166. [Google Scholar] [CrossRef] [PubMed]
- Boscariol, M.; Cacciaguerra, E.; Gasbarri, P.; Accardo, D.; Meschini, S.; Tagliabue, L.C. A Review of current practices and challenges in Green Data Centers: Renewable energy sources, waste heat recovery, and intelligent management systems. In Proceedings of the 2025 33rd Euromicro International Conference on Parallel, Distributed, and Network-Based Processing (PDP), Turin, Italy, 12–14 March 2025; pp. 478–485. [Google Scholar]
- Masanet, E.; Shehabi, A.; Lei, N.; Smith, S.; Koomey, J. Recalibrating global data center energy-use estimates. Sci. Am. Assoc. Adv. Sci. 2020, 367, 984–986. [Google Scholar] [CrossRef] [PubMed]
- Rongon, R.K.; Das, K. Energy-Aware Data Center Management: A Sustainable Approach to Reducing Carbon Footprint. arXiv 2025, arXiv:2509.10462. [Google Scholar] [CrossRef]
- Sarikaya, O.M.; Kuzay, M.; Demirel, E.; Melgaard, S.P.; Nielsen, J.E.; Jensen, R.L.; Oleksiak, A.; Szeliga, W. Energy efficiency enhancement in two European data centers through CFD modeling. Sci. Rep. 2025, 15, 24952. [Google Scholar] [CrossRef]
- Buyya, R.; Ilager, S.; Arroba, P. Energy-efficiency and sustainability in new generation cloud computing: A vision and directions for integrated management of data centre resources and workloads. Softw. Pract. Exp. 2024, 54, 24–38. [Google Scholar] [CrossRef]
- Liu, Y.; Wei, X.; Xiao, J.; Liu, Z.; Xu, Y.; Tian, Y. Energy consumption and emission mitigation prediction based on data center traffic and PUE for global data centers. Glob. Energy Interconnect. 2020, 3, 272–282. [Google Scholar] [CrossRef]
- He, W.; Xu, Q.; Liu, S.; Wang, T.; Wang, F.; Wu, X.; Wang, Y.; Li, H. Analysis on data center power supply system based on multiple renewable power configurations and multi-objective optimization. Renew. Energy 2024, 222, 119865. [Google Scholar] [CrossRef]
- Zhang, Y.; Li, H.; Wang, S. Decarbonizing data centers through regional bits migration: A comprehensive assessment of China’s ‘eastern data, Western computing’ initiative and its global implications. Appl. Energy 2025, 392, 126020. [Google Scholar] [CrossRef]
- Peng, X.; Bhattacharya, T.; Cao, T.; Mao, J.; Tekreeti, T.; Qin, X. Exploiting Renewable Energy and UPS Systems to Reduce Power Consumption in Data Centers. Big Data Res. 2022, 27, 100306. [Google Scholar] [CrossRef]
- Yuan, X.; Liu, J.; Sun, S.; Lin, X.; Fan, X.; Zhao, W.; Kosonen, R. Data center waste heat for district heating networks: A review. Renew. Sustain. Energy Rev. 2025, 219, 115863. [Google Scholar] [CrossRef]
- Socci, L.; Rocchetti, A.; Verzino, A.; Zini, A.; Talluri, L. Enhancing third-generation district heating networks with data centre waste heat recovery: Analysis of a case study in Italy. Energy 2024, 313, 134013. [Google Scholar] [CrossRef]
- Liu, W.; Jin, B.; Wang, D.; Yu, Z. Performance modeling and advanced exergy analysis for low-energy consumption data center with waste heat recovery, flexible cooling and hydrogen energy. Energy Convers. Manag. 2023, 297, 117756. [Google Scholar] [CrossRef]
- Jiao, K.; Xuan, J.; Du, Q.; Bao, Z.; Xie, B.; Wang, B.; Zhao, Y.; Fan, L.; Wang, H.; Hou, Z.; et al. Designing the next generation of proton-exchange membrane fuel cells. Nature 2021, 595, 361–369. [Google Scholar] [CrossRef] [PubMed]
- Qasem, N.A.A. A recent overview of proton exchange membrane fuel cells: Fundamentals, applications, and advances. Appl. Therm. Eng. 2024, 252, 123746. [Google Scholar] [CrossRef]
- Wang, Z.; Liu, Z.; Fan, L.; Du, Q.; Jiao, K. Application progress of small-scale proton exchange membrane fuel cell. Energy Rev. 2023, 2, 100017. [Google Scholar] [CrossRef]
- Kahraman, H.; Akın, Y. Recent studies on proton exchange membrane fuel cell components, review of the literature. Energy Convers. Manag. 2024, 304, 118244. [Google Scholar] [CrossRef]
- Wang, Y.; Yang, X.; Sun, Z.; Chen, Z. A systematic review of system modeling and control strategy of proton exchange membrane fuel cell. Energy Rev. 2024, 3, 100054. [Google Scholar] [CrossRef]
- Wilberforce, T.; Olabi, A.G.; Muhammad, I.; Alaswad, A.; Sayed, E.T.; Abo-Khalil, A.G.; Maghrabie, H.M.; Elsaid, K.; Abdelkareem, M.A. Recovery of waste heat from proton exchange membrane fuel cells—A review. Int. J. Hydrogen Energy 2024, 52, 933–972. [Google Scholar] [CrossRef]
- Cai, F.; Cai, S.; Tu, Z. Proton exchange membrane fuel cell (PEMFC) operation in high current density (HCD): Problem, progress and perspective. Energy Convers. Manag. 2024, 307, 118348. [Google Scholar] [CrossRef]
- Fan, L.; Liu, Y.; Luo, X.; Tu, Z.; Chan, S.H. Comparison and evaluation of mega watts proton exchange membrane fuel cell combined heat and power system under different waste heat recovery methods. Renew. Energy 2023, 210, 295–305. [Google Scholar] [CrossRef]
- Chen, X.; Pan, M.; Li, X.; Zhang, K. Multi-mode operation and thermo-economic analyses of combined cooling and power systems for recovering waste heat from data centers. Energy Convers. Manag. 2022, 266, 115820. [Google Scholar] [CrossRef]
- Alkrush, A.A.; Salem, M.S.; Abdelrehim, O.; Hegazi, A. Data centers cooling: A critical review of techniques, challenges, and energy saving solutions. Int. J. Refrig. 2024, 160, 246–262. [Google Scholar] [CrossRef]
- Ding, T.; Chen, X.; Cao, H.; He, Z.; Wang, J.; Li, Z. Principles of loop thermosyphon and its application in data center cooling systems: A review. Renew. Sustain. Energy Rev. 2021, 150, 111389. [Google Scholar] [CrossRef]
- Li, Y.; Wang, Z.Y.; Tan, Z.K. Renewable Generation Prediction Method Based on Differential Privacy and Ensemble Learning. Power Syst. Big Data 2024, 27, 1–8. [Google Scholar] [CrossRef]
- Khosravi, A.; Sandoval, O.R.; Taslimi, M.S.; Sahrakorpi, T.; Amorim, G.; Pabon, J.J.G. Review of energy efficiency and technological advancements in data center power systems. Energ Build. 2024, 323, 114834. [Google Scholar] [CrossRef]
- Mandal, R.; Mondal, M.K.; Banerjee, S.; Chakraborty, C.; Biswas, U. A survey and critical analysis on energy generation from datacenter. In Data Deduplication Approaches; Elsevier: Amsterdam, The Netherlands, 2021; pp. 203–230. [Google Scholar]
- Ibrahim, M.M. Energy management strategies of hybrid renewable energy systems: A review. Wind Eng. 2024, 48, 133–161. [Google Scholar] [CrossRef]
- Koronen, C.; Åhman, M.; Nilsson, L.J. Data centres in future European energy systems—Energy efficiency, integration and policy. Energy Effic. 2020, 13, 129–144. [Google Scholar] [CrossRef]
- Murino, T.; Monaco, R.; Nielsen, P.S.; Liu, X.; Esposito, G.; Scognamiglio, C. Sustainable Energy Data Centres: A Holistic Conceptual Framework for Design and Operations. Energies 2023, 16, 5764. [Google Scholar] [CrossRef]
- Oró, E.; Depoorter, V.; Garcia, A.; Salom, J. Energy efficiency and renewable energy integration in data centres. Strategies and modelling review. Renew. Sustain. Energy Rev. 2015, 42, 429–445. [Google Scholar] [CrossRef]
Disclaimer/Publisher’s Note: The statements, opinions and data contained in all publications are solely those of the individual author(s) and contributor(s) and not of MDPI and/or the editor(s). MDPI and/or the editor(s) disclaim responsibility for any injury to people or property resulting from any ideas, methods, instructions or products referred to in the content. |
© 2025 by the authors. Licensee MDPI, Basel, Switzerland. This article is an open access article distributed under the terms and conditions of the Creative Commons Attribution (CC BY) license (https://creativecommons.org/licenses/by/4.0/).