Abstract
In recent years, honeycomb sandwich structures have seen continuous development due to their excellent structural performance and design flexibility in heat dissipation. However, their complex heat transfer mechanisms and diverse modes of thermal exchange necessitate research on the air flow behavior and temperature distribution characteristics of micro-channels and lattice pores. This study investigates the internal flow field within a ventilated honeycomb sandwich structure through numerical simulation. The spatial flow characteristics and temperature distribution are analyzed, with a focus on the effects of turbulent kinetic energy, heat flux distribution on the heated surface, and varying pressure drop conditions on the thermal performance. The results indicate that the micro-channels inside the honeycomb core lead to a strong correlation between temperature distribution, flow velocity, and turbulence intensity. Regions with higher flow velocity and turbulent kinetic energy exhibit lower temperatures, confirming the critical role of flow motion in heat transfer. Heat flux analysis further verifies that heat is primarily removed by airflow, with superior heat exchange occurring inside the honeycomb cells compared to the solid regions. The intensive mixing induced by highly turbulent flow within the small cells enhances contact with the solid surface, thereby improving heat conduction from the solid to the flow. Moreover, as the inlet pressure increases, the overall temperature gradually decreases but exhibits a saturation trend. This indicates that beyond a certain pressure level, further increasing the inlet pressure yields diminishing returns in heat dissipation enhancement.
1. Introduction
The emergence and development of sandwich structures are closely intertwined with advancements in aerospace technology [1,2]. New materials characterized primarily by sandwich structures, particularly honeycomb sandwich structures, have consistently advanced in tandem with this trend, thanks to their excellent structural performance and remarkable designability in the application of heat dissipation [3,4]. Nevertheless, honeycomb sandwich structures exhibit complex heat transfer forms, mainly manifested as heat conduction, sandwich heat conduction, and thermal radiation between the upper and lower face sheets. Owing to the intricate geometric structure of honeycombs and the diverse internal heat exchange modes, it is challenging to establish high-precision heat exchange models.
In earlier studies, Arulanantham et al. [5] investigated the effects of the geometric dimensions and inclination degree of square honeycombs on the stability of flow convection within their cavities. The research results indicated that natural convection can be completely suppressed by adjusting the geometric dimension ratio. In terms of the coupled heat transfer of conduction and radiation in metal honeycombs, Swann and Pittman [6] employed the finite difference method to study one-dimensional radiative heat conduction in regular hexagonal honeycombs and used the net heat flux method to calculate the radiative heat transfer between honeycomb surfaces. Based on the numerical calculation results, they proposed a formula for calculating the equivalent thermal conductivity. Arulanantham et al. [7] studied the radiative heat conduction in square honeycomb panels, derived the one-dimensional heat transfer control equation, and solved the equation using the exponential kernel approximation. Copenhaver et al. [8] utilized the finite element method to simulate the coupled radiative–conductive heat transfer inside honeycombs.
In recent years, You et al. [9] developed a three-dimensional numerical model to analyze unsteady flow and heat transfer in a ceramic honeycomb regenerator, demonstrating that shorter switching times and optimal length significantly enhance thermal effectiveness and energy recovery. Subasi et al. [10] evaluated different turbulence models and three wall functions for simulating the thermal and hydraulic performance of a hexagonal aluminum honeycomb heat sink. Their findings indicate that the realizable k-ε model combined with the enhanced wall function provides the best balance between prediction accuracy and computational cost, offering a reliable approach for simulation of such complex heat sink geometries under turbulent flow conditions. Ozsipahi et al. [11] numerically investigated an aluminum honeycomb heat sink, revealing that its thermal resistance decreases with increasing fin height and Reynolds number, albeit at the cost of a higher pressure drop. Their parametric study further identified that reducing the longitudinal fin pitch enhances heat transfer but also increases drag, highlighting key performance trade-offs for design optimization. Ravichandran and Hojjati [12] investigated the effective thermal conductivity of honeycomb sandwich structures with composite face sheets using a multi-scale modeling approach validated by experiments. Gao et al. [13] investigated the thermal response of aluminum honeycomb panels under fire conditions, revealing that larger panel sizes lead to a higher maximum temperature on the unexposed surface but also result in earlier structural integrity failure.
However, current research on thermal management of sandwich structures predominantly focuses on solid-walled honeycombs, where heat transfer is limited to conduction and radiation within the sealed cells, offering minimal active cooling capability. While recent studies have begun to explore ventilated designs, a significant knowledge gap remains. For instance, Xiao et al. [14] primarily investigated the fluid and mechanical properties of perforated sandwiches, whereas Ye et al. [15] concentrated on the system-level modeling and optimization of microchannel-based cooling. Notably, there is a scarcity of fundamental research dedicated to unraveling the internal fluid–solid–thermal coupling phenomena and the underlying heat dissipation mechanisms within convectively cooled honeycomb cores. To bridge this gap, the present study is motivated by the need to develop an efficient active cooling strategy and is driven by the following principal objective: to numerically investigate the internal flow and heat transfer dynamics in a novel ventilated honeycomb sandwich structure, where drilled holes along the cell long side create a unique internal flow network. This configuration promotes jet impingement and intense mixing within the cells. This study provides a fundamental analysis of the spatial flow characteristics, turbulent kinetic energy distribution, and localized heat flux, which collectively reveal the physical mechanisms of how and why this specific design enhances convective cooling. The findings of this research aim to provide a reliable numerical framework and valuable fundamental insights for the design and optimization of high-efficiency thermal management systems of the aircraft skin in advanced aerospace applications.
The remainder of this paper is organized as follows. Section 2 outlines the underlying physical models and governing equations for heat conduction and fluid dynamics, along with the validation of the adopted numerical methodology. Section 3 describes the geometric configuration of the ventilated honeycomb sandwich structure. Section 4 details the mesh generation strategy and the computational settings employed for the fluid–solid–thermal coupled simulations. Section 5 presents and discusses the key results, including the grid independence study, analyses of the internal flow field and temperature distribution, heat dissipation characteristics, and the effect of varying inlet pressure on thermal performance. Finally, Section 6 summarizes the principal conclusions drawn from this study and suggests potential directions for future research.
2. Numerical Methods
2.1. Heat Conduction
Heat conduction refers to the transfer of thermal energy through the thermal motion of microscopic particles such as molecules, atoms, and free electrons, occurring when there is no relative displacement between different parts of a substance [16,17]. The mathematical expression for heat conduction is as follows:
In the formula, Q represents the heat conduction flux, with the unit of W; λ denotes the thermal conductivity of the material, with the unit of W/(m·K); A stands for the cross-sectional area for heat transfer, with the unit of m2; the negative sign indicates the direction of heat transfer from the high-temperature region to the low-temperature region. It can be inferred from the above equation that the heat transfer rate is proportional to the thermal conductivity, the heat transfer cross-sectional area, and the temperature gradient along the heat flow direction.
2.2. Fundamental Governing Equations of Fluid Mechanics
In this study, a steady-state Reynolds-Averaged Navier–Stokes (RANS) numerical method based on the realizable k-ω turbulence model is adopted. This model, proposed by Shih et al. [18] in 1995, is a modified version of the standard k-ε turbulence model and exhibits excellent performance in simulating internal flow channel flows and circular orifice jet problems. Its main adjustments are made to the turbulent dissipation rate equation, which includes additional terms to improve the prediction of turbulent dissipation in the flow field. These improvements help to better simulate complex flow characteristics such as swirling flows and flow separation. The new turbulent dissipation rate equation is as follows:
A pressure-based solver was used for the steady-state simulation. The convective terms for momentum, energy, and turbulence equations were discretized using a second-order upwind scheme, while the diffusive terms were discretized using a second-order central differencing scheme.
2.3. Validation
The framework of numerical simulation of fluid dynamics has been established, and the capability has been verified in a previous study [19]. To verify the effectiveness of numerical method of heat transfer, a simulation was performed for a honeycomb heat sink, and the results were compared with experimental data [20]. As shown in Figure 1, the aluminum base plate of the heat sink is uniformly equipped with heat dissipation fins, where each fin consists of multiple 0.05 mm thick aluminum hexagonal honeycomb cells. Two 0.07 mm thick aluminum strips are arranged on the upper and lower parts, respectively, to ensure better contact between the fins and the base plate, thereby enhancing the heat dissipation performance. To reduce the number of computational meshes and shorten the calculation time, only a partial region was selected for calculation. The computational domain is shown in Figure 2, with the heat dissipation fin thickness t = 6 mm, fin height H = 60 mm, and fin spacing Sy = 40 mm. Unstructured meshes were used for the calculation. To ensure the accuracy of flow field resolution near the wall (with Y+ close to 1), the thickness of the first layer of the boundary layer mesh was set to 0.02475 mm, with a total of 10 boundary layers. The inlet was set as a velocity inlet, the outlet as a pressure outlet, the two sides as symmetric boundaries, and the upper and lower surfaces as no-slip walls. A constant heat source of 30 W (Q) was applied to the lower surface of the base plate. The properties of the material and flow are listed in Table 1.
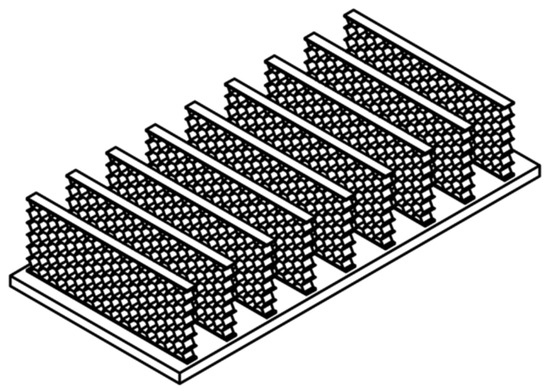
Figure 1.
Geometric configuration of the honeycomb heat sink.
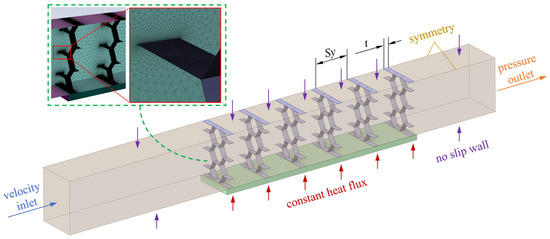
Figure 2.
Computational domain, boundary conditions, and local mesh details.

Table 1.
Properties of material and flow.
The accuracy and effectiveness of the numerical method used in this study can be evaluated by comparing the thermal resistance Rth of the heat sink under different inlet Reynolds numbers (Re). The Reynolds number (Re) and thermal resistance (Rth) are defined as follows:
In the formula, ρ denotes the air density (taken as 1.225 kg/m3), U represents the inlet flow velocity, Dh stands for the hydraulic diameter, and μ is the air viscosity (taken as 1.789 × 10⁻⁵ kg/(m·s)).
In the formula, Tw,m denotes the average wall temperature, Tin represents the inlet flow temperature, and Q stands for the heat source on the lower surface of the base plate.
Calculations were performed to compare the heat sink thermal resistance obtained by the numerical method with the experimental results under inlet Reynolds numbers (Re) of 8000, 16,000, and 25,000, respectively. The computational solution was considered converged when the scaled residuals for all governing equations dropped below 1 × 10⁻⁴, and simultaneously, the average wall temperature and the inlet flow temperature showed no further change with iterations. It can be observed that the calculated results are in good agreement with the experimental results, and the maximum relative error does not exceed 5%. Therefore, the numerical method used in this study exhibits high accuracy and meets the precision requirements for subsequent research. Although the geometry of this validation case differs from the main ventilated sandwich structure under investigation, it shares the core physical phenomena of turbulent flow and conjugate heat transfer within a compact cellular geometry. The successful replication of the experimental thermal resistance, as shown in Figure 3, provides confidence in the applicability of the chosen numerical models (e.g., turbulence model, discretization schemes) for simulating the fluid-thermal behavior in the subsequent analysis.
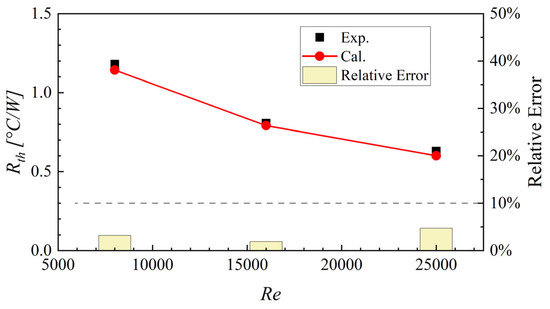
Figure 3.
Comparison between calculated results and experimental results.
3. Geometry
The computational model is mainly composed of upper and lower flat plates, a honeycomb sandwich, inlet and outlet pipes, and connecting pipes. The upper and lower flat plates are rectangular, with a width of 60 mm, a length of 120 mm, and a thickness of 0.5 mm. The honeycomb sandwich is made by bending and spot-welding thin plates with a thickness of 0.2 mm; it has a height of 4 mm, and holes with a diameter of 1 mm are drilled along the direction of the long side. The inlet and outlet pipes are arranged on both sides of the short side, with a diameter of 3 mm and a wall thickness of 0.1 mm. The connecting pipes have a diameter of 1 mm and a wall thickness of 0.1 mm. Figure 4 presents the geometric model of the flat plate with the honeycomb ventilated sandwich.
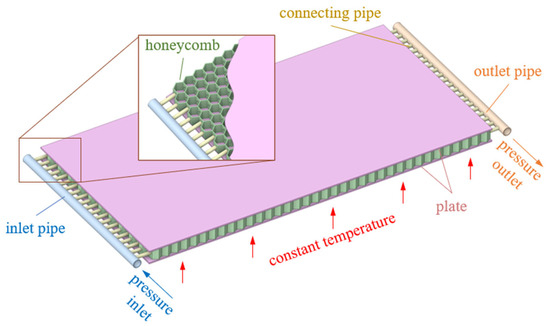
Figure 4.
Flat plate with honeycomb ventilated sandwich.
4. Mesh Generation and Computational Settings
Since fluid–solid–heat coupling calculation is involved, volume meshes need to be generated separately for the fluid domain and the solid domain. Based on the geometric model, unstructured tetrahedral meshes were adopted. To ensure sufficient resolution of the flow field in the boundary layer (with Y+ close to 1), the height of the first layer of the boundary layer mesh was set to 0.0036 mm, and a total of 10 layers were generated. The Figure 5 shows the spatial mesh of the flat plate with the honeycomb ventilated sandwich; it can be observed that the generated mesh has a smooth transition and a small skewness, which meets the requirements of numerical simulation calculations.
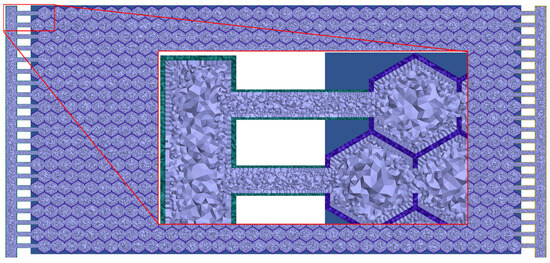
Figure 5.
Cross-section of the spatial mesh.
The inlet boundary condition is set as a pressure inlet (50 kPa, temperature 20 °C), and the outlet boundary condition is a pressure outlet (0 kPa). The upper surface of the upper flat plate is configured with natural convection heat transfer (ambient temperature set to 20 °C with a constant heat transfer coefficient of 5 W/m2·K), while the lower surface of the lower flat plate is applied with a constant temperature heat source of 200 °C. The calculation results are considered converged when the residual of the continuity equation drops to 10−4. The material properties of each component are listed in Table 2, and the flow properties remain as specified in Table 1. The effective thermophysical properties of the honeycomb sandwich core, used as input for the numerical model, are listed in Table 2. These represent the volume-averaged macroscopic properties of the core structure. The computational solution was considered converged when the scaled residuals for all governing equations dropped below 1 × 10⁻⁴, and simultaneously, the maximum and average temperature of wall top and the maximum and average temperature of air in the flow field showed no further change with iterations.
Table 2.
Properties of solid materials.
5. Results and Discussion
5.1. Grid Independence
Grid independence analysis was conducted by comparing the calculation results under grid sizes of 4.94 × 10⁷, 5.93 × 10⁷, 7.11 × 10⁷, 8.53 × 10⁷, and 1.02 × 10⁸. As shown in Figure 6, the maximum temperature and average temperature of the upper plate surface and the flow field obtained from the calculations all change with the increase in the number of grids. When the grid number is ≥7.11 × 10⁷, the calculation results tend to be stable. To ensure the accuracy of the calculation results while saving computational resources, the grid size for subsequent calculations is set to 7.11 × 10⁷.

Figure 6.
Comparison of calculation results under different grid sizes.
5.2. Flow Field and Heat Dissipation Characteristics
As observed from the pressure distribution on the central plane in Figure 7a, the pressure in the inlet pipe gradually increases along the flow path and reaches its maximum at the closed end of the inlet pipe. When flow enters the honeycomb sandwich, the pressure decreases gradually with the increase in the number of honeycomb cells passed through, showing an overall diagonal downward trend. After flow leaves the honeycomb sandwich and enters the outlet pipe, the pressure inside the pipe decreases gradually toward the outlet.
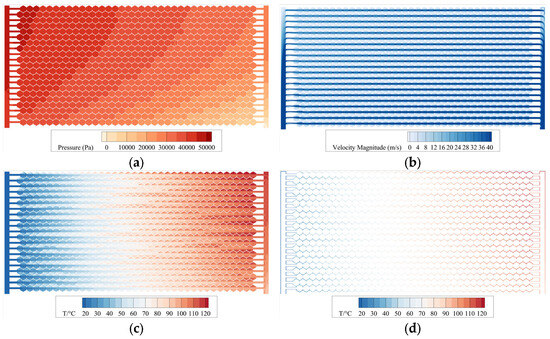
Figure 7.
Flow field characteristics and temperature distribution on the central plane. (a) Pressure distribution contour; (b) Velocity distribution contour; (c) Flow field temperature distribution; (d) Solid domain temperature distribution.
The velocity distribution on the central plane of the flow field is presented in Figure 7b. The velocity near the closed ends of the inlet and outlet pipes decays significantly, while relatively high flow velocities are maintained at other positions. This significant velocity decay near the closed ends is attributed to the formation of recirculation zones and flow stagnation. As the incoming flow impinges on the closed end of the inlet pipe, it is forced to reverse direction to enter the connecting pipes, creating a local recirculation region. This phenomenon is intrinsically linked to the observed pressure buildup at these locations. Inside the honeycomb sandwich, since holes are only drilled along the row direction, a large pressure difference can be maintained between the two sections; this drives the flow in each row of honeycomb cells to accelerate stably along the flow path. When viewed along the column direction, the flow velocity inside the honeycomb cells decreases gradually with the increase in distance from the inlet and outlet ports.
The temperature distribution on the central plane of the flow field, as shown in Figure 7c, is similar to the velocity distribution: the flow temperature inside each row of honeycomb cells increases gradually. This indicates that a higher flow velocity can remove more heat from the sandwich. The temperature distribution of the sandwich itself, presented in Figure 7d, exhibits the same characteristics as the flow field temperature distribution.
Figure 8 presents the contour maps of velocity and temperature distributions in the spatial flow field. The velocity is distributed in concentric circles with the center of the through-hole as the center, which indicates that the flow in the honeycomb cells is mainly in a jet flow state. This jet-like velocity profile is a direct result of the flow focusing effect created by the drilled holes, which act as orifices. As the flow is forced through these constrictions, it accelerates into the honeycomb cells, forming impinging jets. Higher flow velocity corresponds to lower temperature. The reason for this temperature distribution is that the heat in the flow field is mainly carried away by air flow, higher flow velocity can remove more heat from the flow field, thereby inhibiting the temperature rise inside the sandwich. The interior of each honeycomb cell is divided into two regions by the plane where the through-hole is located: the lower region has a higher temperature due to its proximity to the heating surface, while the presence of high-velocity flow in the middle makes the temperature of the upper region lower than that of the lower region.
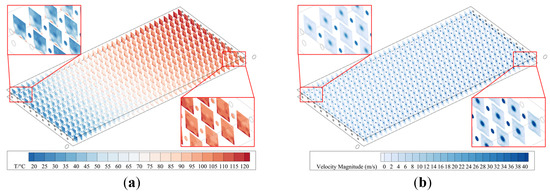
Figure 8.
Spatial flow field characteristics. (a) Velocity distribution contour; (b) Temperature distribution contour.
Figure 9 presents the turbulent kinetic energy distribution on the central plane of the flow field. It can be observed that the turbulent kinetic energy in the inlet connecting pipes and outlet pipes is relatively high, where intense turbulence dominates these regions. The distribution of turbulent kinetic energy in the honeycomb sandwich shares the same characteristics as the velocity distribution. When viewed along the column direction, the temperature inside the honeycomb cells decreases gradually with the increase in turbulent kinetic energy; this indicates that higher turbulent kinetic energy of flow is conducive to removing more heat. Therefore, the flow velocity and turbulence intensity of flow in the honeycomb sandwich largely determine the temperature inside the sandwich.
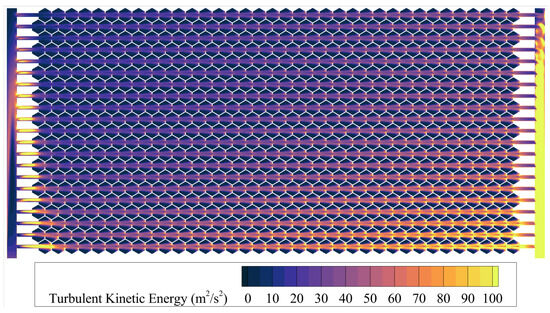
Figure 9.
Turbulent kinetic energy distribution contour on the central plane.
Figure 10 illustrates the heat flux distribution across the heated surface. The heat transfer rate on this surface decreases progressively along the positive X-axis (i.e., from the honeycomb cell near the intake pipe towards the cell near the outlet pipe). A similar decreasing trend is observed along the positive Y-axis (i.e., from the flow inlet towards the closed end of the intake pipe, which corresponds to the direction from the flow outlet towards the closed end of the outlet pipe). The peak heat flux values are consistently located within the hollow cavities of the honeycomb cells, rather than in their solid frames. This further confirms that flow plays a crucial role in transferring heat within the interstitial layer. These high heat flux zones correspond to the honeycomb cells containing vortices, as shown in Figure 11 and Figure 12, and to the cells with high turbulent kinetic energy near the intake pipe, as shown in Figure 11. This correlation indicates that sufficient contact between the flow and the solid surface promotes effective heat transfer from the solid to the flow. In contrast, for the high-turbulence cells near the outlet pipe in Figure 11, the internal flow has already been heated to a relatively high temperature. Consequently, despite the more intense turbulence, its capacity to absorb additional heat is diminished.
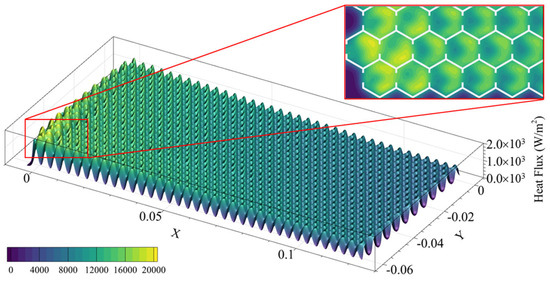
Figure 10.
Heat flux density distribution on the heating surface. In the locally enlarged view, the white area represents the projection of the honeycomb sandwich on the heating surface, and the heat flux density of this area is not displayed.
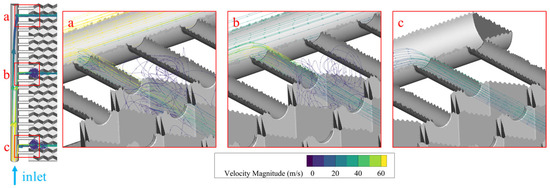
Figure 11.
Streamline patterns within the honeycomb cell near the intake pipe. (a) Near the closed end of the intake pipe; (b) The middle section of the intake pipe; (c) Near the flow inlet.
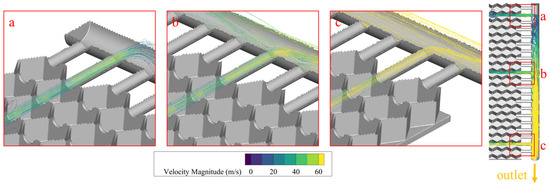
Figure 12.
Streamline patterns within the honeycomb cell near the outlet pipe. (a) Near the closed end of the outlet pipe; (b) The middle section of the outlet pipe; (c) Near the flow outlet.
Figure 13 compares the temperature variations when the inlet pressure conditions are set to 50 kPa, 100 kPa, 150 kPa, 200 kPa, and 250 kPa, respectively. With the increase in inlet pressure, both the maximum and average temperatures of the upper plate surface and the flow decrease gradually, but the decreasing trend becomes gentle. This implies that there is a saturation point for the inlet pressure; beyond this point, the temperatures of the entire ventilated honeycomb sandwich and the flow will not decrease further.
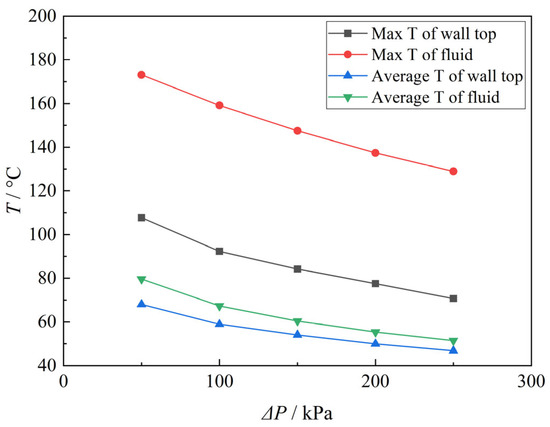
Figure 13.
Temperature variations under different inlet pressure conditions.
6. Conclusions
This study numerically investigated the heat dissipation performance of a ventilated honeycomb sandwich structure using a fluid–solid–thermal coupling approach. The key findings are as follows:
- The temperature distribution is strongly coupled to the flow velocity and turbulence intensity within the micro-channels. Enhanced heat transfer is directly linked to regions of higher flow velocity and turbulent kinetic energy, confirming the dominance of convective cooling.
- The confined geometry of the honeycomb cells intensifies flow turbulence, which disrupts the thermal boundary layer and significantly improves heat conduction from the solid walls to the coolant air.
- Increasing the inlet pressure reduces the overall temperature, but the cooling effect exhibits a saturation trend, indicating diminishing returns beyond a certain pressure threshold.
This work provides critical insights and a reliable numerical framework for optimizing the design of advanced thermal management systems of the aircraft skin in aerospace engineering. In the future, further research can be conducted on the heat dissipation performance under different geometric parameters, material properties, and unsteady working conditions.
It should be noted that this study primarily focuses on elucidating the underlying heat transfer mechanisms for a specific geometric configuration. The conclusions are therefore contextualized within this design. The influence of key geometric parameters, such as the hole diameter, porosity, and core height, on the thermal performance presents a critical avenue for future research to establish more general design guidelines.
Author Contributions
Conceptualization, P.X.; Methodology, X.Z.; Formal analysis, P.X.; Investigation, P.X. and X.Z.; Data curation, X.Z.; Writing–original draft, X.Z.; Writing–review & editing, C.Z., H.Z. and J.L.; Visualization, X.Z.; Supervision, C.Z., H.Z. and J.L.; Project administration, P.X. and C.Z.; Funding acquisition, H.Z. and J.L. All authors have read and agreed to the published version of the manuscript.
Funding
This research was funded by National Natural Science Foundation of China grant number 12302300, 12272312.
Data Availability Statement
The original contributions presented in this study are included in the article. Further inquiries can be directed to the corresponding author.
Conflicts of Interest
Authors Pengfei Xiao and Chunping Zhou were employed by the company AVIC Research Institute for Special Structures of Aeronautical Composites. The remaining authors declare that the research was conducted in the absence of any commercial or financial relationships that could be construed as a potential conflict of interest.
References
- Ramnath, B.V.; Alagarraja, K.; Elanchezhian, C. Review on sandwich composite and their applications. Mater. Today Proc. 2019, 16, 859–864. [Google Scholar]
- Wei, X.Y.; Xiong, J.; Wang, J.; Xu, W. New advances in fiber-reinforced composite honeycomb materials. Sci. China Technol. Sci. 2020, 63, 1348–1370. [Google Scholar] [CrossRef]
- Onyibo, E.C.; Safaei, B. Application of finite element analysis to honeycomb sandwich structures: A review. Rep. Mech. Eng. 2022, 3, 192–209. [Google Scholar] [CrossRef]
- Aboudi, J.; Arnold, S.M.; Bednarcyk, B.A. Micromechanics of Composite Materials: A Generalized Multiscale Analysis Approach; Butterworth-Heinemann: Oxford, UK, 2013. [Google Scholar]
- Arulanantham, M.; Singh, T.P.; Kaushika, N.D. Convective heat transfer across transparent honeycomb insulation materials. Energy Convers. Manag. 1994, 35, 111–116. [Google Scholar] [CrossRef]
- Swann, R.T.; Pittman, C.M. Analysis of Effective Thermal Conductivities of Honeycomb-Core and Corrugated-Core Sandwich Panels; National Aeronautics and Space Administration: Washington, DC, USA, 1961. [Google Scholar]
- Arulanantham, M.; Kaushika, N.D. Coupled radiative and conductive thermal transfers across transparent honeycomb insulation materials. Appl. Therm. Eng. 1996, 16, 209–217. [Google Scholar] [CrossRef]
- Copenhaver, D.C.; Scott, E.P.; Hanuska, A. Thermal characterization of honeycomb core sandwich structures. J. Spacecr. Rocket. 1998, 35, 539–545. [Google Scholar] [CrossRef]
- You, Y.; Huang, H.; Shao, G.; Hu, J.; Xu, X.; Luo, X. A three-dimensional numerical model of unsteady flow and heat transfer in ceramic honeycomb regenerator. Appl. Therm. Eng. 2016, 108, 1243–1250. [Google Scholar] [CrossRef]
- Subasi, A.; Ozsipahi, M.; Sahin, B.; Gunes, H. Performance evaluation of RANS-based turbulence models in simulating a honeycomb heat sink. Heat Mass Transf. 2017, 53, 2435–2443. [Google Scholar] [CrossRef]
- Ozsipahi, M.; Subasi, A.; Gunes, H.; Sahin, B. Numerical investigation of hydraulic and thermal performance of a honeycomb heat sink. Int. J. Therm. Sci. 2018, 134, 500–506. [Google Scholar] [CrossRef]
- Ravichandran, S.; Hojjati, M. Experimental and numerical thermal characterization of honeycomb core sandwich structures with glass/polypropylene twill weave composite face sheets. Int. J. Heat Mass Transf. 2024, 231, 125869. [Google Scholar] [CrossRef]
- Gao, J.; Xu, J.; Lin, J.; Lu, S. Experimental and numerical simulation studies on the thermal response of aluminum honeycomb panels with different sizes. Therm. Sci. Eng. Prog. 2025, 57, 103173. [Google Scholar] [CrossRef]
- Xiao, P.; Zhou, C.; Luo, Y. Study on the influence of hole shapes on the fluid and mechanical properties of perforated honeycomb sandwich structures. In Journal of Physics: Conference Series; IOP Publishing: Bristol, UK, 2024; Volume 2808, p. 012074. [Google Scholar]
- Ye, J.; Zhang, M.; Zhang, Y.; Zhu, J.; Li, Q. Numerical modeling and optimization of active heat dissipation in honeycomb sandwich microchannels for aircraft applications. Case Stud. Therm. Eng. 2025, 74, 106869. [Google Scholar] [CrossRef]
- Burger, N.; Laachachi, A.; Ferriol, M.; Lutz, M.; Toniazzo, V.; Ruch, D. Review of thermal conductivity in composites: Mechanisms, parameters and theory. Prog. Polym. Sci. 2016, 61, 1–28. [Google Scholar] [CrossRef]
- Toberer, E.S.; Baranowski, L.L.; Dames, C. Advances in thermal conductivity. Annu. Rev. Mater. Res. 2012, 42, 179–209. [Google Scholar] [CrossRef]
- Shih, T.H.; Liou, W.W.; Shabbir, A.; Yang, Z.; Zhu, J. A new k-ε eddy viscosity model for high reynolds number turbulent flows. Comput. Fluids 1995, 24, 227–238. [Google Scholar] [CrossRef]
- Zhang, H.; Zhang, Y.F.; Li, J. Improvement in ice tolerance of swept wing based on variable drooping leading edge. Chin. J. Aeronaut. 2025, 38, 103599. [Google Scholar] [CrossRef]
- Subasi, A.; Sahin, B.; Kaymaz, I. Multi-objective optimization of a honeycomb heat sink using Response Surface Method. Int. J. Heat Mass Transf. 2016, 101, 295–302. [Google Scholar] [CrossRef]
Disclaimer/Publisher’s Note: The statements, opinions and data contained in all publications are solely those of the individual author(s) and contributor(s) and not of MDPI and/or the editor(s). MDPI and/or the editor(s) disclaim responsibility for any injury to people or property resulting from any ideas, methods, instructions or products referred to in the content. |
© 2025 by the authors. Licensee MDPI, Basel, Switzerland. This article is an open access article distributed under the terms and conditions of the Creative Commons Attribution (CC BY) license (https://creativecommons.org/licenses/by/4.0/).