Abstract
Compressed air energy storage in aquifers (CAESA) is a promising technology for large-scale, long-duration energy storage. The initial bubble, also known as cushion gas, is a prerequisite for system operation, as it creates the storage space and provides pressure support. However, the optimal amount of cushion gas needed to satisfy both energy storage scale and system cycle time (SCT) remains insufficiently studied. In this work, we investigate the relationship between cushion-gas masses and SCT under various energy storage scales using numerical simulations, and further analyze its impact on the maximum achievable energy storage scale through an orthogonal design encompassing nine geological conditions. Simulation results indicate that aquifer permeability, depth, and thickness impose a physical upper limit on achievable storage scales. Below this threshold, increasing cushion-gas mass approximately linearly enhances SCT, while beyond it, performance gains saturate. The effect of the air bubble on system performance is also influenced by well screen length. Sensitivity analysis suggests that larger injection masses are beneficial under high-permeability and deeper burial conditions, whereas excessive injection under unfavorable geological conditions can lead to inefficiency and wasted resources. Based on these findings, the recommended injection gas masses for different energy storage scales under the ideal model are provided, along with suggestions for gas injection configurations based on various geological conditions. This work provides a new approach for the design of initial bubble injection for a CAESA system.
1. Introduction
The growing urgent carbon reduction and energy transition underscores the necessity of large capacities, long-term, and economically viable energy storage technologies to support renewable integration and enhance grid flexibility [1,2,3,4,5,6]. Compressed air energy storage (CAES) is particularly attractive due to its large-scale, long-duration storage capability with low environmental impacts [7,8]. CAES can be operated in three types of geological reservoirs: salt or hard-rock caverns, aquifers, and depleted oil and gas reservoirs. Aquifers would be advantages over the other two types, due to their more widespread distribution, higher storage capacity, and relatively lower unit cost—approximately 60~70% of that associated with salt or hard-rock caverns, showing more application prospects [9].
A field experiment conducted in Pittsfield, Illinois, demonstrated that injecting compressed air into an aquifer is viable, in which the initial gas bubble can sustain efficient energy storage and recovery [10]. The feasibility of utilizing aquifer porous media as large-scale energy storage reservoirs were further validated through numerical simulations by Oldenburg and Pan [11], along with other researchers [12,13,14,15]. These studies show that the initial bubble, also known as cushion gas, must initially be injected into the aquifer to displace the connate water in the aquifer and maintain the pressure of the gas storage space and prevent water from retreating during energy production.
The initial bubble impacts the performance of compressed air energy storage in aquifers (CAESA). The performance of a CAESA system is usually assessed with the storage scale and the corresponding maximum system cycle times (SCT). The energy storage scale, typically measured in megawatts (MW), reflects the system’s capacity to release energy. It also serves as an indicator for evaluating the economic feasibility of the system. The maximum system cycle time essentially represents the ‘operational lifetime’ of the system after a single-time injection of cushion gas [16]. The initial bubble mass is supposed to be 10 to 100 times the working gas mass, depending on the storage scale [17]. According to Berving and Wallace [18], generating 150–200 MW of electricity over 8–10 h require a minimum air storage volume of approximately 15 × 106 m3, serving as an engineering order-of-magnitude estimate. Previous studies mostly focused on discussing the effects of aquifer properties and the perforation length on the distribution of the initial bubble and the system performance. Guo et al. [16] pointed out that there exists an optimal permeability range within which the bubble can sustain the maximum system cycle time (SCT). An appropriate cushion gas mass ensures high gas saturation, whereas excessive injection may cause redundant pressure buildup, air loss, and increased operational costs. In addition, the length of the well screen affects the bubble distribution: shorter screens tend to promote horizontal bubble migration, which may lead to greater gas dispersion and pressure fluctuations during operation [19]. From the perspective of storage scale, Yang et al. [20] found that aquifer permeability and depth exert the greatest influence on the maximum gas production mass flow rate (MFRM). When the bubble is sufficiently thick to prevent water production, the MFRM exhibits a linear relationship with permeability and a parabolic relationship with depth.
The effect of cushion gas mass on the performance of a CAESA system, in terms of the maximum energy storage scale and system cycle time (SCT), has been less studied. Therefore, we investigated this issue with a typical geologic setup of a CAESA system through numerical simulations. The relationship between the cushion gas injection mass and the SCT was explored across various energy storage scales, aiming to identify appropriate injection amounts that maximize the system performance. For the energy storage scale, we set different geological conditions to discuss the impact of bubble mass on it, and further analyzed the optimal gas injection amount under varying reservoir depths and permeability conditions. This study offers a new approach to assess the performance of a CAESA system at early development.
2. Methodology
2.1. Model Setup
The typical geologic setup of a CAESA system was taken from a demonstration CAESA project once carried out in Dallas Center, Iowa [21]. The Mt. Simon formation at Dallas Center is an irregular domal structure with a closure area of approximately 3.8 km2 [22]. The target aquifer is the Mt. Simon sandstone, overlain by the Eau Claire dolomite caprock and underlain by Precambrian low-permeability basement rock [23]. It possesses the typical structure of a closed anticline aquifer, with low permeability caprock and basement rock. Based on the geological conditions of the Iowa site and publicly available data, an idealized model was established to address the fundamental issue in this paper of how bubble mass affects system performance. The model serves as the basic model in this study. Figure 1 shows the structure of the model.
Figure 1.
The structure of the model. (a) X-Z plane view, (b) X-Y top view.
Since a single injection–production well in aquifer compressed air energy storage operation has axial symmetry, only one quarter of the region was simulated, with its left boundary coinciding with the central axis of radial symmetry, and the injection–production well located at the axis. The anticline structure was described by a cosine function, with a height difference of 30 m and a radius of 1000 m, corresponding to the actual closed area. The target aquifer thickness of the basic model was 24.4 m, with the top depth of 886.7 m. The surface temperature was set at 20 °C, and the geothermal gradient was calculated as 25 °C/km, which is a typical value for geothermal gradients within 3–5 km depth [24].
The idealized base model was developed by extracting the typical geological characteristics of a closed anticline aquifer, with parameter settings derived from actual reservoir data. Stottlemyre [25] pointed out that the permeability and porosity of the aquifer should not be lower than 300 mD and 10%, respectively. To accommodate larger energy storage scales and adequately simulate system behavior under varying conditions, the reservoir permeability was set to 324 mD, consistent with the recommended aquifer properties for CAESA systems. The basic model parameters are listed in Table 1, and detailed reservoir property parameters are provided in Table 2.

Table 1.
The parameter settings for each layer of the base model.
Table 2.
List of key parameters for the basic model aquifer.
Through orthogonal experimental design, nine additional geological conditions (A1–A3; B1–B3; C1–C3) were constructed, and the impact of initial bubble mass on the maximum energy storage scale was investigated under each of these conditions. The orthogonal experimental design method is widely applied in energy systems, chemistry, and many other fields [26,27]. It ensures that each parameter value appears the same number of times in all experiments and is evenly combined with the values of other parameters, thereby maximizing the reflection of the overall characteristics of the parameter space with a limited number of experiments. The models for the nine geological conditions were established by modifying the basic model, with the corresponding modifications to the reservoir parameters determined based on previous aquifer gas storage projects [20]. The typical ranges of aquifer permeability, burial depth, and thickness were selected as 0.1 D–1.0 D, 400 m–1200 m, and 20 m–70 m, respectively, with porosity fixed at 0.2. However, in practice, porosity and permeability are correlated, with permeability increasing as porosity increases. According to Yang et al. [20], if porosity is varied while keeping permeability constant, the maximum gas production mass flow rate of the well is almost unaffected. This is because the constant permeability determines the overall air transport capacity across the cross section. The setup of the nine geological condition cases is shown in Table 3.
Table 3.
Orthogonal experimental design for nine geological conditions.
It should be noted that the permeability used in the basic model (324 mD) originates directly from well-logging data of the Dallas Center CAESA demonstration site and is intended to construct a homogeneous idealized reservoir representative of typical geologic conditions. The purpose of the basic model is to examine the relationship between bubble mass and SCT under a set of fixed energy storage scales. In contrast, the orthogonal simulations employ a wider permeability range (100, 500, and 1000 mD) to investigate how bubble mass influences the maximum achievable storage scale under different reservoir conditions. These two components target different performance indicators and therefore use different permeability settings by design.
In addition, six energy storage scales within the single-well 10 MW range were designed, and five cushion gas injection mass tests were conducted for each, as shown in Table 4, where the values in parentheses represent the corresponding gas production rates. It is worth noting that different energy storage scales are reflected by varying gas production rates, meaning that the maximum gas production mass flow rate (MFRM) achievable by the system also represents the maximum energy storage scale it can attain. Finally, in all simulation cases, five different cushion gas injection masses were set, as shown in Table 5.
Table 4.
Six energy storage scale settings.
Table 5.
Air bubble settings.
The present study employs an idealized, homogeneous aquifer model, neglecting heterogeneity, wellbore dynamics, detailed thermal processes, and geomechanical effects such as pressure-induced deformation. Such simplifications allow for a clearer interpretation of the governing mechanisms but may overlook preferential flow paths [28], localized pressure anomalies, and wellbore heat losses. Nevertheless, these assumptions enable the model to capture the essential hydro-thermodynamic behavior of the system and to focus on the relationship between cushion gas mass and overall system performance.
2.2. Numerical Modeling
This study investigates the influence of cushion gas injection mass on the system cycle time (SCT) and energy storage scales in CAESA systems. Numerical simulation is applied to analyze the system performance under varying conditions, which is divided into two parts: (1) A range of cushion gas injection masses was designed to simulate six storage scales to obtain SCT and analyze their interrelationship. In addition, two more scenarios with longer penetrating well screens were designed and simulated to account for the impact of well screen length on the system; (2) Based on the idealized model, further geological cases with varying reservoir parameters were designed. To control for variables, simulations were conducted under the constraint of a unified constant SCT to determine the maximum achievable storage scales under different cushion gas injection masses. The maximum energy storage scale is represented by the maximum gas production mass flow rate (MFRM).
TOUGH3 is employed for the numerical simulations. TOUGH3 is a general-purpose numerical simulator developed to solve the mass and energy balance equations for multiphase and multicomponent flow and heat transport in porous and fractured media. It integrates both serial and parallel implementations of the original TOUGH framework [29]. EOS3 (Equation of State 3) is a specific module within TOUGH3 designed for simulating the transport and thermal processes of water, air, and heat in subsurface porous and fractured media. The governing equations for two-phase flow and heat transfer are summarized in Table 6.
Table 6.
Governing Equations for Air-Water Two-Phase Flow and Heat Transfer in TOUGH3/EOS3.
The model adopted variable vertical and horizontal grid spacing, with the finest horizontal spacing of 0.2 m and vertical spacing of 2 m defined near the injection–production well, while larger spacings were used in the rest of the model domain. In total, the model contained 21,904 grids. Figure 2 shows the mesh profile of the conceptual model. To avoid boundary effects, the horizontal size of the model was set to 15,000 m × 15,000 m, with the lateral boundary set as a no-flow boundary. The initial condition of the model was set in hydrostatic pressure equilibrium.
Figure 2.
Grids for the model.
2.3. Operation Scenarios
In all cases, the simulations adopt a typical daily cycling scenario [16], where one day is divided into four stages: 12 h of injection, 4.5 h of shut-in, 3 h of production, and 4.5 h of shut-in. The injection temperature of cushion gas is assumed to be the same as the formation temperature, and in the subsequent cycling processes, the injection temperature of the working gas is set to 50 °C. Moreover, in the daily cycling, the total injected air mass is kept equal to the produced gas mass in order to maintain the cushion gas bubble. The working gas injection temperature of 50 °C is consistent with the common practice in previous CAESA numerical simulation studies [11,15], and does not strictly follow the reservoir environmental temperature. Additionally, injecting at a moderately higher temperature can provide thermodynamic advantages and improve round-trip efficiency [10,30].
In the nine groups of orthogonal experiments, the determination of the achievable maximum gas production mass flow rate (MFRM) should satisfy the following conditions. The minimum bottom-hole pressure must be equal to or higher than 70% of the original hydrostatic pressure, and the maximum pressure should not exceed 200% of the original hydrostatic pressure, so as to prevent sand production or cavity collapse due to pressure decline [31], or fracturing due to excessive pressure increase. In addition, water should not be produced during the production process. Since the boundary of the initial bubble may not be able to continuously maintain pressure, as the daily cycles progress, the minimum bottomhole pressure will continue to decrease. In the first part of the study, under the base model, the obtained SCT represents the number of days the system operates when the wellbore pressure reaches the minimum limit or when water production occurs. In the orthogonal experiment, the obtained MFRM refers to the gas production rate at which the system can precisely reach the lower pressure limit under the pre-set SCT. Therefore, when investigating the quantitative relationship between MFRM and the amount of cushion gas injection under different geological conditions, it is necessary to artificially specify an SCT criterion, so that MFRM can be simulated within the predefined SCT range. Different SCT constraints do not significantly affect the overall trend of the curves. In this study, the SCT criterion is artificially set to 100 days. This is a method of controlling variables, ensuring that the MFRM under different geological conditions is no longer affected by the system operating time, thus allowing the observation of its relationship with bubble mass. The value of 100 days is consistent with previous CAESA studies [11,15,20] and serves as a representative intermediate duration for comparison. Although simplified, this approach does not affect the determination of the optimal cushion-gas mass, which is based on the trend of the results rather than absolute MFRM values.
2.4. Feasibility Validation of Numerical Model
Previous investigations of the Mt. Simon aquifer at Dallas Center demonstrated that numerical simulation is essential for assessing aquifer CAES feasibility, as conventional engineering tools are insufficient to capture the complexity of multiphase flow and thermophysical processes [32].
To verify the reliability of the present idealized model, we reproduced the system cycling process under the same operational conditions as the feasibility study. The simulated wellhead pressure was compared with the reported test results, showing a maximum relative error of 18% (Figure 3). The difference in pressure fluctuations arises from differences in geological complexity. The field-site model incorporates site-specific heterogeneity, multilayer structure, and fine grid discretization to reproduce field behavior accurately, whereas our model adopts a simplified, homogeneous, and idealized representation of the aquifer. Although it does not capture all the heterogeneities of the field site, this model is suitable for the present study as it allows systematic investigation of the fundamental effects of cushion-gas mass on system performance, including SCT and maximum energy storage scale. Despite the differences in pressure fluctuations, the relative pressure patterns during injection, shut-in, and production remain consistent with field results, and the maximum relative error is within acceptable bounds for simplified CAES modeling.
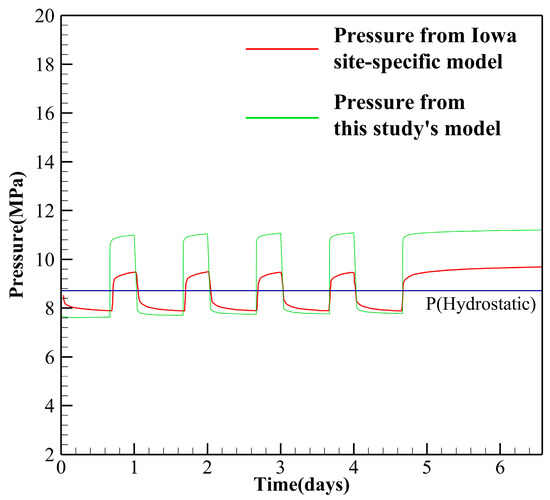
Figure 3.
Comparison of simulated pressure from the model developed in this study and from the Iowa site-specific CAESA model.
This level of agreement indicates that the simplified model can reasonably capture system behavior, with pressure fluctuations remaining minor and within safe operating limits. Consequently, the idealized model is considered suitable for further analysis of the effects of bubble mass on system performance.
3. Results and Discussion
3.1. Basic Model Results
3.1.1. Gas Saturation and Pressure Variation
In the basic model, five different sizes of initial gas bubbles were formed at an injection rate of 5 kg/s, as shown in Figure 4. Subsequently, simulations were conducted for six different energy storage scales, and the results are presented in Figure 5. In the figure, the 10 MW curve is not shown, and some curves are missing at certain energy storage scale points. This is because, under the current conditions, the pressure support provided by the cushion gas is insufficient to meet the corresponding energy storage scale requirements. Since the vertical axis of the plot is limited to a maximum value of 1000, data points with SCT values exceeding 1000 are connected with dashed lines.
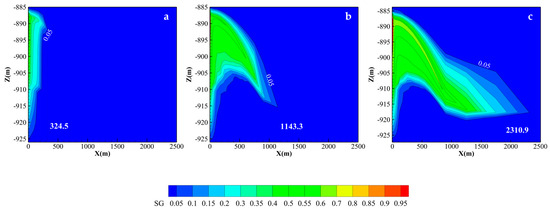
Figure 4.
Saturation images of bubbles formed by three different masses, (a) 5.184 × 10⁶ kg; (b) 46.656 × 10⁶ kg; (c) 129.6 × 10⁶ kg.
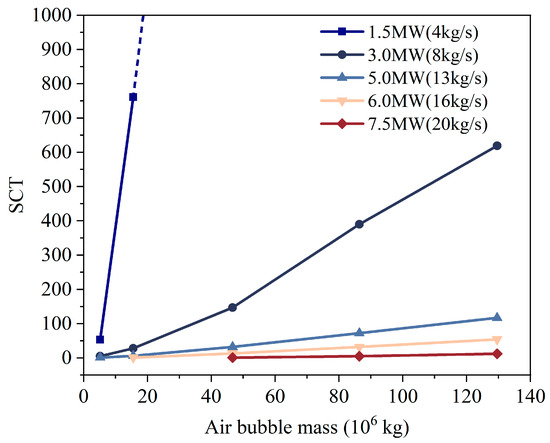
Figure 5.
The relationship between the air bubble mass and SCT under six different energy storage scales in the basic model.
Figure 4 shows the air saturation distributions after injecting 5.184 × 10⁶ kg, 46.656 × 10⁶ kg, and 129.6 × 10⁶ kg of air. As the mass of cushion gas increases, the 0.05 air saturation contour front extends to 324.5 m, 1143.3 m, and 2310.9 m, respectively. The anticlinal structure constrains the shape of the bubble development. As illustrated in Figure 5, for the 1.5 MW to 10 MW simulations, the 1.5 MW storage scale does not require a large injection volume to maintain long-term system operation. With increasing storage scale, the system’s operational duration decreases overall. When the storage scale reaches 10 MW, even the largest cushion gas injection cannot sustain system operation. For systems with scales ranging from 1.5 MW to 3.0 MW, SCT increases significantly with greater initial gas injection, showing an almost linear relationship. However, for systems with 5.0 MW to 7.5 MW scales, even a substantial increase in cushion gas injection fails to markedly extend the SCT. Nevertheless, continuously increasing the cushion gas injection is necessary to support the operation of larger-scale storage systems. Therefore, forming a sufficiently large high gas saturation region is a prerequisite for ensuring the stable operation of large-scale CAESA systems.
Taking two cushion gas injection masses as examples, Figure 6 presents the pressure contour maps and the corresponding 0.05 gas saturation isopleths after the formation of the initial gas bubble and at the end of operation for 3.0 MW and 7.5 MW storage scales under cushion gas injection amounts of 46.656 × 10⁶ kg and 129.6 × 10⁶ kg, respectively. After injecting the two different cushion gas masses, the front of the 0.05 saturation contour extends to 1143.3 m and 2310.9 m, with the bottom boundary advancing to −925.6 m and −925.8 m, respectively. Near the well, the pressure exceeds 14.0 MPa and 14.5 MPa, while at 4000 m the pressure ranges around 10.5–11.5 MPa. The larger gas bubble provides stronger pressure support.
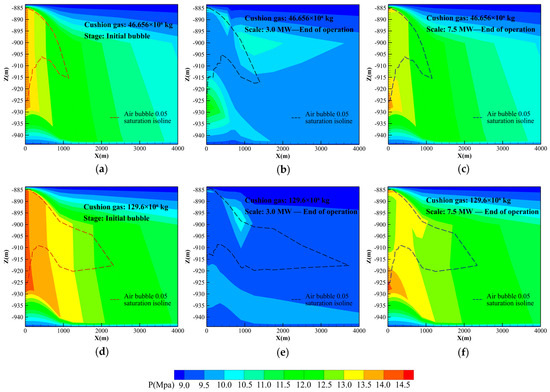
Figure 6.
Reservoir pressure distributions and gas saturation contours (0.05 iso-saturation) for two cushion-gas injection scenarios. Subfigures (a–c) correspond to an injection mass of 46.656 × 10⁶ kg, and (d–f) correspond to 129.6 × 10⁶ kg. For each injection mass, the figures show the (i) initial bubble formation and (ii) the pressure and saturation fields at the end of operation under energy storage scales of 3.0 MW and 7.5 MW.
In the 3 MW system, by the end of operation, the bottom of the 0.05 saturation contour for the two initial bubble configurations had retracted to −925.0 m and −915.3 m, respectively, while the fronts extended to 1394 m and 3731 m, respectively. Although the mass of injected and withdrawn air during each daily cycle is equal, the overall bubble volume still increases after the completion of all cycles. The analysis suggests that during daily injection, air is pressurized and forced to expand outward. At the gas–water interface, gas continuously ruptures and dissolves, diffusing into the aqueous phase. During withdrawal, although the pressure decreases, the capillary pressure at the gas–water boundary does not allow pore water to return to its original position, nor does the dissolved gas re-precipitate; hence, each daily cycle incrementally advances the outer boundary. In addition, the bubble shape gradually becomes “flattened”, with the lower boundary rising and the lateral boundary extending. This is likely because, in formations where horizontal permeability (kh) is greater than vertical permeability (kv)—as is often the case in stratified sandstone aquifers—lateral spreading is much easier than vertical expansion, leading air to preferentially diffuse laterally. Moreover, buoyancy drives the gas upward within the aquifer, where pressure accumulation at the top promotes air displacement of formation water. The upward migration of gas reduces pressure in the lower part of the aquifer, allowing formation water to displace the gas at the bottom, thereby raising the lower boundary. Therefore, the larger gas injection volume of 129.6 × 10⁶ kg, which allows the system to operate continuously for 619 days, extends the boundary to a farther region.
According to Figure 6b,e, it can be observed that the pore pressure in most areas within a 4000 m radius drops to approximately 10.0 MPa and 9.5 MPa, respectively. A high-pressure accumulation zone is visible in the upper part of the images, located near the downward-bending section of the anticline structure and the right-hand side low-permeability caprock. Generally, because pressure propagation occurs faster than gas migration [19], pressure is transmitted through the water phase into the low-permeability caprock, forming a high-pressure zone, while gas migration lags behind. Additionally, the anticline structure restricts gas migration in the upper aquifer, causing pressure to transfer laterally toward the low-permeability caprock on the right side, resulting in a trapped high-pressure region.
In the 7.5 MW system, due to its higher gas production rate, the bottomhole pressure rapidly dropped to 6.12 MPa (the lower pressure limit). As shown in Figure 6c,f, because of the short operating duration of the 7.5 MW system, the pressure variations under both initial bubble conditions were mainly confined within a 1000 m radius from the wellbore, while the outer pressure gradient showed little change, and the bubble boundary remained almost unchanged.
The variations in bottom-hole pressure were further illustrated in Figure 7 and Figure 8. During the production phase, the pressure gradient is concentrated near the well. Under a relatively high gas production rate (7.5 MW), an initial gas bubble of 46.656 × 10⁶ kg can sustain system operation for only one day, as shown in Figure 7c, the bottom-hole pressure drops by 9.3 MPa after one cycle, and the pore pressure within 200 m of the well decreases by 1.4 MPa (from 14.4 MPa to 13.0 MPa), indicating rapid pressure dissipation near the wellbore. With an initial gas bubble of 129.6 × 10⁶ kg, the daily pressure drop is approximately 8 MPa, as shown in Figure 7f, supporting system operation for 12 days. At the end of the operation, the pore pressure within 200 m of the well also drops by 1.4 MPa (from 14.0 MPa to 12.6 MPa). The smallest bubble (5.184 × 10⁶ kg) provides the weakest pressure support and fails to sustain long-term operation (Figure 8). Pressure analysis indicates that increasing the amount of injected gas can slow the rate of pressure decline; however, at high energy storage scales, the pressure near the well still drops rapidly. The gas reserves in the far field cannot effectively replenish the pressure near the wellbore, and thus cannot significantly improve the SCT.
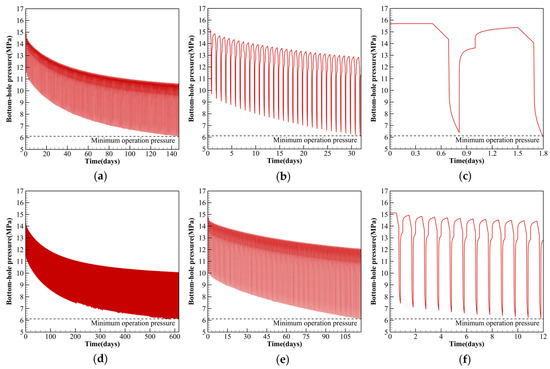
Figure 7.
Bottom-hole pressure curves after injecting 46.656 × 10⁶ kg of cushion gas to form the initial bubble, followed by system operation at energy storage scales of (a) 3.0 MW, (b) 5.0 MW, and (c) 7.5 MW; and after injecting 129.6 × 10⁶ kg of cushion gas, followed by system operation at storage scales of (d) 3.0 MW, (e) 5.0 MW, and (f) 7.5 MW.
Figure 8.
Bottom-hole pressure curves under system operations of 3.0 MW, 5.0 MW and 7.5 MW following bubble formation by injecting 5.184 × 10⁶ kg of cushion gas.
In contrast, the lower gas production rates of the 3.0 MW and 5.0 MW systems allow the gas bubble to provide sustained pressure support over a longer period. As shown in Figure 7a,d, for the 3.0 MW system under two different initial gas bubble conditions, the daily pressure fluctuation before the end of operation was 4.48 MPa and 3.95 MPa, respectively. The pressure drop within the bubble was approximately 50% of that in the 7.5 MW system. The injection of a larger cushion gas mass further enhanced the system’s pressure maintenance capability, thereby significantly improving the SCT.
In summary, the bubble volume determines its capacity for pressure transmission. A larger bubble (129.6 × 10⁶ kg) occupies more pore space, facilitating more effective pressure propagation and reducing the pressure drop during each production cycle. However, under high gas production rates, the pressure drop in the near-well region caused by gas withdrawal cannot be promptly compensated by pressure transmission from the bubble boundary through the aquifer. This dynamic imbalance may be the main reason why increasing bubble size does not significantly improve the SCT at higher energy storage scales.
3.1.2. Influence of Well Penetration Length
Two additional models with different well screen lengths were designed: one with a penetration depth of 16 m and another with full penetration of 24.4 m through the aquifer. The schematic diagrams are shown in Figure 9 (Case 2 and Case 3 represent the two new models). Initial gas bubbles were still formed using five different cushion gas injection amounts, and simulations were conducted for 6.0, 7.5, and 10.0 MW systems to investigate their impact on SCT. The simulation results are presented in Figure 10.
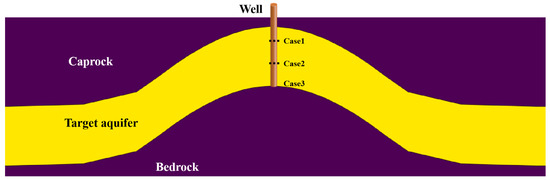
Figure 9.
Schematic figure of the three cases with a different penetrating well to the target aquifer.
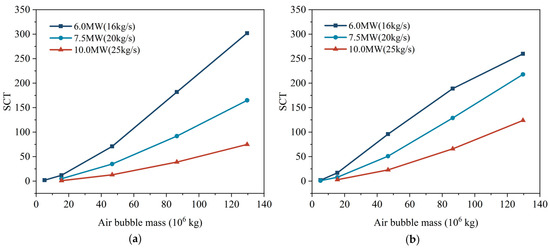
Figure 10.
Relationship curves between SCT and bubble mass under two penetrating well depths: (a) 16 m and (b) 24.4 m.
It can be observed that SCT increases with the length of the well screen. Under the geological conditions and bubble configuration of the basic model, the 10.0 MW energy storage system cannot operate with a 6 m well screen length. However, when the screen fully penetrates the aquifer and the cushion gas injection amount reaches 129.6 × 10⁶ kg, the system can operate continuously for 124 days. However, under small gas bubble conditions (5.184 × 10⁶ kg), increasing the well length does not effectively improve SCT. Analysis shows that for all three storage scales, the 5.184 × 10⁶ kg injection amount allows for only a few cycles or cannot support operation at all. This is because the gas bubble occupies a limited pore volume and is easily disturbed during the production process, leading to a rapid pressure drop that cannot be compensated by increasing the well length.
Using the 7.5 MW system as an example, Figure 11 shows the relationship between SCT and different well screen lengths under three bubble sizes. As the well screen length increases, the greater the cushion gas mass, the more significant the SCT improvement. Li et al. [19] pointed out that longer well screens enable more energy to be extracted from air at higher pressures and temperatures. A larger mass of cushion gas creates a wider gas-connected zone, which can more effectively buffer the localized pressure drop caused by production, thereby significantly increasing SCT. Therefore, a sufficiently large bubble volume is a prerequisite for the enhanced effect of well screen length. Additionally, it can be seen that, under the same cushion gas mass, when the well screen length increases from approximately 25% to 65% of the aquifer thickness, SCT improves by 127.5–340%; further increasing the well screen length to 100% results in an additional 32.1–45.7% increase in SCT.
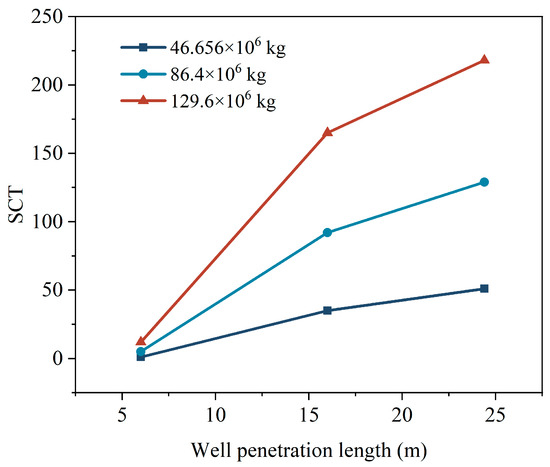
Figure 11.
Relationship curves between SCT and well penetration length under a 7.5 MW energy storage scale, following bubble formation with three different cushion gas masses.
It is worth noting that in Figure 10b, the SCT increase for the 129.6 × 10⁶ kg injection in the 6.0 MW curve actually decreases, and the SCT is even lower than that of the 16 m well length case. This is because the system operation was terminated due to water production, not because the bottom-hole pressure dropped below the lower limit. As previously discussed, with continued cycling, the gas bubble tends to expand outward and the bottom boundary rises. Compared to shorter well screens, a fully penetrating well is more likely to allow the gas–water interface to reach the bottomhole earlier. Based on the above analysis, although increasing the well screen length can improve system performance under the premise of sustained operation, the use of fully penetrating wells is not recommended, as the marginal SCT improvement diminishes and there is a higher risk of water production as well as increased construction cost.
Based on the above analysis, for an energy storage station with an anticlinal aquifer reservoir characterized by a 1 km radius, 30 m height difference, approximately 900 m depth, 25 m thickness, a permeability of about 0.3 D, and a well screen length of 6 m, we recommend the cushion gas injection mass schemes listed in Table 7.
Table 7.
The proposed gas injection mass scheme in the base model.
Since the 10.0 MW system cannot achieve a significant increase in SCT even with extended well screen length and increased cushion gas injection, it indicates that under this geological condition, the reservoir cannot support long-term operation of higher-capacity energy storage systems.
3.2. Influence of Geological Conditions
Nine different geological condition cases (Table 3) were further simulated to explore the MFRM under five levels of cushion gas injection mass for each case. The simulation results are shown in Figure 12. In the figure, groups A, B, and C represent permeability conditions of 0.1 D, 0.5 D, and 1.0 D, respectively. Within each group, increasing numerical labels correspond to increasing depth of aquifer of 400 m, 800 m, and 1200 m.
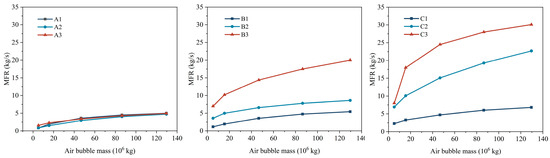
Figure 12.
Relationship curves between the achievable MFRM and the injected air bubble mass under 9 constructed geological conditions.
Under all conditions, MFRM increases with greater cushion gas injection. However, the curves vary in terms of growth rate across different geological settings. Overall, as cushion gas mass increases, the growth of MFRM tends to level off.
The analysis of the scatter plot reveals that at high permeability (1.0 D), increasing the mass of cushion gas has the most significant effect on enhancing the storage capacity. In contrast, under low permeability conditions (0.1 D), even enlarging the gas bubble does not effectively improve the energy storage scale due to the reduced gas mobility. This is because lower permeability corresponds to a smaller gas flow rate through a unit area under the same pressure differential. As a result, even with a larger initial bubble volume, gas in the outer region remains constrained by poor mobility during the production phase, leading to delayed response. In high-permeability formations, however, cushion gas can be rapidly replenished to the near-wellbore region.
An investigation into the effect of aquifer depth on the system indicates that greater depth also contributes to improving the MFRM. Under three different permeability conditions, the average increase in MFRM per additional 400 m of depth was calculated, as shown in Table 8. At higher permeability, increasing aquifer depth more effectively enhances the energy storage scale, whereas at lower permeability, greater depth has little effect on improving gas production rates. This may be due to the restriction of gas flow by low permeability, which prevents the advantages of higher storage density and pressure at greater depths from being effectively transmitted to the wellbore. In contrast, higher permeability allows for more efficient utilization of deep reservoir pressure, thereby enhancing gas flow transport capacity.
Table 8.
The average MFRM value that can be improved for every 400 m depth increase.
Further range analysis was conducted on the three considered geological parameters, where “Level” refers to the three distinct values assigned to each parameter. For a given parameter, the MFRM mean values were calculated separately for groups containing these three values, and the range was determined as the difference between the maximum and minimum of these mean values. The results of these calculations are presented in Table 9, with Level 1 to Level 3 representing progressively increasing parameter values. The range analysis indicates that permeability and depth exert the most significant influence on MFRM and directly impact the energy storage scale. Higher permeability enhances gas mobility within the aquifer, enabling the system to support elevated gas production rates. Greater depth results in higher initial hydrostatic pressure and increased gas storage density, allowing for a wider pressure fluctuation range and higher utilizable energy per cycle. Consequently, the C3 case (high permeability and depth) exhibits the highest MFRM across all scenarios.
Table 9.
Range analysis results.
However, in practical terms, it does not necessarily follow that higher permeability and greater aquifer depth are always preferable. Research by Guo et al. [16] has demonstrated that high permeability can also reduce bubble sustainability, thereby shortening cycle times. Moreover, aquifer depth and thickness should not be excessively large, as greater depths are associated with increased storage pressure and typically lower permeability, leading to elevated costs and reduced efficiency. A thicker aquifer significantly influences transport capacity; however, this necessitates the injection of substantial cushion gas, which substantially increases development and operational costs [20]. Therefore, optimization within a reasonable range of parameter values is essential.
The foregoing analysis demonstrates that the energy storage scale is influenced and constrained by various geological conditions. As bubble size increases, the growth rate of the maximum gas production rate diminishes, indicating that even with the injection of additional cushion gas, the energy storage scale is subject to inherent limitations. The selection of low-permeability reservoirs requires careful consideration, as a lower energy storage scale may not yield economic benefits. For reservoirs with high permeability or significant depth, it may be feasible to appropriately increase the injection volume of cushion gas. However, it is not recommended to exceed an injection volume of 86.4 × 10⁶ kg, as higher injection volumes do not substantially enhance system performance and are associated with prolonged injection times and elevated economic costs. More detailed recommendations are provided in Table 10.
Table 10.
Recommended cushion gas injection masses for different geological condition.
4. Conclusions
In this study, the influence of cushion-gas injection mass on the performance of CAESA systems was systematically investigated. Key performance indicators, including the system cycle time (SCT) and the maximum achievable energy storage scale, were analyzed under varying operational scenarios and geological conditions. The following conclusions summarize the main findings and practical implications for optimal gas injection strategies.
- Aquifer permeability, depth, and thickness impose a “physical upper limit” on energy storage scales. Simulation results indicate that the maximum achievable storage scale under given geological conditions is jointly constrained by aquifer permeability, depth, and thickness. Below this limit, increasing the bubble mass can approximately linearly enhance SCT. However, once this limit is exceeded, further increases in injected gas mass no longer yield additional performance gains.
- A fully penetrating well increases the risk of water production, which can prematurely terminate the system cycle. Wellbore analysis demonstrates that extending the screen length to approximately 60% of the reservoir thickness can significantly enhance the SCT, with the effect being particularly pronounced in medium- to large-scale energy storage designs. Nevertheless, further extending the screen length (e.g., fully penetrating the aquifer) produces diminishing improvements in system performance while raising the risk of water production; hence, complete penetration is not recommended.
- In the basic model: For small-scale systems (1.5–3.0 MW), a cushion gas injection mass of 15.6 × 10⁶ kg is recommended, with an upper limit of 46.7 × 10⁶ kg. For medium-scale systems (8.0–16.0 MW), 86.4 × 10⁶ kg is suggested. For large-scale systems (20.0–25.0 MW), 129.6 × 10⁶ kg is the recommended value.
- Sensitivity analysis under varying geological conditions reveals that aquifer permeability and burial depth are the dominant factors affecting the maximum gas production rate. Under high-permeability and deeper burial conditions, increasing the cushion gas mass exerts a more significant impact on expanding the energy storage scale, thus justifying the use of larger injection masses (e.g., 129.6 × 10⁶ kg). Conversely, under low-permeability or shallow burial conditions, the injection mass should not exceed 86.4 × 10⁶ kg, in order to avoid ineffective injection and resource waste.
Therefore, the cushion gas injection mass should be matched to the “maximum energy storage scale supportable under geological constraints.” Once a site is selected, its feasible energy storage scale under the given geological conditions should be assessed first, and then the appropriate injection mass should be determined based on production requirements and target SCT. Avoiding the blind expansion of injection mass, while ignoring the problem of diminishing or even invalid marginal benefits, is the key to optimizing system performance.
Author Contributions
Z.L.: Writing-original draft, Validation, Formal analysis, Investigation, Data curation, Visualization, Investigation. C.G.: Writing-review & editing, Supervision, Funding acquisition, Methodology, Investigation. Q.H.: Data curation, Visualization, Investigation, Validation. All authors have read and agreed to the published version of the manuscript.
Funding
This research was funded by the China National Science Foundation (grant No. 42372286), the Deep Earth Probe and Mineral Resources Exploration—National Science and Technology Major Project (2024ZD1004107), the China Geological Survey Project (DD20221819), and the Fundamental Research Funds of the Chinese Academy of Geological Sciences (JKYQN202306).
Data Availability Statement
Data are available from the corresponding author upon reasonable requests.
Conflicts of Interest
The authors declare that the research was conducted in the absence of any commercial or financial relationships that could be construed as a potential conflict of interest.
References
- Wang, Q.J.; Feng, G.F.; Wang, H.J.; Chang, C.P. The influence of political ideology on greenhouse gas emissions. Glob. Environ. Change 2022, 74, 102496. [Google Scholar] [CrossRef]
- Mohsin, M.; Kamran, H.W.; Nawaz, M.A.; Hussain, M.S.; Dahri, A.S. Assessing the impact of transition from nonrenewable to renewable energy consumption on economic growth-environmental nexus from developing Asian economies. J. Environ. Manag. 2021, 284, 111999. [Google Scholar] [CrossRef]
- Lin, T.-Y.; Chiu, Y.-H.; Chen, C.-H.; Ji, L. Renewable energy consumption efficiency, greenhouse gas emission efficiency, and climate change in Europe. Geoenergy Sci. Eng. 2025, 247, 213665. [Google Scholar] [CrossRef]
- Li, J.; She, Y.; Gao, Y.; Li, M.; Yang, G.; Shi, Y. Natural gas industry in China: Development situation and prospect. Nat. Gas Ind. B 2020, 7, 604–613. [Google Scholar] [CrossRef]
- Halkos, G.; Tsilika, K. Visual exploration of energy use in EU 28: Dynamics, patterns, policies. Energies 2021, 14, 7532. [Google Scholar] [CrossRef]
- Fengyun, W. Renewable Energy Development and Support Policies in Beijing. In IOP Conference Series: Earth and Environmental Science; IOP Publishing: Bristol, UK, 2019; Volume 233, p. 042001. [Google Scholar] [CrossRef]
- Golden, R.; Paulos, B. Curtailment of renewable energy in California and beyond. Electr. J. 2015, 28, 36–50. [Google Scholar] [CrossRef]
- Li, Y.; Liu, Y.; Cao, X. Compressed air energy storage in aquifers: Basic principles, considerable factors, and improvement approaches. Rev. Chem. Eng. 2021, 37, 561–584. [Google Scholar] [CrossRef]
- Allen, K. CAES: The underground portion. IEEE Trans. Power Appar. Syst. 1985, PAS-104, 809–812. [Google Scholar] [CrossRef]
- Allen, R.D.; Doherty, T.J.; Kannberg, L.D. Summary of Selected Compressed Air Energy Storage Studies; Pacific Northwest National Laboratory: Richland, WA, USA, 1985. [CrossRef]
- Oldenburg, C.M.; Pan, L. Porous media compressed-air energy storage (PM-CAES): Theory and simulation of the coupled wellbore–reservoir system. Transp. Porous Media 2013, 97, 201–221. [Google Scholar] [CrossRef]
- Oldenburg, C.M.; Pan, L. Utilization of CO2 as cushion gas for porous media compressed air energy storage. Greenh. Gases Sci. Technol. 2013, 3, 124–135. [Google Scholar] [CrossRef]
- Jarvis, A.-S. Feasibility Study of Porous Media Compressed Air Energy Storage in South Carolina, United States of America. Master’s Thesis, Clemson University, Clemson, SC, USA, 2015. [Google Scholar]
- Guo, C.; Zhang, K.; Li, C. Influence of permeability on the initial gas bubble evolution in compressed air energy storage in aquifers. In Proceedings of the TOUGH Symposium, Berkeley, CA, USA, 28–30 September 2015. [Google Scholar]
- Yang, L.; Cai, Z.; Li, C.; He, Q.; Ma, Y.; Guo, C. Numerical investigation of cycle performance in compressed air energy storage in aquifers. Appl. Energy 2020, 269, 115044. [Google Scholar] [CrossRef]
- Guo, C.; Zhang, K.; Li, C.; Wang, X. Modelling studies for influence factors of gas bubble in compressed air energy storage in aquifers. Energy 2016, 107, 48–59. [Google Scholar] [CrossRef]
- Electricity and Air Storage Enterprises LLC. Dallas Center Dome: Modeling Results and Planning Recommendations; Iowa Stored Energy Plant Agency: Traer, IA, USA, 2007.
- Berwig, D. Geologic Assessment of Compressed Air Storage Sites in Kansas. Final Report; Black and Veatch Consulting Engineers: Kansas City, MO, USA, 1978. [Google Scholar] [CrossRef]
- Li, Y.; Zhang, K.; Hu, L.; Wang, J. Numerical investigation of the influences of wellbore flow on compressed air energy storage in aquifers. Geofluids 2017, 2017, 9316506. [Google Scholar] [CrossRef]
- Yang, X.; Czapla, J.P.; Clennell, M.B.; Lu, C. Understanding the influence of aquifer properties on the performance of compressed air energy storage in aquifers: A numerical simulation study. J. Energy Storage 2024, 99, 113202. [Google Scholar] [CrossRef]
- Moridis, G.; King, M.; Jansen, J. Iowa Stored Energy Park Compressed-Air Energy Storage Project: Compressed-Air Energy Storage Candidate Site Selection Evaluation in Iowa: Dallas Center Feasibility Analysis. Prepared for the Iowa Stored Energy Plant Agency by the Hydrodynamics Group, LLC; Hydrodynamics Group, LLC: Edmonds, WA, USA, 2007; p. 46. [Google Scholar]
- Li, Y.; Liu, Y. Numerical study on the impacts of layered heterogeneity on the underground process in compressed air energy storage in aquifers. J. Energy Storage 2022, 46, 103837. [Google Scholar] [CrossRef]
- Heath, J.E.; Bauer, S.J.; Broome, S.T.; Dewers, T.A.; Rodriguez, M.A. Petrologic and Petrophysical Evaluation of the Dallas Center Structure, Iowa, for Compressed Air Energy Storage in the Mount Simon Sandstone; Sandia National Laboratories: Albuquerque, NM, USA, 2013. [CrossRef]
- DiPietro, J.A. Keys to the interpretation of geological history. In Landscape Evolution in the United States; Elsevier: Amsterdam, The Netherlands, 2013; pp. 327–344. [Google Scholar]
- Stottlemyre, J.A. Preliminary Stability Criteria for Compressed Air Energy Storage in Porous Media Reservoirs; Battelle Pacific Northwest Laboratories: Richland, WA, USA, 1978. [CrossRef]
- Guan, Y.; Wang, X.; Zhu, Y.; Li, W.; Zhang, Y.; Chen, H. Optimal design and research for nozzle governing turbine of compressed air energy storage system. J. Energy Storage 2024, 77, 109683. [Google Scholar] [CrossRef]
- Yu, X.; Zhang, Z.; Qian, G.; Jiang, R.; Wang, L.; Huang, R.; Li, Z. Evaluation of PCM thermophysical properties on a compressed air energy storage system integrated with packed-bed latent thermal energy storage. J. Energy Storage 2024, 81, 110519. [Google Scholar] [CrossRef]
- Bai, F.; Jia, C.; Hu, J.; Alsousy, A.; Lu, Y.; Sepehrnoori, K. Storage capacity comparison of hydrogen and carbon dioxide in heterogeneous aquifers. Gas Sci. Eng. 2024, 121, 205182. [Google Scholar] [CrossRef]
- Jung, Y.; Pau, G.S.H.; Finsterle, S.; Pollyea, R.M. TOUGH3: A new efficient version of the TOUGH suite of multiphase flow and transport simulators. Comput. Geosci. 2017, 108, 2–7. [Google Scholar] [CrossRef]
- Guo, C.; Zhang, K.; Pan, L.; Cai, Z.; Li, C.; Li, Y. Numerical investigation of a joint approach to thermal energy storage and compressed air energy storage in aquifers. Appl. Energy 2017, 203, 948–958. [Google Scholar] [CrossRef]
- Rahmati, H.; Jafarpour, M.; Azadbakht, S.; Nouri, A.; Vaziri, H.; Chan, D.; Xiao, Y. Review of sand production prediction models. J. Pet. Eng. 2013, 2013, 864981. [Google Scholar] [CrossRef]
- The Hydrodynamics Group. Iowa Stored Energy Plant Agency Compressed Air Energy Storage Project: Final Project Report-Dallas Center Mt. Simon Structure CAES System Performance Analysis; The Hydrodynamics Group: Des Moines, IA, USA, 2011. [Google Scholar]
Disclaimer/Publisher’s Note: The statements, opinions and data contained in all publications are solely those of the individual author(s) and contributor(s) and not of MDPI and/or the editor(s). MDPI and/or the editor(s) disclaim responsibility for any injury to people or property resulting from any ideas, methods, instructions or products referred to in the content. |
© 2025 by the authors. Licensee MDPI, Basel, Switzerland. This article is an open access article distributed under the terms and conditions of the Creative Commons Attribution (CC BY) license (https://creativecommons.org/licenses/by/4.0/).