Abstract
This work deals with the performance gap between prognostic models of the energy needed for heating and actual energy consumption based on measurements. An in-depth case study is presented for a real single-family building, taking into account physical calculation models (monthly and simple hourly method according to the Polish methodology based on standard EN ISO 13790) and relevant input data. The hypothesis is confirmed in that it is possible to achieve high convergence between actual energy consumption and the calculated energy need when taking into account the high-quality input data obtained using relatively simple measurement methods. The results indicate the impact of key input data on the computational energy needed for heating. For the case study considered, the greatest influence is caused by the introduction of actual internal heat gains. Entering only some of the actual data may yield a result that is farther from the actual value than a result based only on standard data. This article provides knowledge that leads to the development of a “new consumption method” using physical models in combination with available high-quality input data, which helps change regulations and increase the significance of energy performance certificates in Poland.
1. Introduction
Building energy consumption is currently a topic of great interest. This is reflected in the European Union’s policy [1] to reduce the energy demand of buildings; in the UN’s sustainable development goals [2], in particular SDG 7 (affordable and clean energy) and SDG 13 (Climate Action); and in the abundance of studies in the literature on topics related to determining the energy consumption of buildings [3,4,5,6,7], construction and architectural building solutions [8], and installation systems that reduce the energy demand of buildings [9,10,11,12].
1.1. Energy Performance of the Building
The energy performance of buildings is currently a topic of interest often discussed in the literature. Directive 2002/91/EC of the European Parliament and the directive of the Council of 16 December 2002 on the energy performance of buildings (EPBD 2002) [13] imposed an obligation on European Union member states to prepare energy performance certificates for buildings, with certain exceptions. The latest revision of these regulations was made to Directive 2024/1275 of the European Parliament and the directive of the Council of 24 April 2024 on the energy performance of buildings (EPBD 2024) [14]. According to the EPBD directives [13,14], building energy performance takes into account the energy demand for heating, cooling, ventilation, domestic hot water, and lighting.
Energy demand is determined at three energy levels: energy need, final energy, and primary energy. Energy need refers to the building’s needs for specific building installations (except for lighting installations), without taking into account the energy losses of these installations and the energy demand for auxiliary equipment (e.g., pumps, fans, and automation). These additional factors are taken into account in the calculation of the final energy demand of a building, which distinguishes it from useful energy demand. Meanwhile, primary energy demand also takes into account the type of fuels and/or energy sources used to meet the final energy demand of a building.
This paper focuses on one of the most fundamental yet complex issues in determining the energy performance of a building, namely, the determination of the energy need for heating and ventilation of the building.
1.2. Building Energy Demand Models
Various types of models are used to determine the energy demand of buildings. These models can be divided into diagnostic and predictive models. Diagnostic models are used to identify the nature of the causes of specific phenomena and, thus, to better understand the laws governing a given system. Meanwhile, prognostic models, which are a set of well-defined laws governing the system, are used to predict its behavior [6]. In the context of this division, this study deals with prognostic models of useful energy for the heating and ventilation of buildings.
These models can also be divided into law-driven (law-driven or forward [6], first-principle modeling [5], “white box” [7]) or data-driven (data-driven or inverse [6]) models. Law-driven models use a specific set of laws governing a given system to predict the behavior of the system based on its properties under specific conditions. They are mainly used in the building’s design phase.
Data-driven models work in reverse, determining the properties of a system based on its behavior. They use methods based on data obtained from observations/measurements of actual buildings to provide more accurate predictions of a building’s energy performance. Among these methods, there is the “black-box” approach [5,6,7], which uses simple mathematical or statistical models that combine relevant recorded input parameters (regression, machine learning, and neural networks) without modeling physical processes. Another approach, described in [6] as inverse, called “gray box”, uses specific key (or aggregated) system parameters identified based on a physical model of the system.
In ref. [7], the term “gray box” is also used for a hybrid approach that balances the need for comprehensive information about the building in the physical model with a large amount of historical data in the statistical model. It was pointed out that such studies are characterized by optimal conditions for model calibration. In [6], the approach of using physical models that fully describe the building and its systems, but calibrated with high-quality input data, was classified not as hybrid, but as data-driven or inverse. It was presented as the approach providing the most detailed forecast, a model that is a good starting point for modeling the modernization of a building and its systems.
According to a review [7], 62% of the studies analyzed were of the “white-box” type, 11% were of the “black-box” type, and 27% were of the “gray-box” type.
Also, according to [5], most predictive models are based on first-principle modeling.
These models include less complex stationary calculations, semi-dynamic calculations, and the most complex dynamic models. There seems to be a tendency to place greater trust in more detailed dynamic building simulations, which enable more accurate simulation of the operation of individual building systems. However, there is no reason why steady-state calculations cannot provide decent predictions if good input values are used in the calculations [5].
The above clearly shows that studies based on physical models and using measurements allow for the best representation and forecasting. This approach was used in this work.
1.3. Performance Gap
Performance gaps reported in the literature [5] concern differences in energy need based on first-principle energy models and measured energy consumption in real buildings, differences between machine learning modeling results and measured energy consumption, and differences between the energy ratings specified in compliance tests and the energy certificates specified in the regulations. This paper essentially addresses the first type of performance gap and specifically considers residential buildings, as they account for a significant share of Polish national energy consumption (in 2021, households accounted for 20.2% of national energy consumption, excluding motor fuels, with 65.1% of this being used for heating [15]).
The topic of this performance gap is a current issue that has appeared in the literature since the mid-1990s to the present day [3,4,5,6,7,16,17,18,19,20].
The discrepancy between the predicted energy performance of buildings and their actual measured performance, particularly noticeable with the implementation of automated measurement reading technology (AMR), raises concerns [5]. According to the EPBD directives [13,14], the appropriate energy performance of a building is the basis for complying with the regulations, and energy performance certificates are supposed to be informative. Therefore, the excessive size of this gap cannot be accepted, which is particularly worrying in light of studies indicating that measured energy consumption may be up to 2.5 times higher than predicted energy consumption [21].
As early as 2008, there were signs that it was necessary to develop tools and methods to improve energy performance certificates [22]. There were also suggestions that performance indicators for the energy performance of buildings should be redeveloped to include confidence factors reflecting the degree of control over performance, such as accreditation of design, construction, and systems; more rigorous testing after construction; and audit arrangements [18].
However, in Poland, since the introduction of the obligation to determine the energy performance for newly designed buildings and to prepare energy performance certificates for existing buildings [23,24] in 2008, there have been relatively few changes in the methodology used to determine energy performance [25]. However, cosmetic changes to the form of the certificates themselves have been made [25].
The causes of the above-mentioned performance gap, i.e., the mismatch between prediction and measurements, according to [5], may be related to the design stage, the construction stage, and the operation stage, and causes may vary from building to building and are most often linked to combinations of various problems. Each actual building is characterized by different features, such as the properties of the materials; the type and properties of heating; the ventilation, air conditioning, and hot water systems and the manner and schedule of their operation; and the indoor air parameters and the atmospheric conditions affecting them [6]. However, this does not cover the entire range of potential uncertainty in model buildings. In ref. [26], the sources of uncertainty in the simulation of building performance are classified as specification uncertainty, modeling uncertainty, numerical uncertainty, and scenario uncertainty. The first type of uncertainty is due to inaccuracy in the specifications of the parameters of the building or system, including its geometry, material properties, system specifications, and schedules. The second type is due to simplifications of, and assumptions about, complex physical processes. The third type concerns errors introduced in the discretization and simulation of the model. The fourth type concerns the external conditions imposed on the building, including the outdoor climate conditions and the behavior of the occupants.
The reasons for the first type, in particular, depend on the reliability of the person performing the calculations. Inaccurate specification of the parameters of the building may result from a lack of relevant data, negligence in obtaining data, or even a complete disregard for the process of obtaining reliable data. The lack of reliability in the processing of energy performance certificates for buildings is currently a serious problem in the Polish market. There are companies operating on the market that issue certificates at dumping prices based on photographs and information sent by the person ordering the certificate, without verification, professional assessment, or site inspection. There is a lack of effective system solutions to penalize such practices. Therefore, in Poland, a frequent cause of the performance gap may be calculations that are not performed in accordance with the standard methodology, instead using maximum simplifications and unverified data.
This situation is not helped by the lack of systemic verification/certification of software for determining energy performance. The Polish market offers programs from various manufacturers which often do not allow for calculations that are fully compliant with the valid methodology. However, this article omits such pathological causes of the performance gap.
1.4. Input Data
Data on building energy consumption can be divided into weather data, building parameters, data on equipment and technologies, and occupancy data [27,28].
Various methods of data collection are described in the literature. In ref. [6], analytical tools and techniques were divided into characterization techniques (short-term energy monitoring with high-res data, intrusive testing, expert knowledge/templates/database, detailed audit), advanced graphical methods (statistical displays, signature analysis methods, 3D graphical comparison techniques), model simplification techniques (data disaggregation, parameter reduction, model parameter estimation, base-case modeling), and procedural extensions (evidence, sensitivity analysis, uncertainty quantification). In ref. [29], building energy audits are divided into three levels: level 1—walkthrough (visual inspection of a facility and energy-using systems, as well as assessment of energy consumption data in relation to branch averages and benchmarks); level 2—standard audit (more detailed analysis and review of systems and equipment, possible on-site measurements, economic analysis); and level 3—investment (more detailed review of energy consumption by function, comprehensive assessment of energy consumption patterns, simulations of annual energy consumption taking into account weather and system variables).
As the above shows, measurements of both energy consumption and other parameters are used to obtain the best possible description of the analyzed building, and they can consequently contribute to reducing the performance gap. Certain data are relatively simple to acquire (for example, weather data), while other require a detailed forensic investigation of the building at a level typically unavailable (for example, construction flaws). Sometimes, data collection can require a complex sensor network, and this can lead to confidentiality issues (occupant behavior); consequently, in most cases, insufficient data is accessible [5].
According to a review [7], input data typically originates from yearly measurements, and certain case studies have allowed up to five years for data collection. In contrast, data gathered over periods shorter than one month (days or weeks) is more detailed and contained more variables, likely because long-term monitoring efforts commonly utilize sensors and data logging platforms already installed in the building, while short-term campaigns can utilize a larger quantity of sensors, leading to more intensive data collection.
1.5. Research Gap
The need to eliminate the performance gap has gained additional significance in recent years. The authors’ experience shows that building users in Poland do not place much importance on the information contained in the buildings’ energy performance certificates, as they are not considered to be a valid forecast of energy consumption. Instead, the requirement to prepare certificates is treated as a bureaucratic obligation. Increasing their utility may change this approach. According to the new directive [14] “The energy performance of a building shall be determined on the basis of calculated or metered energy use and shall reflect typical energy use for space heating, space cooling, domestic hot water, ventilation, built-in lighting and other technical building systems. (…) Where metered energy use is the basis for calculating the energy performance of buildings, the calculation methodology should be able to identify the influence of the behavior of occupants and the local climate, which should not be reflected in the calculation result.”
Building energy performance should no longer refer to actual energy consumption, but to measured energy, specifying the impact of user behavior and local climate on this result. This suggests the need to use more advanced methods, such as systems for measuring not only energy but also other building performance parameters, and the demand should refer to typical building use. However, in Poland, in addition to the calculation method for determining energy performance, a consumption method based on actual energy or fuel consumption averaged over a period of three years is currently used [25]. It does not take into account important information about the parameters in the building or the climate data. Therefore, since only a small percentage of Polish buildings have such advanced measurement systems, and the development of a “new consumption-based method” would be time-consuming and expensive, one of the recent draft revisions to the methodology for determining energy performance in Poland proposed abandoning the method based on actual energy consumption [30]. However, in the next step of the draft revision, the consumption calculation method has been returned to its old form.
It is impossible to meet the requirements of the new directive [14] without appropriate measurement. However, it is equally important to show whether the measurement results allow for the representative determination of the energy performance of a building. Therefore, research is needed to develop the necessary “new consumption method” using easily accessible measurement data, but with a broader scope than just annual energy or fuel consumption measurements. In this context, it is important to compare the standard methods used to calculate the energy performance of the building (standard conditions, references) with the energy performance obtained using various measurement data.
The literature also discusses the topic of Soft Landings [5], which involves maintaining the participation of designers in the operation of buildings after construction through extended after-sales care, lasting up to three years. This process could also be supported and gain applicability thanks to a methodology for estimating energy consumption in a building that takes into account easily accessible measurement data.
In ref. [5], three proposed forms of future performance gap research are indicated. One of them is a case study of a single building, where the ratio between forecast and measurement is 1:1. Such an in-depth case study, including model calibration, could allow for the examination and quantitative determination of the factors causing the differences in the analyzed case.
1.6. Novelty and Aim of the Paper
An in-depth case study was conducted for a single-family building (as proposed for future research in [5]), taking a 1:1 relationship between prediction and measurement, to identify the factors causing the performance gap.
We formulated the hypothesis that it is possible to achieve high convergence between actual energy consumption and the calculated energy demand for heating a building after taking into account the physical calculation model (using the monthly method, in accordance with the Polish methodology [25] based on European standards PN-EN ISO 13790 [31] and PN-EN 12831 [32]) and relevant input data obtained by relatively simple measurement methods. In this work, the core focus is on the impact of the input data used for calculations. Based on comprehensive measurements of various parameters, all the input data areas specified in the review [7] were covered.
Data acquisition methods that are useful in single-family inhabited buildings were verified and used. The use of hourly recorded data for many input data is particularly valuable as it eliminates the need for expert estimation (sensitive to inaccuracy) of these parameters.
This work is also valuable because it allows for the direct validation of the calculation methods, and for the explanation of the observed discrepancies in relation to a specific case. Crucially, it also shows the impact of different input data on the convergence of the calculation results with the actual measured energy needed for heating.
This study is a response to the problems associated with the use of a consumption-related method based on metered energy, in addition to the problems linked to determining the impact of user behavior and local climate on the energy performance rating of buildings. The aim is to draw conclusions aimed at improving regulations on the energy performance of buildings, in particular Polish regulations. Modifying the regulations would help to increase the usefulness and significance of building energy performance certificates.
The article provides knowledge that brings the development of the necessary “new consumption method” closer to that of physical models, in combination with available high-quality input data.
2. Analyzed Building
The object of the research is a two-story single-family building without a basement located in Poland, near Wroclaw. The building was constructed using traditional brick technology, with double-layer walls made of Porotherm hollow bricks and polystyrene insulation. It has been described in detail in [2]. Floor plans with marked zones, heat transfer coefficients, and other characteristic values are shown in Figure 1.

Figure 1.
Schematic plan of the analyzed building (based on [4]).
There is a family of four in the building (two adults and two children). In the building, there are the following installations: heating, ventilation (air handling unit with heat recovery), cooling, and hot water systems (Figure 2). A water/brine heat pump is the heat source.

Figure 2.
A scheme of installations in the analyzed building (based on [4]).
3. Materials and Methods
3.1. Computational Model
The energy needed for heating was modeled using two methods described in the PN-EN ISO 13790 standard [31]:
- The monthly method of the quasi-steady state, (subscript “m”);
- The dynamic simple hourly method (subscript “h”).
In Poland, energy calculations are based on the monthly method, which is based on the PN-EN ISO 13790 standard [31]. The planned revision of the regulations will also introduce the hourly method [30]. In this study, these two calculation methods were applied to ensure that the measured measurement period analyzed was not too short, especially for the monthly method. The advantages of the hourly method over the monthly method were also exploited, allowing for the introduction of hourly schedules. The hourly method also allows us to enter hourly schedules. The following additional assumptions contained in national regulations [25] have been introduced to these methods. It was assumed that the thermal zones are thermally coupled. The design heat transmission coefficients (U, W/(m2K) were determined according to PN-EN ISO 6946 [33] and/or ISO 9869-1 [34]. Linear heat transfer coefficients of thermal bridges (Ψ, W/(m K)) were assumed due to PN-EN 14683 [35] or calculated according to PN-EN ISO 10211 [36]. Heat losses through ground heating with floor heating were calculated according to PN-EN ISO 13370 [37]. The transmission and ventilation heat loss coefficient (HT, HV, W/K) was determined according to PN-EN ISO 13789 [38].
The calculations were performed with standard input data (variant A) and also in the next seven variants (from variant B to H) created after replacing particular standard values with actual values based on measurements. Variants were created by replacing the next standard input value with a value determined on the basis of measurements. Thus, the following variants were analyzed:
- A—variant with standard input data assumed on the basis of Polish regulations;
- B—variant A, with actual indoor air temperatures;
- C—variant B, with actual outdoor air temperatures;
- D—variant C, with actual solar radiation Gsol;
- E—variant D, with actual air flow rates Vsu, Vex;
- F—variant E, with actual effective heat recovery rate ηHR;
- G—variant F, with actual building air tightness test n50;
- H—variant G, with actual internal heat gains qint.
All calculations were performed using MS Excel sheets prepared by the authors in accordance with the above-mentioned methods. No special software for energy calculations in buildings was used in order to avoid discrepancies with the Polish methodology.
3.2. Method of Determining Input Data for Models
The input data for each variant and calculation method (monthly and hourly) are as follows (for two calculation zones) (Figure 1): I—the residential zone and II—the garage zone. The measurement values were obtained in the period from 22 November 2017 to 20 December 2017. This study period was selected due to the fact that it encompassed a time period characterized by continuous use of the building and the climatic conditions appropriate for the cold season in the study location.
The elements of the measurement system and the method for determining the input data are described below.
3.2.1. Indoor Air Temperatures
High resolution data is one of the analytical tools and techniques described in [6]. Indoor air temperatures were measured in three chosen locations, presented in Figure 1, specifically in the spaces of two zones: the residential zone, encompassing the hall areas on the ground floor and first floor, and the garage zone. The temperature was measured and recorded by two temperature loggers of type LB-516AT (LAB-EL Elektronika Laboratoryjna sp. z o.o., Reguły, Poland) and one thermohigrometer logger of type LB-516A (LAB-EL Elektronika Laboratoryjna sp. z o.o., Reguły, Poland). The sensors were located at a height of approximately 1.6 m from the floor. The temperature was measured with a 10 min interval and averaged to hourly values (method h) and monthly values (method m). For variants Am and Ah, the average indoor temperature values were 20.4 °C [39] for zone I and 8.1 °C [39] for zone II. For variants Bm to Hm, the monthly average values were based on the following measurements: 21.2 °C for zone I and 12.1 °C for zone II. For variants Bh to Hh, hourly values from measurements shown in Figure 3 were taken.

Figure 3.
Average hourly indoor air temperatures based on measurements taken in the period from 22 November 2017 to 20 December 2017.
3.2.2. External Parameters
High resolution data is one of the analytical tools and techniques described in [6]. The external temperature and the global solar horizontal radiation were measured by the WatchDog 2000 (Spectrum Technologies, Inc., Aurora, IL, USA) weather station mounted on the roof of the building. Temperature and radiation were measured at 10 min intervals. The solar radiation was determined on the basis of the measurement of the global solar radiation falling on the horizontal surface. The results obtained were converted into the radiation falling on the window surface and the direction of the cardinal points. The Perez 1999 model implemented in TRNSYS 17 software was used [40]. The average external temperature value was −0.4 °C [41], and the measured value was 3.0 °C. The values of sum of global horizontal solar radiation assumed for calculations were 23.1 kWh/m2 based on the standard values [41] and 14.1 kWh/m2 based on the measured values.
For variants Am and Bm, the average monthly outdoor temperature value was −0.4 °C [41], and for variants Ah and Bh, standard hourly values from [41] were taken. For variants Cm to Hm, the monthly averaged value based on measurements was 3.0° C, and for variants Ch to Hh, the average hourly values based on the measurements shown in Figure 4 were adopted.

Figure 4.
Average hourly outdoor air temperature and solar radiation based on measurements taken in the period from 22 November 2017 to 20 December 2017.
For variants Am, Ah, Bm, Bh, Cm, and Ch, standard values of solar radiation [41] were taken. For variants Dm to Hm, the monthly value based on measurements was adopted, and for variants Dh to Hh, hourly values from the measurements shown in Figure 4 were adopted.
3.2.3. Ventilation Air Flow Rates and Heat Recovery Efficiency
High-resolution data derived from [6] were used as part of the input data acquisition technique. The ventilation air flow rates and the heat recovery efficiency were obtained as a result of recording (with the KD7 (LUMEL S.A., Zielona Góra, Poland), data logger) the air flow measurements of the supply and exhaust air and the temperatures of the supply, return, exhaust, and outdoor air (at intervals of 1 min). Ventilation air flow rates change over time. This may result from changes in wind speed and direction, thermal buoyancy, and air filter clogging. In addition, the failure in the air handling unit was resolved (partial opening of the bypass damper of the heat exchanger for about 500 h), which caused a significant change in ventilation air flow rates and heat recovery efficiency. The measured air flows and heat recovery efficiency values based on the measurements are presented in Figure 5 and Figure 6, respectively.
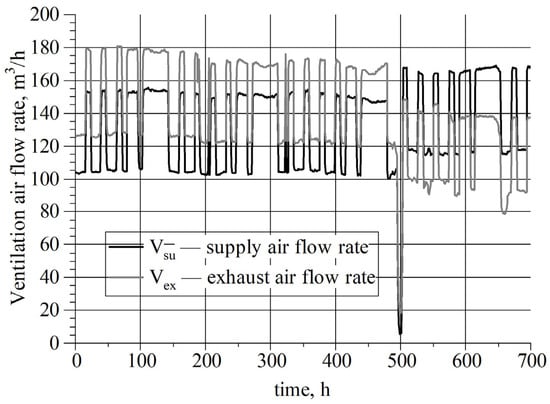
Figure 5.
Ventilation air flows in the air handling unit in the period from 22 November 2017 to 20 December 2017.

Figure 6.
Heat recovery efficiency in the air handling unit in the period from 22 November 2017 to 20 December 2017.
For variants Am, Ah, Bm, Bh, Cm, Ch, Dm, and Dh constant standard ventilation air flows were adopted, determined on the basis of the technical documentation of the building, in accordance with Polish regulations [39] following the PN-B-03430 standard [42]. The standard supply and exhaust air flow rates are Vsu,Iave = 195 m3/h and Vex,Iave = 195 m3/h, respectively, for zone I and Vsu,IIave = 0 m3/h and Vex,IIave = 20 m3/h, respectively, for zone II. Additionally, in the standard method, flows are reduced to 75% of their value if it is possible to reduce the flows during operation.
For variants Em to Hm, the average monthly values based on the measurements were adopted, Vsu,Iave = 131.3 m3/h and Vex,Iave = 130.1 m3/h, meaning we used flows that take into account their regulation during operation. For variants Eh to Hh, hourly values from measurements presented in Figure 5 were taken. Operating flows take into account their reduction at night by users.
The temperature efficiency of heat recovery in the air handling unit for variants Am, Ah, Bm, Bh, Cm, Ch, Dm, Dh, Em, and Eh was assumed to be 0.84 based on its technical documentation.
For variants Fm to Hm, an average monthly value of heat recovery temperature efficiency was assumed, nHR = 0.647. For variants Fh to Hh, the average hourly values shown in Figure 6, based on the measurements, were taken. Those values were calculated on the basis of measured air flows and air temperatures as follows:
where
- VSUP—outdoor air flow, m3/h;
- VEXT—extract air flow, m3/h;
- tODA—outdoor air temperature, °C;
- tEXT—extract air temperature, °C;
- tSUP—supply air temperature, °C.
3.2.4. Air Tightness of the Building Envelope
The technique used to obtain input data was intrusive testing [6]. The air permeability of the buildings was tested by a Retrotec blower door of type EU5101 (Retrotec, Everson, WA, USA). The building was prepared for the test according to [43,44]. The input data (air change rate and an indoor–outdoor pressure difference of 50 Pa) assumed for the calculations were as follows: standard value—n50 = 4.0 h−1 [25] and measured value—n50 = 3.55 h−1.
3.2.5. Internal Heat Gains
The actual internal heat gains for zone I were determined based on measurements and the following method:
- The electric energy consumption of the heat pump and the heating installation pump (logged in 10 min intervals) was measured via the high-resolution data technique;
- The electric energy consumption of the fans in the air handling unit was determined based on an instant measurement (made by a BM357s wattmeter (Brymen Technology Corporation, Taiwan)) and the application of the intrusive testing technique;
- The electric energy consumption measured by an electric energy meter for the whole house (logged in 10 min intervals) was measured via the high-resolution data technique;
- The sum of the above-mentioned results was subtracted from the electric energy consumption measured by an electric energy meter for the whole house;
- The obtained difference was reduced by 30% [31] (fE = 0.7 was assumed; see Equation (2)) in order to take into account that not all electric energy is transformed into heat within the air-conditioned zone of the building (e.g., heater of the washing machine, dishwasher), based on the detailed audit and expert knowledge technique;
- The number of occupants was noted throughout the analysis period based on interviews, a high-resolution data technique;
- Metabolic heat gains from people were determined based on the above schedule of occupancy and assumed activity, relying on the expert knowledge technique;
- The above values were summed for every hour of the analyzed period:
- nap—number of adult occupants, person;
- nch—number of children occupants, person;
- qap—the average heat gain per adult person, W/person (assumed to be 77.8 W/person [45]);
- qch—the average heat gain per child, W/person (assumed 34.5 W/person [45]);
- QE—measured electricity use per reference floor area, W;
- fE—the share of total electrical energy consumption in the building, i.e., the portion of electrical energy used that is converted into heat within the air-conditioned space.
The average internal heat gain value assumed for calculations was 6.8 W/m2 [25] for zones I and II, and average values based on measurements were qint,I = 1.92 W/m2 for zone I and qint,II = 2.39 W/m2 for zone II. Hourly changes in internal heat gains are presented in Figure 7.

Figure 7.
Hourly changes in internal heat gains in the period from 22 November 2017 to 20 December 2017 in zone I.
During the measurement period, zone II was used very rarely, so only the gains from the technology were taken into account (60 W of standby losses from the heat storage tank based its technical data and 2.6 W/m [25] of unit losses from an installation with a pipe length of 27.5 m).
3.2.6. Analyzed Variants
Table 1 summarizes information on the input values, specifically their sources and methods of determination, for both models and each individual variant.

Table 1.
Summary of input values.
3.3. Actual Energy Needed for Heating
The actual energy needed for heating was estimated based on the energy production of the heat pump, calculated from the measured flow and the measured temperatures of heating water supply and return in the measurement period from 22 November 2017 to 20 December 2017 (as a technique for obtaining high-resolution input data [6]). The following equation was used:
where
- Vfm—measured volumetric flow of the heating water, dm3/s;
- w—density of the heating water at the flow meter, kg/dm3;
- cw—specific heat of the heating water, kJ/(kg·K);
- tsw—measured temperature of the supply heating water, °C;
- trw—measured temperature of the return heating water, °C;
- H,d—distribution heat loss (calculated based on length and diameter of the pipes—unit losses from installations with pipe length 25 m: 2.6 W/m [25]), kWh;
- H,s—storage heat loss (calculated based on storage heat loss due to manufacturer data for the buffer tank, 60 W), kWh.
The following information about heat pump operation status was logged in 1 min intervals by the heat pump controller on a portable flash drive/memory stick:
- Supply and return temperatures of heating water measured using own heat pump temperature sensors;
- The water pump, the brine pump, the heating installation pump, the compressor, and the 3-way hot water valve operation status.
The flow of heating water (between the heat pump and the thermal storage vessel) during the operation of the water pump in the building heating mode was measured using a Portaflow-C (Fuji Electric Co., Tokyo, Japan) portable ultrasonic water meter mounted on the pipe. In laboratory conditions, indications of this flowmeter were compared and corrected according to the indications of the electromagnetic flowmeter, PROMAG 10H8 (Endress+Hauser AG, Reinach BL, Switzerland). The measured value was approximately constant while the water pump operated in the building’s heating mode.
Based on the above information, the actual energy supplied by the heat pump (energy source) to the zones was estimated. During the analyzed period, it was equal to QH,nd = 2650 kWh. This value was treated as the actual energy needed for heating. Information related to the hourly changes in actual energy needed for heating is presented in Figure 8.

Figure 8.
Variations in actual energy needed for heating from 22 November 2017 to 20 December 2017.
3.4. Characteristics of Measuring Equipment
In Table 2, the characteristics of the main measuring equipment used in the research are specified.
Table 2.
Characteristics of main measuring equipment used.
3.5. Calibration Performance Assessment
The Mean Bias Error (MBE) was used to assess the calibration of the model. MBE is a good indicator of the overall bias in a model [6]. It was calculated as follows [6]:
where mi and si are data points of the actual measured and calculated energy for each time step I, and Np is the number of analyzed time steps (monthly method—1 time step; hourly method—696 h.
4. Results and Discussion
Figure 9 and Table 3 show the impact of the input data and the calculation method on the results of the calculations of the energy needed for heating in the period analyzed. In variants Am (monthly method) and Ah (hourly method), the energy needed for heating was fully determined according to [1] and Polish regulations, i.e., with the standard input data. For the subsequent variants, the standard input data were replaced with the data based on measurements (as described in Section 3).

Figure 9.
Impact of input data on the energy needed for heating.
Table 3.
Calculated energy need for heating (CENH), difference between measured actual energy for heating and calculated energy need for heating (ACENH), and Mean Bias Error (MBE) for each variant and calculation method.
A comparison of the calculation results for the monthly method and the simple hourly method shows that they provide similar results. For variants Hm and Hh, the difference between the methods is 4.0% in relation to 2650 kWh—the actual energy needed for heating, derived from measurements. The obtained result is in line with those presented in the literature [46]. Nevertheless, slightly better agreement between the hourly method and dynamic simulations is noticeable in the literature [46,47]. The compatibility of the methods was easier to assess thanks to the analyzed period, which was neither the end nor the beginning of the heating season [31,47]. Moreover, the analyzed building has a semi-heavy building structure, which should also increase the agreement of results [46].
Separate observations concern the differences between the calculated and actual measured energy needed for heating. The differences vary depending on the variant, i.e., which calculation input data are taken from measurements and which are standard values. The lowest difference is obtained for the Hm and Hh variants (for which most of the input data was derived from the measurements), which confirms the hypothesis stated in Section 1.6. Figure 9 graphically shows how the calculation results for each of the two methods (monthly and hourly) and for each of the variants differ from the actual measured energy. In Table 3, the values of MBE for each variant and calculation method are presented. The monthly MBE acceptance criteria for the building energy performance simulations summarized in [6] are 5% or 20% depending on the literature source, while the hourly criteria are 5% or 10% depending on source. The requirement of 5% for the monthly method is only met for variant Hm (for which most of the input data stem from measurements), while the requirement of 20% is also met for variant Am (all standard input data). For the hourly method, the requirements of 5% and 10% are met only for variant Hh (for which most of the input data stem from measurements).
For the period and building considered, the greatest change is caused by the introduction of the actual internal heat gains (variants Hm and Hh), and the second largest change is caused by the introduction of the actual external temperatures (variants Cm and Ch). The greatest impact of changes in internal heat gains is due to significantly different specific internal heat gains qint. According to national regulations [25] for single-family houses, qint = 6.8 W/m2, much higher than the value of the analyzed building (in the residential zone, qint,I = 1.92 W/m2). Previous regulations [23] recommend values in the range of 2.5–3.5 W/m2 (excluding heat gains from heating and domestic hot water installations). Poland’s new planned regulations retain the value of qint = 6.8 W/m2 [30]. However, the typical value calculated according to Annex G of PN-EN ISO 13790 [31] is 2.1 W/m2. Heat load profiles with internal heat gains vary greatly and are included in standards, and the adoption of a specific standard for energy calculations significantly changes the estimated energy needs of a building. It is important to select a source of heat gain profile that matches the characteristics of the building [48]. The approach adopted in Poland, based on applying a single internal heat gain value for single-family buildings without analyzing the structure of internal heat gain sources such as occupancy, equipment, and lighting, cannot reflect the different equipment and uses of single-family buildings. Furthermore, the difference between the internal heat gain load for multi-family buildings (qint = 6.8 W/m2) in the context of the comparison presented in the study [47] is very small. Not even one separate value was identified for the built-in garage zone, while the opposite was true for the staircase of a multi-family residential building (qint = 1.0 W/m2).
Taking into account both the measured ventilation air flows and the result n50 of the air tightness test does not significantly affect the calculation result of the energy need for heating. This is due to the small difference between the standard values and those obtained from the measurements.
The change after introducing the actual indoor air temperature (variants Bm and Bh) is relatively small. This is due to the small difference between the standard temperature value of 20.4 °C and the measured value of 21.2 °C.
Similarly, considering the actual efficiency of heat recovery does not significantly affect the result derived from calculating the energy needed for heating. This is caused by a small share of mechanical ventilation compared to heat loss caused by infiltration and transmission.
It should also be noted that entering only part of the actual data may give a result that is further from the actual one, compared to a result based only on standard input data.
Some of the data obtained from the building measurements is publicly available. Currently, climate data is widely accessible. For example, based on the PVGIS data provided by the EU [49], it is possible to determine the outdoor air temperature and the intensity of solar radiation. For the location analyzed, the following values were obtained from [49]: average external temperature of 2.8 °C, compared to a measured value of 3.0 °C, and sum of global horizontal solar radiation of 19.1 kWh/m2 [49], compared to a measured value of 14.1 kWh/m2. Similarly, other ready-to-use measurement data can be found; an example of such ready-to-use measurement data is the heat pump operating parameters saved to flash memory using its internal software, used in this study. The use of actual input data for building energy assessment should be more widespread.
4.1. Sensitivity Results for Internal Heat Gains
Changing the value of the fE coefficient in Equation (2) from the assumed 0.7 to 0.5 and 0.9 resulted in changes in internal heat gains (determined based on Equation (2)), going from 1.92 W/m2 to 1.58 W/m2 and 2.25 W/m2, respectively. Moreover, this changed the result of variant H calculations, carried out following the monthly method, from 2762 kWh to 2821 kWh (−2.2%) and 2702 kWh (+2.2%), respectively, and the for simple hourly method, the change was from 2653 kWh to 2710 kWh (−2.2%) and 2595 kWh (+2.2%), respectively.
4.2. Validation
In order to verify the adopted procedure, additional calculations were performed in accordance with the methodology described in Section 3 for the period from 1 February 2018 to 1 March 2018. This is the second period characterized by continuous use of the building for which measurements analogous to those presented in Section 3 for the period from 22 November 2017 to 20 December 2017 were available. The actual measured energy need for heating obtained on this basis is 3271 kWh, and the calculated energy need for heating for variant H is 3079 kWh. This gives a value of MBE = 5.9%. Table 4 presents calculation results for particular variants and differences between them and measured actual energy for the period from 1 February 2018 to 1 March 2018. For this period, both for the monthly and hourly methods, the values of MBE are higher than in the period ranging from 22 November 2017 to 20 December 2017. The acceptance criteria depending on the literature source are 5% or 20% for the monthly method and 5% or 10% for the hourly method [6]. The requirement of 5% for the monthly method is not met for any variant, while the requirement of 20% is met only for variant Hm (for which most of the input data stem from measurements). Similarly, for the hourly method, the requirement of 5% is not meet in any variant, while the requirement of 10% is met only for variant Hh (for which most of the input data stem from measurements).
Table 4.
Calculated energy need for heating (CENH), difference between measured actual energy for heating and calculated energy need for heating (ACENH), and Mean Bias Error (MBE) for each variant and calculation method for the period ranging from 1 February 2018 to 1 March 2018.
5. Policy Implications
The results of this study show how important input data are for building energy calculations.
Changes in regulations should aim to increase the usefulness and significance of energy performance certificates in Poland. Certificates should provide useful and reliable information to their recipients. The public expects information on actual energy consumption and the costs it generates. The current system of energy performance certificates in Poland allows for a choice between a method based on the standard use of a building (calculation method) and a method based on the actual amount of energy consumed (consumption method). Despite providing data on metered energy consumption averaged over the last 3 years, as is the case in current regulations, ref. [25] does not guarantee the usefulness of this information. The reason for this is that there is no need to compile the input data values for a building whose energy consumption has been reported. For example, using the consumption method, the characteristics of an uninhabited building will differ from that of an inhabited one. Once the building is inhabited, the characteristics will change significantly, and the buyer of the property will not be aware the information derived from the currently valid certificates. Therefore, it is proposed that certificates prepared using the calculation method should also contain information on measured energy consumption, as well as basic information on the actual input data values. In the case of certificates prepared using the consumption method, at least full significant input data should be provided. This data can be divided in three groups: 1. known, 2. easily available, 3. requiring the use of additional measurement and/or data acquisition systems. The first group can include data such as number of occupants, building schedule usage, mechanical ventilation schedule usage, mechanical ventilation air rate, type of heat recovery system in ventilation installation, shielding from wind and solar radiation, the presence and type of movable sunshades, and the result of the building tightness test n50. The second group can include average outdoor temperature and the sum of total solar radiation, taken from local open-access meteorological data. In the third group, there can be, for example, average indoor temperature, mechanical ventilation air rate, the result of the building tightness test n50, electric energy consumption for lightning and power supply sockets, values and method determination of internal heat gains.
6. Conclusions
The importance of input data for building energy calculations has been demonstrated. It has been confirmed that, in order to achieve agreement between the calculation results and the actual energy need, it is necessary to introduce actual input data into the model. In the analyzed building, the greatest change in the calculation results is caused by replacing the gains in internal heat with their actual values, and the second largest change is caused by the replacement of the external temperature. The replacement of the other standard input data with their actual values caused a smaller change in the calculation results of the energy needed for heating; this was mainly due to the close values of the standard and actual input data. For other buildings, the impact of replacing particular standard data with actual ones may be different that in the analyzed case. Also taking into account the imperfections of the model, as well as the uncertainty of determining the actual input data, one should always be very careful when estimating the energy needed for heating. It was noticed that entering only part of the actual data, rather than a result based only on the standard input data, may give a result that is further from the actual one.
Further work should focus on considering different measurement periods, dynamic simulations, and general conclusions related to the influence of particular actual input data on the energy needed for heating calculation, as well as outlining simple methods for obtaining measurement data and identifying possible simplifications of the actual input data used for calculations.
The authors would like to thank Piotr Piotrowski for providing some of the measurement results.
Author Contributions
Conceptualization, P.S. and P.K.; methodology, P.S. and P.K.; software, P.K.; formal analysis, P.S. and P.K.; investigation, P.S. and P.K.; data curation, P.S. and P.K.; writing—original draft preparation, P.S. and P.K.; writing—review and editing, P.S. and P.K.; visualization, P.K. All authors have read and agreed to the published version of the manuscript.
Funding
This research received no external funding.
Data Availability Statement
The datasets presented in this article are not available because of privacy-related reasons.
Conflicts of Interest
The authors declare no conflicts of interest.
References
- European Commision. The European Green Deal; Routledge: Brussels, Belgium, 2019. [Google Scholar] [CrossRef]
- United Nations. Transforming Our World: The 2030 Agenda for Sustainable Development A/RES/70/1; United Nations: New York, NY, USA, 2015. [Google Scholar] [CrossRef]
- Szulgowska-Zgrzywa, M.; Stefanowicz, E.; Chmielewska, A.; Piechurski, K. Detailed Analysis of the Causes of the Energy Performance Gap Using the Example of Apartments in Historical Buildings in Wroclaw (Poland). Energies 2023, 16, 1814. [Google Scholar] [CrossRef]
- Kowalski, P.; Szałański, P. Computational and the real energy performance of a single-family residential building in Poland—An attempt to compare: A case study. In E3S Web of Conferences; EDP Sciences: Les Ulis, France, 2017; Volume 17, p. 00045. [Google Scholar] [CrossRef]
- De Wilde, P. The gap between predicted and measured energy performance of buildings: A framework for investigation. Autom. Constr. 2014, 41, 40–49. [Google Scholar] [CrossRef]
- Coakley, D.; Raftery, P.; Keane, M. A review of methods to match building energy simulation models to measured data. Renew. Sustain. Energy Rev. 2014, 37, 123–141. [Google Scholar] [CrossRef]
- Vera-Piazzini, O.; Scarpa, M. Building energy model calibration: A review of the state of the art in approaches, methods, and tools. J. Build. Eng. 2024, 86, 108287. [Google Scholar] [CrossRef]
- Kowalski, P.; Szałański, P. Airtightness test of single-family building and calculation result of the energy need for heating in Polish conditions. In E3S Web of Conferences; EDP Sciences: Les Ulis, France, 2018; Volume 44, p. 00078. [Google Scholar] [CrossRef]
- Kowalski, P.; Szałański, P.; Cepiński, W. Waste heat recovery by air-to-water heat pump from exhausted ventilating air for heating of multi-family residential buildings. Energies 2021, 14, 7985. [Google Scholar] [CrossRef]
- Cepinski, W.; Kowalski, P.; Szałański, P. Waste Heat Recovery by Electric Heat Pump from Exhausted Ventilating Air for Domestic Hot Water in Multi-Family Residential Buildings. Rocz. Ochr. Srodowiska 2020, 22, 940–958. [Google Scholar]
- Cepiński, W.; Szałański, P. Increasing the efficiency of split type air conditioners/heat pumps by using ventilating exhaust air. In E3S Web of Conferences; EDP Sciences: Les Ulis, France, 2019; Volume 100. [Google Scholar] [CrossRef]
- Amanowicz, Ł.; Ratajczak, K.; Dudkiewicz, E. Recent Advancements in Ventilation Systems Used to Decrease Energy Consumption in Buildings—Literature Review. Energies 2023, 16, 1853. [Google Scholar] [CrossRef]
- Directive 2002/91/EC of the European Parliament and of the Council of 16 December 2002 on the Energy Performance of Buildings. Available online: https://eur-lex.europa.eu/eli/dir/2002/91/oj/eng (accessed on 1 September 2025).
- Directive 2024/1275 of the European Parliament and of the Council of 24 April 2024 on the Energy Performance of Buildings. Available online: https://eur-lex.europa.eu/eli/dir/2024/1275/oj/eng (accessed on 1 September 2025).
- Statistics Poland. Energy Consumption in Households in 2021; Statistics Poland: Warszawa, Poland, 2024. (In Polish)
- Norford, L.K.; Socolow, R.H.; Hsieh, E.S.; Spadaro, G.V. Two-to-one discrepancy between measured and predicted performance of a ‘low-energy’ office building: Insights from a reconciliation based on the DOE-2 model. Energy Build. 1994, 21, 121–131. [Google Scholar] [CrossRef]
- Bordass, B.; Cohen, R.; Standeven, M.; Leaman, A. Assessing building performance in use 3: Energy performance of the Probe buildings. Build. Res. Inf. 2001, 29, 114–128. [Google Scholar] [CrossRef]
- Zero Carbon Hub. A Review of the Modelling Tools and Assumptions: Topic 4, Closing the Gap Between Designed and Built Performance; Zero Carbon Hub: London, UK, 2010. [Google Scholar]
- Stoppel, C.M.; Leite, F. Evaluating building energy model performance of LEED buildings: Identifying potential sources of error through aggregate analysis. Energy Build. 2013, 65, 185–196. [Google Scholar] [CrossRef]
- Ratajczak, K.; Bandurski, K.; Amanowicz, Ł.; Brzeziński, J. Rozbieżności między obliczeniowym i zmierzonym zużyciem energii do ogrzewania i przygotowania ciepłej wody użytkowej na przykładzie budynków jednorodzinnych. Ciep. Ogrzew. Went. 2022, 53, 3–9. [Google Scholar] [CrossRef]
- Menezes, A.C.; Cripps, A.; Bouchlaghem, D.; Buswell, R. Predicted vs. actual energy performance of non-domestic buildings: Using post-occupancy evaluation data to reduce the performance gap. Appl. Energy 2012, 97, 355–364. [Google Scholar] [CrossRef]
- Maldonado, E.; Wouters, P.; Panek, A. Concerted Action: Supporting Transposition and Implementation of the Directive 2002/91/EC CA EPBD (2005–2007), Intelligent Energy Europe, Brussels. 2008. Available online: https://immobilierdurable.eu/images/2128_uploads/CA_Book_Implementing_the_EPBD_Featuring_Country_Reports_____.pdf (accessed on 1 September 2025).
- Regulation of the Minister of Infrastructure of November 6, 2008 on the Methodology for Calculating the Energy Performance of Building and Dwelling or Part of Building, and Method of Preparing and Templates for Energy Performance Certificates. Available online: https://isap.sejm.gov.pl/isap.nsf/DocDetails.xsp?id=WDU20082011240 (accessed on 1 September 2025).
- The Act of August 27, 2009, on Amending the Construction Law Act and the Real Estate Management Act. Available online: https://isap.sejm.gov.pl/isap.nsf/DocDetails.xsp?id=WDU20091611279 (accessed on 1 September 2025).
- Regulation of the Minister of Infrastructure and Development of the 27th of February 2015 on the Methodology for Determining the Energy Performance of a Building or Part of a Building and Energy Performance Certificates. (In Polish). Available online: https://isap.sejm.gov.pl/isap.nsf/DocDetails.xsp?id=WDU20150000376 (accessed on 1 September 2025).
- De Wit, S.; Augenbroe, G. Analysis of uncertainty in building design evaluations and its implications. Energy Build. 2002, 34, 951–958. [Google Scholar] [CrossRef]
- Zhao, H.X.; Magoulès, F. A review on the prediction of building energy consumption. Renew. Sustain. Energy Rev. 2012, 16, 3586–3592. [Google Scholar] [CrossRef]
- Sanhudo, L.; Ramos, N.M.M.; Poças Martins, J.; Almeida, R.M.S.F.; Barreira, E.; Simões, M.L.; Cardoso, V. Building information modeling for energy retrofitting—A review. Renew. Sustain. Energy Rev. 2018, 89, 249–260. [Google Scholar] [CrossRef]
- ASHRAE. Procedures for Commercial Building Energy Audits, 2nd ed.; American Society of Heating, Refrigerating and Air-Conditioning Engineers: Atlanta, GA, USA, 2011. [Google Scholar]
- Draft (17 September 2025) Regulation of the Minister of Development and Technology on the Methodology for Determining the Energy Performance of a Building or Part of a Building and Energy Performance Certificates. (In Polish). Available online: https://legislacja.rcl.gov.pl/projekt/12386852 (accessed on 1 September 2025).
- EN ISO 13790:2008; Energy Performance of Buildings—Calculation of Energy Use for Space Heating and Cooling. International Organization for Standardization: Geneva, Switzerland, 2008.
- PN-EN 12831:2004; Heating Systems in Buildings—Method for Calculation of the Design Heat Load. European Committee for Standardization: Brussels, Belgium, 2004.
- PN-EN ISO 6946:2008; Building Components and Building Elements—Thermal Resistance and Thermal Transmittance—Calculation Method. International Organization for Standardization: Geneva, Switzerland, 2008. (In Polish)
- ISO 9869-1:2014; Thermal Insulation—Building Elements—In-Situ Measurement of Thermal Resistance and Thermal Transmittance—Part 1: Heat Flow Meter Method. International Organization for Standardization: Geneva, Switzerland, 2014.
- PN-EN ISO 14683:2007; Thermal Bridges in Building Construction—Linear Thermal Transmittance—Simplified Methods and Default Values. International Organization for Standardization: Geneva, Switzerland, 2007. (In Polish)
- PN EN-ISO 10211; Thermal Bridges in Building Construction—Heat Flows and Surface Temperatures—Detailed Calculations. International Organization for Standardization: Geneva, Switzerland, 2017.
- PN-EN ISO 13370:2007; Thermal Performance of Buildings—Heat Transfer via the Ground—Calculation Methods. International Organization for Standardization: Geneva, Switzerland, 2007. (In Polish)
- PN-EN ISO 13789:2007; Thermal Performance of Buildings—Transmission and Ventilation Heat Transfer Coefficients—Calculation Method. International Organization for Standardization: Geneva, Switzerland, 2007. (In Polish)
- Regulation of Minister of Infrastructure and Economic Development (12 April, 2002) on the Technical Conditions, Which Are to Be Met by Buildings and Their Location. (In Polish). Available online: https://isap.sejm.gov.pl/isap.nsf/DocDetails.xsp?id=WDU20020750690 (accessed on 1 September 2025).
- Klein, S.A.; Beckman, W.A.; Mitchell, J.W.; Duffie, J.A.; Duffie, N.A.; Freeman, T.L.; Mitchell, J.C.; Braun, J.E.; Evans, B.L.; Kummer, J.P.; et al. TRNSYS 17: A Transient System Simulation Program; Solar Energy Laboratory, University of Wisconsin: Madison, WI, USA, 2010. [Google Scholar]
- Minister of Infrastructure and Economic Development. Typical Statistical Climate Data for the Polish Area for Building Energy Performance Purposes. Available online: https://www.miir.gov.pl/strony/zadania/budownictwo/charakterystyka-energetyczna-budynkow/dane-do-obliczen-energetycznych-budynkow-1/ (accessed on 12 January 2019).
- PN-B-03430:1983; Ventilation in Residential, Common Living and Public Buildings—Requirements. Polish Commitee for Standardization: Warszawa, Poland, 1983. (In Polish)
- PN-EN 13829; Thermal Performance of Buildings—Determination of Air Permeability of Buildings—Fan Pressurization Method. European Committee for Standardization: Brussels, Belgium, 2002.
- PN ISO 9972; Determination of Air Permeability of Buildings—Fan Pressurization Method. International Organization for Standardization: Geneva, Switzerland, 1999.
- Ahmed, K.; Kurnitski, J.; Olesen, B. Data for occupancy internal heat gain calculation in main building categories. Data Brief. 2017, 15, 1030–1034. [Google Scholar] [CrossRef]
- Georgios, K.; Joe, C.; Paul, S. Impact of Using Different Models in Practice—A Case Study with the Simplified Method of ISO 13790 Standard and Detailed Modelling Programs. In Proceedings of the Building Simulation 2007: 10th Conference of IBPSA, Beijing, China, 27–30 July 2007. [Google Scholar]
- Kokogiannakis, G.; Strachan, P.; Clarke, J. Comparison of the simplified methods of the ISO 13790 standard and detailed modelling programs in a regulatory context. J. Build Perform. Simul. 2008, 1, 209–219. [Google Scholar] [CrossRef]
- Ferrari, S.; Zagarella, F.; Caputo, P.; Bonomolo, M. Internal heat loads profiles for buildings’ energy modelling: Comparison of different standards. Sustain. Cities Soc. 2023, 89, 104306. [Google Scholar] [CrossRef]
- Huld, T.; Müller, R.; Gambardella, A. A new solar radiation database for estimating PV performance in Europe and Africa. Sol. Energy 2012, 86, 1803–1815. [Google Scholar] [CrossRef]
Disclaimer/Publisher’s Note: The statements, opinions and data contained in all publications are solely those of the individual author(s) and contributor(s) and not of MDPI and/or the editor(s). MDPI and/or the editor(s) disclaim responsibility for any injury to people or property resulting from any ideas, methods, instructions or products referred to in the content. |
© 2025 by the authors. Licensee MDPI, Basel, Switzerland. This article is an open access article distributed under the terms and conditions of the Creative Commons Attribution (CC BY) license (https://creativecommons.org/licenses/by/4.0/).