Abstract
In heating, ventilation, and air conditioning (HVAC) systems, chiller power model prediction is crucial for control and improving energy efficiency. However, in practical engineering scenarios, the chilled water supply temperature, chilled water flow rate, etc., are mostly set manually, and the system operates at a small number of fixed and sparse operating points. This leads to sparse data availability for model prediction, which seriously limits the prediction accuracy of data-driven models (such as fully connected neural networks). To overcome the above problems, this paper introduces a Physics-Informed Neural Network (PINN), and by embedding physical knowledge, performs predictive modeling of the power of the core equipment in the chiller system—the chiller, condenser water pump, and chilled water pump. Based on the real industrial data of a large building in southern China, the qualitative and quantitative verification shows that the model proposed in this paper has significant advantages in prediction accuracy compared with traditional methods.
1. Introduction
From a global perspective, building energy consumption accounts for 30% of the world’s total energy consumption and 60% of electricity consumption [1,2,3,4]. Among building energy consumption, chillers are the most energy-intensive equipment, accounting for approximately 30% of the total building energy consumption [5,6]. Optimizing and controlling the energy consumption of chillers is an important and widely researched issue [7,8,9]. A substantial body of literature has validated the effectiveness of model predictive control technology [10,11,12] in optimizing energy consumption. However, its success is highly dependent on the accuracy of the predictive model [13,14]. Therefore, establishing an accurate power consumption prediction model is fundamental for energy scheduling, energy efficiency evaluation, and the design of intelligent control strategies.
Power consumption prediction for chiller system has attracted extensive research. Yin et al. [15] proposed the support vector regression (SVR) method to predict the electricity consumption of chillers in subway stations. They validated its superiority compared with the backpropagation neural network (BPNN) and cascade correlation neural network (CCNN). Chaerun et al. [16] utilized machine learning and deep learning to predict and forecast the power consumption of water-cooled chillers, implementing both a thermodynamic prediction model and a Multi-Layer Perceptron (MLP) prediction model. Researchers in [17] utilized the random forest (RF) method to measure variables importance and predict the coefficient of performance (COP) of chiller systems. The results of this study provided insights into the selection of input features. Ahmad et al. [18] compared the performance of the widely-used multilayer perceptron (MLP) and RF for predicting the hourly heating ventilation and air conditioning (HVAC) energy consumption of a hotel in Madrid, Spain. The results indicated that MLP performed marginally better than RF for prediction.
However, in real-world engineering scenarios, system control variables such as chilled water supply temperature and chilled water flow distribution are often set based on human experience, resulting in the system operating at a limited number of fixed and sparse operating points [19,20]. This leads to a scarcity of data that can be collected for energy consumption model prediction. Additionally, due to limitations in sensor configuration and equipment precision, missing data and noise interference are prevalent in operational data. These factors constrain the prediction accuracy and generalization capability of the aforementioned traditional methods in industrial settings [21,22].
In recent years, Physics-Informed Neural Networks (PINNs) [23,24,25,26] have emerged as a research hotspot in building energy consumption modeling due to their advantages in enhancing the generalization capabilities of data-driven models. The core concept of PINNs lies in embedding prior physical knowledge into the neural network architecture by constructing loss functions based on physical laws or introducing structural constraints [27,28]. This enables the model to rely not only on data but also leverage physical principles, thereby improving the stability and reliability of predictive models for physical systems. Jia et al. [29] developed a thermal load prediction model for multi-thermal-zone buildings by integrating Graph Attention Networks (GAT) with Gated Recurrent Units (GRU). Gokhale et al. [30] incorporated a heat conduction model into the neural network’s loss function, ensuring that the model’s predictions align more closely with indoor thermodynamic principles. Wang et al. [31] reconstructed a partially connected neural network architecture based on thermodynamic principles, improving prediction accuracy while maintaining the stability of control strategies. Ma et al. [32] introduced a residual modeling approach based on energy consumption decomposition, which demonstrated exceptional predictive performance and robustness even in data-scarce scenarios.
Therefore, to enhance the accuracy of chiller energy consumption prediction under data-sparse conditions, this paper introduces Physics-Informed Neural Networks (PINNs) to develop predictive models for the power consumption of core components in chillers system—namely, the chiller, condenser water pumps, and chilled water pumps. This paper proposes a PINN-based chiller power prediction model that integrates data-driven approaches with physical mechanisms, and designs multiple empirical experiments to evaluate its performance under both interpolation (where training and testing distributions are consistent) and extrapolation (testing at operating points not covered by the training set) scenarios. The experimental results demonstrate that, in cases of data scarcity or uneven distribution, the PINN model exhibits significant advantages in stability and prediction error owing to its physical prior constraints. The main contributions of this paper are as follows:
- Addressing the issue of sparse operational data for chillers under real-world conditions, this paper embeds prior physical knowledge into neural networks by exploring the physical relationships between power consumption, flow rates, and water temperatures, thereby proposing a PINN-based chiller power prediction model.
- Extensive experiments on real industrial data validate the effectiveness of the proposed predictive model, particularly under conditions of data scarcity.
2. Architecture and Working Principle of Chiller System
This section first introduces the system structure and working principle of the HVAC (Heating, Ventilation, and Air Conditioning) chiller system. As shown in Figure 1, the chiller system primarily consists of three main components: the chiller, condenser water pump, and chilled water pump. The condenser pump side is connected to the condenser tower, while the chilled pump side is linked to the terminal buildings. During the operation of the chiller system, the chilled water pump transports water flow from the terminal buildings to the chiller for heat exchange. As the core component of the system, the chiller absorbs heat through the refrigerant, cooling the chilled water to the desired temperature, and then supplies the chilled water to the terminal buildings to meet their cooling demands. Meanwhile, the cooling tower is responsible for cooling the water flow on the condenser side that has absorbed heat. With the assistance of fans, it dissipates the heat into the atmosphere, reduces the water temperature, and returns the cooled water to the chiller, forming a closed water circulation loop.
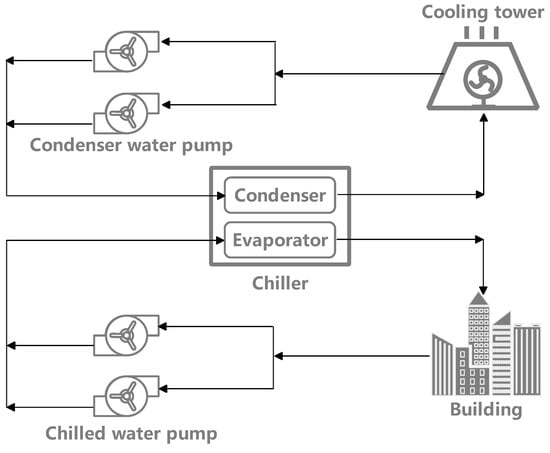
Figure 1.
Schematic diagram of the chiller system architecture.
In terms of temperature control, the system regulates the supply temperature and flow rate of chilled water by adjusting the temperature setpoint, ensuring stable cooling effects for terminal buildings. However, in practical applications, the chiller’s supply water temperature typically operates at a few fixed setpoints (for instance, in some buildings, the supply water temperature remains constant at 5 degrees Celsius year-round). The key challenge in research lies in establishing state-power prediction models for chillers and pumps that can cover the entire operational range based on sparse data samples from these limited operating points. In this paper, we primarily focus on the operational conditions of chillers, chilled water pumps, and condenser water pumps. By utilizing measurable information such as main pipe flow rates, supply water temperatures, and return water temperatures, we develop prediction models for chiller power, total chilled water pump power, and total condenser water pump power to facilitate subsequent optimization and energy-saving control.
3. PINN Prediction Model Architecture
This section proposes a method to construct a neural network prediction model for chillers, chilled water pumps and condenser water pumps based on PINN.
3.1. Chiller Power Prediction Model
The power consumption of the chiller primarily stems from the energy exchange in the compressor, condenser, and evaporator. In this paper, a chiller power prediction model is constructed based on six key operational parameters, including the chilled water supply temperature , chilled water return temperature , and flow rate on the chilled water side, as well as the condenser water supply temperature , condenser water return temperature , and flow rate on the condenser water side. The prediction model is represented as shown in Equation (1), where denotes the neural network model, and represents the parameters of the neural network.
To overcome the sparsity of data samples, we design a loss function based on both data and physical law models to train the above neural network. For the collected sample data, we first define a data-based loss function and use the mean square error (MSE) as the loss function:
where is the loss function based on the data term, N is the number of samples used to train the network, and is the actual measured value of the chiller power.
To overcome data sparsity, we further introduce the first and second laws of thermodynamics to constrain the power prediction model. According to the law of conservation of energy and the law of entropy increase, the chiller should satisfy the following equilibrium relationship:
where , , and represent the chiller power, cooling load, and heat rejection load, respectively, while denotes the total entropy generation of the chiller system.
In practice, we approximate the hot and cold reservoir temperatures by the chilled-water supply temperature and condenser-water supply temperature . Although this water-side approximation may introduce a moderate bias in the absolute value of and in the ideal part of the power expression, the control-volume energy and entropy balances remain valid, and in our physics-informed model the entropy-generation term is learned from data, which allows the network to compensate for such biases while preserving a physically consistent relationship between power, load and temperatures. By combining Equations (3) and (4), we can derive the physical relationship for power as follows:
This equation indicates that when entropy generation is zero, the chiller power corresponds to the ideal power under a reverse Carnot cycle. Therefore, while directly predicting the chiller power, incorporating the calculation of system entropy generation enables an effective assessment of the degree to which the actual refrigeration process deviates from the ideal thermodynamic cycle. In this study, we treat the total entropy generation, , as a physical quantity representing the non-ideality of the refrigeration system and employ a neural network model with two hidden layers to estimate it, as shown in Equation (6).
The entropy generation estimation network takes the system load, temperatures of chilled water and condenser water, as well as water flow rates as inputs, and learns the relationship between entropy generation and operating conditions. Based on this, this paper introduces the power expression derived from physical laws as a physics-informed loss term:
Ultimately, the loss function of the chiller power prediction neural network is formulated as:
where represents the weighting coefficient that balances the data loss and the physics-informed loss. Figure 2 illustrates the overall architecture of the model. The input parameters of chilled water and condenser water are simultaneously utilized for both chiller power prediction and system entropy generation estimation, with the model parameters being jointly optimized through a combination of physics-consistency loss and data-supervision loss.
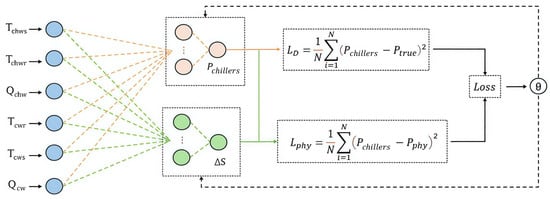
Figure 2.
Chiller power prediction model.
3.2. Pump Power Prediction Model
The water pump power prediction model is designed to forecast the pump’s power based on water flow rate. We also start with a foundational neural network approach, as shown in Equation (9). Let the input water flow rate be denoted as , and the predicted output power be represented by .
where represents a neural network with two hidden layers, and denotes the parameters of the neural network. The data loss function for this model is defined as follows:
To address the challenge of data sparsity, we also introduce a physics-informed loss term. First, we analyze the relationship between pump power and flow rate.
Under the condition of fixed pipeline characteristics (i.e., the pipeline resistance curve remains as ), the operation of water pumps adheres to the following physical laws: when the pump rotational speed changes from to n, the flow rate , the head , and the power . Furthermore, based on the pipeline characteristic requirement , it follows that:
where Q, H and P represent the pump’s flow rate, head, and power at a specific moment, while , and denote the rated flow rate, head, and power of the pump when operating at its rated capacity, with these rated values being known. Therefore, based on Equation (11), we can derive the relationship between the theoretical power value and the flow rate:
where represents the theoretical value of the pump’s power calculated according to this formula. When the pump operates at a low rotational speed, its mechanical efficiency and hydraulic efficiency decline, resulting in the actual power being slightly higher than the theoretical value. The empirically corrected formula is as follows:
where represents the actual theoretical value of the power after correction, and is the efficiency function with values ranging from , typically reaching its peak near the rated flow rate. We approximate this efficiency function using a single-layer fully connected neural network, denoted as to approximate . Based on the aforementioned analysis, we introduce a physics-informed loss term by calculating the mean squared error between the predicted values and the theoretical values:
The final loss term for the pump power prediction neural network is:
where, is an adjustable weighting factor.
4. Experiment
4.1. Data Source
This study takes a large-scale building in southern China as a case study, utilizing actual operational data from 1 January 2023, to 31 December 2023, to validate the application effectiveness of the proposed method. Data was measured every 15 min, resulting in a dataset comprising 35,039 operational records. Following the chronological order of operation, the first 75% of the data was used for training, while the remaining data was allocated for testing. The dataset includes parameters such as the supply and return temperatures and flow rates of chilled water and condenser water, chiller power, chiller load, the power consumption of each pump, and the number of pumps in operation, among others. The actual architectural diagram of the chiller system is shown in Figure 3, with annotations indicating the rated cooling capacity of the chillers and the rated power of the pumps and cooling towers. In this paper, the power unit is , the flow unit is , and the temperature unit is K. In addition, the hardware configuration of the experimental platform is detailed as follows. The CPU adopts an Intel(R) Core(TM) i9-13980HX (2.20 GHz), and RAM is 64 GB. GPU is NVIDIA GeForce RTX 4060.
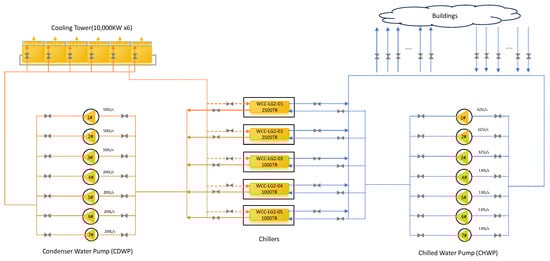
Figure 3.
Actual architecture diagram of the chiller system.
4.2. Experimental Setup
The relevant parameters of chillers and water pumps are shown in Figure 3. The water temperatures and flow rates of the supply and return water on both the condenser and chilled sides of the chillers are measured using temperature sensors and flow sensors. Table 1 presents the parameter settings for the neural network used in this study.

Table 1.
Parameter settings of the neural networks.
To quantitatively evaluate the effectiveness of our proposed model in predicting results, we selected three commonly used evaluation metrics: Mean Absolute Error (MAE), Root Mean Square Error (RMSE), Mean Absolute Percentage Error (MAPE), and the coefficient of determination . The calculation methods for these metrics are as follows:
where M represents the number of test samples, and denote the i-th actual value and predicted value, respectively, while is the mean of the actual values. Generally, smaller values of MAE, RMSE and MAPE, along with a larger value, indicate more accurate predictions by the model.
4.3. Chiller Power Prediction Results
Using chilled water return temperature and condenser water return temperature as examples, we generated scatter plots depicting the distribution of chiller power against system control variables in this study, as illustrated in Figure 4. The plots reveal distinct nonlinear trends in chiller power variations concerning both temperature variables.
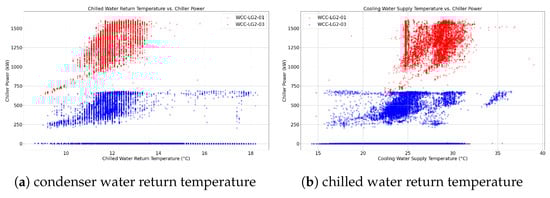
Figure 4.
Scatter plots of system control variables and chiller power.
Figure 5 presents a comparative analysis between our proposed method and a traditional fully connected neural network (MLP) model in chiller power prediction tasks. The upper panel displays point-by-point fitting results comparing actual and predicted power values, while the lower panel shows time-series prediction comparisons. Both models demonstrate robust capability in capturing chiller power trends when trained and tested on identically distributed datasets. In the point-by-point fitting analysis, PINN (Physics-Informed Neural Network) exhibits more concentrated predictions with a narrower error distribution compared to MLP. In time-series tracking, PINN demonstrates smoother adaptation to power fluctuations and better aligns with actual variations under abrupt operational conditions, outperforming MLP marginally. Thus, while overall performance remains comparable, PINN shows superiority in local fitting accuracy and physical consistency.
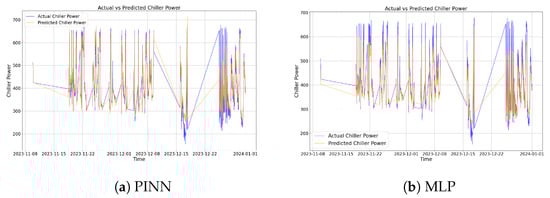
Figure 5.
Result comparison between PINN-based chiller power prediction and MLP-based chiller power prediction.
To further evaluate the model’s generalization capability under non-training distributions, we designed an extrapolation testing experiment, where operational point data unseen during training was used for testing. Specifically, we partitioned the dataset based on two control variables: chilled water return temperature and chilled water flow rate. The model was trained using data from lower percentile ranges, while samples from higher percentile ranges served as the test set. In the experiment, samples with chilled water return temperature exceeding its 90th percentile value and chilled water flow rate exceeding its 70th percentile value were designated as the test set, with the remaining samples forming the training set. This configuration created a boundary extrapolation scenario for physical operating conditions. Figure 6 compares the histograms of the training and test sets for the two variables—chilled water return temperature and chilled water flow rate—demonstrating significant distributional differences that ensure the validity of the extrapolation assessment.
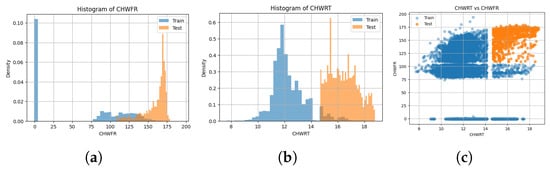
Figure 6.
Distribution shift between training and extrapolation test sets. (a) chilled water return temperature; (b) chilled water flow rate; (c) joint indicators .
Figure 7 compares the performance of the PINN model and MLP model in chiller power prediction under extrapolation conditions. It can be observed that the MLP model exhibits more pronounced prediction deviations (right panel) when tested on unseen operating conditions, whereas the PINN model (left panel) maintains stable functional fitting. In the time-series plots, PINN’s predicted curves remain largely aligned with actual power variations under extrapolation scenarios, while MLP’s predictions frequently show deviations and abrupt changes, indicating a significant decline in stability beyond the training data support range.
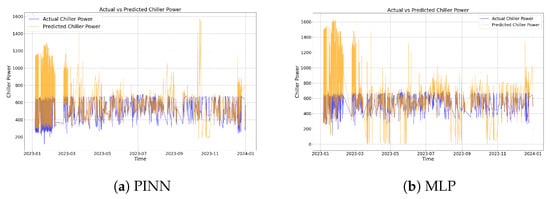
Figure 7.
Comparison of chiller power prediction under extrapolation scenario.
In the following, we quantitatively compare the prediction accuracy of our proposed method and MLP using three metrics: MAE, RMSE, and . The results, as shown in Table 2, demonstrate that on the dataset, PINN achieved approximately 55.5% lower MAE and 41.3% lower RMSE compared to MLP, while improving by 11.9%. These findings indicate that PINN outperforms MLP in both prediction accuracy and goodness-of-fit.
Table 2.
Quantitative evaluation of chiller power prediction model.
4.4. Pump Power Prediction Results
For pump model training and testing, we used data samples from 1 January 2023, to 30 September 2023, as the training set, and data from 1 October 2023, to 31 December 2023, for testing. Figure 8 presents scatter plots of power versus flow rate for both condenser water pumps and chilled water pumps. For condenser water pumps, empirical industrial flow control practices resulted in data samples concentrating at specific points, revealing the sparsity of actual training data. In contrast, chilled water pumps exhibited complete data records with uniformly distributed data points, demonstrating clear clustering and regularity.
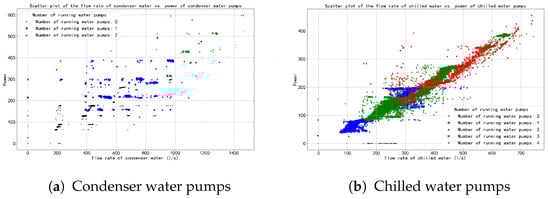
Figure 8.
Scatter plot of total power of water pumps and total flow.
We employed the PINN prediction model proposed in this study to forecast pump power (kW) and conducted a comparative analysis with the results from a 3-layer fully connected MLP model. The findings are illustrated in Figure 9. Specifically, Figure 9a,b present time-series comparisons between predicted and actual power for condenser water pumps using PINN and MLP, respectively, while Figure 9c,d show analogous comparisons for chilled water pumps.
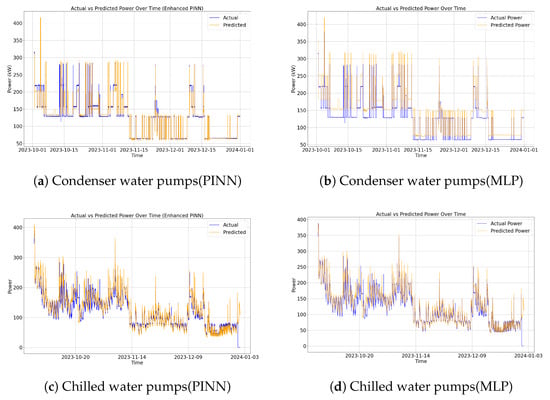
Figure 9.
Results comparison between PINN-based water pumps power prediction and MLP-based prediction.
By comparing Figure 9a,b, it is evident that under conditions of missing data samples, pure data-fitting approaches (MLP) exhibit significant deviations from actual results. In contrast, the integration of physical knowledge in PINN more effectively regulates power predictions, bringing them closer to true values. When comparing Figure 9c,d, under conditions of sufficient and uniformly distributed data samples, the predictions from pure data-fitting methods show minimal visual differences from those of the physics-informed neural network (PINN), necessitating quantitative analysis to assess prediction accuracy. Overall, when training data is sparse, PINN demonstrates the capability to leverage physical laws for enhancing prediction model accuracy.
To investigate the prediction accuracy of PINN under data scarcity conditions, we artificially removed samples of actual chilled water pump power within the ranges of 50–100 kW and 150–200 kW, resulting in incomplete and unevenly distributed data. The resulting data distribution is illustrated in Figure 10.
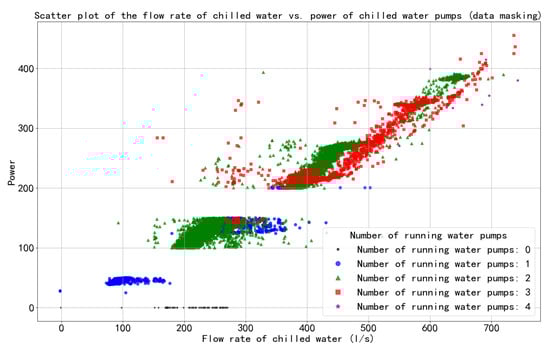
Figure 10.
Scatter plot of total power of chilled water pumps and total flow (data masking).
Under such conditions, we conducted a comparative analysis of the prediction results between PINN and MLP. As shown in Figure 11, it can be observed that under data scarcity, the PINN predictions (left) exhibit closer alignment with actual values compared to MLP predictions (right), particularly during the period from 15 November 2023, to 15 December 2023. This further underscores that when industrial data is incomplete or unevenly distributed, the integration of physical knowledge enables more effective regulation of power prediction results, bringing them closer to true values.
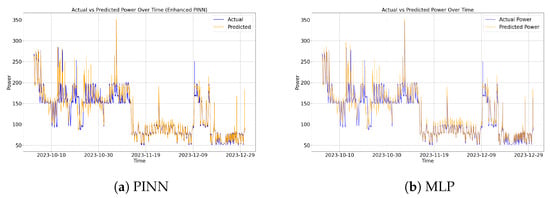
Figure 11.
Results comparison between PINN-based chilled water pumps power prediction and MLP-based prediction (data masking).
In the following, we quantitatively compared the prediction accuracy of our proposed method with MLP using three metrics: MAE, RMSE, and . The results are presented in Table 3, demonstrating that the PINN-based model outperforms the purely data-driven MLP model across all three metrics. Taking the condenser water pump prediction model with uneven data distribution as an example, the PINN model reduced MAE by 54.01%, RMSE by 31.90%, and improved R2 by 17.34% compared to the MLP model. This superior performance stems from PINN’s integration of physical information, enabling better comprehension and utilization of underlying physical laws in the data. Even under conditions of scarce and unevenly distributed data, PINN leverages this prior physical knowledge to make more accurate predictions. In contrast, purely data-driven MLP models may develop biased learned patterns when data is limited, resulting in decreased prediction accuracy.
Table 3.
Quantitative evaluation of water pumps prediction model.
Furthermore, based on the prediction results of the chilled water pump and its artificially masked data counterpart, the superiority of PINN under data scarcity conditions has been further validated. For chilled water pump predictions, the PINN model reduced MAE by 2.66% compared to MLP; under artificially masked data conditions, this reduction increased to 22.78%. These findings demonstrate that when data is missing, PINN achieves higher prediction accuracy by incorporating physical knowledge.
To further evaluate the generalization capability of water pump prediction models under non-training distributions, we designed an extrapolation testing experiment. In this experiment, input flow rates were sorted in ascending order and divided at the 70th percentile, with samples below the percentile used for training and the remaining samples for testing. This design ensured inconsistent data distributions between the training and test sets. The extrapolation results, presented in Table 4, demonstrate that in extrapolation experiments for both types of water pumps, the PINN model significantly reduced prediction errors while exhibiting high accuracy and stability when confronted with unknown operational conditions. In contrast, the MLP model performed poorly under unknown data distributions, particularly in predicting condenser water pumps with uneven data distributions. Taking the chilled water pump as an example, we visualize the results of PINN and MLP extrapolation experiments in Figure 12.
Table 4.
Quantitative evaluation results of extrapolation accuracy of water pump.
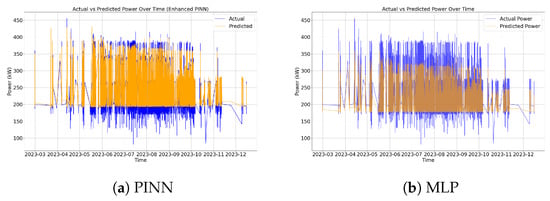
Figure 12.
Comparison of the power prediction of chilled water pumps under extrapolation scenario.
4.5. Ablation Experiments
Finally, this section investigates the impact of the physical loss weighting parameter on PINN prediction accuracy and analyzes the computational time overhead introduced by physical constraints during training.
The value of directly governs the magnitude of physical loss regularization, where appropriate weighting enhances model performance. This section explores how settings affect PINN predictions, with results presented in Table 5. The PINN model achieves optimal accuracy when = 0.3. When is too low, the corrective influence of physical knowledge remains weak, allowing data-driven losses to dominate and yielding limited model improvement. Conversely, excessively high values may cause physical constraints to disproportionately dominate error terms, deviating from data-driven patterns and significantly degrading prediction accuracy.
Table 5.
Prediction results of PINN by varying .
Then, we compare the computational runtimes of the PINN and MLP models, with results presented in Table 6. Due to the incorporation and evaluation of physical loss terms, PINN incurs higher training costs during optimization. However, since both models share identical network architectures, their training times remain comparable, with PINN exhibiting slightly slower performance than MLP but within acceptable margins.
Table 6.
Comparison of running time (s) between PINN and MLP.
5. Conclusions
This paper focuses on the power modeling of chillers, condenser water pumps, and chilled water pumps in real-world building energy consumption systems, proposing a Physics-Informed Neural Network (PINN) modeling approach tailored for scenarios with incomplete and unevenly distributed data. For chiller modeling, this study derives a physical power expression based on energy conservation and entropy balance equations. For condenser water pump and chilled water pump modeling, a power model is constructed by incorporating the cubic relationship between power and flow rate, achieving an integrated modeling approach that fuses physical constraints with data-driven learning. Experimental analyses conducted on real building data demonstrate that, in interpolation scenarios, both the PINN model and the traditional Multi-Layer Perceptron (MLP) model achieve high prediction accuracy. However, in extrapolation scenarios, the PINN model significantly outperforms the MLP model, exhibiting stronger physical consistency and error stability, particularly achieving superior fitting performance and generalization capability in sparse operating conditions such as high-temperature and high-flowrate regions. In summary, the proposed Physics-Informed Neural Model demonstrates reliable prediction performance and accuracy in complex scenarios characterized by data scarcity and uneven distribution.
Future Research Directions: The PINN model also faces certain limitations in practical applications. Its performance is highly dependent on the accuracy of the embedded physical models. If the physical models involve simplifications or inaccurate assumptions, the predictive capability of the PINN model may be constrained. In subsequent research, we will focus on the physical correlations of chillers to continuously refine and optimize the embedded physical models, enhancing their accuracy and applicability.
Author Contributions
Conceptualization, K.Z. and H.S. (Hui Sun); methodology, J.H. and R.L.; software, H.S. (Haitao Sun) and L.Z.; validation, Y.L. and T.C.; data curation, B.X., J.W., H.S. (Haitao Sun) and L.Z.; writing—original draft preparation, K.Z.; writing—review and editing, J.H. and Y.W.; visualization, R.L.; supervision, Y.W. All authors have read and agreed to the published version of the manuscript.
Funding
This research received no external funding.
Data Availability Statement
Data will be made available on request.
Conflicts of Interest
Authors Kongyang Zhu, Hui Sun, Ying Li, Tao Chen, Baoyuan Xing, Juzhuo Wu were employed by the company Guangdong Power Grid Energy Investment Co., Ltd. Author Haitao Sun was employed by the company Beijing Zhonghe Intelligence Co., Ltd. The remaining authors declare that the research was conducted in the absence of any commercial or financial relationships that could be construed as a potential conflict of interest.
References
- Blad, C.; Bøgh, S.; Kallesøe, C. A Multi-Agent Reinforcement Learning Approach to Price and Comfort Optimization in HVAC-Systems. Energies 2021, 14, 7491. [Google Scholar] [CrossRef]
- Manic, M.; Wijayasekara, D.; Amarasinghe, K.; Rodriguez-Andina, J.J. Building energy management systems: The age of intelligent and adaptive buildings. IEEE Ind. Electron. Mag. 2016, 10, 25–39. [Google Scholar] [CrossRef]
- Ciampi, F.G.; Rega, A.; Diallo, T.M.; Pelella, F.; Choley, J.Y.; Patalano, S. Energy consumption prediction of industrial HVAC systems using Bayesian Networks. Energy Build. 2024, 309, 114039. [Google Scholar] [CrossRef]
- Kannan, T.; Lork, C.; Tushar, W.; Yuen, C.; Wong, N.C.; Tai, S.; Lan, L.; Wood, K.L. Energy management strategy for zone cooling load demand reduction in commercial buildings: A data-driven approach. IEEE Trans. Ind. Appl. 2019, 55, 7281–7299. [Google Scholar] [CrossRef]
- Wu, C.; Pan, H.; Luo, Z.; Liu, C.; Huang, H. Multi-objective optimization of residential building energy consumption, daylighting, and thermal comfort based on BO-XGBoost-NSGA-II. Build. Environ. 2024, 254, 111386. [Google Scholar] [CrossRef]
- Mishra, A.; Lone, H.R.; Mishra, A. DECODE: Data-driven energy consumption prediction leveraging historical data and environmental factors in buildings. Energy Build. 2024, 307, 113950. [Google Scholar] [CrossRef]
- Gao, Y.; Shi, S.; Miyata, S.; Akashi, Y. Successful application of predictive information in deep reinforcement learning control: A case study based on an office building HVAC system. Energy 2024, 291, 130344. [Google Scholar] [CrossRef]
- Shakya, P.; Ng, G.; Zhou, X.; Wong, Y.W.; Dubey, S.; Qian, S. Thermal Comfort and Energy Analysis of a Hybrid Cooling System by Coupling Natural Ventilation with Radiant and Indirect Evaporative Cooling. Energies 2021, 14, 7825. [Google Scholar] [CrossRef]
- Abdelaziz, A.; Santos, V.; Dias, M.S. Machine Learning Techniques in the Energy Consumption of Buildings: A Systematic Literature Review Using Text Mining and Bibliometric Analysis. Energies 2021, 14, 7810. [Google Scholar] [CrossRef]
- Holkar, K.S.; Waghmare, L.M. An overview of model predictive control. Int. J. Control Autom. 2010, 3, 47–63. [Google Scholar]
- Schwenzer, M.; Ay, M.; Bergs, T.; Abel, D. Review on model predictive control: An engineering perspective. Int. J. Adv. Manuf. Technol. 2021, 117, 1327–1349. [Google Scholar] [CrossRef]
- Afram, A.; Janabi-Sharifi, F. Theory and applications of HVAC control systems—A review of model predictive control (MPC). Build. Environ. 2014, 72, 343–355. [Google Scholar] [CrossRef]
- Yao, Y.; Shekhar, D.K. State of the art review on model predictive control (MPC) in Heating Ventilation and Air-conditioning (HVAC) field. Build. Environ. 2021, 200, 107952. [Google Scholar] [CrossRef]
- Chua, K.J.; Chou, S.K.; Yang, W.; Yan, J. Achieving better energy-efficient air conditioning—A review of technologies and strategies. Appl. Energy 2013, 104, 87–104. [Google Scholar] [CrossRef]
- Salimian Rizi, B.; Pavlak, G.; Cushing, V.; Heidarinejad, M. Predicting uncertainty of a chiller plant power consumption using quantile random forest: A commercial building case study. Energy 2023, 283, 129112. [Google Scholar] [CrossRef]
- Chaerun Nisa, E.; Kuan, Y.D. Comparative assessment to predict and forecast water-cooled chiller power consumption using machine learning and deep learning algorithms. Sustainability 2021, 13, 744. [Google Scholar] [CrossRef]
- Yu, F.; Ho, W.; Chan, K.; Sit, R. Critique of operating variables importance on chiller energy performance using random forest. Energy Build. 2017, 139, 653–664. [Google Scholar] [CrossRef]
- Ahmad, M.W.; Mourshed, M.; Rezgui, Y. Trees vs Neurons: Comparison between random forest and ANN for high-resolution prediction of building energy consumption. Energy Build. 2017, 147, 77–89. [Google Scholar] [CrossRef]
- Liang, X.; Liu, Y.; Chen, S.; Li, X.; Jin, X.; Du, Z. Physics-informed neural network for chiller plant optimal control with structure-type and trend-type prior knowledge. Appl. Energy 2025, 390, 125857. [Google Scholar] [CrossRef]
- Kim, J.H.; Seong, N.C.; Choi, W. Forecasting the Energy Consumption of an Actual Air Handling Unit and Absorption Chiller Using ANN Models. Energies 2020, 13, 4361. [Google Scholar] [CrossRef]
- Liang, X.; Zhu, X.; Chen, K.; Chen, S.; Jin, X.; Du, Z. Endowing data-driven models with rejection ability: Out-of-distribution detection and confidence estimation for black-box models of building energy systems. Energy 2023, 263, 125858. [Google Scholar] [CrossRef]
- Liang, X.; Liu, Z.; Wang, J.; Jin, X.; Du, Z. Uncertainty quantification-based robust deep learning for building energy systems considering distribution shift problem. Appl. Energy 2023, 337, 120889. [Google Scholar] [CrossRef]
- Ma, Z.; Jiang, G.; Hu, Y.; Chen, J. A review of physics-informed machine learning for building energy modeling. Appl. Energy 2025, 381, 125169. [Google Scholar] [CrossRef]
- Sun, Y.; Sun, Q.; Qin, K. Physics-Based Deep Learning for Flow Problems. Energies 2021, 14, 7760. [Google Scholar] [CrossRef]
- Li, P.; Guo, F.; Li, Y.; Yang, X.; Yang, X. Physics-informed neural network for real-time thermal modeling of large-scale borehole thermal energy storage systems. Energy 2025, 315, 134344. [Google Scholar] [CrossRef]
- Ni, W.; Tian, G.; Xie, G.; Ma, Y. Power prediction of oscillating water column power generation device based on physical information embedded neural network. Energy 2024, 306, 132493. [Google Scholar] [CrossRef]
- Xiao, T.; You, F. Building thermal modeling and model predictive control with physically consistent deep learning for decarbonization and energy optimization. Appl. Energy 2023, 342, 121165. [Google Scholar] [CrossRef]
- Xiao, T.; You, F. Physically consistent deep learning-based day-ahead energy dispatching and thermal comfort control for grid-interactive communities. Appl. Energy 2024, 353, 122133. [Google Scholar] [CrossRef]
- Jia, Y.; Wang, J.; Hosseini, M.R.; Shou, W.; Wu, P.; Mao, C. Temporal graph attention network for building thermal load prediction. Energy Build. 2024, 321, 113507. [Google Scholar] [CrossRef]
- Gokhale, G.; Claessens, B.; Develder, C. Physics informed neural networks for control oriented thermal modeling of buildings. Appl. Energy 2022, 314, 118852. [Google Scholar] [CrossRef]
- Wang, X.; Dong, B. Physics-informed hierarchical data-driven predictive control for building HVAC systems to achieve energy and health nexus. Energy Build. 2023, 291, 113088. [Google Scholar] [CrossRef]
- Ma, Z.; Jiang, G.; Chen, J. Physics-informed ensemble learning with residual modeling for enhanced building energy prediction. Energy Build. 2024, 323, 114853. [Google Scholar] [CrossRef]
Disclaimer/Publisher’s Note: The statements, opinions and data contained in all publications are solely those of the individual author(s) and contributor(s) and not of MDPI and/or the editor(s). MDPI and/or the editor(s) disclaim responsibility for any injury to people or property resulting from any ideas, methods, instructions or products referred to in the content. |
© 2025 by the authors. Licensee MDPI, Basel, Switzerland. This article is an open access article distributed under the terms and conditions of the Creative Commons Attribution (CC BY) license (https://creativecommons.org/licenses/by/4.0/).