Abstract
Sustainable urban energy is based on innovative solar and wind solutions. The paper presents such a hybrid solar–wind system, which is easy to place on building terraces, highlighting the advantages of this technical solution: energy production as close as possible to consumers, the elimination of system losses, and small installation spaces being required. The system operates well in the low-speed range for the horizontal axis crossflow wind turbine placed under a flexible solar panel, at speeds between 2 and 8 m/s, and exhibits good efficiency in cooling the photovoltaic panels. The prototype proposed by the paper is a small-scale model that can produce on average 400 Wh/day and about 150 kWh/year. The paper analyses numerically the aerodynamic behaviour of the prototype at several wind speeds, as well as experimental results regarding the power and power coefficient for the wind turbine, as well as the power and efficiency of the flexible solar panel in the hybrid system. The research is complemented with comparative technical analysis and economic analysis.
1. Introduction
The two energy sources, solar and wind, are complementary in most areas of the globe. The capture and use of these two energy sources continue to occupy the first place among renewable energies.
The continuous development of wind energy generation technologies focuses on increasing productivity, reducing costs, and developing turbine designs that operate at low wind speeds [1]. A challenge for urban solar and wind energy is their integration into building architecture [2,3]. An investigation on wind flow in suburban environments characterised by buildings with different roof profiles found that flow characteristics in such conditions are highly dependent upon the roof type on which the turbine is mounted [4]. The flat roof is found to be the best solution on paper [5]. According to other authors, the ridge roof is better, multiplying the wind speed by 1.5–2.2 times [6].
A frequently used solution is the crossflow rotor for capturing wind energy, which can be mounted horizontally for a more compact, vibration-free structure, which enters the wind at air speeds below 2 m/s [6,7,8].
Sustainable urban energy solutions with hybrid solar–wind systems are presented in research [9,10]. Paper [10] highlights the strengths and weaknesses of solar PV power systems and wind turbines power systems. The strengths points comprise their relatively good resource predictability, high scalability, decentralised energy generation, easy maintenance, environmental benefits, and energy independence. The weaknesses points include that solar energy production is limited to daylight hours, wind energy production is variable due to fluctuations in wind speed, shading on even a small part of a solar panel can significantly reduce energy production, and the systems require energy storage.
A critical review and findings regarding hybrid wind/photovoltaic energy system developments can also be found in paper [11]. The power generated from solar and wind is more reliable and cost-effective. It can be connected to the grid or work off-grid.
Because the two energy sources—wind and solar—are complementary during the day but also during the seasons of the year, they can reduce the need for energy storage in the short term, as shown in paper [12]. So, using them in compact hybrid systems is a good solution.
Previous studies have analysed the performance of these sources separately or together, and have developed applications with crossflow wind turbines, highlighting the advantages of positioning wind turbines on the roofs or terraces of buildings. Due to their ability to produce sustainable energy in urban areas while keeping costs low and eliminating energy transport losses, and requiring only small installation areas, hybrid solutions have been proposed, like the following:
- (i)
- WindRail was designed in Zurich, Switzerland by the Anerdgy, (Windkraft-Journal, 24 January 2014) [13].
- (ii)
- Bluenergy solar wind turbine, 2020, is a system with a vertical Savonius wind turbine with integrated photovoltaic cells; (https://www.mwps.co.uk/wind-energy-news/wind-power-news/2020/solar-wind-turbine-the-revolutionary-bluenergy-solarwind-turbine, accessed on 20 May 2025) [14].
- (iii)
- Solar-Powered Wind Turbine, designed in 2013 at the University of Liverpool has a horizontal wind turbine, with photovoltaic cells integrated on the blades of the wind turbines [15].
These have a series of technological limitations related to geometry, shading, etc.
WindRail [13] is a new hybrid system that has been designed by Anerdgy for residential terraces. It uses the pressure difference that is created by the wind blowing through the buildings. This system consists of a horizontal axis wind turbine placed under a solar panel.
The Bluenergy Solarwind Turbine features double-helix curved wind blades mounted on a vertical axis, covered with solar cells. Instead of using glass, the cells are covered with clear Teflon. When the wind is blowing, the solar cells are cooled by the rotation, which is set to assist in maximum electricity generation. The model produces up to 5 kW. It can produce 3 kW from wind, with a mean speed of 5.6 m/s, assuming 9 h of operation. In 30 days/month, this results in 810 kWh/month. From the sun it can produce 2 kW, assuming 6.5 h operation per day, in 24 days/month, resulting in 312 kWh/month [14].
In 2013, the University of Liverpool has upgraded a wind turbine with a new set of spinning solar blades, thereby incorporating photovoltaic technology into traditional turbines [15]. Researchers designed a horizontal wind turbine with photovoltaic cells integrated on the blades of the wind turbines. The device is produced in two-metre modules and can generate from 1500 to 2000 kWh/year [15].
This paper introduces a new design system that integrates the two energy sources, solar and wind, in a two-in-one model, having advantages such as taking up a small space by placing it on the terraces of buildings, creating additional energy by cooling the photovoltaic panel, producing a higher total energy from two sources, and better hybrid system efficiency.
In addition, even in the absence of wind, the system works if the crossflow wind turbine is located at the polluted air exhaust vents of office or commercial buildings.
The objectives of this study are to design and manufacture a hybrid solar–wind model with a 700 mm long and 200 mm diameter of crossflow wind turbine and a 25 W monocrystalline Si-based solar PV panel, and to test the model. In this paper, operating performance will be highlighted via the following: the energy increase using the two complementary sources, identification of the optimal operating range concerning the turbine parameters, and the additional energy obtained by cooling the solar panel by rotating the turbine placed under the photovoltaic panel. The research is complemented by climatological data, model design and manufacturing, numerical analyses, model tests, and comparative technical and economic analysis.
The advantages of the proposed hybrid system are its ability to obtain decentralised energy, as close as possible to the consumer, its independence from the grid and elimination related losses, greater energy production, smaller allocated space, its low manufacturing cost, and its easy maintenance.
2. Climatological Data
To analyse the wind and solar potential in the energy capture area with the proposed hybrid systems located on the terraces of tall buildings, the authors used meteorological data from [16] and from the Global Wind Atlas [17,18] and the Global Solar Atlas [19].
2.1. Wind Potential in Romania
The wind potential was analysed at 10 m above ground, and it can be seen in Figure 1 and Figure 2 that speeds above 5 m/s are often encountered in the analysed area. From the wind rose—Figure 3—it can be seen that the dominant wind direction is northeast.
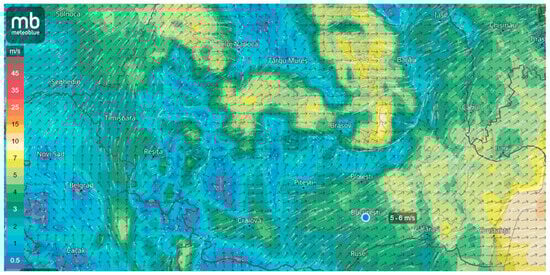
Figure 1.
Wind map in the southeast region of Romania on an October day [16].
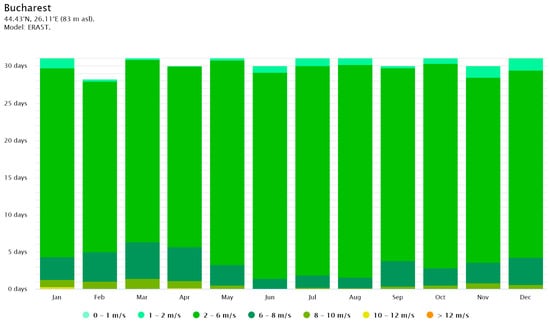
Figure 2.
Year distribution of wind speeds in the southeast region [17,18].
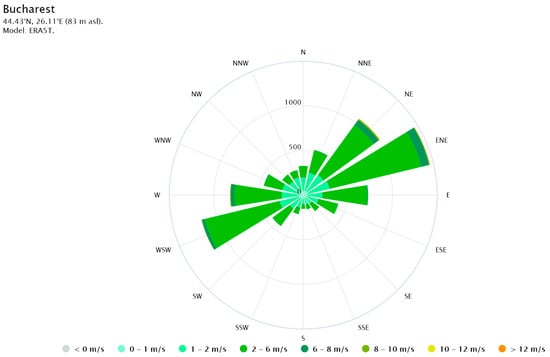
Figure 3.
Wind rose in October [17].
2.2. Solar Potential in Romania
The solar potential in Romania is good, especially in the southeastern area of the country. Figure 4 is an example of such a solar potential for a day in October, when the sun is active for more than 9 h a day. Figure 5 shows how many days in each month are completely sunny or partially sunny during the year, and the balance is very good for this region.
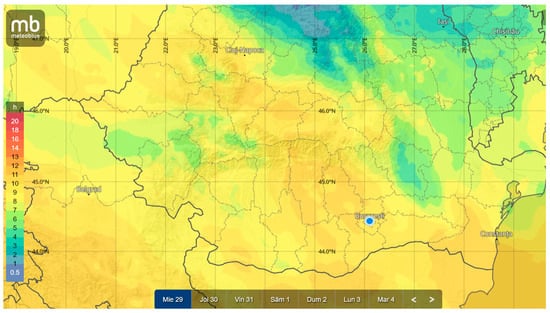
Figure 4.
Solar map in the southeast region on an October day [16].
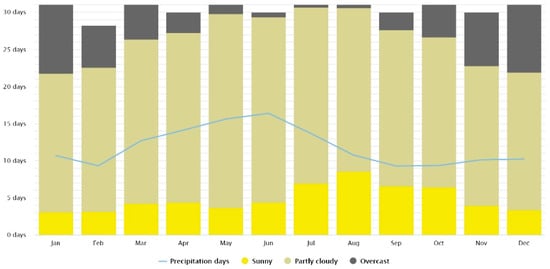
Figure 5.
Year distribution of solar energy in the southeast region [19].
It can be seen from Figure 5 that in the winter months there are at least 20 sunny or partly sunny days, and in the summer months there are 28–30 such days, so the solar potential of the area is very good. Meteorological data are selected from [16] and the Global Solar Atlas [19].
The wind potential with wind speeds over 5 m/s, but also the good solar potential in the southeastern area of Romania, justifies the placement of solar–wind hybrid systems to supply residential buildings with renewable energy, in support of sustainable urban energy.
3. Design and Manufacturing of the Hybrid Solar–Wind System
The proposed model consists of a support for the photovoltaic panel, profiled to represent a case for the crossflow wind turbine, made largely from 3D-printed components. The horizontal crossflow turbine is mounted in this support, with shaft and bearings at the ends, and the photovoltaic panel on the support.
Based on previous studies [20,21,22], the crossflow turbine with an outer diameter D = 0.2 m, inner diameter d = 0.16 m, and length L = 700 mm (consisting of five sections of 130 mm) was designed. The number of blades was calculated and the rotor with 18 blades was designed. For the crossflow wind turbine, profiled blades NACA 4412 from the profile library [23] were chosen, not simply curved, for better aerodynamic performance. Other studies analyse the turbine blade simply curved with an arc of a circle–round blade, but the performances are limited to a power coefficient of 0.26 [24,25,26,27].
The blades have an inlet angle β1 = 30° and an outlet angle β2 = 90°. The air passes two times through the rotor and provides a better turning moment. An air guide profile at the rotor inlet with a 160-degree angle, specified for transversal rotors, was designed [28,29].
The prototype was manufactured by 3D printing from PLA (plastic–polylactic acid).
The flexible photovoltaic panel (FWAVE Solar Modules 25 W, thin-film amorphous-silicon [30]) is placed on the specially designed support above the wind rotor with horizontal axis. The maximum power of 25 W is obtained at solar irradiance of 1000 W/m2.
In Figure 6, the overall structure of the hybrid system can be seen. In Figure 7, the dimensions and a 3D view for the crossflow wind turbine are presented. The rotor is fixed to the support by a 10 mm diameter shaft and bearings at the ends. The rotor’s balancing could not be verified, but it may be a reason why at high wind speeds its self-braking occurs. This aspect has been experimentally demonstrated.
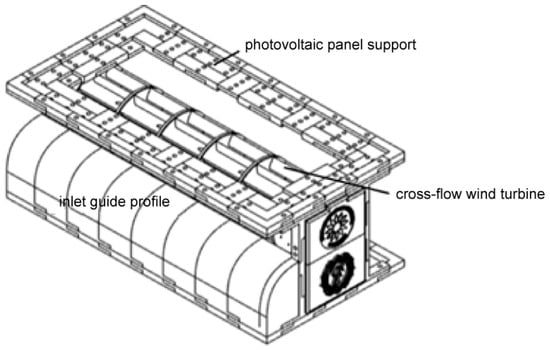
Figure 6.
Hybrid solar–wind system.
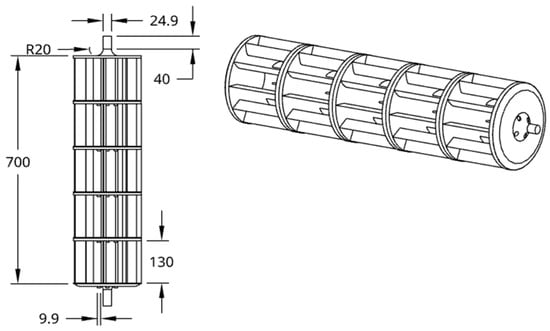
Figure 7.
Dimensions of the crossflow wind turbine and 3D view.
4. Numerical Analysis of the Flow Through the Wind Rotor
To identify the optimal rotor shape and inlet guide profile, the study used numerical analysis methods. The NACA 4412 aerodynamic blade shape was drawn with the OnShape application, a product development platform (https://www.onshape.com/en/features/parts-modeling), and the numerical analysis were performed with the SimScale Academic Program (https://www.simscale.com/academic-program/). For crossflow rotor analysis, a hexagonal mesh with refinements four on the blades was used (varying from one—coarse, to ten—fine). For the crossflow rotors, the k-ε turbulence model is the best option in SimScale’s multi-purpose analysis type. The multi-purpose solver uses RANS equations with k-ε for closure and has proprietary wall functions that give flexibility when meshing near walls—perfect for rotating machinery.
With the help of numerical simulations, the correct position of the guide vane and the optimal operating conditions of the crossflow wind turbine were identified. Similar studies can be found in the specialised literature [23,24,26].
The initial conditions were atmospheric pressure and zero velocity on solid parts and the boundary conditions for the inlet wind speed were set to 2, 4, 6 and 8.5 m/s. The results in Figure 8 show the aerodynamic behaviour of the rotor and the fact that at low speeds vortices, turbulence, and unsteady running are visible.
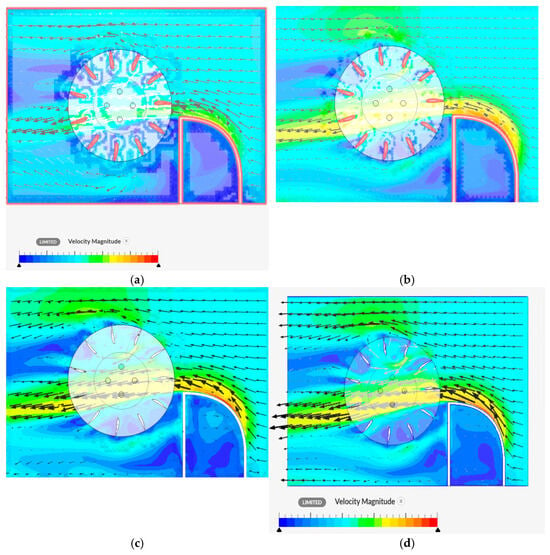
Figure 8.
Velocities distribution in cross flow turbine, for inlet speeds of 2 m/s (a), 4 m/s (b), 6 m/s (c), and 8.5 m/s (d). The arrows indicate the direction of fluid flow through the rotor.
At speeds above 4 m/s this turbulence is reduced, and at 8.5 m/s the performance seems to be even better, by attenuation of the peripheral vortices.
At air flow speeds above 9 m/s, numerical simulations malfunctioned in terms of vortices and turbulence, a fact that was also demonstrated experimentally.
Paper [26] makes numerical analyses and studies the different numbers of 16, 18, or 20 blades, also using guidance blades.
Different blade profile shapes—flat, round, sharp and aerodynamic—are analysed with CFD numerical methods in the paper [29], with the result that the aerodynamic profile is the most suitable for high efficiency across most speed ranges. It is also found in [29] that at low speeds, instability, recirculation, and adjacent vortices appear, like in the present numerical study. For this reason, in the present research the authors have opted for a crossflow rotor blade with aerodynamic profile. At low speeds the presence of a turbulence–wake effect is observed, at medium speeds the behaviour is good, and at high speeds a slight delay and a self-braking of the turbine is observed, a fact found from the numerical analysis, described above, of this study.
5. Experimental Setup and Results
5.1. Experimental Setup
The front and back views of the wind–solar hybrid system can be seen in Figure 9, along with the measuring instruments used in the experiment.
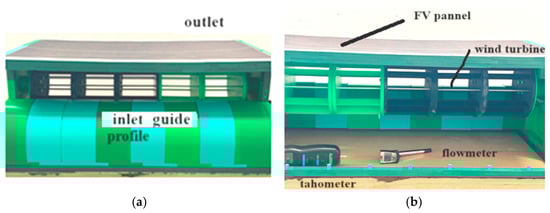
Figure 9.
Hybrid system model manufactured by 3D printing, with front (inlet) side (a) and back (outlet) side (b).
The experimental study focuses on identifying the optimal operating range for both the wind turbine and the solar panel to maximise the energy produced.
For testing the crossflow turbine, the air flow was created by a centrifugal fan. The air speed varied with the fan discharge flap. Wind velocity measurements were carried out with a hot-wire anemometer, with an accuracy of ±0.1 m/s, and a digital tachometer for rotation speed with an accuracy of ±0.05%.
For experiments on the power and efficiency of the flexible solar panel in the installation, the solar irradiation was measured with a pyranometer with an accuracy of 2%, and for electrical measurements with electronic ammeter and voltmeter with an accuracy of ±1%.
5.2. Crossflow Turbine Experimental Results
The computational relations used in this paragraph are the following:
where is the tip speed ratio (TSR) of the turbine, the angular frequency (rad/s), (rpm) the speed, the rotor diameter (m), L the rotor length (m), A the area (m2); A = D·L, the wind velocity (m/s), and u is the tangential velocity (m/s).
is the drag force due to air friction with the turbine blades and is the drag coefficient. is the lift force and is the lift coefficient. For the NACA 4412 profile from the airfoil library, the mean values for lift and drag coefficient were considered s cl = 0.6 and cd = 0.06.
The resultant force is given by relation (3):
The mechanical power is calculated with relation (4):
The theoretical power extracted from the wind is given by
The power coefficient () can be computed with Equation (6), as the ratio between mechanical and theoretical power from the wind:
In Table 1, the experimental results for the crossflow turbine are shown.

Table 1.
Experimental results for the wind turbine.
Using the results in Table 1, in Figure 10, the theoretical power and mechanical power are presented, depending on the wind speed. The theoretical wind power exceeds 68.7 W, while the mechanical power obtained is approximately 20.6 W.
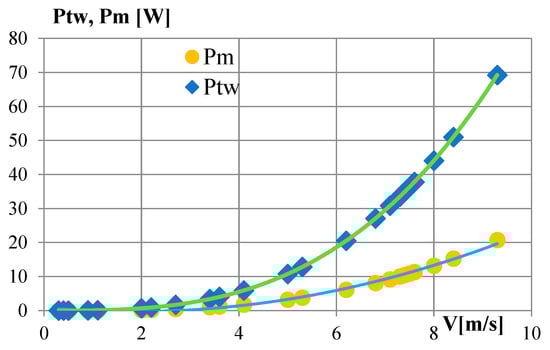
Figure 10.
Turbine theoretical power Ptw in blue and the mechanical power Pm in yellow, depending on the wind velocity.
Good behaviour is observed, with the power coefficient between (0.27 ÷ 0.31) at wind speeds of 2–6 m/s. At a velocity of 0.3 m/s, the rotor enters slightly into the wind. At wind speeds above 9 m/s, the power coefficient decreases and vibrations appear; the rotor behaves well at low wind speeds. An optimum operation from the experiment would be at 2–8 m/s, which is also demonstrated numerically. For this range, the power coefficient is good, and the tip speed ratio λ is about 0.4–0.5.
Paper [31] analysed a hybrid system solar–Darrieus turbine, with profiled blades SG6043. The construction is vertical and more difficult to place on the roofs or terraces of residential buildings. With the wind turbine in paper [31], with diameter D = 0.4 m and height H = 0.32 m, the authors obtained the power coefficient cp = 0.2366.
In the present study, the blades are profiled and a better power coefficient of approximately 0.3 was obtained.
The good behaviour of the crossflow turbine can also be observed through the power coefficient values, represented in Figure 11, depending on the wind speed. Maximum power coefficient values can be observed at wind speeds between 3 and 6 m/s. These good values are the result of the choice of aerodynamic profiled blades, not just simply the round ones in the design and manufacturing of this rotor.
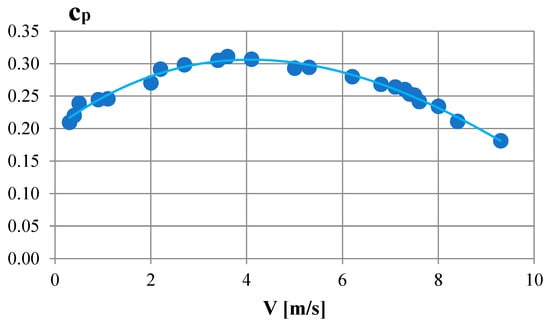
Figure 11.
The power coefficient cp depending on the wind velocity.
5.3. Photovoltaic Panel Experiments
For experiments on the power and efficiency of the flexible solar panel in the installation, the solar irradiation was measured using a pyranometer with an accuracy of 2%, and for electrical measurements, an electronic ammeter and voltmeter with accuracy of ±1% were used.
The current and voltage curves of the photovoltaic panel used in the experiment at different solar irradiations adapted from the technical sheet of the product [30] are presented in Figure 12.
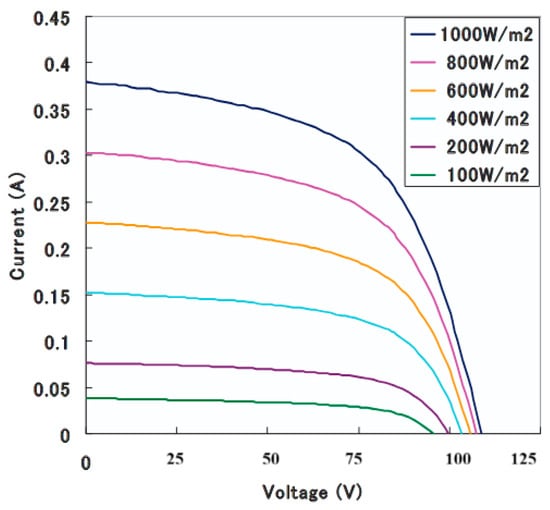
Figure 12.
The current and voltage curves of the photovoltaic panel at different solar irradiations adapted from [30].
The experimental study was performed at a mean global irradiation G = 600 W/m2, in May 2025. The energy characteristics—current depending on voltage I(U), and power depending on voltage P(U)—with and without panel cooling (when the wind turbine was running or not) were plotted. The solar panel efficiency can be determined with the following relation:
The area of photovoltaic panel A is 0.171 m2, P is the electrical power obtained with the solar panel, and G is the global irradiation, W/m2.
Studies have shown that wind speeds of 1 m/s can reduce panel temperature by 5–11 °C. In direct sunlight, panel temperatures can easily reach 65–70 °C.
In the case of the proposed hybrid system, the active cooling of the panel is ensured by the operation of the wind rotor. This improves the efficiency of the panel by up to 10%.
The authors measured the temperature and found 60 °C on the front of the panel, and 50 °C on the back of the panel. By cooling with air driven by the crossflow rotor at a speed of 2 m/s, the temperature dropped to 43 °C, and at speeds over 6 m/s, the temperature on the back of the panel dropped to 35 °C. A laser thermometer was used, with an accuracy of ±2%. Thus, with a temperature drop of 15 °C on the back of the panel, compared to 25 °C on its front, the efficiency obviously increases. By measuring the electrical parameters and their representations in Figure 13, an increase of 8–10% was identified. The cooling comes exclusively from the rotor; the measurements were made at zero natural wind.
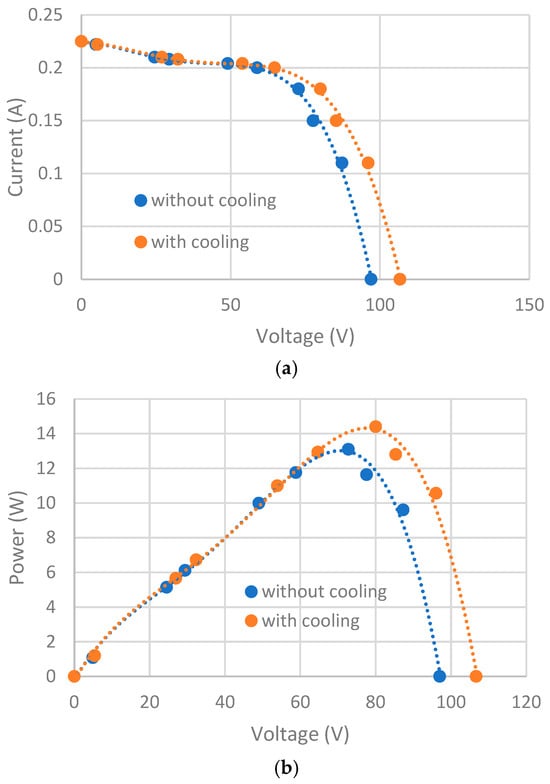
Figure 13.
Experimental characteristics of the solar panel with and without cooling for a mean solar irradiation of 600 W/m2: (a) current–voltage; (b) power–voltage.
With the active panel cooling, an increase in voltage and power of 8–10% was observed and illustrated in Figure 13. Experiments were made for a global solar irradiation of 600 W/m2. The measurement uncertainty of electrical quantities was less than 1%. This increase in power was identified also in previous studies [32].
By summing the powers from the two sources, according to the experiment, the results represented in the graph in Figure 14 are obtained. In yellow is the power obtained from wind, and in blue is the total power for the hybrid solar–wind system. Under the conditions of average solar radiation (600 W/m2), this can reach 35 W. The effect of the cooling of the photovoltaic panel and the solar radiation of 600 W/m2 were also considered.
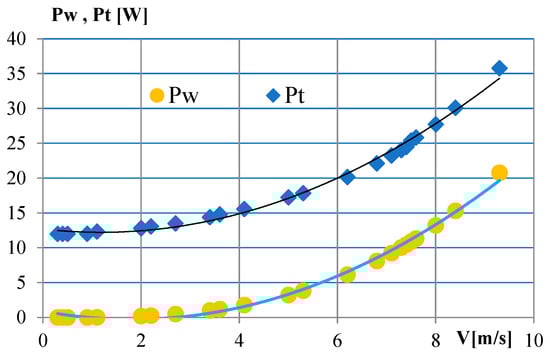
Figure 14.
Wind turbine power Pw and total power Pt for the hybrid system.
The authors repeated the experiments for the crossflow turbine three times in laboratory conditions. Then the tests were repeated three times with the hybrid system, outdoors. In these cases, the wind speed was zero, with the air movement coming from the wind turbine (driven from an external source). The solar radiation in the outdoor tests was, on average, 600 W/m2.
6. Hybrid System Performances Analysis
6.1. Technical Analysis
“Hybrid systems of renewable energies, especially based on PV–wind systems, are becoming the most obvious solution for decentralised power generation. They are particularly adopted in rural and remote areas and have recently seen huge progression due to the decrease in equipment prices in recent years” [33].
A comparative analysis of the solar–wind hybrid system models analysed by the authors, including their experimental model, is presented in Table 2. The comparison includes the type or model, power, power factor where mentioned, mounting position, cost, and observations regarding the location.
Table 2.
Comparative analyses.
With the experimental model designed and manufactured largely with 3D printed components, a power of 15 W from solar energy (for solar radiation of 600 W/m2) and 25 W (for solar radiation of 1000 W/m2) is produced, and from wind energy a power of 20 W is produced. The crossflow turbine has an efficiency of 0.3. If the solar panel operates on average 6 h per day and the wind turbines 12 h per day, an average of 405 Wh/day or approximately 150 kWh/year can be obtained, in the optimal operating conditions of the installation. The working assumptions (with 6 h of sun and 12 h of wind per day) are annual averages for the location area mentioned in Section 2.
For a household with an average monthly consumption of 150 kWh/month or 5000 Wh/day, we can determine the number of solar–wind hybrid systems needed as follows:
with 12 or 13 systems, energy can be provided for a house. The energy over a year is about at 150 kWh/year with this innovative small hybrid model.
For the 12 units required for the energy consumption of a house, the usable area is about 8 m2, sufficient in the case of horizontal terraces. However, the best location to benefit from wind speeds above 6 m/s is high up, at the ridge of the house, with the systems mounted in series. In this case, shading is no longer an obstacle if there are no trees nearby.
6.2. Economic Analysis
The economic analysis considered the cost of the model at approximately 200 euros. The cost of the flexible panel (50 euros), the cost of the crossflow turbine execution (50 euro), and the cost of the supporting structure and mechanical parts (100 euro) were added up. From the technical analysis above, it indicated that 12 systems are required for the energy consumption of a single-family house, i.e., a total cost of 2400 euros. If the inverter, batteries, and MPPT are added, the total investment involves approximately 3000 euros. Assuming a consumption of 1800 kWh/year and an energy cost of 0.3 euro/kWh, the investment is amortised in 5.5 years.
7. Conclusions and Further Research
The new model of hybrid solar–wind system is suitable for the roof or terraces of the buildings and has good behaviour and many advantages. The research concluded the following results:
- The two renewable energy sources—wind and solar—necessary for the studied model are complementary, and the climatological data show that the placement of hybrid systems can be achieved with good results in the southeastern area of Romania.
- The advantage is that the installation takes up little space compared to other similar solutions and fits on building roofs.
- Numerical simulations confirmed the geometry and predicted the optimal aerodynamic behaviour of the system.
- Tests showed a low wind velocity for the cut-in of the turbine: 0.4 m/s.
- The best power coefficient was over 0.3, for wind speeds between 2 and 6 m/s.
- The photovoltaic panel provides 8–10% more power by air cooling with the crossflow turbine.
- The total power exceeds 45 W with this small experimental model, so the average energy is 405 Wh/day.
- Low costs allow for a quick return on investment, in approximately five years.
- Stable horizontal construction, vibration-free, and easy maintenance.
The good performance obtained with this hybrid system motivates us to continue research on larger prototypes.
Further developments will analyse the optimal distance between the wind turbine and the solar photovoltaic panel, the level of turbulence, and analysis of heat transfer between the panel and the rotor. Also, a larger-scale prototype with a rotor diameter of 0.5 m and a length of 2 m will be studied, which also requires a solar panel of at least 250 W placed on top of the turbine.
Author Contributions
Conceptualization, S.B. and G.L.M.; methodology, S.B. and G.-F.F.; model manufacture, G.-F.F.; writing—original draft preparation, A.M. and I.V.; and writing—review and editing, S.B. All authors have read and agreed to the published version of the manuscript.
Funding
This research received no external funding.
Data Availability Statement
The original contributions presented in this study are included in the article. Further inquiries can be directed to the corresponding author.
Conflicts of Interest
The authors declare no conflicts of interest.
References
- IEA.org. Available online: https://www.iea.org/energy-system/renewables/wind#tracking (accessed on 10 May 2025).
- Innoenergy. Available online: https://www.innoenergy.com/discover-innovative-solutions/customer-cases/french-hypermarket-gets-24-7-energy-autonomy-sun-wind-combined/ (accessed on 5 October 2025).
- BKV Energy. Available online: https://bkvenergy.com/blog/wind-turbines-for-homes/ (accessed on 5 October 2025).
- Wilberforce, T.; Olabi, A.G.; Sayed, E.T.; Alalmi, A.H.; Abdelkareem, M.A. Wind turbine concepts for domestic wind power generation at low wind quality sites. J. Clean. Prod. 2023, 394, 136137. [Google Scholar] [CrossRef]
- Ledo, L.; Kosasih, P.B.; Cooper, P. Roof mounting site analysis for micro-wind turbines. Renew. Energy 2011, 36, 1379–1391. [Google Scholar] [CrossRef]
- The Power Collective, Ridge Blade RB. Available online: https://www.switchontario.ca/resources/Documents/Managing%20Energy%202017/Managing%20Energy%202017%20-%20Business%20-%20RidgeBlade%20-%20Llion%20Rowlands.pdf (accessed on 15 September 2025).
- Sefidgar, Z.; Ahmadi Joneidi, A.; Arabkoohsar, A. A Comprehensive Review on Development and Applications of Cross-Flow Wind Turbines. Sustainability 2023, 15, 4679. [Google Scholar] [CrossRef]
- Budea, S. Assessment regarding the performances of wind turbines from the roofs of buildings. E3S Web Conf. 2023, 404, 02005. [Google Scholar] [CrossRef]
- Javaid, A.; Sajid, M.; Uddin, E.; Waqas, A.; Ayaz, Y. Sustainable urban energy solutions: Forecasting energy production for hybrid solar-wind systems. Energy Convers. Manag. 2024, 302, 118120. [Google Scholar] [CrossRef]
- Hassan, Q.; Algburi, S.; Sameen, A.Z.; Salman, H.M.; Jaszczur, M. A review of hybrid renewable energy systems: Solar and wind-powered solutions: Challenges, opportunities, and policy implications. Results Eng. 2023, 20, 101621. [Google Scholar] [CrossRef]
- Mahesh, A.; Sandhu, K.S. Hybrid wind/photovoltaic energy system developments: Critical review and findings. Renew. Sustain. Energy Rev. 2015, 52, 1135–1147. [Google Scholar] [CrossRef]
- Solomon, A.A.; Child, M.; Caldera, U.; Breyer, C. Exploiting wind-solar resource complementarity to reduce energy storage need. AIMS Energy 2020, 8, 749–770. [Google Scholar] [CrossRef]
- Windkraft-Journal. 24 January 2014, Building Design and Construction. Available online: https://www.bdcnetwork.com/urban-wind-and-solar-energy-system-may-actually-work (accessed on 5 May 2025).
- Bluenergy Solar Wind Turbine. Available online: https://www.mwps.co.uk/wind-energy-news/wind-power-news/2020/solar-wind-turbine-the-revolutionary-bluenergy-solarwind-turbine/ (accessed on 10 May 2025).
- Inhabitat, Scientists Develop Solar-Powered Wind Turbine for Ultimate Energy Generation. 4 January 2013. Available online: https://inhabitat.com/scientists-develop-solar-powered-wind-turbine/ (accessed on 10 May 2025).
- Meteoblue.com. Available online: https://www.meteoblue.com/ro/vreme/historyclimate/climatemodelled/bucure%c8%99ti_rom%c3%a2nia_683506 (accessed on 28 October 2025).
- Global Wind Atlas. Available online: https://globalwindatlas.info/en/area/Romania (accessed on 28 October 2025).
- Davis, N.N.; Badger, J.; Hahmann, A.N.; Hansen, B.O.; Mortensen, N.G.; Kelly, M.; Larsén, X.G.; Olsen, B.T.; Floors, R.; Lizcano, G.; et al. The Global Wind Atlas: A high-resolution dataset of climatologies and associated web-based application. Bull. Am. Meteorol. Soc. 2023, 104, E1507–E1525. [Google Scholar] [CrossRef]
- Global Solar Atlas. Available online: https://globalsolaratlas.info/map?s=44.436141,26.10272&m=site&c=44.436141,26.10272,11 (accessed on 28 October 2025).
- Mockmore, C.A.; Merryfield, F. The Banki Water Turbine, Bulletin Series no. 25, 1949, Engineering Experiment Station, Oregon State College. Available online: https://www.pumpfundamentals.com/banki_scan.pdf (accessed on 20 May 2025).
- Burton, T.; Sharpe, D.; Jenkins, N.; Bossanyi, E. Wind Energy Handbook, 2nd ed.; Wiley: Chichester, UK, 2011; pp. 220–309. [Google Scholar]
- Hansen, M.O.L. Chapter 9—Aerodynamics and Design of Horizontal-Axis Wind Turbines. In Wind Energy Engineering—A Handbook for Onshore and Offshore Wind Turbines; Trevor, M.L., Ed.; Elsevier Academic Press: Amsterdam, The Netherlands, 2017; pp. 161–183. [Google Scholar]
- Airfoil Tools. Available online: http://airfoiltools.com/airfoil/details?airfoil=naca4412-il (accessed on 5 May 2025).
- Acharya, N.; Kim, C.G.; Thapa, B.; Lee, Y.H. Numerical analysis and performance enhancement of a crossflow hydro turbine. Renew. Energy 2015, 80, 819–826. [Google Scholar] [CrossRef]
- Wibowo, A.; Tjahjana, D.D.D.P.; Santoso, B.; Situmorang, M.R.C. Study of turbine and guide vanes integration to enhance the performance of cross flow vertical axis wind turbine. AIP Conf. Proc. 2018, 1931, 030043. [Google Scholar] [CrossRef]
- Yahya, Y.; Fahrudin, F.; Martana, B. The Influence of Omni—Directional Guide Vane on the Cross—Flow Wind Turbine Performance. Int. J. Mar. Eng. Innov. Res. 2024, 9, 716–724. [Google Scholar] [CrossRef]
- Pujol, T.; Massaguer, A.; Massaguer, E.; Montoro, L.; Comamala, M. Net Power Coefficient of Vertical and Horizontal Wind Turbines with Crossflow Runners. Energies 2018, 11, 110. [Google Scholar] [CrossRef]
- Adhikari, R.; Wood, D. The Design of High Efficiency Crossflow Hydro Turbines: A Review and Extension. Energies 2018, 11, 267. [Google Scholar] [CrossRef]
- Assefa, E.Y.; Asfafaw Haileselassie Tesfay, A.H. Effect of Blade Profile on Flow Characteristics and Efficiency of Crossflow Turbines. Energies 2025, 18, 3203. [Google Scholar] [CrossRef]
- Fuji Electric, 92W FWAVE Solar Modules. Available online: https://www.scribd.com/document/468906307/Calculationsolar-module-FUJI-FPV1092COM2843 (accessed on 5 May 2025).
- Alnaimi, F.B.I.; Kazem, H.A.; Alzakr, A.B.; Alatir, A.M. Design and implementation of smart integrated hybrid Solar-Darrieus wind turbine system for in-house power generation. Renew. Energy Environ. Sustain. 2024, 9, 2. [Google Scholar] [CrossRef]
- Budea, S.; Simionescu, Ș.M. Solar hybrid system for electricity and air heating—Experimental research. IOP Conf. Ser. Earth Environ. Sci. 2023, 1185, 012001. [Google Scholar] [CrossRef]
- Chrifi-Alaou, L.; Drid, S.; Ouriagli, M.; Mehdi, D. Overview of Photovoltaic and Wind Electrical Power Hybrid Systems. Energies 2023, 16, 4778. [Google Scholar] [CrossRef]
Disclaimer/Publisher’s Note: The statements, opinions and data contained in all publications are solely those of the individual author(s) and contributor(s) and not of MDPI and/or the editor(s). MDPI and/or the editor(s) disclaim responsibility for any injury to people or property resulting from any ideas, methods, instructions or products referred to in the content. |
© 2025 by the authors. Licensee MDPI, Basel, Switzerland. This article is an open access article distributed under the terms and conditions of the Creative Commons Attribution (CC BY) license (https://creativecommons.org/licenses/by/4.0/).