1. Introduction
Climate change and resource depletion have heightened global attention on the construction sector’s environmental impact [
1,
2,
3]. The construction industry consumes large amounts of energy and produces major greenhouse gas emissions, accounting for 30–40% of global energy use, while producing 40% of total CO
2 emissions [
4]. The sector generates environmental impacts through its embedded energy and carbon emissions arising from material extraction, manufacturing, and construction activities [
5]. Construction materials now account for 10% of worldwide emissions, according to current estimates of embodied carbon [
6]. The cement manufacturing process produces between 5% and 8% of total human-generated carbon dioxide emissions, which enter the atmosphere [
7,
8]. The construction of buildings and infrastructure requires climate-friendly solutions because these activities drive economic expansion and urban development [
4,
9,
10]. Addressing embodied emissions is essential alongside operational energy efficiency to achieve carbon neutrality in the built environment [
6,
11,
12].
Despite its significance, there is no standardized global indicator to benchmark countries’ embodied energy use and emissions in construction. Research and policies have focused on operational emissions, including building energy consumption for heating and cooling, but have not given sufficient attention to embodied impacts [
13,
14]. Research on embodied energy and carbon in construction has produced isolated results because most studies focus on individual cases, specific materials, or national data, hindering international comparisons [
11]. The assessment methods and data collection methods create difficulties for comparison because they employ different life-cycle boundaries and emission factors. The lack of dependable tracking systems for construction-related energy and CO
2 reductions prevents sustainability programs across the world from evaluating their national achievements in this area.
The construction sector needs an integrated analytical system that connects material usage to energy consumption and policy creation with carbon emissions from building materials. Research shows that countries exhibit significant variation in their embodied emissions, but scientists have not developed sufficient methods to measure these differences globally [
15,
16,
17]. The lack of standardized measurement tools prevents policymakers and industry professionals from creating reliable performance benchmarks, from understanding the core factors that affect embodied intensity, and from assessing climate change reduction strategies. A standardized global indicator provides essential scientific and practical benefits by enabling worldwide performance assessment, supporting climate policy development, and establishing construction industry carbon-reduction targets. This study develops a global composite index that combines material consumption statistics, energy consumption data, and policy indicators to assess construction-related embedded effects. Multiple international initiatives, including the Global Alliance for Buildings & Construction (GlobalABC) and the International Energy Agency, have sought to measure construction-related carbon emissions. These existing tools do not provide a single approach that integrates material-intensity data with energy-mix information, policy drivers, and embodied emissions, using statistical weighting to yield transparent results. The CEEEI overcomes this gap by combining all relevant factors into a single composite indicator, which PCA generates for benchmarking 148 countries. This evaluation system introduces a new methodological framework that uses embodied energy together with embodied carbon, socioeconomic development, and energy-source structure to create a reproducible assessment method.
The GlobalABC Building Climate Tracker, the IEA Material Efficiency Indicators, the Inventory of Carbon and Energy Database, and the Embodied Carbon in Construction Calculator tool provide valuable information on material and product emissions, but they do not support sectoral cross-country assessments [
18,
19,
20,
21]. The CEEEI stands apart from other indicators because it combines all these factors through a systematic approach. The CEEEI solves this problem through its transparent statistical method, which unites material extraction data with cement process emissions, electricity carbon intensity, policy stringency, and socioeconomic factors. The tools depend on process-based LCA, which creates challenges for national comparison because they use different data boundaries and availability levels. The CEEEI serves as an additional evaluation method that strengthens current assessment systems by enabling worldwide performance comparisons.
This study seeks to fill that gap by developing the Construction Embodied Energy and Emissions Index (CEEEI) and applying it across 148 countries from 2000 to 2023. The objective of CEEEI is to provide a comprehensive, standardized index that captures the multi-dimensional nature of construction sustainability performance. The development of CEEEI combines three sets of data, which measure material usage, energy consumption, and carbon dioxide output with social, economic, and energy production factors to generate a single indicator of total environmental effects. The index uses advanced statistical methods to combine nine performance indicators. CEEEI offers a tool to evaluate and rank national construction sectors on their embodied energy and carbon efficiency. Therefore, this study will address the following question: How can a globally standardized composite indicator capture the embodied energy and emissions performance of national construction sectors over time?
3. Methodology
3.1. Data Sources and Compilation
The CEEEI required a comprehensive database of country–year data from 2000 to 2023 to link material flow data with energy consumption and emissions records, as well as with socioeconomic metrics, within a single analytical system. The dataset obtains its data from four open international sources:
First, the early 2000s mark the beginning of reliable global data reporting for material extraction, cement process emissions, and electricity-generation structures across all four international datasets, which reduces missing-value issues. Second, the research period spanned from the implementation of the Kyoto Protocol to the 2008–2009 economic crisis, culminating in the Paris Agreement in 2015 and subsequent national carbon pricing initiatives. The chosen time frame includes all available data while offering relevant policy information.
All sources were merged by the World Bank’s seven-region mapping:
1—East Asia and the Pacific, 2—Europe and Central Asia, 3—Latin America and the Caribbean, 4—the Middle East and North Africa, 5—North America, 6—South Asia, and 7—Sub-Saharan Africa.
A total of 148 countries with data across 24 years, totaling 3369 country–year observations, was attained.
Table 1 illustrates the equivalent indicators resulting from specific construction methods applied to both original and derived variables.
The selected datasets were chosen because they offer annual global data with complete transparency and reproducibility. The combination of material, emissions, energy, and socioeconomic datasets at the country–year level enables a comprehensive assessment of construction impacts that follows composite index best practices.
The nine indicators for analysis are derived from theoretical frameworks in embodied energy and carbon studies to evaluate three essential aspects of construction sustainability: material intensity, emission intensity, and structural drivers. The extraction of non-metallic minerals and cement production are the leading sources of CO
2 emissions that generate embodied environmental effects in built structures and infrastructure development. This study uses GDP and industrial value-added normalization methods, which follow standard procedures in material-flow and energy-intensity studies to evaluate economic performance [
40,
41]. Furthermore, in line with international life-cycle and decarbonization research, embedded emissions of energy systems are strongly influenced by indicators of the fossil–electricity share and carbon-pricing coverage [
42,
43]. Urbanization and GDP per capita are social factors that scientists link to construction requirements and urban energy consumption in urban-growth theory [
44,
45,
46,
47,
48]. The selected indicators link academic principles to real-world data, which demonstrates their effects on construction energy consumption and carbon emissions. The analysis includes GDP_per_capita_USD and UrbanShare as structural factors that affect embodied intensity, but it does not use them as performance indicators. Research evidence demonstrates that economic expansion, construction requirements, and urban development rates directly increase building-related carbon emissions, including embodied emissions in the construction sector [
49,
50]. Excluding these demand factors would create an index that measures only production aspects, while disregarding vital macrostructural elements that influence embodied carbon emissions.
3.2. Data Cleaning and Validation
The data validation process followed a multi-stage structured approach to achieve both reliability and consistency and enable cross-country data comparison.
All variables were standardized to consistent physical and monetary units (tons, kilograms of CO2, and USD). Missing or duplicated ISO codes were resolved through manual reconciliation.
The research period spanned from 2000 to 2023 because it enabled all available data to be arranged in chronological order.
The IQR method, together with historical national trend analysis, was used to detect extreme values. The analysis converted unfeasible data points to values within the 1st and 99th percentiles to preserve realistic measurement ranges and preserve the original distribution patterns.
Each observation was assigned a Region_Code (1–7) and Region_Name according to the World Bank classification. The manual inspection confirmed that the system correctly identified regions and maintained uninterrupted data connections across different countries in the multi-country series.
The SPSS platform conducted diagnostic screenings on the data after the data refinement process was completed.
The validation process shows that the dataset maintains internal consistency and enables cross-country and time-series comparisons through appropriate PCA and regression analysis methods. The multi-stage cleaning process follows established methods for composite indicator development, thereby minimizing the risk of estimation errors arising from different data sources. The final dataset contains 148 countries across 24 years with 3369 total observations.
Section 4 uses this dataset as its empirical base for statistical analysis.
3.3. Statistical Analysis
All statistical analyses were conducted in IBM SPSS, Version 29, using descriptive statistics, PCA, composite index calculation, trend analysis, ANOVA, and regression. This study followed the analytical procedures detailed in [
51,
52].
3.3.1. Descriptive Statistics
The following section presents descriptive statistics for all nine indicators before starting the multivariate analysis. The analysis shows that each variable has distinct mean and standard deviation values, indicating significant differences between countries. The observed patterns in the data demonstrate significant differences in material and emission intensities, as well as in the energy mix and socioeconomic conditions, across the 3369 observations, thereby validating the empirical basis of the CEEEI.
3.3.2. PCA
A Principal Component Analysis (PCA) was employed to reduce intercorrelations among indicators and identify latent dimensions underlying embodied energy and emissions intensity. Each variable
was first standardized:
where
and
denote the mean and standard deviation of indicator
j.
The correlation matrix
R was then decomposed as
The model represents eigenvector and eigenvalue components through
and
for each component
k [
52]. The analysis retained components with eigenvalues greater than 1, and Varimax rotation enhanced understanding of the results while maintaining complete variance explanation.
The data-driven PCA method determined indicator weights through an objective process that eliminates human bias while revealing the main variance patterns across countries. The z-score standardization process ensures all indicators have equal influence in the analysis by establishing a common measurement base that aligns with standard composite index practices. The component scores received variance–proportional weights after rotation, so components with higher variance contributed more to the final index.
The KMO value (0.633) exceeded 0.6, and Bartlett’s Test of Sphericity (
χ2 = 14,274.895,
p < 0.001) showed that PCA was appropriate for analysis [
51]. The three components together accounted for 72.1% of the total variance, which included the following:
- (1)
Economic–Urban Development and Carbon Governance;
- (2)
Industrial Carbon and Material Intensity;
- (3)
Energy Source and Decarbonization Structure.
The component scores (FAC1_1, FAC2_1, FAC3_1) were exported for index construction.
3.3.3. CEEEI and CEEEIadj
The CEEEI combines the three rotated components through weights that correspond to their explained variance percentage:
The final index combines data on embodied energy and emissions intensity into a single measurement. The index shows environmental impact through its numerical values, with higher scores indicating greater environmental strain and lower scores indicating better decarbonization and efficiency.
The dataset required filtering to include only countries that met three conditions: GDP exceeding USD 50 billion, population exceeding 1 million, and GDP per capita exceeding USD 5000 throughout the 2000–2023 period. The established thresholds maintained analytical strength by excluding small economies, which produced unreliable data and exhibited abnormal fluctuations in their material and emission outputs per person. The selection of the GDP > USD 50 billion, population > 1 million, and GDP per capita > USD 5000 thresholds aimed to eliminate nations with unstable per capita and per GDP intensity values due to their small economic size, specialized economic structures, and limited population. The small economic size of these micro-economies produces statistical instability, which affects PCA results and makes it difficult to compare different countries. The established thresholds follow global sustainability index standards to generate indicators that reflect actual structural performance rather than distortions related to economic size. The application of these thresholds makes CEEEI
adj more reliable and easier to interpret across the 148 countries in the analysis. The standardized adjusted form of CEEEI received the following expression:
The index shows better performance through lower CEEEIadj values.
The weighting and normalization approach follows established guidelines for composite index development in multivariate sustainability assessments [
51,
52].
Interpretation of CEEEIadj ranking:
Low CEEEIadj (top 10 countries): These countries exhibit superior performance in managing embodied energy and CO2 emissions within their construction sectors. They typically achieve higher construction output with lower material and energy inputs per unit of output. These economies use advanced technology systems that optimize material use, operate on clean energy, and enforce strict environmental protection standards.
High CEEEIadj (bottom 10 countries): These countries demonstrate weak performance, as evidenced by their elevated embodied energy consumption and emissions. The construction industry in these countries consumes more resources and produces more carbon emissions due to traditional building methods, reliance on fossil fuels, and fast-paced urban development.
The CEEEI serves the primary function of creating a scientific benchmarking system that enables cross-country comparisons of construction impacts through its complete assessment of multi-dimensional factors. The CEEEI system enables countries to assess their position relative to others, identify the core elements driving high construction material use, and track their progress toward sustainable carbon-reduction goals.
The CEEEI included structural indicators together with socioeconomic data and policy metrics because these elements have solid theoretical foundations. Research on embodied carbon shows that GDP growth, along with urbanization, leads to higher consumption of cement, steel, and non-metallic minerals. In contrast, policy tools and power generation carbon intensity determine the environmental impact of each production unit [
53,
54,
55,
56].
The CEEEI is a useful tool because it converts complex multi-factor data into a single indicator of construction intensity. The index enables policymakers to track performance indicators that reveal critical factors affecting their decarbonization goals and operational efficiency. The index enables researchers to develop tailored low-carbon construction strategies for specific areas while serving as both a diagnostic tool and a strategic planning instrument for sustainability transitions.
3.3.4. Trends Analysis
This study examined how embodied energy and emission intensity patterns evolved worldwide and across different regions from 2000 to 2023. The annual mean CEEEI values were used to monitor performance patterns and assess how the Paris Agreement affected construction sector outcomes. The research team applied standardized scores to analyze trends because this method enabled them to compare different countries on an equal basis.
3.3.5. ANOVA
A one-way Analysis of Variance (ANOVA) was performed to test whether mean CEEEI values differed significantly across the seven World Bank regions. Homogeneity of variances was examined using Levene’s test, and significant F-statistics (
p < 0.05) were followed by Tukey HSD post hoc comparisons to detect inter-regional differences. The method enabled strong sustainability performance assessments across different economic and geographic areas [
51]. The evaluation of country groups revealed specific areas that maintained high or low embodied energy intensities, demonstrating how different construction methods operate across regions.
3.3.6. Regression Analysis
To identify determinants of embodied intensity, a multiple linear regression model was estimated using CEEEI as the dependent variable:
The model used Ordinary Least Squares (OLSs) to find its parameter values. The model adequacy was evaluated through the use of
R2 values, adjusted
R2 values, and F-test statistical significance. The residual plots analysis showed that the data followed a normal distribution and had equal variance between groups, and the multicollinearity test indicated tolerance values above 0.10 and VIF values below 10 [
51]. The regression model examined how economic prosperity, urbanization, and energy composition affect national construction sustainability results.
4. Results and Discussion
4.1. Descriptive Statistics
The descriptive analysis in
Table 2 shows the main statistical characteristics of the essential variables from the CEEEI dataset, which includes 3369 valid country–year observations spanning from 2000 to 2023. The examined indicators measure material use, energy consumption, and emissions, as well as socioeconomic factors that determine the environmental impact of construction activities across different regions.
The NMM_pc_t showed a mean of 4.780 tons per person, but its standard deviation was 5.276 tons, indicating that material consumption intensity varied widely across countries.
The CemCO2_pc_t recorded 0.127 tons of CO2 per person, but its standard deviation was 0.161 tons, indicating substantial variation in carbon emissions across regions. The average emission level remains below that of industrialized nations because several countries use less cement in their construction or follow environmentally friendly building methods.
When normalized by economic activity, CemCO2_perGDP_kgUSD averaged 0.022 kg CO
2 per USD, while CemCO2_perIndVA_kgUSD recorded a higher mean of 0.087 kg CO
2 per USD. The two economic normalizations differ in their economic importance because construction activities dominate the national economy. The industrial sectors of countries with limited manufacturing activities produce high emissions per industrial facility, although their national average industrial emissions remain moderate. The indicators show moderate to high variability, as indicated by their standard deviations of 0.031 and 0.124, respectively. The indicators show different levels of decarbonization progress and cement-processing efficiency across nations. The global cement production process emits 1.5 Gt CO
2 annually, accounting for 4% of total fossil fuel CO
2 emissions, highlighting a major problem in materials manufacturing [
36].
The NMM_perIndVA_kgUSD had a mean of 3.047 kg per USD and a standard deviation of 3.425, indicating that countries have significantly different material-use efficiency. The construction sector achieves higher productivity and material circularity with lower ratios, whereas higher ratios indicate material-intensive, less efficient economies. Together, the NMM- and CO2-intensity indicators provide the quantitative foundation for the composite CEEEI, which is derived later through PCA.
Studies show that embodied impacts depend strongly on the carbon intensity of energy supplies, which varies across material supply chains [
33]. The FossilShare averaged 60.94% (SD = 34.62) across all countries, with values ranging from minimal in renewable-based nations to complete dependence in fossil fuel-exporting countries. The average value of CarbonPriceCoverage_shareCO2 for CO
2 emissions was 11.11% but showed significant variation across countries due to different carbon-pricing implementation rates (SD = 24.18%). These study variables enable scientists to examine how different energy patterns in buildings affect national programs to reduce carbon emissions.
This study indicated that different parts of the world had distinct economic and social patterns. The GDP_per_capita_USD values across all observations averaged USD 14,781, with significant variation (SD = USD 20,953) between low-income developing countries and high-income industrialized nations. The UrbanShare measurement showed 58.46% (SD = 23.51), indicating that urban populations accounted for more than half of the total population, but the results varied across different urban development stages and construction requirements. Research studies have identified identical macro-drivers that cause territorial CO
2 emissions to increase when cities expand, and people earn more money, without any supporting policies or changes in energy sources [
57].
The wide range of standard deviations across variables makes PCA an effective method for uncovering hidden relationships in embodied energy and emission-intensity data. The indicators serve as measurable data, enabling the assessment of worldwide construction sustainability performance gaps and generating the CEEEI for regional benchmarking.
4.2. PCA
To identify the latent dimensions underlying the interrelationships among the nine core indicators of the CEEEI, a PCA was performed using the Varimax rotation. Data suitability was verified through sampling adequacy tests and correlation diagnostics before the extraction process began. The KMO statistics exceeded 0.633, which fulfilled the minimum requirement of 0.60 for multivariate reduction data validation (see
Table 3) [
51]. Bartlett’s Test of Sphericity produced a chi-square value of 14,274.895 (df = 36,
p < 0.001), which showed that the correlation matrix was not an identity matrix and that the variables shared enough intercorrelations to support PCA.
4.2.1. Communalities and Shared Variance
The extracted components were derived from variables with communalities ranging from 0.532 to 0.883 (see
Table 4). The analysis showed that CemCO2_perIndVA_kgUSD (0.883) and CemCO2_perGDP_kgUSD (0.840) had the highest communalities, indicating that these indicators captured the main factors explaining construction sector embodied emissions. The latent factor space contained strong economic and energy structure effects because FossilShare (0.832) and GDP_per_capita_USD (0.759) showed high common variance. The two variables, NMM_perIndVA_kgUSD (0.532) and CarbonPriceCoverage_shreCO2 (0.605), showed lower communalities because they exhibited different patterns across countries and were not strongly correlated with the main factors.
4.2.2. Component Extraction and Total Variance Explained
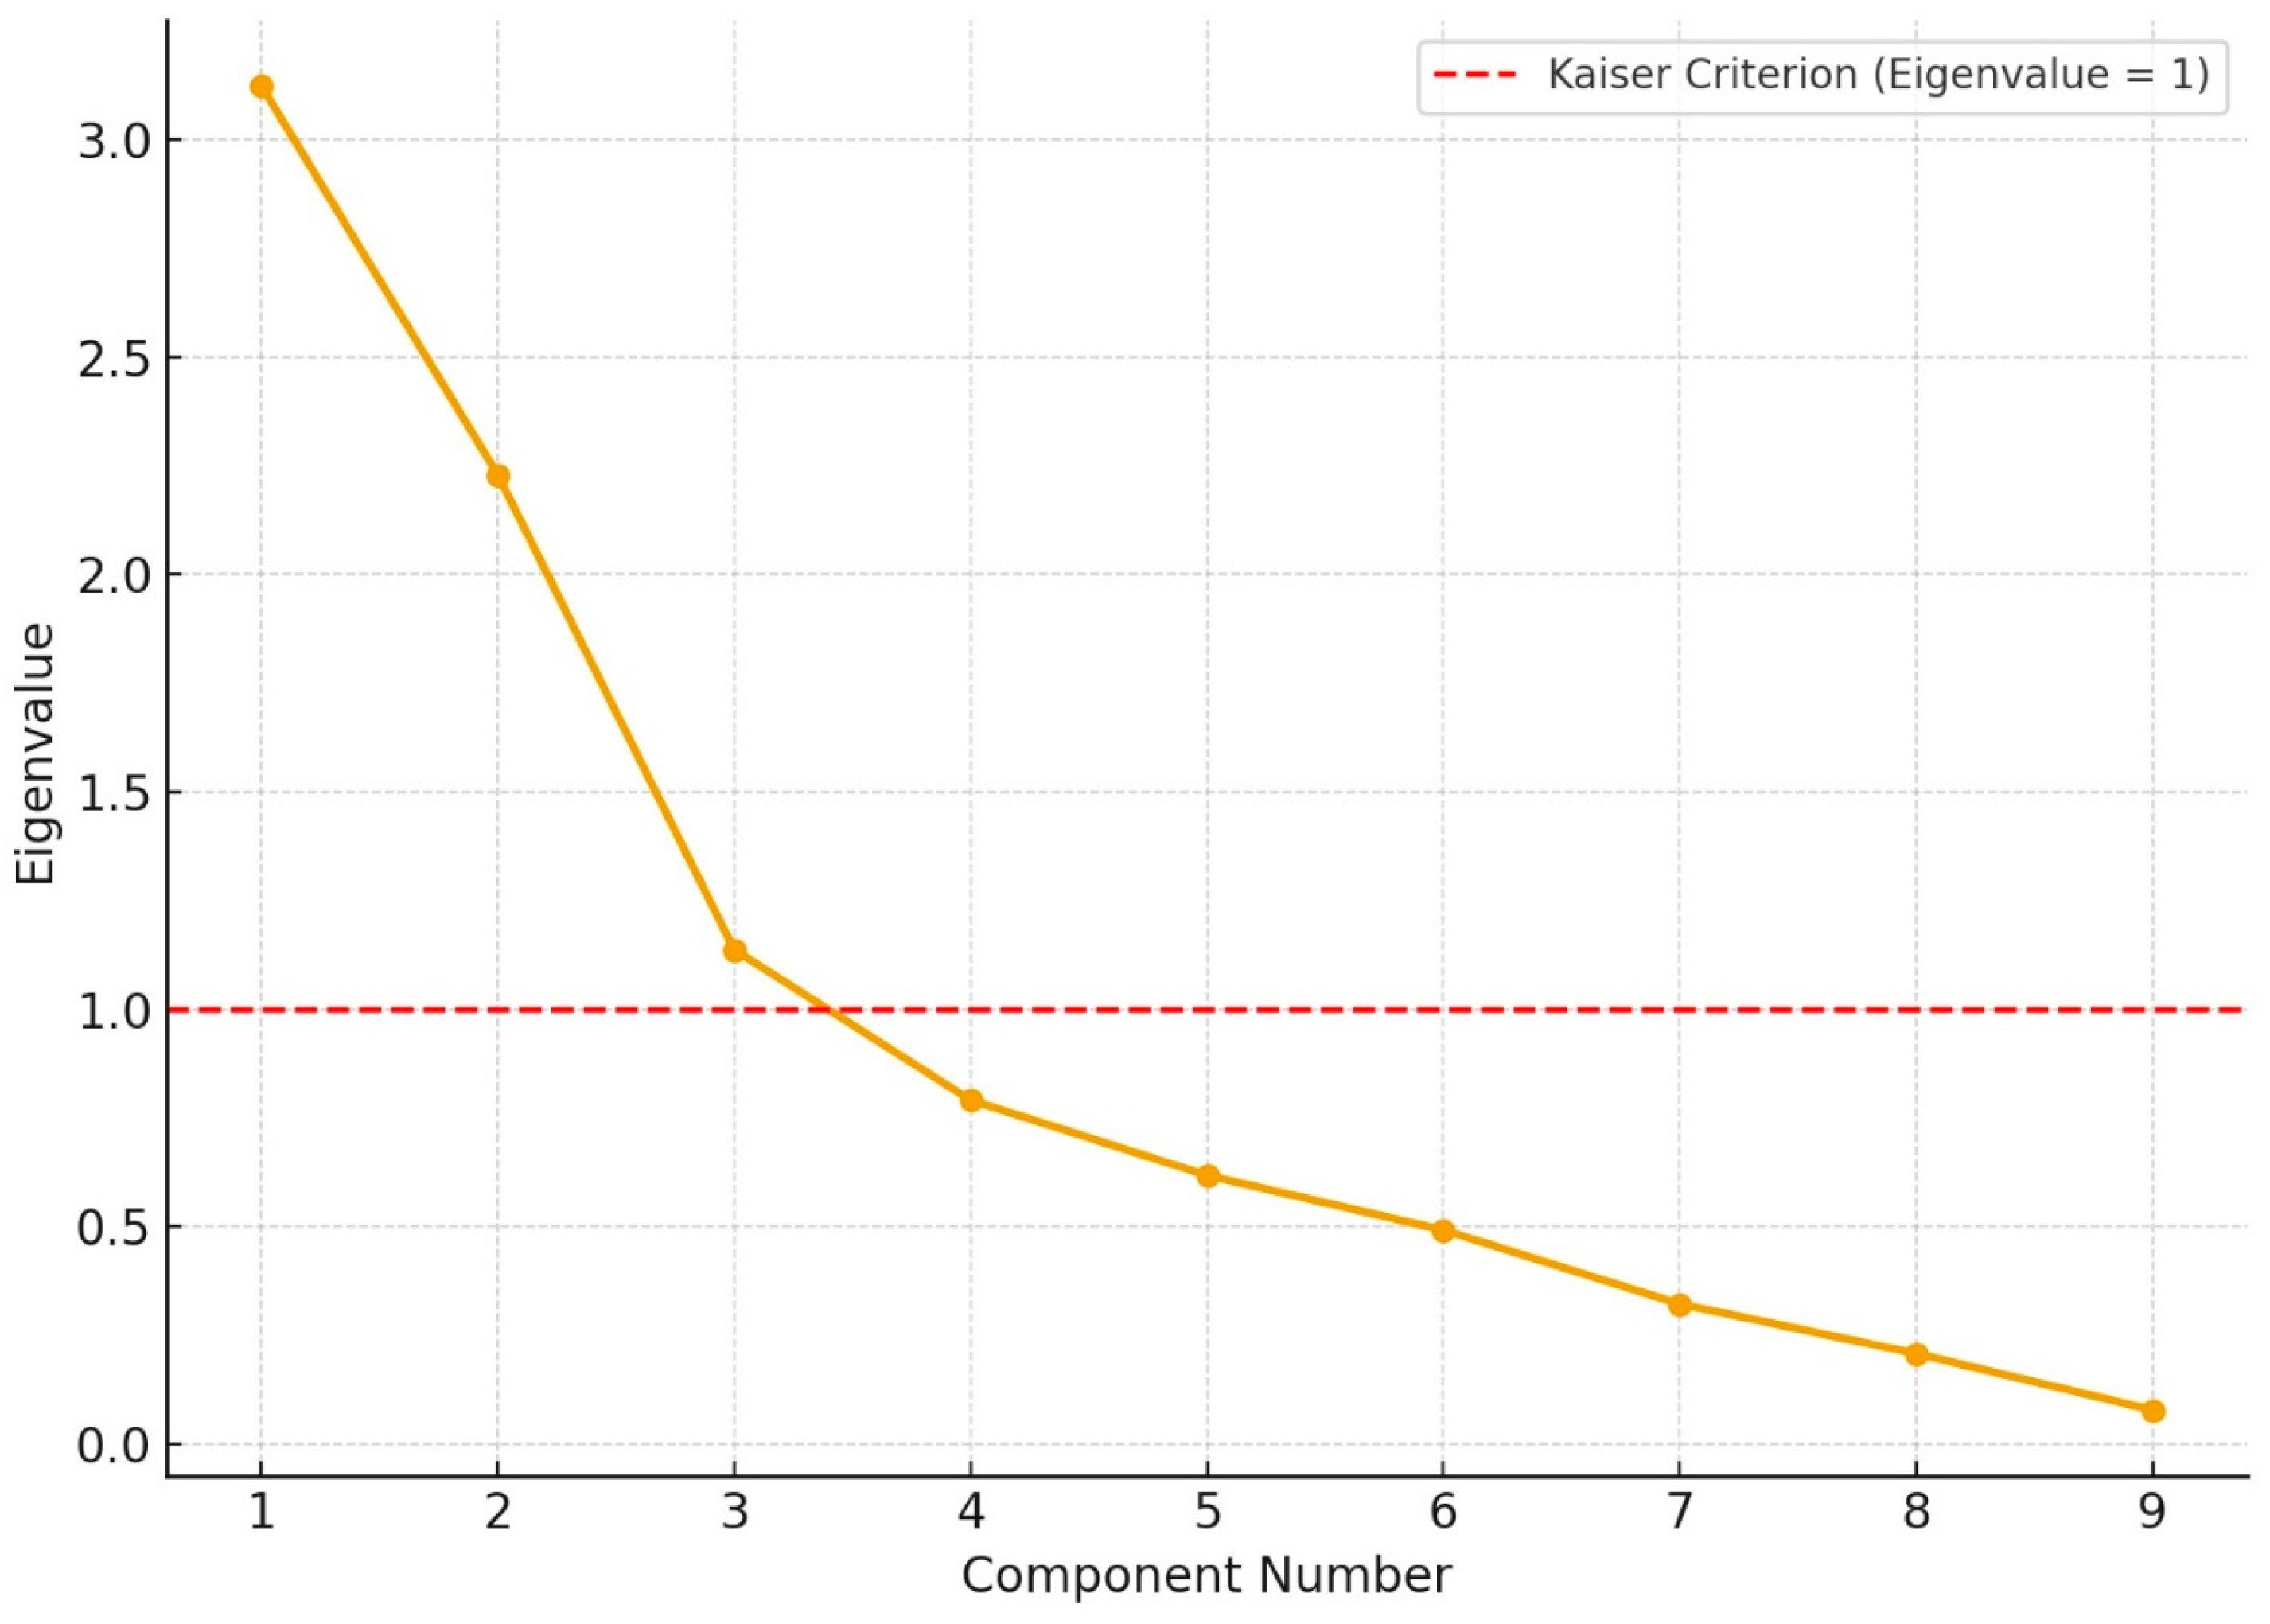
The Kaiser criterion (eigenvalues > 1) indicated that three principal components should be retained, accounting for 72.1% of the total variance in the dataset (see
Figure 1 and
Table 5). The first component had an eigenvalue of 3.123 and accounted for 34.7% of the variance, the second component accounted for an additional 24.8%, and the third component accounted for 12.6%. The strong cumulative variance indicates that the extracted components successfully captured most of the systematic variation in the CEEEI dataset, enabling effective dimensionality reduction and interpretation.
4.2.3. Interpretation of the Rotated Component Structure
The Varimax rotation required four iterations to converge, yielding a component matrix with an easy-to-understand factor structure (see
Table 6). Using PCA to derive composite sustainability indicators is well-established for multi-indicator benchmarking [
58].
The hidden factor, which includes the FossilShare and CarbonPriceCoverage_shreCO2 indicators, shows distinct patterns between them but still reveals international connections. The component shows negative policy stringency loadings alongside positive fossil use loadings because many countries depend heavily on fossil fuels while implementing limited carbon pricing. The PCA model detects this opposing system because nations with carbon-intensive power systems do not adopt policies to reduce their fossil fuel use. The factor shows no indication of mixed cause-and-effect relationships, as it contains a single structural pattern linking weak governance to increased fossil fuel consumption to raise embodied intensity.
The component demonstrated strong positive correlations with GDP_per_capita_USD (0.784), UrbanShare (0.756), NMM_pc_t (0.817), and CarbonPriceCoverage_shreCO2 (0.590), indicating it measures nations with advanced economies and dense cities, high material use, and broad carbon pricing systems. The component shows how socioeconomic development and policy maturity affect embodied construction energy by examining urban development and official decarbonization programs.
The indicators show a moderate level of connection, suggesting that societies with economic development and urbanization patterns tend to develop carbon regulation systems and increase material use for building new infrastructure and updating existing systems.
The second factor is dominated by exceptionally high loadings on CemCO2_perGDP_kgUSD (0.910), CemCO2_perIndVA_kgUSD (0.938), and NMM_perIndVA_kgUSD (0.707). This cluster describes the production-side efficiency and intensity of the construction and industrial sectors. The positive scores indicate that these economies base their industrial output on material- and emission-intensive manufacturing processes, driven by less efficient production methods and restricted technological progress in cement and material production.
The third component showed strong weightage on FossilShare (0.908), while CarbonPriceCoverage_shreCO2 received a negative loading of −0.456. The assessment component determines national energy system dependence by evaluating countries that use fossil fuels without carbon pricing systems and assigning them high rankings. The scoring system indicates that nations that receive low marks have begun using renewable energy systems and expanded their emission control regulations. This factor thus represents the structural energy decarbonization gap between economies still dependent on conventional fuels and those adopting low-carbon energy pathways.
The three extracted components match exactly with current theoretical models, which explain how construction activities generate embodied carbon. The “Economic–Urban Development and Carbon Governance” factor demonstrates how construction demand adjusts to GDP expansion and urban expansion, yet faces challenges from regulatory frameworks. The “Industrial Carbon and Material Intensity” factor aligns with the core production-based mechanisms described in embodied-carbon theory, which show that cement production and material processing efficiency determine environmental outcomes. The “Energy Source and Decarbonization Structure” factor demonstrates how construction supply chains face rising embodied emissions because they operate through power grids that depend on fossil fuels.
The PCA factors reveal statistical patterns in the data rather than following predefined categories [
59]. The data covariance matrix produces the identified intervals and component boundaries through its statistical analysis. The method follows established composite index research, which employs PCA to create unbiased weights and hidden patterns [
60,
61,
62]. The factor loadings show how different drivers, including embodied material and energy and socioeconomic elements, relate to each other at the global scale. The original factor interval settings were retained because these conditions yielded the highest variance explained while maintaining orthogonality and achieving internal statistical stability.
4.3. Lowest/Highest 10 Countries According to CEEEIadj Values
The final CEEEI
adj rankings reveal substantial variation in the efficiency and sustainability of national construction sectors among high-income and upper-middle-income economies during 2000–2023. The 10 countries with the lowest CEEEI
adj values—including the United Kingdom, the Netherlands, Singapore, New Zealand, Switzerland, Sweden, Mexico, Germany, Austria, and the United States—represent economies demonstrating superior performance in managing embodied energy and CO
2 emissions (see
Table 7). These countries achieve comparatively high construction output while maintaining lower material and energy inputs per unit of output. Their construction industries use advanced technologies that combine digital design with precision material management and modular construction systems to reduce waste. The economies function within power systems that have achieved decarbonization through renewable energy sources, which generate more than 40% of their electricity, and strict environmental rules for performance assessment. These countries demonstrate that high construction productivity can coexist with low embodied energy intensity, as they have achieved advanced environmental governance through effective policy implementation. The data show that whole-life/embodied shares increase when operational emissions decrease in developed nations [
63].
The 10 countries with the highest CEEEI
adj scores, which include Saudi Arabia, the United Arab Emirates, Qatar, Oman, Ireland, Greece, Israel, Kuwait, Portugal, and Canada, show adverse results because they use more embodied energy while producing more emissions (see
Table 8). Their construction sectors rely heavily on traditional, resource-intensive methods, extensive use of cement and non-metallic minerals, and fossil fuel-dominated energy systems. The index ranks Gulf economies at the top because their urbanization has accelerated rapidly due to population growth, industrial expansion, and national development initiatives. These countries’ high CEEEI
adj values are therefore not purely indicators of inefficiency but also of developmental dynamism and intensive material demand. The ongoing use of carbon-based resources requires immediate policy intervention to establish clean energy systems, circular material management, and green building regulations.
The results for specific countries need interpretation, as the United States and Germany show lower CEEEIadj scores, while Canada shows higher values. Canada maintains one of the cleanest electricity systems in the world. Still, its extraction rates for construction materials remain high due to long-distance aggregate transportation and elevated construction needs per person, which together increase total embodied energy consumption per economic unit. The United States and Germany achieve lower embodied intensity through industrial efficiency, blended cement use, and construction manufacturing powered by renewable electricity, even though their supply chains produce carbon emissions in other business sectors. The CEEEIadj measures total system-wide embodied effects relative to economic and population factors, rather than focusing solely on energy sector carbon emissions. This index shows actual structural differences between countries rather than producing false results.
The CEEEIadj values show a distinct north–south sustainability pattern: European and Pacific nations with developed economies exhibit low embodied emission intensities, whereas hydrocarbon-based, fast-growing nations maintain higher values. This study confirms that worldwide construction expansion faces a major challenge in meeting sustainability targets, as it demands new technologies and updated regulations to achieve carbon neutrality across all construction sectors.
The CEEEI
adj results were compared with several databases and reports, including those of the European Commission, the International Energy Agency, the German Environment Agency, the World Economic Forum, and the European Cement Association. The Gulf countries achieved high CEEEI
adj scores because their cement market expanded quickly. At the same time, Saudi Arabia operated at high clinker production levels, and the Middle East and North Africa region generated most of its electricity from oil and natural gas [
64,
65,
66,
67]. The United Kingdom, Germany, and the Netherlands maintain low CEEEI
adj rankings because they function within a European cement system that uses 76% clinker-to-cement ratios and supports the use of low-clinker blended cements. At the same time, their power generation depends on renewable energy sources [
67,
68,
69,
70,
71,
72,
73]. Analysis across different global sources shows that CEEEIadj aligns with established embodied-carbon inventories through its system-based evaluation method.
4.4. Trends Analysis
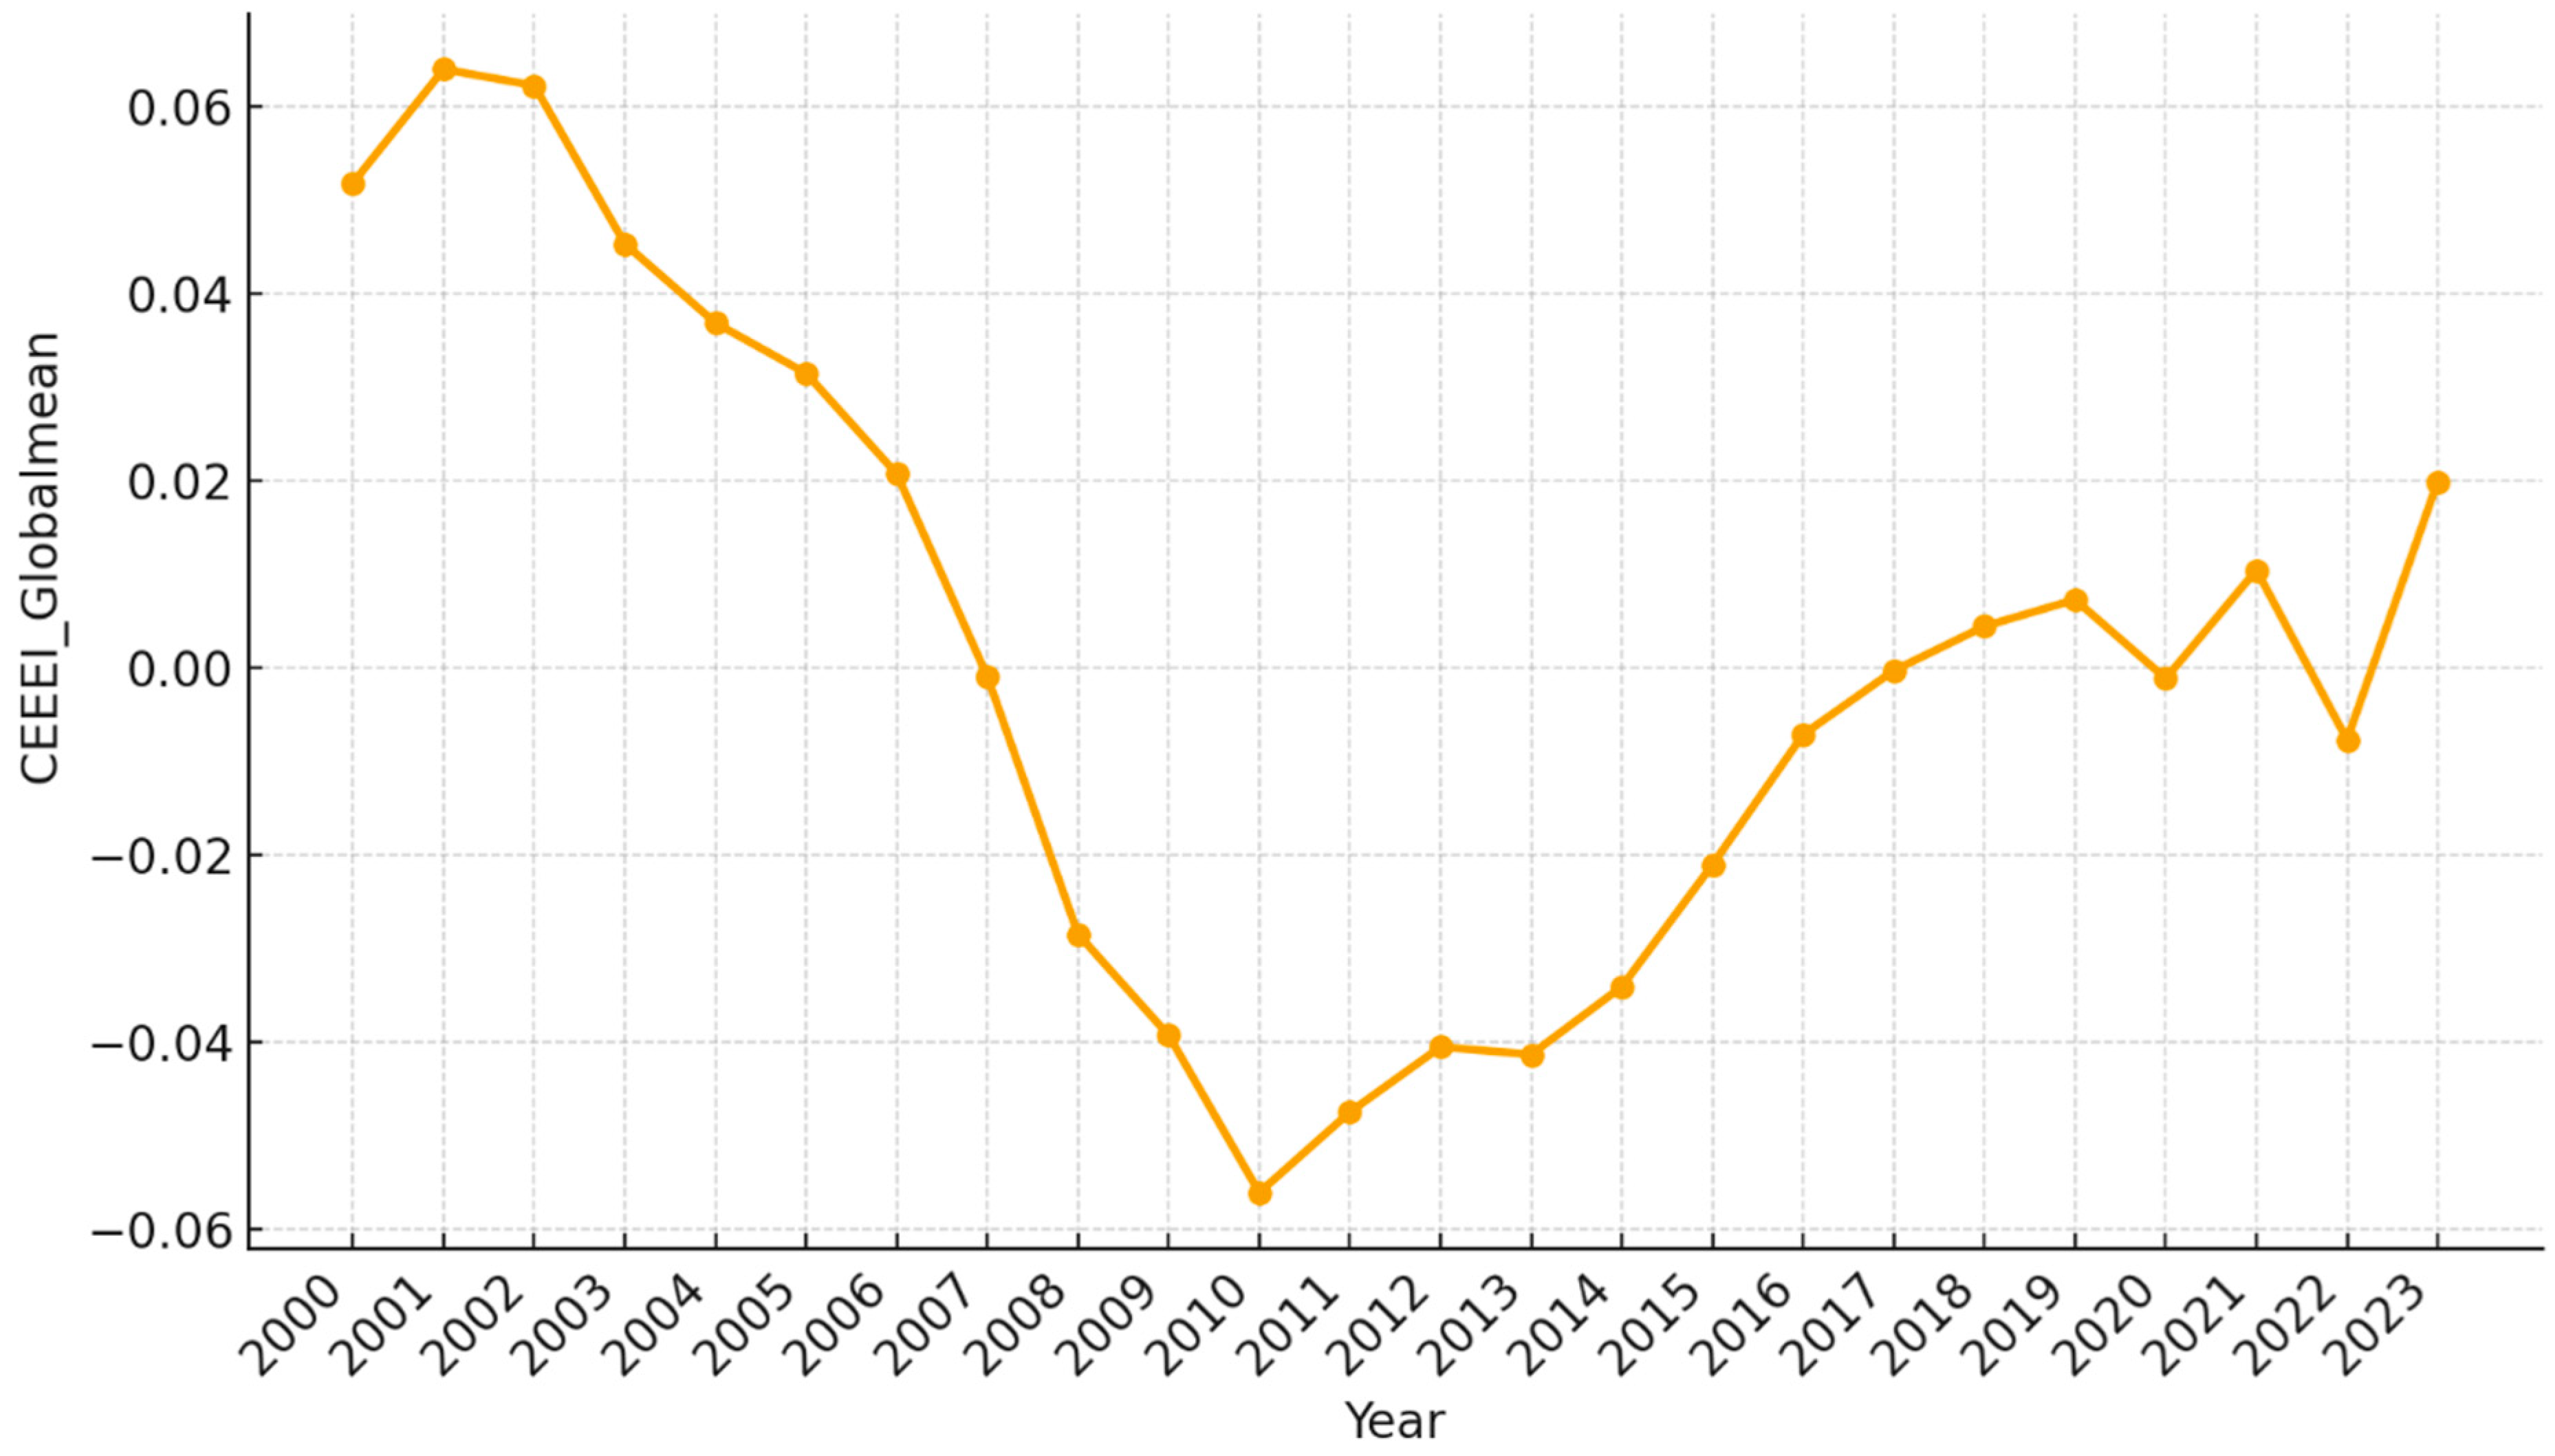
The “Global Mean CEEEI” in
Figure 2 represents the unweighted arithmetic mean of all country-level CEEEI values throughout each year. The method of aggregation in this study follows standard practices for global composite indexes, which use equal weighting to identify structural differences between countries instead of calculating total values [
74]. For example, the Environmental Performance Index and other environmental benchmarking tools use unweighted arithmetic means to achieve comparability between different national settings in their composite sustainability index calculations [
75,
76]. The global mean CEEEI showed distinct time-based patterns from 2000 to 2023, revealing how international construction activities affected material consumption and economic development. The global mean CEEEI shows an increasing trend from 2000 to 2002, reaching its first peak at 0.0639 in 2001. The construction processes showed increased embodied energy and emission intensity during the early 2000s. The market experienced a fast-paced infrastructure development boom in emerging nations, while East Asia maintained strong cement and non-metallic mineral consumption during this time.
The CEEEI showed an initial increase, followed by a steady downward trend from 2003 to 2010. The global average reached its lowest point in 2010, when the index fell to −0.0562 below the mean, establishing the global minimum of embodied intensity. The downward trend indicates improved material and process efficiency, the adoption of clean technologies, and the spreading of energy transition practices across construction supply chains. The global financial crisis of 2008–2009 likely caused this decline by reducing construction activity and material processing, leading to short-term decreases in embodied energy and emissions per production unit. The CEEEI value decreases as construction volume declines, but this does not imply the construction sector has lower embodied intensity, as it reflects lower material use per unit of population, GDP, and industrial activity. The index shows better embodied carbon efficiency through its trend rather than decreased construction activities. The construction sector’s size in an economy does not guarantee low CEEEI values, because its material extraction and cement-related emissions must be less carbon-intensive than its other economic activities. The construction sector’s reduced output between 2003 and 2010 resulted from improved material use, lower cement production, reduced energy consumption, and cleaner power generation systems that entered service across different areas. The index standardizes economic and demographic information to prevent small construction output from being misinterpreted as excellent performance.
The CEEEI showed a moderate growth pattern from 2011 onward, with a rising mean value peaking around 2019, followed by fluctuations from 2019 to 2023. The rebound indicates that construction activities and industrial operations have resumed, as middle-income nations are using their investments to support sustainable development initiatives that drive urban growth. The positive recovery did not reach the early-2000s production levels, which remained higher than post-2015 output. The global embodied energy efficiency showed long-term structural improvement, as post-2015 levels remained below early-2000s production peaks.
The period after 2016 aligns with several international policy milestones, including the adoption of the Paris Agreement and a growing emphasis on low-carbon construction practices, which may have contributed to stabilizing the global CEEEI. The post-2019 period shows small changes because different regions experienced varying levels of COVID-19 recovery, leading some to invest in green infrastructure while others to use traditional resource-based construction for economic stimulation. The index showed a near-zero return relative to global averages by 2023, indicating that high- and low-efficiency economies were approaching equality. However, construction output still needed to be fully decoupled from its embodied energy and emissions.
The 24-year period shows that construction sector efficiency has been improving worldwide, though it has experienced periodic fluctuations due to economic downturns and government actions. The downward trend, followed by partial recovery, shows that material and emission intensities have decreased. Still, permanent investment in carbon pricing, renewable energy, and circular construction practices must continue to achieve lasting reductions in embodied energy and CO2 emissions globally. The trend analysis validates the PCA-based CEEEI framework over time, indicating that the extracted factors capture actual changes in worldwide construction sustainability performance.
The time-based patterns show how different structural elements operate in the system: The period from 2003 to 2010 saw improvements driven by worldwide energy-efficiency initiatives, lower clinker use, and reduced building construction during the financial crisis. The construction industry experienced rapid growth in emerging markets after 2011, which led to increased CEEEI values. The CEEEI values in fossil-dependent areas remain high because these regions maintain rigid energy systems and produce large amounts of cement. At the same time, their industrial networks lack the ability to reduce carbon emissions.
4.5. ANOVA
To assess whether the CEEEI varies significantly across global regions, an ANOVA was conducted using the seven predefined World Bank regional classifications. This study examined whether material efficiency, emission intensity, and decarbonization readiness differ significantly across geographic areas.
4.5.1. Homogeneity and Overall Model Significance
The Levene’s Test for Homogeneity of Variances produced a significant result (
F = 49.067,
p < 0.001), which shows that the regions have different levels of variance (see
Table 9). The ANOVA results indicated that the mean CEEEI values between groups differed significantly at a
p < 0.001 level (
F(6, 3097) = 278.68) (see
Table 10). The between-group variance (SS = 208.73) indicates that regional factors explain most of the total variation in CEEEI, suggesting a significant impact on embodied energy and emissions performance.
4.5.2. Post Hoc and Subgroup Comparison
The Tukey HSD post hoc test further confirmed that most regional mean differences were statistically significant at the 0.05 level (see
Table 11). The pairwise comparisons showed particularly large and significant mean gaps between the Middle East and North Africa and all other regions (mean differences ranging from 0.477 to 0.917,
p < 0.001), highlighting the region’s distinct outlier status in embodied intensity. The analysis revealed substantial differences between Sub-Saharan Africa and Europe and Central Asia, and between Sub-Saharan Africa and North America, with mean differences of −0.427 and −0.440, respectively, at
p < 0.001. This study demonstrated how industrialized nations with high emission rates differ from developing countries with minimal energy consumption.
The homogeneous subset analysis grouped the regions into five statistically distinct clusters based on mean similarity (α = 0.05). The lowest subset consisted of Sub-Saharan Africa alone (mean = −0.2763). At the same time, Latin America and the Caribbean, East Asia, and the Pacific formed an intermediate group with moderate negative scores. The South Asian region maintained positions close to the global average, while Europe, Central Asia, and North America demonstrated superior efficiency levels, forming the fourth group. The Middle East and North Africa remained isolated as the highest-mean cluster, well above the others. The distinct layers of construction activities demonstrate how sustainability levels in construction projects vary across regions, from low-capacity areas with minimal construction activity to high-capacity areas with abundant resources and high energy use.
4.5.3. Interpretation and Implications
The ANOVA results show that construction sustainability levels vary substantially across geographical areas. High mean CEEEI values in the Middle East and North Africa reflect the dominance of carbon- and energy-intensive materials (cement, steel, and glass) and limited penetration of carbon pricing or renewable energy substitution in construction processes. The low or negative mean CEEEI values in Sub-Saharan Africa and Latin America result from limited industrial development and decreased material usage per person, but do not indicate superior environmental management. The European and North American regions received moderate positive ratings because their industrial development matches their ability to achieve efficiency improvements through decarbonization programs, enhanced building standards, and waste material reuse systems.
The study’s findings demonstrate that construction projects achieve their best embodied energy and emissions results through three main factors: regional economic structure, energy mix, and policy environment. The statistically significant regional differences (p < 0.001) support the CEEEI’s conceptual premise that global disparities in embodied environmental intensity are systematically linked to regional development pathways. The results demonstrate that different regions need their own decarbonization plans, which should focus on enhancing energy efficiency in the construction industry across the Middle East and North Africa, implementing carbon pricing across emerging markets, and developing circular construction methods for fast-growing urban areas.
The study results demonstrate that using a single indicator system across different regions can lead to estimation errors because these regions differ in architectural styles, building types, and levels of industrial development. The Middle East uses reinforced concrete as its primary building material, whereas European and North American regions use timber and mixed-material systems. The evaluation of CEEEI values needs to take into account local conditions, as structural components yield varying results from what actually represents inefficiency levels. This study indicates that specific decarbonization plans should be developed for each region, as their unique architectural, industrial, and climatic characteristics must be taken into account. The Middle East and North Africa stand out as outliers because they use excessive amounts of cement per person and build extensive concrete structures while relying entirely on fossil fuels for power generation and industrial heating. The low CEEEI values in Sub-Saharan Africa stem from limited industrial and construction activities rather than environmental sustainability achievements. This study shows that CEEEI values need to be evaluated for specific local structural components and energy system properties rather than used for performance assessment. The CEEEI maintains its global benchmarking value despite this point because it requires analyzing regional structural elements to understand the origins of embodied intensity.
4.6. Regression Analysis
To identify the principal determinants of embodied energy and emissions intensity in the global construction sector, a multiple linear regression analysis was conducted with the CEEEI as the dependent variable. The predictors included GDP_per_capita_USD, UrbanShare, and FossilShare. The model used the Enter method, introducing all predictors simultaneously to examine their individual and collective effects on national CEEEI scores.
4.6.1. Model Fit and Significance
The ANOVA results indicated that the complete regression model was statistically significant, with an F(3, 3100) value of 368.4 and a
p-value of <0.001 (see
Table 12). The model explained 26.3% of the total variance (
R2 = 0.263) in the CEEEI, indicating that nearly one-quarter of the observed variability in global embodied energy and emission intensity can be attributed to differences in economic prosperity, urbanization, and energy mix across countries. The adjusted
R2 (0.262) indicates excellent model stability and minimal overfitting. The standard error of estimate (0.376) indicates that the model produces reliable predictions when applied to macro-level cross-country data. The research data shows that the regression model successfully detects various macroeconomic and structural factors that impact construction sustainability performance.
4.6.2. Influence of Individual Predictors
The three predictors showed positive relationships with CEEEI at the 0.001 significance level, indicating that GDP_per_capita_USD growth, UrbanShare, and FossilShare consumption are associated with higher construction-sector embodied energy and emissions intensity.
GDP_per_capita_USD (
B = 2.324 × 10
−6,
β = 0.107,
t = 5.628,
p < 0.001): Economic development creates a small yet important positive effect on CEEEI. The embodied energy and emissions intensity in higher-income countries rise because their construction projects involve complex designs, use more energy-intensive materials, such as cement, glass, and steel, and build infrastructure with advanced specifications. However, the relatively low standardized beta indicates that while economic growth raises embodied intensities, its effect is smaller than that of social and energy factors. This study confirms the Environmental Kuznets hypothesis because economic growth initially leads to increases in material consumption and emissions before achieving decoupling through improved efficiency and technological advancements [
77,
78,
79].
UrbanShare (B = 0.007, β = 0.356, t = 18.636, p < 0.001): The analysis shows that urbanization is the leading factor in determining both embodied energy and emissions, with the highest standardized coefficient at β = 0.356. The construction sector in urban areas with large populations shows elevated demand for building projects, extensive infrastructure development, and continuous material movement, resulting in increased embodied energy use. This study confirms that rapid urban growth creates conditions that lead to increased resource use in built-up areas. The positive coefficient indicates that urban growth will lead to significant increases in national embodied carbon when efficiency measures such as green building codes, circular material use, and low-carbon design are not implemented.
FossilShare (B = 0.003, β = 0.263, t = 16.859, p < 0.001): The structure of energy consumption is a primary factor explaining why different regions exhibit varying levels of construction sustainability. The positive coefficient indicates that embodied emissions from construction materials rise as fossil fuel dependence increases, because cement and steel production require substantial energy. The standardized beta of 0.263 indicates that the renewable and low-carbon energy transition requires immediate attention to reduce embodied emissions. The relationship shows that the construction industry worldwide needs to decarbonize its national energy systems to reduce its environmental impact.
4.6.3. Collinearity and Diagnostic Assessment
The results of the collinearity diagnostics showed that all predictors in the model were free of multicollinearity (see
Table 13). All tolerance values exceeded 0.65, and Variance Inflation Factors (VIFs) remained well below the critical threshold of 5 (VIF range: 1.026–1.533). The diagnostic tests verify that each independent variable adds distinct value to explain CEEEI variations without repeating any information.
4.6.4. Interpretation and Policy Implications
The regression analysis shows that CEEEI performance results from economic wealth and population density in urban areas, and the types of energy used. The strong, positive link between urbanization and CEEEI highlights the challenge of sustainable urban growth: rapidly urbanizing economies, especially in Asia and the Middle East, face the dual pressures of infrastructure expansion and environmental impact. The fossil share variable shows that construction supply chains continue to rely on carbon-intensive fuels, hindering their ability to meet global net-zero targets.
These study findings demonstrate that policies that support energy transition, urban efficiency, and green construction innovation will effectively reduce both embodied energy and emissions intensity. Countries with high fossil fuel use and rapid urban development will gain the greatest benefits from decarbonization initiatives, including cement kiln electrification, construction material carbon capture, and renewable energy system expansion. The research data show that economic and urban expansion can be sustainable through non-fossil-fuel-based building systems.
The strong impact of urbanization demonstrates that large-scale construction projects at high speeds have a high embodied intensity, as cities require large amounts of resources to develop. The fossil share variable shows direct cause-and-effect relationships between carbon-intensive power use and rising emissions during cement, steel, and aggregate production. The Environmental Kuznets Curve mechanism operates through GDP per capita, which produces minimal yet significant impacts on material use and embedded emissions as economic development begins.
4.7. Policy Recommendations
The policy recommendations from this study are directly derived from the empirical findings obtained through CEEEI analysis, ANOVA, and regression analyses. The analysis shows that different regions have unique structural elements that determine their embodied intensity, so policymakers need to develop specific solutions for each region rather than a single approach. The recommendations focus on the specific mechanisms identified by the results: fossil-dependent regions need to transform their energy systems, rapidly urbanizing economies require material efficiency and circular construction methods, and low-income regions need capacity development and technology transfer to prevent carbon-intensive development patterns. Based on regional and income-group patterns, the following policy directions are proposed:
The CEEEI values in Europe, North America, and the Pacific regions remain low because these economies use efficient technologies and have well-developed policy instruments. Furthermore, the CEEEI values of these economies remain low because their governance systems are robust and their energy production relies on clean sources. The regression results indicate that these economies should prioritize two main goals: reducing their use of difficult-to-reduce materials and enhancing supply chain visibility. The way to achieve more progress needs both deep reductions in material carbon emissions and full monitoring of emissions throughout the entire product life cycle. The following are the related recommendations:
The carbon pricing system needs to expand its coverage beyond operational emissions to include the embedded carbon in cement, steel, and construction materials.
Organizations need to disclose embodied carbon through public procurement and building codes because this practice enables them to monitor their complete supply chain responsibilities.
The implementation of Building Information Modeling (BIM) and digital twins through digital construction technologies should be promoted to achieve better resource management and reduce waste.
Material substitution should be encouraged through the use of low-clinker cements, engineered timber, and recycled aggregates, while requiring complete environmental product declarations.
- 2.
Upper-Middle-Income and Fast-Urbanizing Economies
The Middle East, along with East Asia and Latin America, faces high material usage because its energy production relies heavily on fossil fuels. The high CEEEI scores in these areas stem from fossil-based energy systems and fast-paced infrastructure development, so policies should focus on cement plant electrification and the expansion of digital construction technologies. Their main policy focus is to transform the current relationship between energy production and construction activities. The following are the related recommendations:
The energy system needs to shift toward renewable power sources, while cement kilns and other energy-intensive operations should be converted to electric operations.
Governments should establish circular-economy rules that support both material recycling and modular building systems to reduce the need to extract natural resources.
Cities need to create urban sustainability policies that connect green building standards to transit-oriented development and to efficient infrastructure planning.
Introduce carbon markets or taxes that reinvest revenues into clean technology deployment in the construction supply chain.
Invest in research partnerships to develop sustainable materials for cement and steel production.
- 3.
Lower-Middle-Income and Developing Regions
The two regions of Sub-Saharan Africa and South Asia have low embodied emissions because their industrial development remains underdeveloped, and they do not use energy-efficient methods. The low embodied intensity of their system results from minimal industrial development rather than sustainable practices, so they need to build capacity and use sustainable materials to prevent future carbon-intensive development paths. Their policy development process focuses on building sustainable capacity instead of simply growing their operations:
International climate finance needs to prevent fossil fuel lock-ins by making direct investments in renewable-based construction industries.
The organization should establish training programs across different regions to develop staff competence in green materials, life-cycle design, and construction waste management.
The building standards need to adapt to local conditions by implementing resource-efficient materials sourced from the surrounding area.
The initiative should promote South–South cooperation to enable countries to share their most effective, affordable low-carbon construction methods, which work well for urban development.
- 4.
Cross-Cutting Global Recommendations
Across all regions, three universal priorities emerge from the CEEEI findings:
Energy transition: Accelerate the replacement of fossil fuels in construction material production with renewables and electrified processes.
Data transparency and benchmarking: International databases are needed to track construction activity embodied energy and CO2 emissions using CEEEI metrics to enable cross-country performance assessments.
Integrated governance: Governments should establish inter-ministerial collaboration between energy and environment and housing and industry agencies to create policies that work together to reduce embodied carbon.
5. Conclusions
This study introduced the CEEEI as a global standardized indicator for assessing embodied sustainability performance in the construction sector. It unites material and energy data with emissions information, socioeconomic variables, and policy indicators to link LCA methods with extensive sustainability performance evaluation. The PCA-derived components revealed that embodied impacts stem from the interaction between industrial intensity, economic–urban development, and energy decarbonization structure.
This study analyzed 3369 observations from 148 countries and found that income levels, along with energy and urban expansion patterns, determine both embodied energy and CO2 intensity. The combination of low-carbon energy systems and advanced governance frameworks in developed economies led to better performance, yet fossil-dependent, rapidly urbanizing countries displayed higher embodied intensity levels. The ANOVA and regression results showed that construction sustainability results depend on both regional variations and socioeconomic elements.
The policy implications indicate that construction needs to reduce both operational energy use and total emissions during building development. High-income economies need to expand their carbon-pricing systems to include emissions from materials. At the same time, middle-income and rapidly urbanizing regions should focus on integrating renewable power and adopting circular construction practices. Developing regions need to build capacity while adopting green technologies to avoid becoming dependent on fossil fuels.
Although this study provides a global assessment of construction-related environmental effects through a single composite indicator, several limitations exist. The index depends on national statistics, which might mask differences in material supply chain patterns, construction methods, and energy consumption across regions. The aggregate material extraction data does not show complete sector-specific embodied impacts between residential and infrastructure development. The CEEEI does not include information on post-construction life-cycle stages because no global data are available on demolition activities or material recycling processes.
The CEEEI framework provides a basis for international benchmarking that helps countries track their embodied carbon performance while advancing the construction sector toward worldwide decarbonization targets. The open-data framework with a reproducible design provides complete transparency. It enables researchers to compare results, which will help develop future studies and policies for the built environment’s carbon neutrality. Future studies need to develop the framework by analyzing specific sectors within the construction industry between residential and infrastructure development and by implementing input–output modeling systems.