Abstract
This study explores the decarbonization of the district heating network in Riva del Garda. The existing system (baseline) was modeled in EnergyPLAN, and future configurations were optimized using a Multi-Objective Evolutionary Algorithm (MOEA) to minimize both CO2 emissions and annual costs. Nine decision variables were assessed under defined boundary conditions to generate alternative future scenarios grouped into five types. In Type A, a large deep geothermal cogeneration plant combined with a small biomass boiler achieved the only zero-emission solution, with lower annual costs than the baseline but high capital needs. Excluding deep geothermal cogeneration (Type B) led to dominance of the biomass boiler and waste heat recovery from the Alto Garda Power (AGP) plant; full decarbonization remained possible only with extensive biomass use at a higher cost. Removing biomass (Type C), the solar thermal plant, and the shallow geothermal heat pump enabled deep but costly decarbonization, including grid electricity dependence. Types D and E, dominated, respectively, by shallow geothermal heat pump and electric boiler, provided moderate emission reductions and further increase in costs. Across all types, thermal storage improved operational flexibility. These analyses were also extended to assess potential district heating network expansions within Riva del Garda and into the neighboring municipality of Arco.
1. Introduction
The effects of greenhouse gas emissions on the planet and humankind are not unknown, and the causes are well known. One of the major causes is the large use of fossil fuels in the heating and cooling sector []. In the European Union (EU), within this sector, most thermal energy is used in buildings, with space and water heating accounting for 60%, while industrial heating processes are the second most used application, making up around 35%. In private households, space and water heating make up almost 80% of energy use [].
In the Italian residential building stock, energy consumption accounts for around 43% of the national energy requirements, most of which concerns space heating (i.e., approximately 70%), dominantly based on fossil fuels []. Moreover, according to a recent study published by Cresme (Center for Economic, Sociological and Market Research in Construction), domestic heating is one of the main causes of urban pollution in Italy, and is responsible for over 19% of emissions produced by the country and 60% of fine dust in urban areas [].
Several initiatives, policies, targets, and/or agreements are already in force at the national level and EU level to curb emissions from the heating and cooling sector to a minimum level. One of the most effective solutions is district heating and cooling (DHC), which has well-demonstrated benefits in terms of efficiency and environment; but, in spite of these benefits, the potential has still not been exploited to its fullest. However, one of the critical issues with a lot of today’s district heating (DH) systems is that there is still a high reliance on fossil fuels: 75% of European district heating is based on fossil fuels [] and on a global scale, it is even worse, with 90% of district heating based on fossil fuels [].
In Italy, district heating covered approximately 2.3% of the national demand for heating till 2021 []. There are district heating systems in more than 200 urban centers, for a total of over 400 networks spread across the territory []. The volume of buildings connected to DH is 381.8 Mm3, and it is very clear that the territorial distribution of the DH systems is concentrated in the northern regions of the country: Lombardy, Piedmont, Emilia-Romagna, Trentino-Alto Adige, and Veneto, as shown by Figure 1 [].
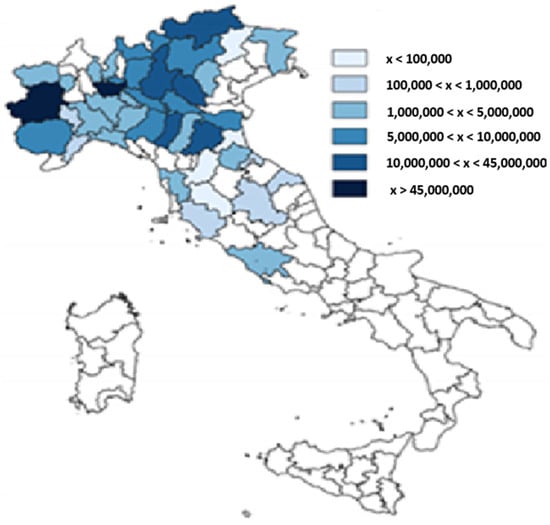
Figure 1.
Volume of buildings connected to district heating in m3 in Italy (2021) []. Please note that the total value in Italy in 2021 was 381.8 Mm3, while the most recent statistics indicate 399.6 Mm3 in 2023 [].
In 2021, power plants serving district heating networks produced 12,331 GWh/year of thermal energy []. Figure 2 shows in detail the energy mix fed into the district heating networks. Geothermal, solar, heat pumps, and industrial waste heat recovery remain marginal, at 3.9% overall, while a major contribution is from fossil fuel-operated cogeneration plants [].
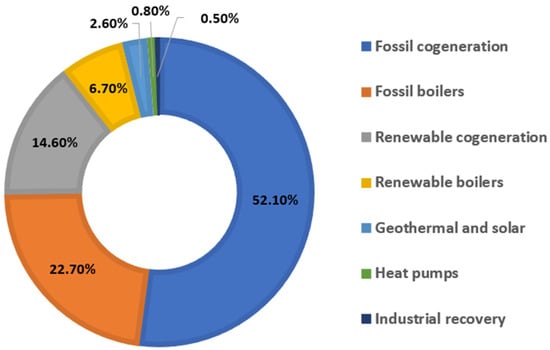
Figure 2.
Technologies for the production of thermal energy fed into the district heating networks in Italy (2021) []. Please note that the most recent statistics indicate that in 2023 in Italy, a thermal energy production of 10,662 GWh/year with these shares is as follows []: fossil cogeneration is 49.6%, fossil boilers is 20.9%, renewable cogeneration is 15.6%, renewable boilers is 8.1%, geothermal and solar is 2.9%, heat pumps is 1.9%, and industrial recovery is 1.1%.
The Italian energy and climate objectives for the 2021–2030 period, outlined in the Italian national energy and climate plan (NECP), recognize the key role of DHC []. Particularly, the NECP focuses on the following:
- −
- Reviewing the Italian DHC potential;
- −
- Developing 4th generation DHC systems;
- −
- Developing low-temperature DHC networks;
- −
- Use of storage;
- −
- Integration of different sources: waste heat, heat pumps, geothermal, solar, and more [].
Accordingly, Italy aims to modernize and expand existing DHC networks. This includes building new district heating networks (DHNs) by 2030, which will require an additional investment of approximately $1.1 billion to Italy’s DHC market size, which has a value of $3.17 billion in 2024 [].
In line with the Italian NECP objectives, the present work studies the future decarbonization of the current DHN of the municipality called Riva del Garda in Italy (first use case). Moreover, to broaden the scope of this study, an extension of the DHN in the Municipality of Riva del Garda in a second use case and the addition of the Municipality of Arco in a third use case are also studied. The study mainly aims to explore improvements for both decarbonization and cost reduction, considering several potential energy technologies.
The approach involves modeling the existing heating systems to determine total annual CO2 emissions and costs (baselines), followed by evaluating potential enhancements (decarbonization scenarios). EnergyPLAN [] is used for simulations, and a multi-objective evolutionary algorithm (MOEA) is integrated to assess how different technologies contribute to decarbonization in an optimized approach. By applying capacity limits and constraints (grouped into five types), the study identifies alternative solutions and provides recommendations for system operators, serving as a reference for similar-scale systems and supporting policy and planning decisions.
EnergyPLAN is one of the more well-known simulators based on the concept of a smart energy system. Introduced by Lund et al. [], this concept integrates electricity, thermal, and transport sectors, supporting new ways of flexibility [] and renewable energy integration []. Moreover, EnergyPLAN has the capability to couple with other tools.
For the first time, in 2016, Mahbub et al. [] conceived the coupling of EnergyPLAN with an MOEA to identify optimal energy scenarios. After, a relevant number of case studies adopted the same or a similar scheme. Several case studies are based on the national scale (e.g., Italy by Prina et al. [] and Bellocchi et al. [], Croatia by Herc et al. [], and India by Laha and Chakraborty []) and on the regional scale (e.g., in Italy, the Province of Trento by Viesi et al. [] and the region of Valle d’Aosta by Bellocchi et al. [], and in Austria, the region of Niederosterreich by Prina et al. []). Moreover, at a smaller scale, case studies are available in valleys (e.g., Val di Non [] and Giudicarie Esteriori [,] in Italy by Mahbub et al. and Viesi et al.), islands (e.g., Lanzarote in Spain by Cabrera et al. [] and Favignana in Italy according to Groppi et al. []), and local territories (e.g., Aalborg Municipality in Denmark by Yuan et al. [], Bressanone-Brixen in Italy by Prina et al. [], the Italian refinery Sonatrach by de Maigret et al. [] and the Santa Chiara district in Trento by Viesi et al. []).
The innovative and unique contribution of this paper lies in the use of real operational data from a district heating operator (Alto Garda Servizi, AGS, located in Riva del Garda, Italy []) combined with innovative modeling techniques such as EnergyPLAN (version 16.3) + MOEA (NSGA-II).
The following sub-section introduces Riva’s DHN, describing its components, operational principles, and supply-demand data.
The Case Study of Riva Del Garda
The DHN in Riva del Garda is operated by AGS, a multi-utility company with both public and private stakeholders. AGS is a partner of the Horizon Europe USES4HEAT [] project. AGS is deeply integrated within the local community, with 57% of its shares owned by the Municipality of Riva del Garda. The company is responsible for managing various technological networks and systems, including electricity distribution, the water cycle, public lighting, natural gas supply, and the DHN.
Development of the DHN began in 2008, serving just 21 user substations with a network length of 5 km, and has since expanded to the current 311 user substations through a total network length of 17 km, comprising 27 km of double pre-insulated pipes []. The system operates with a nominal supply temperature of 90 °C and a return temperature of 65 °C, under a maximum network pressure of 16 bar. Space heating is provided for approximately 183 days per year []. However, due to the significant demand for domestic hot water, particularly from the city’s tourist and hospitality sectors, heat load requirements remain substantial even during the summer months.
To supply the DH to its customers, AGS buys waste heat from the Alto Garda Power (AGP) [] plant. The AGP plant, established through a partnership between AGS and a paper mill named Cartiere del Garda SpA (CDG, located in Riva del Garda, Italy), is a combined cycle cogeneration plant that uses natural gas as its fuel and is designed to meet the electrical demands of CDG and the thermal requirements of both CDG and the AGS DHN. AGP has a heat recovery steam generator (HRSG), two heat exchangers, a heat pump, a thermal storage, and a natural gas boiler from which heat is collected and supplied to the AGS DHN. The AGP cogeneration plant is located adjacent to the CDG facility, situated within the municipality of Riva del Garda.
The district heat distribution takes place through the insulated pipes, which are directly connected to the AGP plant. The DH network also features a continuous leak detection system for both supply and return pipes, ensuring efficient and safe operation. Each delivery point in the network is equipped with a water-to-water heat exchanger and a regulation valve, which adapts heat transfer to user-specific needs []. The DHN losses, as observed by AGS, account for 17%.
The reference year for this study is 2023, and AGS reports the heat demand from DH users from 00:00 on 1 January 2023 to 23:00 on 31 December 2023. The DH supplied to AGS by AGP is approximately 52 GWh/year. The heat demand profile depends on the season: it peaks in winter, due to massive space heating needs, and sees the lowest values in the summer months. This trend is also closely related to the ambient temperature; the hourly temperature measurement in Riva del Garda in Figure 3 proves this statement. The maximum heat demand value is found as 18.31 MWth in the middle of January.
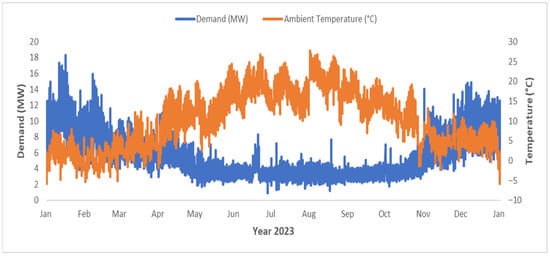
Figure 3.
Hourly district heating demand in 2023 with hourly temperature measurement in Riva del Garda.
The remainder of the paper is organized as follows: in Section 2, the materials and methods are described that outlines how the DH system is modeled in EnergyPLAN and how a MOEA is applied to explore optimized decarbonization scenarios; in Section 3, the results and discussions regarding baseline outcomes and scenario analyses are presented, highlighting potential implications for policymakers; and in Section 4, conclusive remarks are provided, summarizing the main findings while suggesting directions for future research.
2. Materials and Methods
The approach taken in this study can be summarized through the following key steps:
- Modeling the existing heating systems of Riva del Garda and Arco using EnergyPLAN to quantify total annual cost and CO2 emissions (three baselines for three different use cases).
- Integrating MOEA with EnergyPLAN to optimize system configurations for various decarbonization scenarios (grouped in five types with different constraints in each use case), considering trade-offs between total CO2 emissions and total annual cost.
- Analyzing results to identify potential pathways for deep decarbonization of the DHN.
2.1. DHN Modeling with EnergyPLAN
For this study, EnergyPLAN is applied to model the current heating systems in Riva del Garda and Arco and to analyze future decarbonization scenarios. Its capability to integrate demands and productions from different energy sectors, renewable energy sources (RES), and waste heat utilization makes it well suited for evaluating optimized heating solutions and sector coupling strategies. The tool performs hourly simulations, capturing temporal variations in supply and demand, and has been widely adopted in academic and policy research for DHN analysis.
The software is used to model 3 baselines (for 3 different use cases) and for each one other 5 types of decarbonization scenarios (with different constraints): (I) the first use case considers only the existing DHN in Riva del Garda, (II) the second use case adopts the existing DHN and some of the users currently supplied by individual heating in Riva del Garda, and (III) the third use case examines the existing DHN in Riva del Garda and some of the users currently supplied by individual heating in Riva del Garda and Arco.
2.1.1. Modeling of 1st Baseline
In the ‘Demand’ tab of EnergyPLAN, the ‘District Heating’ section is used. The district heating production in Riva del Garda is 52 GWh/year, and the network losses are 17%. EnergyPLAN then calculates the final district heating demand of the users, which is 43.17 GWh/year. The ‘Distribution’ profile is the hourly demand profile of the district heating reported by AGS as previously discussed.
The production of this district heating is modeled under the ‘Supply’ tab. In the section ‘Industrial CHP’, the waste heat from AGP is entered as ‘CHP Heat Produced’ equal to 52 GWh/year. The distribution profile required to be entered is the hourly production of the waste heat by AGP, which is considered identical to the hourly demand profile of AGS.
To insert the cost values, the ‘Cost’ tab of EnergyPLAN is used. In the ‘General’ subtab, the investment interest rate reported by AGS in 2023, equal to 4.66%, is added. Moreover, the district heating infrastructure cost is defined in the ‘Investment and Fixed OM-Additional’, and it is the same in the three baselines. AGS reported EUR 18,886,333 as overall fixed investment to realize the district heating network and 20,556 EUR/year (0.108% of fixed investment) for the operational and maintenance cost with a 30-year lifetime.
2.1.2. Modeling of 2nd and 3rd Baselines
The second baseline consists of the same values at the respective places in the EnergyPLAN as the first baseline. However, in the second baseline, demand and supply of thermal energy for some of the users currently relying on individual heating in Riva del Garda are also modeled. The demand for individual heating is considered equal to the increase in DH demand in Riva del Garda in the last 10 years, which is 5.2 GWh/year, fulfilled by a natural gas boiler (information provided by AGS). To model this, the ‘Individual Heating’ section is used. The natural gas boiler efficiency is 90%, which is the default value of EnergyPLAN, and a fuel input equal to 5.77 GWh/year is calculated. Also, the same demand distribution profile is used in this case as it is used in the first baseline. Natural gas cost in EUR/GJ is inserted in the subtab named ‘Fuel’ available in the ‘Cost’ tab. AIEL [] reports the cost of natural gas, which is 82.87 EUR/MWh for the year 2023, which is converted to 23.01 EUR/GJ. To model the investment cost associated with natural gas boilers, the IEA report [] is referred to. It reported 3000 EUR/unit as the fixed investment and 4.17% of the fixed investment as the operational and maintenance cost with a 25-year lifetime. These values are entered in the ‘Investment and Fixed OM-Heat Infrastructure’.
The third baseline consists of the same values at the respective places in the EnergyPLAN as the second baseline. However, to model the demand and supply of thermal energy for some of the users currently relying on individual heating in Arco, the values in the ‘Individual Heating’ are updated. This demand in Arco is equal to 15 GWh/year, fulfilled by natural gas boilers as provided by AGS. So, the new individual heating demand is 20.20 GWh/year, and the natural gas input is 22.44 GWh/year with 90% boiler efficiency.
2.2. Results and Post-Processing of Baselines
After running EnergyPLAN with the three baselines, the following indicators are obtained:
- Total annual cost (kEUR/year);
- Total CO2 emissions (kton/year).
These results are tabulated in Table 1; however, the total annual cost and the total CO2 emissions must be corrected. The first correction pertains to the total annual cost. There is no cost assignment for the waste heat in the modeling. However, AGP sells the waste heat to AGS at a price of 12.5 kEUR/GWh. The second correction pertains to the CO2 emissions. The carbon emission factor associated with the AGP waste heat is 0.242 kton/GWh. Table 2 shows the values of total annual cost and total CO2 emission after correction in each baseline.

Table 1.
Total annual cost and CO2 emission in baselines.
Table 2.
Total corrected annual cost and CO2 emission in baselines.
2.3. Modeling of Decarbonization Scenarios in EnergyPLAN
Nine decision variables (or energy technologies) are considered based on the resource availability, potential, and geographical conditions of the case study.
In the ‘Demand’ tab, district heating production in the first use case is modeled exactly like the first baseline (52 GWh/year). However, for the second and the third use cases, the values for the district heating production are 57.2 and 72.2 GWh/year, respectively, considering the DH integration of new users previously supplied by individual heating in Riva del Garda and Arco. The maximum hourly production of the district heating in the first use case is 18.31 MWth. Using the scaling method, the maximum hourly productions in the second and the third use cases are 20.05 and 25.31 MWth, respectively. The decision variables are inserted using various subtabs in the ‘Supply’ tab. The modeling of each decision variable is explained hereinafter.
2.3.1. Waste Heat from AGP
Similar to the baselines, waste heat from AGP is modeled in the section ‘Industrial CHP’. However, the maximum value of ‘CHP Heat Produced’ is 59.5 GWh/year (in all use cases) because it accounts for the amount of district heating sold to AGS, which is 52 GWh/year, and also the excess waste heat from AGP, which is 7.5 GWh/year (from mid-April to mid-October, potentially exploitable in future scenarios). Costs and emissions of waste heat from AGP are to be considered later through post-processing.
Concerning the role of waste heat from AGP, please note that (I) this is a value that considers real operational data from the district heating operator (Alto Garda Servizi, AGS []), and (II) future scenarios analyze availability between 0 and 59.5 GWh/year without considering expansion because it is not in AGP’s investment plans (clarified directly with AGP through a specific interview).
2.3.2. Deep Geothermal Cogeneration Plant
The deep geothermal cogeneration plant is modeled in EnergyPLAN under the ‘Combined Heat and Power (CHP)’ section, requiring inputs for electric efficiency, thermal efficiency, and electric capacity. The electric capacity is set to a maximum of 3632 kWe, automatically giving a maximum thermal capacity of 18.31 MWth with a thermal efficiency of 60%. Based on the European Commission (EC) report [] and a district heating supply temperature of 90 °C, the electric efficiency is calculated as 11.9% using linear interpolation. Since EnergyPLAN lacks a direct geothermal cogeneration option, the technology is represented as a coal CHP plant, with necessary adjustments such as assigning coal as the operational fuel, setting its CO2 content to zero, and excluding any fuel cost to reflect the free geothermal resource. Similar modeling is applied for the two other use cases with higher maximum electric and thermal capacities (considering the larger DHN, 20.05 MWth in the second use case and 25.31 MWth in the third use case). CAPEX, OPEX, and lifetime values are defined in the ‘Cost’ tab.
2.3.3. Natural Gas and Biomass Boilers
The natural gas and biomass boilers are modeled under the ‘Boilers’ section, with a combined thermal capacity of a maximum of 18,312 kJ/s and a unified efficiency of 90%. Both natural gas and biomass are activated as fuels in the model, with fuel costs set at 42.2 kEUR/GWh or 11.722 EUR/GJ provided by AGP and 37.2 EUR/MWh or 10.333 EUR/GJ referred from AIEL [], respectively. Investment costs for these technologies are to be considered later through post-processing. For the two other use cases, the thermal capacities are increased to a maximum of 20,057 kJ/s and 25,316 kJ/s (considering the larger DHN).
2.3.4. Electric Boiler and Shallow Geothermal Heat Pump
In the modeling, the electric boiler and the shallow geothermal heat pump are jointly represented in EnergyPLAN using the ‘Compression Heat Pumps’ section, while ensuring sufficient electricity import capacity through the ‘Transmission line capacity’ parameter. The electric boiler is modeled with a coefficient of performance () of 1, and the heat pump with a of 2.4. The MOEA (described later) is allowed to select the value (a decision variable, see Tables 12–14) within the specified range of 1–2.4, which served as a parameter to allocate the total assigned electrical capacity (a decision variable, see Tables 12–14) between the two technologies, rather than representing a real device efficiency. The actual electrical capacities of the heat pump () and of the electric boiler () are calculated, respectively:
This ensured that the thermal output was distributed between the heat pump () and the electric boiler (); contributions are as follows:
Investment costs for these technologies are entered in post-processing. The same methodology is applied across all use cases, with differences only in the maximum electrical capacities based on the thermal requirements of each use case (18.31 MWth, 20.05 MWth, and 25.31 MWth in the three use cases).
2.3.5. Biomass Cogeneration Plant
The biomass cogeneration plant is modeled as a waste-to-electricity plant using the ‘Waste Incineration’ section. Input parameters included waste input, district heating, and electricity production efficiencies, and waste distribution. Based on the IEA report [], DH and electricity production efficiencies are set at 60% and 16%, respectively. The maximum waste input is calculated from the maximum DH production, resulting in 86.67 GWh/year for the first use case, and 95.34 GWh/year and 120.34 GWh/year for the second and third use cases. The hourly DH demand profile is used to represent waste distribution. The fuel cost is set equal to the biomass cost from AIEL [], and CAPEX, OPEX, and lifetime values are defined in the ‘Cost’ tab.
2.3.6. Solar Thermal Plant and Thermal Storage
In this study, high-vacuum flat plate solar thermal collectors manufactured by TVP Solar [] are modeled under the ‘Solar Thermal’ section. The solar thermal plant is required to supply a maximum of 321 GWh/year of heat in the first use case, increasing to 360 GWh/year and 479 GWh/year in the second and third use cases, respectively (considering the larger DHN). Input parameters included ‘Production’, ‘Storage’, ‘Loss’, and ‘Distribution’. The storage capacity and loss values are varied within defined ranges—0–20,000 MWh for storage capacity and 10–40% for loss—allowing the MOEA to determine the most suitable combination across different time scales. Based on Table 3, daily, weekly, monthly, and seasonal thermal storage corresponded to increasing capacities and losses.
Table 3.
Classification of thermal storage and loss based on time scale.
Please consider that in EnergyPLAN, the solar thermal input cannot always be utilized. It depends on the hourly distributions of the heat demand, the solar thermal production, the heat storage, and the losses. The share of the solar thermal production, which can be utilized, is calculated in the input tab sheet. If the solar production at one hour exceeds the demand, the excess production is stored (if possible). Instead, when the solar production is lower than the demand, the model seeks to empty the storage. The sequence is repeated to identify a solution in which the content of the storage at the beginning of the year equals the content by the end of the year. For further details, please read the EnergyPLAN version 16.3 documentation available online on the designated website [].
The option to use thermal storage for excess heat is enabled. The hourly solar thermal distribution profile reflected production variations in 2023, considering collector type, DH supply temperature, ambient conditions, and efficiency. Finally, CAPEX, OPEX, and lifetime values are defined in the ‘Cost’ tab specifically for each classification interval.
2.4. Electricity Price, DH Infrastructure Investment, and Investment Interest Rate
In this study, the electricity imported for the electric boiler and the shallow geothermal heat pump is priced based on market data. Hourly electricity prices for 2023 are obtained from Gestore Mercati Energetici (GME) [], showing an average PUN price of 127 EUR/MWh, to which transmission and distribution costs of 80 EUR/MWh (provided by AGS) are added, resulting in a total average import price of 207 EUR/MWh.
The DH infrastructure cost for the first use case is the same as in the baseline. For the second use case, an additional investment is estimated using a unitary cost method to integrate the Riva del Garda new users (5.2 GWh/year), leading to a total fixed investment of EUR 20.77 million and annual O&M costs of EUR 22,000 over a 30-year lifetime. In the third use case, AGS data indicated a EUR 21.96 million investment to connect 100 new users in Arco (15 GWh/year), bringing the total to EUR 42.73 million with an EUR 46,000/year O&M cost and the same lifetime.
Across all use cases, the investment interest rate is maintained at 4.66%, consistent with the baselines.
2.5. Cost of Decision Variables
For a deep geothermal cogeneration plant, biomass cogeneration plant, shallow geothermal heat pump, biomass boiler, and electric boiler, the EC report [] is referred to. The cost data provided in the report is calculated and/or converted as per the required capacities, Italian region, and/or in the units accepted by EnergyPLAN. Table 4, Table 5, Table 6, Table 7 and Table 8 show the financial data for these technologies.
Table 4.
Financial data for deep geothermal cogeneration plant.
Table 5.
Financial data for biomass cogeneration plant.
Table 6.
Financial data for shallow geothermal heat pump.
Table 7.
Financial data for electric boiler.
Table 8.
Financial data for biomass boiler.
AGP provided financial data for natural gas boiler and thermal storage, as these two technologies are used by the AGP plant and are tabulated in Table 9 and Table 10.
Table 9.
Financial data for natural gas boiler.
Table 10.
Financial data for thermal storage.
The investment cost for the solar thermal technology is referred from [,] based on TVP high-vacuum flat plate solar panels, priced at 530 EUR/m2. Using local conditions in Riva del Garda, the solar thermal plant efficiency is calculated to be 53.8%, considering the ambient temperature and the district heating supply temperature. This efficiency is applied to estimate a solar thermal production of 689.49 kWh/m2. To align with EnergyPLAN requirements, investment costs are converted into kEUR/GWh of solar thermal production, as summarized in Table 11.
Table 11.
Financial data for solar thermal plant.
2.6. Post-Processing of Decarbonization Scenarios
Post-processing is applied to the decarbonization scenarios, similar to the baselines, to accurately evaluate total annual costs and CO2 emissions. The calculations are integrated as additional formulae within the MOEA.
Corrections included accounting for emissions from imported electricity, considering that in 2023 only 45.7% of electricity generation in the Italian electricity grid was renewable, while fossil fuels—natural gas (45%), coal (5.4%), and oil (3.9%) []—contributed with emission factors of 0.202, 0.341, and 0.267 kton/GWh, respectively []. Hourly marginal emission factors are not used; only the annual average grid mix is.
Cost adjustments are also made for electricity exported from biomass and deep geothermal cogeneration plants, as the EnergyPLAN export price has to exclude the 80 EUR/MWh transmission and distribution cost. Additional costs for biomass boiler, natural gas boiler, shallow geothermal heat pump, and electric boiler are calculated based on their adopted capacities by the MOEA. Biomass and natural gas boiler capacities are distributed according to fuel shares, and the annual cost for each technology is computed using standard annuity and OPEX formulations:
where ‘r’ is the interest rate, ‘n’ is the lifetime, and is the calculated OPEX percentage of the technology over CAPEX.
2.7. MOEA for Decarbonization Scenarios
After establishing the three use cases, MOEA is implemented to explore different decarbonization strategies by modifying system configurations (size of decision variables and type of constraints) in EnergyPLAN.
Evolutionary algorithms can efficiently explore large solution spaces and identify Pareto-optimal solutions. The algorithm selected in this paper is NSGA-II (Non-dominated Sorting Genetic Algorithm) based on its ability to handle energy system constraints. It is an improved method for multi-objective optimization thanks to fast non-dominated sorting, crowding distance calculation, and selection elitism [].
The integration of a MOEA with EnergyPLAN follows a structured optimization process. First, key decision variables are defined, such as installed capacities of technologies or import and export strategies. Next, relevant constraints are imposed to ensure technical feasibility and operational limits within the district heating system. The optimization process then evaluates multiple objective functions, minimizing CO2 emissions and total annual cost. Through iterative evolution, MOEA generates and refines solutions, exploring trade-offs between these competing objectives.
Therefore, the list of decision variables and their lower and upper boundaries in the initial model (Type A, with broad availability of decision variables) can be summarized with the following Table 12, Table 13 and Table 14.
Table 12.
Lower and upper bound values of all decision variables for 1st use case—Type A.
Table 13.
Lower and upper bound values of all decision variables for 2nd use case—Type A.
Table 14.
Lower and upper bound values of all decision variables for 3rd use case—Type A.
Also, starting from the largest ranges of technology capacities listed above, five types of future scenarios in each use case will be performed to see different constraint effects on decarbonization. The problem is formulated as a multi-objective optimization model, as mentioned before, where the goal is to minimize two objective functions while considering nine decision variables within their defined bounds and updating some of them as described in Table 15.
Table 15.
Definition of the five types of future scenarios.
The general mathematical formulation is as follows:
The MOEA is made to run the Types A and B for a population size of 100 individuals and 80 generations, whereas for Types C to E, the MOEA is made to run for a population size of 100 individuals and 120 generations, in all three use cases. For all the optimization experiments, the random seed number is 4395, the crossover operator is the Simulated Binary Crossover with a probability of 0.9 and a distribution index of 10, while the mutation operator is the Polynomial Mutation with a probability of 1/number of variables, and a distribution index equal to 10.
The results reported in the following section were obtained from a single run of the optimization algorithm, which was able to find a stable solution without the need to approximate the Pareto fronts from multiple experiments. The wall-clock time required for a single run was about 8 h for Types A and B, and about 11 h for Types C to E.
3. Results
The optimization results of the first type of use case were more or less similar to those of its corresponding types of the second and third use cases. Accordingly, for the sake of conciseness of this document, the results and analysis of the types of only the first use case will be performed in detail, along with a description of the notable differences from the second and third use cases, if any (see also Appendix A and Appendix B).
3.1. Future Scenarios Type A
In Type A (no-limit scenario), the optimization produced 8000 solutions, and the first baseline values were all dominated by a single non-dominated solution forming the final Pareto front. Complete decarbonization (0 kton CO2) was achieved in all three use cases, with total annual costs (771 kEUR, 848 kEUR, and 2119 kEUR in each use case, respectively) significantly lower than those in the respective baseline. The Pareto front evolved steadily; hypervolume analysis confirmed stable convergence of the optimization.
As can be observed from Figure 4, the optimal solution relied exclusively on renewable technologies—primarily a large deep geothermal cogeneration plant (GEO) supplying most of the district heating (49.79 GWh/year), a small biomass boiler (BIO BOILER) covering about 4% of the demand (2.22 GWh/year) with annual maximum capacity of 8.562 MWth, and a seasonal thermal storage (SOL. STR. CAP.) of approximately 444 MWh. Geothermal technology was favored for its free fuel and revenue from electricity sales, which reduced total costs. Although technically ideal, the solution could be particularly complex in terms of significant initial investments and complexity in developing deep geothermal solutions, as well as permitting. Consequently, Type B was developed, avoiding the deep geothermal cogeneration plant. Regarding the feasibility of the proposed deep geothermal cogeneration capacity, the recent (2024) IEA report entitled ‘The Future of Geothermal Energy’ [] provides authoritative geoscientific evidence and reference, indicating significant geothermal power potential for the study area. In particular, referring to Project InnerSpace 2024 [], the value at 7000 m depth in Riva del Garda is 44 PJ/km2 (approximately 12 TWh/km2). This map uses a subsurface cutoff temperature of 150 °C to represent the minimum temperature required for power generation. However, critical feasibility issues could emerge regarding reservoir temperature, drilling depth, exploration risk, permitting timeframe; this is why Types B, C, D, and E are developed (without deep geothermal cogeneration capacity).
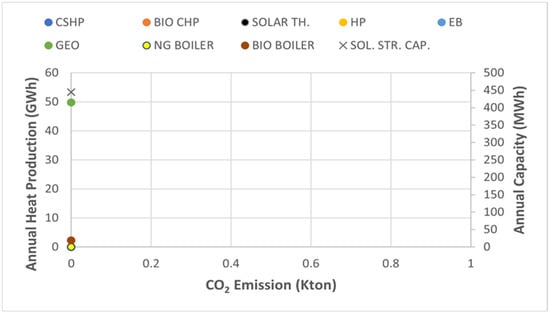
Figure 4.
Total CO2 emission values and technological distribution of the total heat production of the non-dominated solutions of the 80th generation with installed thermal storage capacity of Type A—use case 1.
3.2. Future Scenarios Type B
All 100 final-generation optimal solutions lie on the Pareto front, confirming full algorithm convergence and non-dominance. In the first use case, 91 non-dominated solutions achieve lower emissions but higher total annual costs compared to the first baseline, and only 9 have higher emissions with lower costs. Across the three use cases, the minimum and maximum annual costs range from 1956 to 5717 kEUR, corresponding to emissions of 14.39 to 0 kton, respectively. Again, the algorithm’s stability and convergence were confirmed through hypervolume analysis.
From Figure 5, technological breakdowns indicate biomass boiler (BIO BOILER) and waste heat from the AGP plant (CSHP) as the main district heating contributors, with production ranges of 0.05–51.86 GWh/year and 0–59.34 GWh/year, respectively. Biomass-dominant solutions yield lower emissions but higher costs due to higher biomass costs relative to waste heat. Other technologies, including solar thermal plant (SOLAR TH.), biomass cogeneration plant (BIO CHP), shallow geothermal heat pump (HP), electric boiler (EB), and natural gas boiler (NG BOILER), contribute marginally. Seasonal thermal storage averaged 486 MWh, providing significant flexibility. Only one fully decarbonized solution (0 emissions) was achieved—primarily through a biomass boiler—with a total annual cost of 3360 kEUR. Compared to Type A, Type B achieved optimized results by utilizing waste heat from the AGP plant, while identifying the biomass boiler as the most effective option for DHN decarbonization. However, potential biomass feasibility issues motivated the subsequent Type C, which excludes biomass as an option. Overall, biomass supply in all three use cases appears small (<10%) compared to the current biomass supply in the Province of Trento, which stands at around 1791 GWh/year [], but critical feasibility issues could emerge regarding competitive uses, transport logistics and particulate matter/local air quality impacts, this is why Types C, D, and E are developed (without biomass).
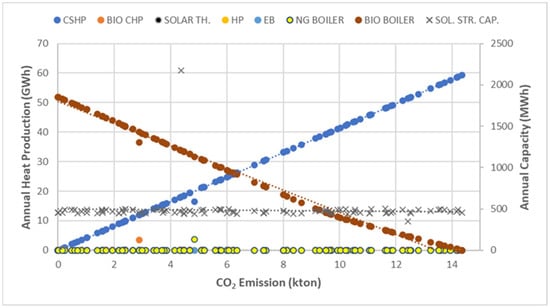
Figure 5.
Total CO2 emission values and technological distribution of the total heat production of the non-dominated solutions of the 80th generation with installed thermal storage capacity of Type B—use case 1.
The use of high-biomass solutions (biomass boilers and cogeneration plants) as a renewable energy source presents a significant challenge to local air quality, primarily due to the emission of particulate matter (PM). Biomass combustion, while considered carbon-neutral for climate goals, is a major source of air pollutants, particularly PM. Biomass furnaces often exhibit relatively high PM emissions, with concentration varying significantly based on fuel type, combustion conditions, and appliance design. A substantial portion of the emitted PM is composed of fine and ultrafine particles, and these are a major public health concern because the small size allows them to penetrate deep into the lungs and even the bloodstream. Exposure is linked to the following: respiratory illnesses (e.g., asthma and bronchitis), cardiovascular problems (e.g., heart attacks and strokes), and premature mortality. Biomass combustion also releases other pollutants that impact local air quality, including the following: Carbon Monoxide (CO), Nitrogen Oxides (NOx), and Volatile Organic Compounds (VOCs). Mitigation strategies focus on two main areas: optimizing the combustion process (primary measures) and cleaning the flue gas before release (secondary measures).
3.3. Future Scenarios Type C
In this Type C, the results showed that by the 120th generation, all 100 optimal solutions lie on the Pareto front, confirming complete convergence of the algorithm and effective identification of non-dominated solutions. Out of the 100 final non-dominated solutions, 8 exhibited slightly higher carbon emissions than the first baseline, while the remaining 92 achieved emission reductions at increased annual costs. Comparable patterns were observed for the second and third use cases, with 6 and 0 higher-emission solutions than the second and third baselines, respectively. The total annual costs associated with near-zero emissions solutions were 22,752 kEUR, 25,419 kEUR, and 32,463 kEUR, while the maximum-emission solutions (14.381, 14.838, and 16.234 kton) corresponded to significantly lower costs of 1968 kEUR, 2255 kEUR, and 4040 kEUR, respectively. The algorithm achieved rapid convergence, reaching 100 non-dominated solutions as early as the 13th generation, and maintained stability through to the 120th generation across all use cases validated by hypervolume analysis, too.
The technological breakdown of the final Pareto front solutions, shown in Figure 6, reveals three distinct emission intervals. In the low-emission range (0–2 kton), solar thermal plants and shallow geothermal heat pumps dominate the heat supply, achieving almost complete decarbonization but at significantly higher costs and with large thermal storage capacities. In the medium-emission range (2–8 kton), natural gas boiler becomes the primary heat source, leading to higher emissions but lower total costs; solar thermal and shallow geothermal heat pump contributions are moderate, with thermal storage capacities generally between 400 and 500 MWh. In the high-emission range (8–14.38 kton), waste heat from AGP plant dominates the heat production, resulting in the lowest-cost but most carbon-intensive solutions. Across all emission intervals, electric boilers play a negligible role due to their relatively low efficiency and cost-effectiveness compared to other technologies. Overall, the results confirm the algorithm’s effectiveness in exploring a wide spectrum of cost–emission trade-offs, demonstrating clear technological transitions across different emission levels. Similar trends were observed in the second and third use cases, though with variations in cost and emission magnitudes.
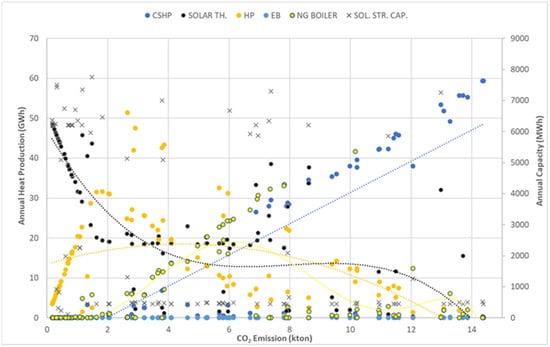
Figure 6.
Total CO2 emission values and technological distribution of the total heat production of the non-dominated solutions of the 120th generation with installed thermal storage capacity of Type C—use case 1.
3.4. Future Scenarios Type D
By the final generation, all 100 optimal solutions were non-dominated, indicating that the algorithm fully converged and produced an efficient Pareto front. Dominated solutions were generally close to the Pareto front in the first use case, while the second and third use cases exhibited more scattered dominated solutions, reflecting exploration of a wider range of trade-offs. The minimum-emission solutions achieved total annual costs of 7753, 8504, and 11,739 kEUR with carbon emissions of 2.59, 2.85, and 3.6 kton in use cases 1–3, respectively, whereas maximum-emission solutions had costs of 1987, 2946, and 4041 kEUR with carbon emissions of 14.39, 14.57, and 16.22 kton. The evolution of the Pareto front from generation 10 to 120 showed rapid stabilization, with 100 non-dominated solutions appearing early (from the 11th–12th generation) and gradually improving in both quality and trade-off diversity.
Analysis of heat production from Figure 7 revealed that shallow geothermal heat pump and waste heat from the AGP plant dominated the district heating supply, with a higher shallow geothermal heat pump contribution achieving greater decarbonization but at higher annual costs due to investment and electricity use, which is not fully renewable. The electric boiler contributed minimally (0–2.7 GWh/year), and the natural gas boiler ranged from 0 to 48.91 GWh/year, showing trends of increased use with rising carbon emissions before decreasing as emissions fell. Seasonal thermal storage also played a role, averaging 473 MWh, to store excess heat and supply peak demand. Overall, the results highlight the trade-offs between carbon reduction, total annual cost, and technology mix, with different scenarios exhibiting varying patterns of non-dominated solutions, emphasizing the need for careful planning in decarbonized district heating systems.
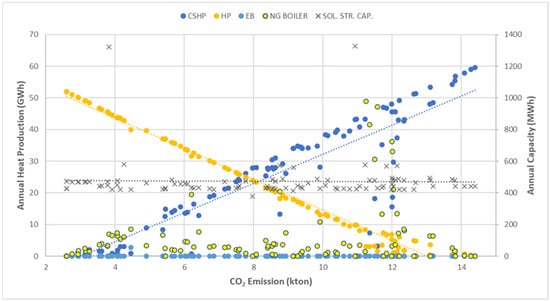
Figure 7.
Total CO2 emission values and technological distribution of the total heat production of the non-dominated solutions of the 120th generation with installed thermal storage capacity of Type D—use case 1.
3.5. Future Scenarios Type E
In the first use case, the algorithm fully converged by the 120th generation, with all 100 optimal solutions lying on the Pareto front, indicating that the final generation consisted entirely of non-dominated, efficient solutions. Dominated solutions were generally close to the Pareto front in the first use case. In contrast, use cases 2 and 3 exhibited a greater number of scattered dominated solutions, reflecting that the algorithm explored a wider range of trade-offs between cost and emissions before reaching the final Pareto front. Across the use cases, the range of CO2 emissions and associated costs varied considerably. In the first use case, emissions ranged from 6.22 to 14.39 kton with costs between 1951 and 12,563 kEUR, with 17 solutions exceeding baseline emissions and the remaining 83 reducing emissions at higher costs. The second use case saw emissions from 6.84 to 14.85 kton and costs of 2219–13,816 kEUR, with 12 solutions above the baseline and the rest reducing emissions at higher costs. The third use case exhibited a CO2 range of 8.64–16.99 kton and costs of 5189–18,504 kEUR, with no solutions exceeding baseline emissions.
From a technological perspective, the electric boiler and the waste heat from the AGP plant were the dominant contributors to district heating in the first use case, which can be observed from Figure 8. Solutions with a higher share of electric boiler production achieved lower CO2 emissions but incurred higher total annual costs due to higher investment and operational costs, whereas solutions dominated by waste heat had higher emissions but lower costs. Seasonal thermal storage, with an average capacity of approximately 442 MWh, complemented the system by storing excess heat for peak demand periods. Contributions from the natural gas boiler were generally low, ranging between 0 and 49.98 GWh/year, and became more significant only in solutions with higher emissions.
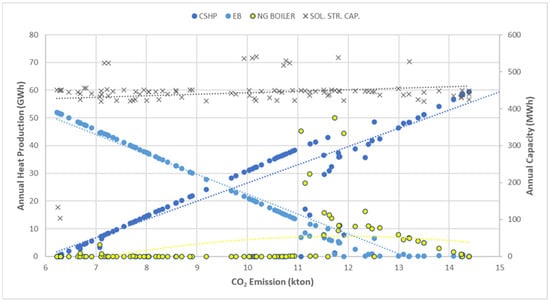
Figure 8.
Total CO2 emission values and technological distribution of the total heat production of the non-dominated solutions of the 120th generation with installed thermal storage capacity of Type E—use case 1.
3.6. Comparison Between Future Scenarios
After the detailed presentation of the results of the five scenario types (A–E for the first use case), in this section, Table 16 summarizes their main characteristics and their policy/implementation realism (ease, timescale, major barriers).
Table 16.
Summary of main characteristics and policy/implementation realism of Types A to E—use case 1.
Moreover, Figure 9 compares the final-generation Pareto fronts of Types A–E for the first use case, with CO2 emissions on the x-axis and total cost on the y-axis. The Pareto front evolves from a single non-dominated solution in Type A to 100 in later types. Types A and B achieve zero emissions, with ‘A’ offering the lowest cost but representing a complex and risky case, while B provides more practical, cost-effective options. Type C shows steep cost increases for emissions below 2 kton, approaching but not completely reaching zero emissions, whereas D and E offer optimal solutions only at medium-high emissions due to stringent constraints that have excluded many effective decision variables. Similar trends were observed in the second and third use cases.
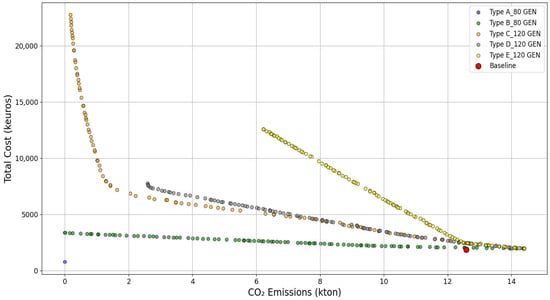
Figure 9.
Final generation Pareto front comparison of Types A to E—use case 1.
4. Conclusions
This study aimed to contribute to global decarbonization efforts and to mitigate the effects of climate change by optimizing the heating systems of Riva del Garda, Italy, through the use of EnergyPLAN and MOEA.
To assess the region’s decarbonization potential, three baselines were developed: one representing the existing district heating network in Riva del Garda (52 GWh/year of district heating production, 1852 kEUR/year of total cost, 12.58 kton/year of total CO2 emission), a second considering its expansion within Riva del Garda (57.2 GWh/year, 2446 kEUR/year, 13.76 kton/year), and a third including a further extension to the neighboring town of Arco (72.2 GWh/year, 4157 kEUR/year, 17.16 kton/year).
Each baseline was then optimized using an MOEA to minimize both CO2 emissions and annual costs. A total of 9 decision variables were assessed under defined boundary conditions to generate alternative future scenarios grouped into 5 types (future decarbonization scenarios A–E), resulting in 8000–12,000 analyzed cases per type.
The optimization outcomes revealed that Type A achieved zero carbon emissions and lower total annual costs (771 kEUR/year in the first use case) by deploying a large deep geothermal cogeneration plant (49.79 GWh/year in the first use case) and a small biomass boiler (2.22 GWh/year in the first use case), though this solution is economically challenging due to significant initial investments and complexity in developing deep geothermal solutions as well as permitting.
Type B, which excludes deep geothermal, indicates biomass boiler (0.05–51.86 GWh/year in the first use case) and AGP waste heat recovery (0–59.34 GWh/year in the first use case) as the main district heating contributors. Biomass-dominant solutions yield lower emissions but higher costs due to higher biomass costs relative to AGP waste heat. Only one fully decarbonized solution (0 emissions) was achieved—primarily through a biomass boiler—with a total annual cost of 3360 kEUR/year in the first use case.
When biomass availability was limited (due to sustainability criteria and particulate matter/local air quality impacts) in Type C, solar thermal plant and shallow geothermal heat pump became dominant technologies, reducing emissions substantially but falling short of full decarbonization due to the partial reliance on non-renewable grid electricity (total annual costs associated with near-zero emissions solutions were 22,752 kEUR/year in the first use case). The technological breakdown of the final Pareto front solutions reveals three distinct emission intervals: (I) in the low-emission range (0–2 kton/year), where the solar thermal plant and shallow geothermal heat pump dominate the heat supply; (II) in the medium-emission range (2–8 kton/year), where the natural gas boiler becomes the primary heat source, leading to higher emissions but lower total costs, while solar thermal and shallow geothermal heat pump contributions are moderate; and (III) in the high-emission range (8–14.38 kton/year), where waste heat from the AGP plant dominates the heat production, resulting in the lowest-cost but most carbon-intensive solutions.
Type D, excluding the solar thermal plant, demonstrated that the shallow geothermal heat pump remained the key decarbonization option, but achieved only partial emission reductions at higher costs. The minimum-emission solutions achieved total annual costs of 7753, 8504, and 11,739 kEUR/year with carbon emissions of 2.59, 2.85, and 3.6 kton/year in use cases 1–3, respectively, whereas maximum-emission solutions had costs of 1987, 2946, and 4041 kEUR/year with carbon emissions of 14.39, 14.57, and 16.22 kton/year.
Type E, without a shallow geothermal heat pump, favored an electric boiler that provided even smaller carbon reduction at higher costs. In the first use case, emissions ranged from 6.22 to 14.39 kton/year with costs between 1951 and 12,563 kEUR/year, with 17 solutions exceeding baseline emissions and the remaining 83 reducing emissions at higher costs. The second use case saw emissions from 6.84 to 14.85 kton/year and costs of 2219–13,816 kEUR/year, with 12 solutions above the baseline and the rest reducing emissions at higher costs. The third use case exhibited a CO2 range of 8.64–16.99 kton/year and costs of 5189–18,504 kEUR/year, with no solutions exceeding baseline emissions.
Across all types, the use of seasonal thermal storage proved essential for balancing hourly production and demand and improving system flexibility.
Overall, the results of this study demonstrated that a combination of renewable technologies and waste heat utilization can enable significant decarbonization of the Riva del Garda heating system, with the optimal strategy depending on investment capacity, policy objectives, and local resource conditions. Future research should expand upon these findings by (I) exploring the influence of financial instruments such as subsidies, carbon taxes, and public–private partnerships on technology adoption, (II) assessing the availability and sustainability of local biomass, solar, geothermal, and waste heat resources, and (III) extending the EnergyPLAN framework to include sector coupling with transport and electricity. Additionally, future studies should employ higher-resolution dynamic simulations, integrate social and environmental criteria into decision-making, evaluate replicability in other Italian and European contexts, and develop long-term, uncertainty-based decarbonization pathways to guide regional heating transitions toward 2050. Finally, additional sensitivity could be explored in future articles or reports concerning (I) projected grid decarbonization and (II) CAPEX/OPEX ranges.
Author Contributions
Conceptualization, A.J., D.V., and S.R.; methodology, A.J. and D.V.; software, A.J., D.V., and M.U.; validation, A.J., D.V., and M.M.; formal analysis, A.J., D.V., M.U., and M.M.; investigation, A.J., D.V., S.R., and M.M.; resources, D.V.; data curation, A.J., D.V., M.U., S.R., and M.M.; writing—original draft preparation, A.J.; writing—review and editing, D.V., S.R., M.M., and M.U.; visualization, A.J., D.V., M.M., S.R., and M.U.; supervision, D.V. and S.R.; project administration, D.V.; funding acquisition, D.V. All authors have read and agreed to the published version of the manuscript.
Funding
The research leading to these results has received funding from the European Union’s Horizon Europe research and innovation program under the project USES4HEAT, grant agreement N° 101136136.
Data Availability Statement
The original contributions presented in this study are included in the article. Further inquiries can be directed to the corresponding author.
Acknowledgments
The authors would like to acknowledge the European Commission for the support granted to USES4HEAT. The authors are grateful to AGS and AGP for the support during the modeling activities, including data provision. Finally, the authors would like to thank all the anonymous reviewers for their valuable comments and suggestions to improve the article.
Conflicts of Interest
The authors declare no conflicts of interest.
Appendix A

Figure A1.
Total CO2 emission values and technological distribution of the total heat production of the non-dominated solutions of the 80th generation with installed thermal storage capacity of Type A—use case 2.

Figure A2.
Total CO2 emission values and technological distribution of the total heat production of the non-dominated solutions of the 80th generation with installed thermal storage capacity of Type B—use case 2.

Figure A3.
Total CO2 emission values and technological distribution of the total heat production of the non-dominated solutions of the 120th generation with installed thermal storage capacity of Type C—use case 2.

Figure A4.
Total CO2 emission values and technological distribution of the total heat production of the non-dominated solutions of the 120th generation with installed thermal storage capacity of Type D—use case 2.

Figure A5.
Total CO2 emission values and technological distribution of the total heat production of the non-dominated solutions of the 120th generation with installed thermal storage capacity of Type E—use case 2.

Figure A6.
Total CO2 emission values and technological distribution of the total heat production of the non-dominated solutions of the 80th generation with installed thermal storage capacity of Type A—use case 3.

Figure A7.
Total CO2 emission values and technological distribution of the total heat production of the non-dominated solutions of the 80th generation with installed thermal storage capacity of Type B—use case 3.

Figure A8.
Total CO2 emission values and technological distribution of the total heat production of the non-dominated solutions of the 120th generation with installed thermal storage capacity of Type C—use case 3.

Figure A9.
Total CO2 emission values and technological distribution of the total heat production of the non-dominated solutions of the 120th generation with installed thermal storage capacity of Type D—use case 3.

Figure A10.
Total CO2 emission values and technological distribution of the total heat production of the non-dominated solutions of the 120th generation with installed thermal storage capacity of Type E—use case 3.
Appendix B

Figure A11.
Final generation Pareto front comparison of Types A to E—use case 2.

Figure A12.
Final generation Pareto front comparison of Types A to E—use case 3.
References
- Decarbonizing Heating and Cooling. A Policy Brief from the Policy Learning Platform on Low-Carbon Economy. Available online: https://www.interregeurope.eu/find-policy-solutions/policy-briefs/decarbonising-of-heating-and-cooling (accessed on 11 May 2025).
- Aldo, C.; Paolo, L.; Gianmarco, L.; Francesco, M.; Adamo, P.; Maurizio, R. Decarbonizing residential energy consumption under the Italian collective self-consumption regulation. Sustain. Cities Soc. 2022, 87, 104196. [Google Scholar] [CrossRef]
- Legambiente. Available online: https://www.legambiente.it/comunicati-stampa/recovery-plan-stop-ai-finanziamenti-alle-caldaie-fossili-se-la-normativa-non-cambia/ (accessed on 12 May 2025).
- Grundfos. Available online: https://www.grundfos.com/solutions/learn/research-and-insights/why-todays-heating-and-cooling-systems-must-change (accessed on 14 May 2025).
- Politecnico di Milano. Valutazione del Potenziale di Diffusione del Teleriscaldamento Efficiente Sul Territorio Nazionale Rapporto. 2023. Available online: https://www.relab.polimi.it/ricerca/publications/ (accessed on 17 May 2025).
- Association- AIRU, Italian Urban Heating Association. Available online: https://www.airu.it/associazione/#ANNUARIO (accessed on 13 November 2025).
- National Action Plan for Retrofitting DH Networks in Italy. Available online: https://www.upgrade-dh.eu/images/Publications%20and%20Reports/D6.1_DHC%20action%20plan_Italy.pdf (accessed on 19 May 2025).
- Frontier Insights. Available online: https://www.verifiedmarketreports.com/frontier-insight/outlook/district-heating-and-cooling-market/italy/ (accessed on 20 May 2025).
- Lund, H.; Thellufsen, J.Z.; Østergaard, P.A.; Sorknæs, P.; Skov, I.R.; Mathiesen, B.V. Energy PLAN–Advanced analysis of smart energy systems. Smart Energy 2021, 1, 100007. [Google Scholar] [CrossRef]
- Lund, H.; Andersen, A.N.; Østergaard, P.A.; Mathiesen, B.V.; Connolly, D. From electricity smart grids to smart energy systems–a market operation based approach and understanding. Energy 2012, 42, 96–102. [Google Scholar] [CrossRef]
- Lund, H.; Østergaard, P.A.; Connolly, D.; Mathiesen, B.V. Smart energy and smart energy systems. Energy 2017, 137, 556–565. [Google Scholar] [CrossRef]
- Mathiesen, B.V.; Lund, H.; Connolly, D.; Wenzel, H.; Østergaard, P.A.; Möller, B.; Nielsen, S.; Ridjan, I.; Karnøe, P.; Sperling, K.; et al. Smart Energy Systems for coherent 100% renewable energy and transport solutions. Appl. Energy 2015, 145, 139–154. [Google Scholar] [CrossRef]
- Mahbub, M.S.; Cozzini, M.; Østergaard, P.A.; Alberti, F. Combining multi-objective evolutionary algorithms and descriptive analytical modelling in energy scenario design. Appl. Energy 2016, 164, 140–151. [Google Scholar] [CrossRef]
- Prina, M.G.; Fanali, L.; Manzolini, G.; Moser, D.; Sparber, W. Incorporating combined cycle gas turbine flexibility constraints and additional costs into the EPLANopt model: The Italian case study. Energy 2018, 160, 33–43. [Google Scholar] [CrossRef]
- Bellocchi, S.; Manno, M.; Noussan, M.; Prina, M.G.; Vellini, M. Electrification of transport and residential heating sectors in support of renewable penetration: Scenarios for the Italian energy system. Energy 2020, 196, 117062. [Google Scholar] [CrossRef]
- Herc, L.; Pfeifer, A.; Duić, N. Optimization of the possible pathways for gradual energy system decarbonization. Renew. Energy 2022, 193, 617–633. [Google Scholar] [CrossRef]
- Laha, P.; Chakraborty, B. Low carbon electricity system for India in 2030 based on multi-objective multi-criteria assessment. Renew. Sustain. Energy Rev. 2021, 135, 110356. [Google Scholar] [CrossRef]
- Viesi, D.; Crema, L.; Mahbub, M.S.; Verones, S.; Brunelli, R.; Baggio, P.; Fauri, M.; Prada, A.; Bello, A.; Nodari, B.; et al. Integrated and dynamic energy modelling of a regional system: A cost-optimized approach in the deep decarbonisation of the Province of Trento (Italy). Energy 2020, 209, 118378. [Google Scholar] [CrossRef]
- Bellocchi, S.; Guidi, G.; De Iulio, R.; Manno, M.; Nastasi, B.; Noussan, M.; Prina, M.G.; Roberto, R. Analysis of smart energy system approach in local alpine regions-A case study in Northern Italy. Energy 2020, 202, 117748. [Google Scholar] [CrossRef]
- Prina, M.G.; Cozzini, M.; Garegnani, G.; Manzolini, G.; Moser, D.; Oberegger, U.F.; Pernetti, R.; Vaccaro, R.; Sparber, W. Multi-objective optimization algorithm coupled to EnergyPLAN software: The EPLANopt model. Energy 2018, 149, 213–221. [Google Scholar] [CrossRef]
- Vaccaro, R.; Rocco, M.V. Quantifying the impact of low carbon transition scenarios at regional level through soft-linked energy and economy models: The case of South-Tyrol Province in Italy. Energy 2021, 220, 119742. [Google Scholar] [CrossRef]
- Mahbub, M.S.; Viesi, D.; Cattani, S.; Crema, L. An innovative multi-objective optimization approach for long-term energy planning. Appl. Energy 2017, 208, 1487–1504. [Google Scholar] [CrossRef]
- Mahbub, M.S.; Viesi, D.; Crema, L. Designing optimized energy scenarios for an Italian Alpine valley: The case of Giudicarie Esteriori. Energy 2016, 116, 236–249. [Google Scholar] [CrossRef]
- Cabrera, P.; Carta, J.A.; Lund, H.; Thellufsen, J.Z. Large-scale optimal integration of wind and solar photovoltaic power in water-energy systems on islands. Energy Convers. Manag. 2021, 235, 113982. [Google Scholar] [CrossRef]
- Groppi, D.; Nastasi, B.; Prina, M.G.; Garcia, D.A. The EPLANopt model for Favignana island’s energy transition. Energy Convers. Manag. 2021, 241, 114295. [Google Scholar] [CrossRef]
- Yuan, M.; Thellufsen, J.Z.; Sorknæs, P.; Lund, H.; Liang, Y. District heating in 100% renewable energy systems: Combining industrial excess heat and heat pumps. Energy Convers. Manag. 2021, 244, 114527. [Google Scholar] [CrossRef]
- Prina, M.G.; Cozzini, M.; Garegnani, G.; Moser, D.; Oberegger, U.F.; Vaccaro, R.; Sparber, W. Smart energy systems applied at urban level: The case of the municipality of Bressanone-Brixen. Int. J. Sustain. Energy Plan. Manag. 2016, 10, 33–52. [Google Scholar] [CrossRef]
- de Maigret, J.; Viesi, D.; Mahbub, M.S.; Testi, M.; Cuonzo, M.; Thellufsen, J.Z.; Østergaard, P.A.; Lund, H.; Baratieri, M.; Crema, L. A multi-objective optimization approach in defining the decarbonization strategy of a refinery. Smart Energy 2022, 6, 100076. [Google Scholar] [CrossRef]
- Viesi, D.; Borelli, G.; Ricciuti, S.; Pernigotto, G.; Mahbub, M.S. Modeling the Optimal Transition of an Urban Neighborhood towards an Energy Community and a Positive Energy District. Energies 2024, 17, 4047. [Google Scholar] [CrossRef]
- Alto Garda Servizi. Available online: https://www.altogardaservizi.com/ (accessed on 10 November 2024).
- USES4HEAT. Available online: https://www.uses4heat.eu/ (accessed on 10 November 2024).
- USES4HEAT. D5.1 Baseline Monitoring and Plan for Riva del Garda Demo. Available online: https://www.uses4heat.eu/publications/ (accessed on 25 January 2025).
- Alto Garda Power. Available online: http://www.altogardapower.eu/index.php (accessed on 10 November 2024).
- Associazione Italiana Energie Agroforestali (AIEL). Available online: https://energiadallegno.it/confronto-annuale-dei-prezzi-dei-combustibili-2023/ (accessed on 25 April 2025).
- IEA. Technology Roadmap. Energy-Efficient Buildings: Heating and Cooling Equipment. 2011. Available online: https://www.iea.org/reports/technology-roadmap-energy-efficient-buildings-heating-and-cooling-equipment (accessed on 24 April 2025).
- European Commission (EU). Long Term (2050) Projections of Techno-Economic Performance of Large-Scale Heating and Cooling in the EU. Available online: https://publications.jrc.ec.europa.eu/repository/handle/JRC109006 (accessed on 10 April 2025).
- IEA. Technology Roadmap. Bioenergy for Heat and Power. 2012. Available online: https://www.iea.org/reports/technology-roadmap-bioenergy-for-heat-and-power (accessed on 10 April 2025).
- TVP Solar. Available online: https://www.tvpsolar.com/ (accessed on 28 April 2025).
- EnergyPLAN. Available online: https://energyplan.eu/ (accessed on 30 October 2024).
- Gestore Mercati Energetici. Available online: https://www.mercatoelettrico.org/ (accessed on 5 May 2025).
- Annamaria, B.; Francesco, C.; Massimo, D.; Gabriele, F.; Sabrina, F.; Adolfo, P.; Roberto, R.; Marco, S. Experimental analysis and dynamic simulation of a novel high-temperature solar cooling system. Energy Convers. Manag. 2016, 109, 19–39. [Google Scholar] [CrossRef]
- Evangelos, B.; Christos, T. A detailed investigation of an evacuated flat plate solar collector. Appl. Therm. Eng. 2023, 234, 121334. [Google Scholar] [CrossRef]
- International Energy Agency (IEA). Available online: https://www.iea.org/countries/italy/electricity (accessed on 23 April 2025).
- Covenant of Mayors. The Covenant of Mayors for Climate and Energy Reporting Guidelines. 2016. Available online: https://publications.jrc.ec.europa.eu/repository/handle/JRC103031 (accessed on 24 April 2025).
- Kalyanmoy, D.; Amrit, P.; Sameer, A.; Meyarivan, T. A Fast and Elitist Multiobjective Genetic Algorithm: NSGA-II. Trans. Evol. Comput. 2002, 6, 182–197. [Google Scholar]
- IEA Report. The Future of Geothermal Energy. 2024. Available online: https://www.iea.org/reports/the-future-of-geothermal-energy (accessed on 12 November 2025).
- Project Innerspace. Available online: https://geomap.projectinnerspace.org/geomap/ (accessed on 12 November 2025).
Disclaimer/Publisher’s Note: The statements, opinions and data contained in all publications are solely those of the individual author(s) and contributor(s) and not of MDPI and/or the editor(s). MDPI and/or the editor(s) disclaim responsibility for any injury to people or property resulting from any ideas, methods, instructions or products referred to in the content. |
© 2025 by the authors. Licensee MDPI, Basel, Switzerland. This article is an open access article distributed under the terms and conditions of the Creative Commons Attribution (CC BY) license (https://creativecommons.org/licenses/by/4.0/).