Abstract
The transition toward renewable-dominated power systems is increasingly constrained by the shortage of flexible regulation resources. Hydropower, with its rapid response and strong load-adjustment capability, remains a cornerstone for enabling large-scale integration of intermittent wind and solar energy. Splitter-blade runners are widely employed in medium- and high-head conventional hydropower plants and pumped-storage stations due to their broad high-efficiency operating range and superior stability. In this study, based on a runner replacement project at an existing hydropower station, refined computational fluid dynamics (CFD) simulations were carried out to design a splitter-blade runner under strict dimensional constraints. The optimized runner expanded the unit’s stable operating range from 50–100% to 0–100% rated power, while also improving overall efficiency and reducing pressure pulsations. The optimized splitter-blade runner improved efficiency by 1–2%, reduced pressure pulsations in the draft tube by ≈25%, and decreased the runner radial force by ≈12% compared with the baseline configuration. Importantly, this work demonstrates for the first time that splitter-blade runners can be successfully applied at head ranges below 100 m, thereby extending their applicability beyond traditional limits. The results provide both theoretical and practical guidance for flexibility retrofits of existing Francis turbine units in China, offering a feasible pathway to support the adaptability of future renewable energy systems.
1. Introduction
The large-scale integration of renewable energy introduces significant challenges for modern power systems due to the inherent variability and intermittency of sources such as wind and solar [1,2,3,4,5,6]. To accommodate this uncertainty, reliable and flexible regulation resources are essential. Hydropower, with its extensive installed capacity, broad spatial and temporal distribution, and strong inertial response, has emerged as a cornerstone for ensuring grid reliability and stability [7,8,9,10]. Its role has evolved from a focus on electricity generation to a broader dual responsibility that combines conventional generation with flexible system regulation [2,7,10,11]. By mid-2025, China’s total installed hydropower capacity had reached 440 GW, of which 380 GW came from conventional hydropower, with Francis turbines accounting for more than 80% of this capacity [6,8,12,13].
According to the national standard GB/T 15468: Fundamental Technical Requirements for Hydraulic Turbines [14], the prescribed stable operating range for Francis turbines is 45– of the rated output () [15]. However, operational investigations at multiple large-scale hydropower stations have shown that many high-capacity units fail to consistently achieve this stability window [5,9,12,16,17,18,19,20]. In practice, units engaged in frequency and load regulation frequently traverse vibration-sensitive zones or operate for extended periods in unstable regions. These conditions induce strong vibrations, runner cracking, cavitation, and fatigue damage, ultimately compromising both unit safety and overall grid stability [16,17,20,21,22,23,24,25]. As a result, the hydropower sector increasingly demands turbine units that can deliver wide-range operation, superior hydraulic stability, and high long-term reliability [9,26,27,28,29,30,31].
To address these challenges, advanced runner designs have become a major research focus. Among them, splitter-blade runners originally developed for high-head Francis turbines and pump-turbines introduce short blades between main blades to suppress secondary flow development and stabilize outlet flow structures [21,22,23,24,32,33,34]. Previous studies have shown that splitter-blade configurations can broaden the high-efficiency operating range, reduce pressure pulsations, and improve cavitation resistance [23,24,28,32,33,34,35]. However, most reported applications remain concentrated in medium- and high-head stations, such as Baihetan, where splitter-blade runners operate successfully at heads of 164–243 m [23,32].
The present study extends this technology to a new domain by examining a Francis turbine from a representative hydropower station operating below a 100 m head. Through refined computational fluid dynamics (CFD) simulations and comparative analysis between conventional and splitter-blade designs, the research demonstrates how splitter blades can expand the stable operating range, suppress pressure pulsations, and improve hydraulic stability under strict dimensional constraints [11,28,29,32,33,34,36]. The findings not only confirm the feasibility of applying splitter-blade technology in low-head conditions for the first time, but also provide a practical reference for retrofitting existing Francis units to enhance flexibility and support renewable-dominated power systems [6,10,11,29,36].
2. Engineering Requirements and Problem Analysis
2.1. Hydropower Station Background
A hydropower station constructed in the late 1990s was equipped with four Francis turbine generating units, each rated at 175 MW. Prior to 2019, the units generally operated in good condition. However, after the introduction of automatic generation control (AGC) under remote dispatch, the operating time at low- and no-load conditions increased significantly. This resulted in frequent traversals of vibration zones, intensified unit vibration, and the formation of multiple cracks in the runner shown in Figure 1. With long-term operation, additional defects such as cavitation and wear developed in several components, leading to performance degradation and the need for retrofit intervention.

Figure 1.
Inspection of runner crater cracks (leading edge zone of the main blade and mid-span near the shroud).
The hydropower project is primarily designed for electricity generation, while also delivering multiple ancillary benefits, including flood control and irrigation. Within the power grid, it plays a critical role in peak shaving, frequency regulation, and emergency backup operations. The reservoir operates at a normal level of 588 m with a total storage capacity of 2.55 billion m3, classifying it as a partial annual regulation reservoir; that is, the reservoir regulates seasonal, not full-year, inflows. The main hydraulic structures comprise a concrete gravity dam, a dam-toe powerhouse, an air-insulated switchyard, and dedicated intakes for industrial and agricultural water supply. The powerhouse is equipped with four vertical-axis Francis turbine generating units, with the principal technical parameters summarized in Table 1 and additional unit-specific parameters provided in Table 2.

Table 1.
Basic parameters of hydropower station.

Table 2.
Basic parameters of units.
The hydropower station has been in continuous operation for nearly three decades. Routine maintenance has consistently revealed wear in the distributor, along with cavitation erosion and cracking of the runner. The carbon steel sections of the crown and band have been particularly susceptible, exhibiting severe degradation. With accumulated service years, these defects have progressively worsened, and overall equipment deterioration has become increasingly evident. Since the implementation of remote Automatic Generation Control (AGC), the problem has intensified, with multiple penetrating cracks developing in the runner, particularly near the leading edges of the blades. To adapt to the frequent and wide-range load variations demanded by modern power systems, a flexibility enhancement retrofit is planned for the turbine. The upgraded unit is expected to achieve stable and safe operation across the full output range (0–100% Pr), while delivering improved performance in critical aspects such as turbine efficiency and draft-tube pressure pulsations compared with pre-retrofit conditions.
Because the fixed components of the turbine including the spiral case, stay ring, and draft tube are embedded in concrete, the retrofit scope is restricted to movable components, specifically the guide vanes and runner. This constraint introduces considerable technical challenges. The geometric boundaries defined by the stay vanes and draft-tube cone predetermine key parameters such as runner inlet height and outlet diameter, allowing only limited scope for optimization. To satisfy the stringent requirement of full-range operation, a multi-objective optimization methodology must be adopted for the new runner design, integrating a comprehensive understanding of the mechanisms and dominant characteristics of hydraulic excitations. Furthermore, mistuning strategies are essential to mitigate resonance risks during operation, thereby ensuring long-term stability and reliability of the retrofitted unit. When selecting hydraulic parameters to ensure reliable operation across the full output range, priority must be placed on turbine stability. The comparison and selection of design alternatives should primarily emphasize the evaluation of hydraulic stability within the operating domain. A key criterion is verifying that the initial cavitation inception lines on both the pressure and suction surfaces of the runner blades remain outside the normal operating range.
In addition, critical assessments should examine the appropriateness of the ratio between the rated unit discharge and the optimal unit discharge, as well as the ratio of maximum head to design head. These parameters directly influence operational flexibility and long-term stability. Therefore, a comprehensive comparison of alternative runner designs should integrate both energy performance and cavitation resistance, ensuring that improvements in efficiency do not compromise stability or reliability.
Specific speed () is a well-established index for evaluating the overall energy performance of hydroelectric turbines. With continued advancements in turbine technology, () values across different head ranges have exhibited a gradual upward trend. However, further increases in () are inherently limited by several key factors, including structural strength, cavitation behavior, sediment erosion, and hydraulic stability. Although higher specific speeds can reduce unit costs and allow for more compact powerhouse layouts, excessive pursuit of elevated () values typically compromises cavitation resistance, accelerates sediment-induced wear, and reduces operational stability. These trade-offs ultimately lead to lower peak efficiency and a narrower high-efficiency operating range, thereby undermining the goal of achieving enhanced overall performance. The statistical correlation between rated head and specific speed is illustrated in Figure 2.
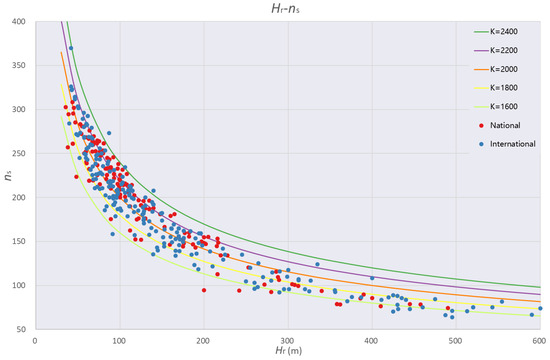
Figure 2.
Statistical curve of the rated head and specific speed of the turbine.
For the present project, the combination of large unit capacity, significant head variation, and the demand for flexible operation across the entire output range makes hydraulic stability the primary consideration in specific speed selection. With the unit speed and rated output fixed relative to the rated head, the specific speed is determined to be = 225.3 r/min, corresponding to a specific speed coefficient of K = 2070.
where n is the rotational speed (r/min), P is the power (kW), H is the head (m), and D is the runner diameter (m). For the case study, and .
Once the rated head and rated speed of a turbine are fixed, the choice of runner diameter becomes a decisive factor in defining the rationality of the operating range. A smaller runner diameter generally produces the following effects: (1) an increase in rated unit discharge, which enlarges the guide vane opening and elevates the ratio between rated and optimal unit discharges, thereby reducing rated efficiency and worsening cavitation behavior; (2) a reduction in unit rotational speed corresponding to each head, accompanied by an increased ratio of maximum head to design head, which can compromise stability under high-head partial-load conditions; and (3) a shift of the operating range toward higher discharge and lower unit speed.
In contrast, adopting a larger runner diameter shifts the operating range toward lower discharge and higher unit speed. Under these conditions, the cavitation inception and development lines associated with blade channel vortices may encroach upon the normal operating zone, intensifying pressure pulsations at partial load and posing risks to the unit’s long-term stability. As the operating regime shifts further toward lower discharge, the frequency of operation at small guide vane openings increases. Consequently, the high-efficiency region, which normally aligns with or above the optimum opening under high-head conditions, may be displaced outside the practical operating envelope an outcome clearly unfavorable for reliable performance. Moreover, cavitation inception on the pressure surface near the blade leading edge may further degrade turbine efficiency and stability. The influence of runner diameter on the shift of the operating range is depicted in Figure 3.
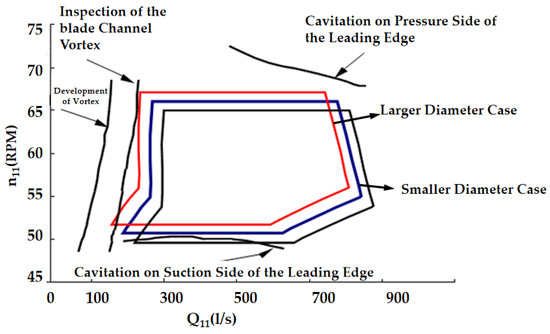
Figure 3.
Schematic diagram of variation in operating range with different impeller diameters.
The non-dimensional parameters are defined as
2.2. Existing Operational Problems
During nearly three decades of operation, the station exhibited the following:
- recurrent runner cracks, particularly near the leading edges of the blades;
- overall deterioration of hydraulic stability & efficiency.
These issues pose serious risks to both unit safety and grid stability.
2.3. Retrofit Objectives and Constraints
To meet modern power system requirements for flexible operation, the retrofit project aims to do the following:
- expand the stable operating range from 50– to 0–;
- improve efficiency and existing blade geometry across the operating envelope.
However, since fixed components such as the spiral case, stay ring, and draft tube are embedded in concrete, the retrofit is limited to movable parts, namely the guide vanes and runner. This imposes strict dimensional constraints on runner inlet height, outlet diameter, and overall geometry, requiring optimization under boundary limitations.
3. Methodology
3.1. Geometric Modeling & Meshing
Using the original engineering drawings from the power station, a comprehensive three-dimensional geometric model of the turbine system was established, representing both the structural and hydraulic domains. The structural configuration includes key components such as the upper crown, lower annular labyrinth seal, and pressure equalization pipe. To accurately reproduce the hydraulic behavior, the model also incorporates the pressure steel pipe section at the inlet, thereby capturing realistic upstream flow conditions. The complete computational domain, comprising the inlet pressure steel pipe, spiral casing, stay vanes, guide vanes, runner, and draft tube, is illustrated in Figure 4.
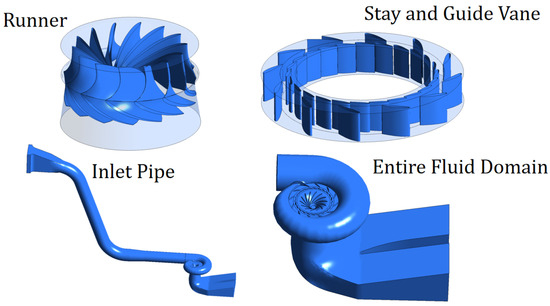
Figure 4.
Three-dimensional geometric model of the turbine.
The CFD model in Figure 5 includes the spiral case, stay ring, guide vanes, runner, and draft tube. Approximately 7.5 million cells were used: volute (1.8 M), stay+guide vanes (2.1 M), runner (2.3 M), and draft tube (1.3 M). Mesh-independence tests showed efficiency variation below 0.2% when refining to 9.2 M cells. The average ranged between 35–150 on the runner and 60–180 in other domains, ensuring valid wall-function treatment. Using the original engineering drawings from the power station, a comprehensive three-dimensional model was developed to represent both the structural and hydraulic domains of the turbine system. The structural configuration encompassed key components such as the upper crown, lower annular labyrinth seal, and pressure equalization pipe. To accurately replicate the hydraulic behavior, the model also included the upstream pressure conduit section, thereby capturing the inlet flow characteristics under realistic operating conditions. The complete computational domain, comprising the pressure conduit, spiral casing, stay vanes, guide vanes, runner, and draft tube, is depicted in Figure 6.
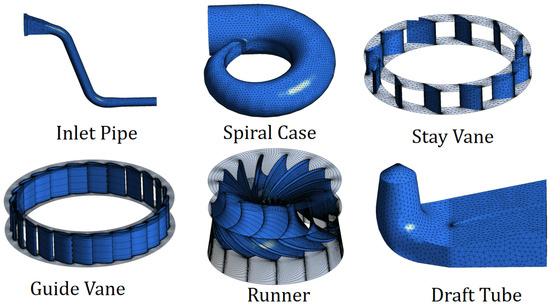
Figure 5.
Three-dimensional geometric meshing model of the turbine.
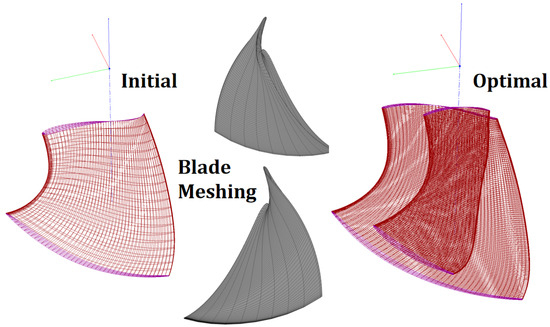
Figure 6.
Three-dimensional blade geometric meshing model of the turbine.
For a given set of hydraulic design parameters, increasing the number of runner blades generally enhances the cavitation performance of a turbine but also introduces greater hydraulic friction losses, thereby reducing efficiency. Conversely, reducing the blade count tends to improve efficiency by lowering frictional resistance, but at the cost of weakened cavitation resistance. Practical experience, however, indicates that a carefully considered increase in blade number has only a localized influence on efficiency typically observable in the high-discharge region while efficiency at partial-load and best-efficiency conditions may even improve. Although additional blades can theoretically enhance cavitation resistance, the most effective means of improving cavitation performance remains blade profile optimization. The key advantage of increasing blade number lies in its ability to suppress inter-blade secondary flows, thereby stabilizing the flow at the runner outlet, reducing draft-tube pressure pulsations, and improving overall hydraulic stability.The splitter-blade runner configuration, originally developed for high-head Francis turbines and pump-turbines, incorporates short blades inserted between adjacent long blades at the runner inlet. This arrangement effectively suppresses secondary flow development within the runner and delivers significant improvements in hydraulic stability. With an increased number of blades, the hydraulic load carried by each blade is reduced, further strengthening cavitation resistance. As a result, the splitter-blade runner achieves a broad high-efficiency operating range, smooth performance transitions, and reliable adaptability to large head variations. In addition, adverse flow phenomena such as inlet flow separation, blade-channel vortices, and pressure pulsations are markedly diminished.
While splitter-blade runners were initially confined to high-head hydropower applications, their use has gradually expanded to conventional Francis turbines operating at medium heads, such as the Baihetan Hydropower Station, where units equipped with splitter-blade runners operate under heads ranging from 163.9 to 243.1 m. The present project extends this technology further by demonstrating, for the first time, its successful application in head ranges below 100 m. Specifically, this paper reports on the design and performance of a 15 + 15 splitter-blade runner tailored for low-head conditions, highlighting its potential for retrofitting existing Francis units to meet the flexibility demands of modern power systems.
3.2. Governing Equations
In this study, an optimized design was carried out to enhance the operational flexibility of the Francis turbine using the commercial software ANSYS CFX-2023 in combination with computational fluid dynamics (CFD). The runner blade configuration was modified from a conventional to a splitter-blade design. To resolve the governing flow field, the Reynolds-averaged Navier–Stokes (RANS) approach was employed, which is widely adopted for turbulence modeling in hydraulic machinery. In this formulation, the instantaneous flow variables are decomposed into mean and fluctuating components, with the mean part describing the time-averaged behavior of the flow. The governing equations for continuity, momentum, and total energy under the RANS framework are expressed in Equations (3)–(5). Here, u denotes velocity, p represents pressure, t is time, refers to the spatial coordinate, H signifies total enthalpy, is the viscous stress tensor, and q corresponds to the heat flux component. In this study, the Shear Stress Transfer (SST) k– turbulence model was employed to close the Navier–Stokes equations. The SST k– model is an enhanced formulation of the standard k– model, combining the near-wall accuracy of the k– approach with the robustness of the k– model in the far field. This hybrid formulation provides improved prediction of boundary-layer behavior, shear-layer separation, and near-wall turbulence, making it particularly suitable for hydraulic machinery simulations. Owing to its reliability and versatility, the SST k– model has become one of the most widely adopted turbulence models in engineering practice. The transport equations for turbulent kinetic energy (k) and specific dissipation rate () are expressed in Equations (6) and (7), respectively.
Among these parameters, denotes the fluid density, P is the turbulence production term, represents the dynamic viscosity, is the eddy viscosity coefficient, is a model constant, denotes the coefficient in the turbulence dissipation term, and represents the blending function. The term k– corresponds to the turbulence scale. In the expression , the turbulence length scale is defined by Equation (8).
Since ANSYS CFX employs wall-function treatment, the logarithmic law of the wall is consistently applied to calculate the mean velocity profile, irrespective of the near-wall mesh resolution. This approach implicitly assumes that all mesh nodes are located outside the viscous sub-layer. To evaluate whether computational nodes fall within or beyond the viscous sub-layer, the dimensionless wall coordinate are introduced in (9) and (10), respectively.
Here, denotes the normal distance from the wall to the center of the first computational cell, represents the wall shear stress, is the kinematic viscosity, and indicates the velocity at the grid node adjacent to the wall.
Based on CFD and commercial numerical simulation software ANSYS CFX-2023, the computational setup for the Francis turbine at the target hydropower station was configured as follows. The spiral case inlet was defined as the computational domain inlet, where a total pressure boundary condition was applied. The total pressure corresponded to the pressure difference between the inlet and outlet. The draft tube outlet was set as the computational domain outlet, with an average static pressure boundary condition of . The reference atmospheric pressure was set to , and the working fluid was water at a temperature of 25 °C.
All solid walls were treated using a no-slip condition in conjunction with the standard wall-roughness model. Near-wall flow behavior was resolved using wall functions, with the dimensionless wall coordinate maintained within the range is shown (11).
3.3. Boundary Conditions and Numerical Setup
A multiple reference frame (MRF) model was employed, in which the runner was defined as the rotating reference frame, while all other components were stationary. Rotating–stationary interfaces were applied between the guide vanes and the runner, and between the runner and the draft tube, whereas stationary–stationary interfaces were used between all other components. Data transfer between non-conformal meshes of adjacent domains was accomplished using the General Grid Interface (GGI) method. The steady-state calculation was configured with a minimum of 300 iterations and a maximum of 1000 iterations. The result of the steady simulation was used as the initial condition for the subsequent unsteady calculation. For the unsteady simulation, the runner was set to rotate for 10 full revolutions, with a time step size corresponding to 2° of rotation per step, and each time step was iterated 10 times. The convergence criterion required that the root mean square (RMS) residuals of the continuity, momentum, and total energy equations all fall below .
4. Results and Discussion
4.1. Performance Evaluation of the Original Runner
4.1.1. Efficiency and Power Assessment
Prior to investigating the splitter-blade runner design, it was essential to evaluate the performance of the original runner in order to establish a baseline for subsequent comparison. For this purpose, 27 representative operating points under different heads and guide vane openings were selected for numerical simulation. The computational results were then compared with experimental measurements to validate the accuracy and reliability of the numerical methodology. The specific operating conditions are summarized in Table 3.

Table 3.
Typical operating condition points.
A comparison between numerical simulation results and experimental data for unit efficiency and output power under various heads and guide vane openings is presented in Figure 7 and Figure 8 and Table 4, Table 5 and Table 6. As shown in the comparative charts and tables, under the minimum head condition a noticeable discrepancy in output power is observed between the numerical simulation results and the experimental data at large guide vane openings, whereas good agreement is achieved at smaller openings. The simulated efficiencies under this condition are generally consistent with the measured values across all openings, with no significant deviations. For both the rated and maximum head conditions, the numerical results for efficiency and power agree closely with the experimental data. These findings suggest that the numerical approach introduces certain inaccuracies at large openings under the minimum head condition but remains reliable across the other operating points. It can therefore be concluded that the numerical simulation methodology employed in this study is sufficiently accurate and can be used as a credible reference for runner optimization design.
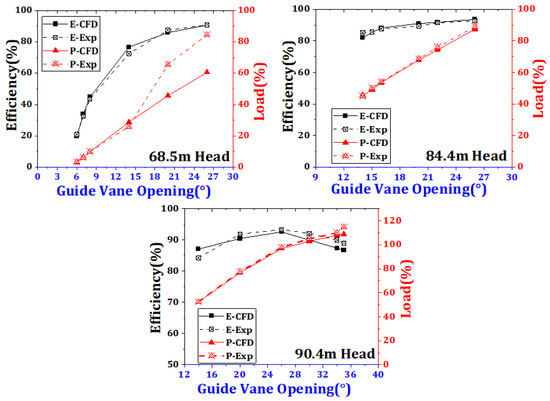
Figure 7.
Comparison between numerical simulation results and experimental measurements of unit efficiency and output power across various guide vane openings at head conditions of 68.5, 84.4, and 90.4 m.
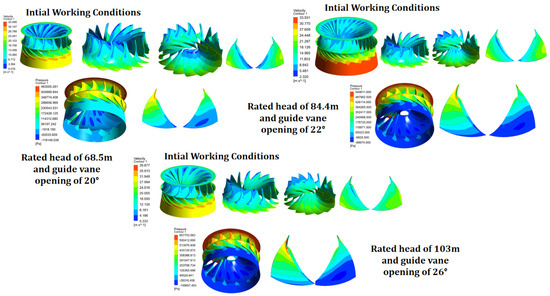
Figure 8.
Comparison of pressure and velocity contour distributions under various operating heads (68.5, 84.4, and 103 m) and corresponding guide vane openings.

Table 4.
Comparison between numerical simulation results and experimental data for unit efficiency and output power at different guide vane openings at a 68.5 m head.

Table 5.
Comparison between numerical simulation results and experimental data for unit efficiency and output power at different guide vane openings at an 84.4 m head.

Table 6.
Comparison between numerical simulation results and experimental data for unit efficiency and output power at different guide vane openings at a 90.4 m head.
4.1.2. Pressure Pulsations Assessment
Pressure pulsations in the draft tube were evaluated under three selected load conditions: , , and of the rated load. Monitoring surfaces were defined such that Plane 1 and Plane 2 were located in the straight pipe section, while Plane 3 was positioned in the elbow section, as illustrated in Figure 9.
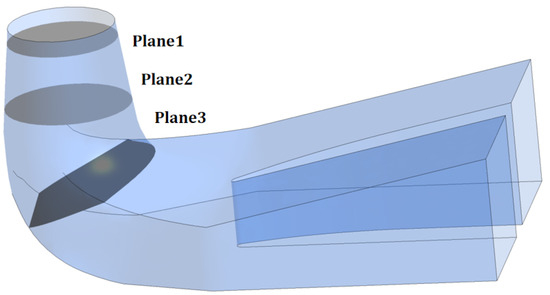
Figure 9.
Location of the pressure-pulse monitoring surface at the draft-tube outlet.
Table 7 presents the intensity distribution of pressure pulsations at three representative operating conditions. As shown in the table, under the load condition the highest pulsation intensity occurs at Plane 1, with a value of . Similarly, at the load condition, the maximum intensity is again observed at Plane 1, reaching . Under the load condition, Plane 1 continues to exhibit the strongest pulsations, with an intensity of .

Table 7.
Pressure pulse intensity distribution table.
The explicit definition of clarified that the plane-averaged mean pressure is used for normalization.
where is instantaneous pressure and its mean value.
4.2. Comparison Before and After Runner Optimization
4.2.1. Optimized Runner Model
Due to the wide inflow passage, a splitter-blade configuration was adopted. The blade profile was kept unchanged, with the leading edge set at 0 and the trailing edge at . The blade thickness was adjusted accordingly to regulate the inflow, while no additional control was applied at the outflow. The optimized runner model is illustrated in Figure 10.
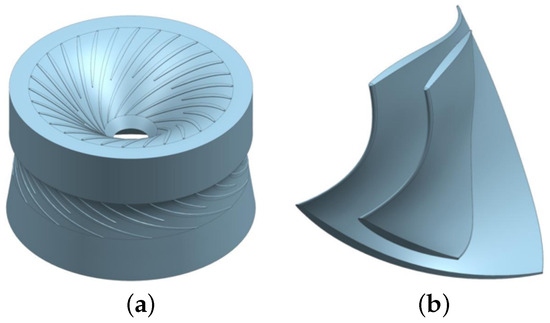
Figure 10.
(a,b) Optimization of the entire runner domain and blade after inspection of runner crater cracks.
4.2.2. Comparison of Efficiency and Power Before and After Optimization
Based on the genetic optimization algorithm, the runner obtained at the current optimization stage is referred to as the optimal design. A subsequent comparison is conducted between the initial runner and the optimal runner in terms of efficiency and output power.
Figure 11 and Table 8, Table 9 and Table 10 present the variations in unit performance under different operating conditions for head values of , , and . As shown in the figure, the optimal runner design exhibits a slight reduction in efficiency at low heads (), where the output power decreases at small guide vane openings but improves at larger openings. At the rated head (), efficiency remains comparable to that of the original design, whereas output power increases noticeably with higher flow rates. Under high-head conditions (), the optimized runner achieves a distinct improvement in both efficiency and output power, demonstrating its superior hydraulic performance across a broad operating range.
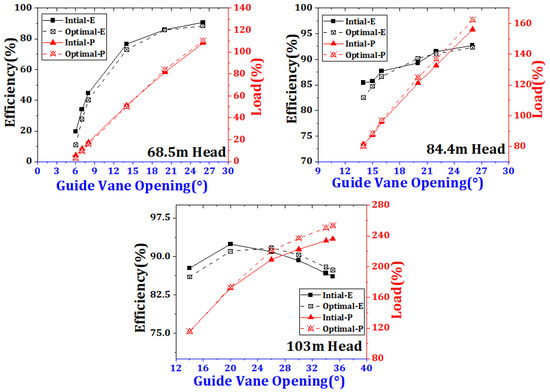
Figure 11.
Comparison of unit performance before and after optimization under different operating conditions at various head conditions of 68.5, 84.4, and 90.4 m.

Table 8.
Comparison of unit performance before and after optimization under different operating conditions at a 68.4 m head.

Table 9.
Comparison of unit performance before and after optimization under different operating conditions at an 84.4 m head.

Table 10.
Comparison of unit performance before and after optimization under different operating conditions at a 103 m head.
4.2.3. Comparison of Pressure Pulsations Before and After Optimization
Table 11 and Table 12 present the pressure pulsation results for the initial and optimized runners, respectively. A comparative analysis of the two tables clearly indicates a significant reduction in draft-tube pressure pulsations after optimization. Specifically, under the load condition at the rated head, the maximum pressure pulsation amplitude decreased from to . Similarly, under the load condition at the maximum head, the maximum amplitude was reduced from to .

Table 11.
Initial runner pressure pulsations intensity distribution table.

Table 12.
Optimal runner pressure pulsations intensity distribution table.
4.2.4. Comparison of Performance Before and After Optimization at Rated Operating Point
The maximum velocity distribution on the blade surface at the rated operating point is compared in Figure 12 for the condition of an head and a 22° guide vane opening. After optimization, the flow velocities on the runner blade surfaces, as well as on the crown and band, exhibit a significant reduction. The velocity at the blade outlet edge also decreases. This overall reduction in flow velocity can effectively mitigate sediment erosion on the runner. Under rated conditions, the optimized runner improved efficiency by 1–2%, reduced outlet velocity non-uniformity, and decreased RMS radial force by ∼12%. Cavitation analysis confirmed pressure above vapor level at an 84.4 m head.
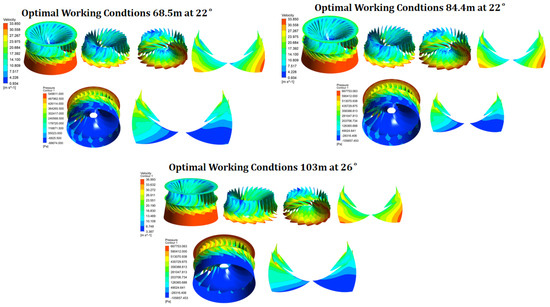
Figure 12.
Comparison of surface velocity variation in runner blade before and after optimization.
The cavitation performance at the rated operating point, under a head of and a 22° guide vane opening, is compared in Figure 12. As shown in the figure, the pressure distribution on the runner crown, band, and blade surfaces exhibits no significant changes. It can therefore be concluded that the cavitation performance of the runner meets the expected targets, and no severe cavitation erosion is anticipated.
5. Conclusions
The splitter-blade runner provides advantages such as a wide high-efficiency operating range and excellent hydraulic stability, making it particularly suitable for medium- and high-head hydropower stations. Based on the present study, the following conclusions can be drawn:
- The applicable head range of the splitter-blade runner has, for the first time, been successfully extended to below , while maintaining satisfactory hydraulic performance.
- Within the constraints of key runner dimensions (e.g., inlet and outlet diameters, inlet height, and overall runner height), the optimized splitter-blade runner outperforms the original runner in terms of efficiency and pressure pulsations. Its cavitation performance also meets the expected targets, providing a valuable reference for flexibility retrofits of existing Francis-type hydropower units.
- Compared with conventional runners, the splitter-blade runner exhibits superior structural rigidity and strength, making it more suitable for hydropower units that undergo frequent and wide-range load adjustments. This capability offers critical support for enhancing the operational flexibility of future power systems.
The splitter-blade runner demonstrates potential applicability at heads below 100 m with satisfactory performance, subject to further experimental verification. The optimized runner achieved up to 25% reduction in draft-tube pressure pulsations and slight efficiency improvement. The method of preliminary guidance can be used for flexibility enhancement in low-head Francis turbines in prospective studies.
Author Contributions
Conceptualization, Z.W.; methodology, C.L. and H.Z.; software, B.M.U.; validation, B.M.U.; formal analysis, Y.L. and B.M.U.; investigation, B.M.U.; resources, data curation, B.M.U.; writing—original draft preparation, C.L. and B.M.U.; writing—review and editing, B.M.U.; visualization, Z.W.; supervision, Z.W.; project administration, Z.W.; funding acquisition, Z.W. All authors have read and agreed to the published version of the manuscript.
Funding
This research was supported by “Supported by the Smart Grid-National Science and Technology Major Project” (2024ZD0801800).
Data Availability Statement
The original contributions presented in this study are included in the article. Further inquiries can be directed to the corresponding author.
Conflicts of Interest
Authors Chi Lu, Heng Zhang and Yijing Lv were employed by the Huadian Electric Power Research Institute Co., Ltd. The remaining authors declare that the research was conducted in the absence of any commercial or financial relationships that could be construed as a potential conflict of interest.
References
- Liu, Y.; Chen, L.; Han, X. The key problem analysis on the alternative new energy under the energy transition. Proc. CSEE 2022, 42, 515–523. (In Chinese) [Google Scholar] [CrossRef]
- Zhang, Z.; Kang, C. Challenges and prospects for constructing the new-type power system towards a carbon neutrality future. Proc. CSEE 2022, 42, 2806–2818. (In Chinese) [Google Scholar] [CrossRef]
- Liu, Y.; Ma, Q.; Wang, Z.; Li, P.; Liu, C. Cogitation on power and electricity balance dispatching in new power system. Proc. CSEE 2023, 43, 1694–1705. (In Chinese) [Google Scholar] [CrossRef]
- Lu, Z.; Lin, Y.; Qiao, Y.; Wu, L.; Xia, X. Flexibility supply-demand balance in power system with ultra-high proportion of renewable energy. Autom. Electr. Power Syst. 2022, 46, 3–16. (In Chinese) [Google Scholar]
- Trivedi, C.; Iliev, I.; Dahlhaug, O.G.; Markov, Z.; Engstrom, F.; Lysaker, H. Investigation of a Francis turbine during speed variation: Inception of cavitation. Renew. Energy 2020, 166, 147–162. [Google Scholar] [CrossRef]
- Narayanan, A.; Mets, K.; Strobbe, M.; Develder, C. Feasibility of 100% renewable energy-based electricity production for cities with storage and flexibility. Renew. Energy 2019, 134, 698–709. [Google Scholar] [CrossRef]
- Cheng, C. Function remolding of hydropower systems for carbon neutral and its key problems. Autom. Electr. Power Syst. 2021, 45, 29–36. (In Chinese) [Google Scholar] [CrossRef]
- Zhou, J.; Du, X.; Zhou, X. Study on hydropower development strategy for new power systems. J. Hydroelectr. Eng. 2022, 41, 106–115. (In Chinese) [Google Scholar]
- Ren, R.; Du, Q.; Liu, G.; Lian, Z.; Xie, L.; Luo, Y. Numerical Simulation and Experimental Study of the Rotor–Stator Interaction of a Turbine Under Variable Flow Coefficients. J. Mar. Sci. Appl. 2025, 24, 518–531. [Google Scholar] [CrossRef]
- Wang, Y.; Levin, T.; Kwon, J.; Baker, E. The value of hydropower flexibility for electricity system decarbonization. Energy Rep. 2025, 13, 2711–2721. [Google Scholar] [CrossRef]
- Sato, K.; Tamura, Y.; Tani, K. Multi-objective optimization for francis turbine runner using genetic algorithm. In Proceedings of the ASME International Mechanical Engineering Congress and Exposition, Montreal, QC, Canada, 14–20 November 2014. [Google Scholar] [CrossRef]
- Liang, H. Analysis of Uplift deformation of hydroelectric generating units in Jiangya hydropower station. Hunan Hydro Power 2013, 58, 69–70. (In Chinese) [Google Scholar]
- Cai, Y.; Li, D.; Yan, F. Analysis and Discussion on the Vibration of Turbine-Generator Sets in Gongzui Hydropower Station. Water Power 2014, 12. (In Chinese) [Google Scholar]
- GB/T 15468-2018; Fundamental Technical Requirements for Hydraulic Turbines. Standardization Administration of China: Beijing, China, 2018.
- Shang, X.X.; Lu, N. Study on Vibration Characteristics under Low Water Head of Large Scale Francis Turbine. Water Resour. Power 2019, 1. (In Chinese) [Google Scholar]
- Liu, X.; Luo, Y.; Wang, Z. A review on fatigue damage mechanism in hydro turbines. Renew. Sustain. Energy Rev. 2016, 54, 1–14. [Google Scholar] [CrossRef]
- Wang, X.; Zhao, Y.; Wang, H.; Huang, X. Effect of turbine vibration on unit efficiency of Ahai hydropower station. Water Resour. Power 2022, 40, 156–160. (In Chinese) [Google Scholar] [CrossRef]
- Liao, M.; Gong, X.; Yang, B.; Li, G.; Cao, D. A Review of Stress Research on Large Mixed-Flow Turbine Runners. Hydropower Stn. Electromech. Technol. 2024, 47, 13–16+115. [Google Scholar] [CrossRef]
- Chen, Y.; Wang, H.; Si, X.; He, J. Hydraulic Vibration Analysis of Dongqing Hydropower Station Under Off-Design Operating Conditions. Hydropower Stn. Electromech. Technol. 2022, 45, 20–22+35+141. [Google Scholar] [CrossRef]
- Yang, Y. Analysis of cracks on the runner blades of Ludila hydropower station. Yunnan Water Power 2023, 39, 257–260. (In Chinese) [Google Scholar] [CrossRef]
- Wang, Y.; Zhu, Q.; Li, J.; Yuan, S.; Liu, X. Numerical simulation of the internal flow field of Francis turbine runner with long and short blades. China Rural. Water Hydropower 2020, 24, 179–185. (In Chinese) [Google Scholar]
- Song, X.; Mao, X.; Lu, J.; Zhang, X. Optimization Design of a Mixed-Length Blade Pump-Turbine Runner Based on CFD. Water Resour. Hydropower Eng. 2021, 52, 115–123. [Google Scholar] [CrossRef]
- Fan, Y.; He, Q.; Wang, M.; Xie, S. Application and study on vibration improvement by runner with splitter blades. Water Resour. Hydropower Eng. 2022, 53, 58–68. (In Chinese) [Google Scholar] [CrossRef]
- Guan, Z.; He, S.; Liang, Q.; Kang, W.; Zhang, J.; Zeng, J.; Wang, Z.; He, Q. Numerical study of hydraulic excitation modes caused by rotor-stator interaction of a runner with splitters. Hydropower Pumped Storage 2024, 1, 7–11+37. (In Chinese) [Google Scholar] [CrossRef]
- Zhang, M.; Valentin, D.; Valero, C.; Egusquiza, M.; Zhao, W. Numerical study on the dynamic behavior of a Francis turbine runner model with a crack. Energies 2018, 11, 1630. [Google Scholar] [CrossRef]
- Bosioc, A.I.; Susan-Resiga, R.; Muntean, S.; Tanasa, C. Unsteady Pressure Analysis of a Swirling Flow with Vortex Rope and Axial Water Injection in a Discharge Cone. J. Fluids Eng. 2012, 134, 081104. [Google Scholar] [CrossRef]
- Koukouvinis, P.; Gavaises, M.; Supponen, O.; Farhat, M. Simulation of bubble expansion and collapse in the vicinity of a free surface. Phys. Fluids 2016, 28, 052103. [Google Scholar] [CrossRef]
- Ma, Z.; Zhu, B.; Rao, C.; Shangguan, Y. Comprehensive Hydraulic Improvement and Parametric Analysis of a Francis Turbine Runner. Energies 2019, 12, 307. [Google Scholar] [CrossRef]
- Yang, J.; Wang, X.; Pei, J.-X.; Yan, Y.; Wang, W.-Q. A new strategy for reducing pressure fluctuation of Francis turbine by bionic modification of local components. Sustain. Energy Technol. Assess. 2024, 71, 104014. [Google Scholar] [CrossRef]
- Nicolet, C.; Arpe, J.; Avellan, F. Identification and modeling of pressure fluctuations of a Francis turbine scale model at part load operation. In Proceedings of the 22nd IAHR Symposium on Hydraulic Machinery and Systems, Stockholm, Sweden, 29 June–2 July 2004. [Google Scholar]
- Favrel, A.; Müller, A.; Landry, C.; Yamamoto, K.; Avellan, F. Study of the vortex-induced pressure excitation source in a Francis turbine draft tube by particle image velocimetry. Exp. Fluids 2015, 56, 215. [Google Scholar] [CrossRef]
- Tang, L.; Yuan, S.; Tang, Y.; Gao, Z. Performance Characteristics in Runner of an Impulse Water Turbine with Splitter Blade. Processes 2021, 9, 303. [Google Scholar] [CrossRef]
- Jia, Y.; Wei, X.; Wang, Q.; Cui, J.; Li, F. Experimental Study of the Effect of Splitter Blades on the Performance Characteristics of Francis Turbines. Energies 2019, 12, 1676. [Google Scholar] [CrossRef]
- Chen, J.; Zheng, Y.; Zhang, L.; He, G.; Zou, Y.; Xiao, Z. Optimization of geometric parameters of hydraulic turbine runner in turbine mode based on the orthogonal test method and CFD. Energy Rep. 2022, 8, 14476–14487. [Google Scholar] [CrossRef]
- Mirza Umar, B.; Huang, X.; Wang, Z. Experimental Flow Performance Investigation of Francis Turbines from Model to Prototype. Appl. Sci. 2024, 14, 7461. [Google Scholar] [CrossRef]
- Zhang, J.; Cheng, C.; Yu, S.; Shen, J.; Wu, X.; Su, H. Preliminary feasibility analysis for remaking the function of cascade hydropower stations to enhance hydropower flexibility: A case study in China. Energy 2022, 260, 125163. [Google Scholar] [CrossRef]
Disclaimer/Publisher’s Note: The statements, opinions and data contained in all publications are solely those of the individual author(s) and contributor(s) and not of MDPI and/or the editor(s). MDPI and/or the editor(s) disclaim responsibility for any injury to people or property resulting from any ideas, methods, instructions or products referred to in the content. |
© 2025 by the authors. Licensee MDPI, Basel, Switzerland. This article is an open access article distributed under the terms and conditions of the Creative Commons Attribution (CC BY) license (https://creativecommons.org/licenses/by/4.0/).