Article

A Comparative Study of Machine Learning Models for PV Energy Prediction in an Energy Community

by
Fachrizal Aksan
,
Anna Pawlica
,
Vishnu Suresh
and
Przemysław Janik
*
Faculty of Electrical Engineering, Wroclaw University of Science and Technology, 50-370 Wroclaw, Poland
*
Author to whom correspondence should be addressed.
Energies 2025, 18(22), 5980; https://doi.org/10.3390/en18225980
Submission received: 10 October 2025 / Revised: 4 November 2025 / Accepted: 6 November 2025 / Published: 14 November 2025
(This article belongs to the Section A2: Solar Energy and Photovoltaic Systems)

Abstract

Energy communities have recently gained significant attention as local entities that empower neighborhoods to contribute actively to the clean energy transition by adopting solar energy. However, the variability of weather conditions makes PV energy production highly unpredictable, emphasizing the need for accurate prediction and forecasting to ensure efficient operation and balance supply and demand. This study investigates the use of machine learning models to predict PV energy generation from multiple household rooftop photovoltaic (PV) systems within an energy community, with solar irradiance serving as the sole input parameter. Furthermore, various deep learning architectures were also explored to forecast solar radiation and determine the optimal model configuration. The results show that the Random Forest model performed better than the other models tested, achieving the lowest error metrics for PV energy prediction. For solar radiation forecasting, the GRU model demonstrates good performance compared the other models.

1. Introduction

1.1. Background

Recent trends indicate that the cost of solar photovoltaic technology has fallen by around 90% in recent years. According to Wright’s Law [1], renewable energy technologies follow a ‘learning curve’, whereby costs consistently decrease as cumulative production increases. The widespread promotion and installation of solar panels have clearly driven this decline. Over the past few decades, solar power has shifted from being one of the most expensive sources of electricity to being the cheapest in many countries. This transformation is largely due to consistent cost reductions each time global cumulative capacity doubles. Solar PV has continued this trajectory in recent years, breaking installation records year after year.
According to an IRENA study, by the end of 2024, more than 1859 GW of solar PV capacity had been installed globally. Of this, 452 GW was commissioned in 2024 alone, which is a 26.7% increase on 2023. China was the largest market for solar PV deployment, followed by the United States and India, in that order.
The increasing installation of PV panels has also driven growth in battery storage, as these technologies are often paired in practice. Together, they form hybrid systems that enhance grid reliability and flexibility. Owing to these technical benefits, it has seen a rise in energy communities, where groups of citizens within a neighborhood install solar PV panels and energy storage systems, collectively organizing action to support clean energy transition, increase public acceptance of renewable energy projects, and attract private investment [2]. The offer of energy communities includes an effective approach to restructuring energy systems by enabling citizens to actively participate in the local energy transition while gaining some benefits, such as improved energy efficiency, lower energy costs, reduced energy poverty, and increased opportunities for local green jobs. By operating as a single entity, energy communities can participate in all relevant energy markets on equal terms with other market players.
From an energy management systems perspective, energy communities should implement technical solutions that balance renewable energy production and consumption to ensure stability and reliability [3]. However, this is highly challenging due to the significant variability in renewable energy production. In this paper, we focus on solar power forecasting for energy communities, analyzing historical data to develop models that predict PV electricity generation within these communities. The emphasis on energy forecasting lies in its potential to optimize grid operations and reduce energy costs. Furthermore, effective forecasting models can prevent PV plants from injecting excessive solar power into the grid during periods of low demand and high PV output. A large number of studies have been conducted in order to develop accurate prediction models for PV electricity generation and solar radiation forecasting. However, reliable models often require a tailored approach for different case studies. Most academic papers present using data-driven methods [4]. In this paper, we propose using artificial intelligence to predict PV energy yield and to forecast solar radiation as well. The following literature review section provides a detailed review of previous studies which are relevant to our topic.

1.2. Review of Related Work and Contribution

Several studies have used machine learning and deep learning techniques to predict PV electricity generation. For instance, Lari et al. [5] compared various machine learning models for forecasting 24 h solar power with 30 min intervals, determining that Random Forest yielded the best results (mean absolute error (MAE) = 0.13, mean absolute percentage error (MAPE) = 0.6, root mean square error (RMSE) = 0.28, R2 = 0.89). Similarly, Singh et al. [6] investigates the short-term forecasting of rooftop photovoltaic power for a commercial edifice in the Kingdom of Saudi Arabia using five-minute operational and meteorological data. Four regression models—Random Forest, K-Nearest Neighbours, Extra Trees and XGBoost—are compared, with XGBoost achieving the best performance (R2 ≈ 0.975, MAPE ≈ 0.69%). The results show that gradient-boosting ensembles are a good choice for accurate and efficient PV power prediction in grid-integration applications. Suanpang et al. [7] compares the performance of Light Gradient Boosting Machine (LGBM) and K-Nearest Neighbours (KNN) algorithms for solar power forecasting in a Rayong smart city microgrid, using 9459 records of meteorological and power data. Despite its higher computational cost, LGBM is more suitable for reliable PV forecasting in smart-grid and microgrid applications, as it achieves higher accuracy than KNN (R2 = 0.84 vs. 0.77, with lower RMSE and MAE).
Aouidad et al. [8] evaluates regression- and classification-based machine learning approaches for short-term photovoltaic (PV) power forecasting, using a substantial dataset of five-minute intervals from Alice Springs, Australia. Tree-based regressors, such as Random Forest and XGBoost, achieve an extremely high level of overall accuracy (R2 > 0.99), but they tend to underestimate peaks. Meanwhile, Shah et al. [9] using two years of 15 min PV data from La Trobe University, the study demonstrated that ConvLSTM2D outperformed LR, GB, RF and XGB (R2 = 0.9691, MAE = 0.18, RMSE = 0.10) when weather and nearby air quality index (AQI) data were included as inputs. Likely, Hayajneh et al. [10] explore TinyML models for predicting household-level photovoltaic (PV) energy yield, evaluating edge-deployable architectures such as BiGRU, BiLSTM, BiRNN and LSTM. The optimal balance between accuracy and efficiency is achieved with 64 LSTM units and a 4-step context (R2 ≈ 0.9590). While the results are promising, performance still depends on the dataset, device capabilities and installation size. Nastic et al. [11] proposes an open-data method to forecast hourly PV power for newly commissioned plants—aimed at energy cooperatives that lack on-site history. Using PVGIS (simulated PV output) and Open-Meteo (weather), this study train seven regressors (MLR, CatBoost, GBM, LightGBM, MLP, RF, XGBoost). CatBoost performs best with coefficient of determination ranging from 0.83 to 0.9.
The explanation above highlights the strengths of machine learning and deep learning for the general task of predicting PV electricity generation. However, this study focuses specifically on the energy community context, where multiple prosumers, shared assets and local energy trading introduce additional complexity compared to individual PV systems. In this setting, forecasting is not only needed at the single-rooftop level but also at the aggregated community multi-rooftop level to support local balancing, storage operation and peer-to-peer exchanges. Therefore, the following paragraphs examine how machine learning and deep learning have been applied in energy communities and critically discuss their current limitations.
In the context of short-term photovoltaic (PV) forecasting in energy communities, Dimitropoulos et al. [12] compared several artificial intelligence (AI)-based models (long short-term memory (LSTM), convolutional neural network (CNN)-LSTM, support vector regression (SVR), multiple linear regression (MLR) and XGBoost) using 30 months of hourly cooperative-plant data enriched with local and Copernicus weather variables. They found that XGBoost was the most accurate model (R2 ≈ 0.97, RMSE ≈ 0.95 kW for 1-h-ahead forecasts with extended meteorological inputs). In a related study, Dimitropoulos et al. [13] benchmarked LSTM, SVR, MLR and XGBoost on 30 months of hourly data with lagged inputs of up to 24 h and forecasting horizons of up to six hours. They also reported that XGBoost was the best-performing model (R2 > 0.95) for short-term PV production forecasting. Together, these studies demonstrate that accurate PV forecasting in energy communities is feasible, even with limited historical data, particularly when rich meteorological information is available. However, both studies are limited by their reliance on hourly data from a single cooperative PV plant, which restricts the generalizability of their findings.
Another study on PV forecasting in energy communities by Caposto et al. [14] examined the day-ahead forecasting of PV generation and electricity demand in a renewable energy community, using persistence, multiple linear regression (MLR) and autoregressive integrated moving average (ARIMA). They obtained MAE below 3.5 kW for the PV plant and residential users, with MLR generally outperforming ARIMA. It is demonstrated by this that adequate day-ahead accuracy can be yielded by relatively simple models, although the analysis is limited to a single community and hourly aggregated data, which restricts the generalizability of the results. Mazzeo et al. [15] propose an artificial neural network (ANN) model for clean energy communities. This optimized ANN accurately predicts three annual performance indicators: the proportion of the yearly load covered by the PV–wind–battery system, the proportion of generated renewable energy used to supply the load, and the proportion of grid energy exchanged relative to the load. The model achieves coefficients of determination above 0.9 across all scenarios. This work provides a useful basis for developing forecasting tools for various energy applications. However, its scope is limited to a single ANN architecture. There is no systematic comparison against alternative machine learning models.
Furthermore, in the context of forecasting tools for energy communities, Rajendran et al. [16] develop an ANN-based solar power forecasting model integrated with EnergyPLAN. This model was used to analyze a Norwegian multi-energy microgrid supplying 50 households, and it attained good accuracy (R2 ≈ 0.87). However, it remained purely deterministic and did not account for uncertainty. Paola et al. [17] introduced an open-source web tool called Rectool for planning renewable energy communities. This tool combines an iterated random sampling model for synthetic load/photovoltaic (PV) profiles with a georeferenced long short-term memory (LSTM)-based temporal model that forecasts hourly load, PV production and self-consumption. Although Rectool allows users to compare alternative REC configurations and locations, its accuracy and scalability are limited by the availability and quality of the underlying training data. Dattola et al. [18] have proposed a four-layer AI framework for Italian energy communities. This framework integrates heterogeneous climate and energy data (MOMIS), GRU/TCN-based climate forecasting, a physical PV production model and multi-agent deep-reinforcement learning. The aim is to optimize energy flow at community level. While the system is intended to enhance PV yield estimation, storage operation, and peer-to-peer trading, it is still in the early stages of implementation. Its effectiveness is currently limited by the availability of data, the need for large-scale validation, user acceptance, and the assessment of scalability.
The potential of ML and DL methods for predicting PV electricity generation is well established, with various ML models (e.g., RF, XGB, CatBoost, LGBM) and DL architectures (e.g., ANN, LSTM) achieving high accuracy. However, in the context of energy communities, most existing studies focus on aggregate PV production at community level and devote limited attention to forecasting the output of multiple rooftop PV systems within a region using a single input variable (such as solar irradiance). To address this gap, we formulate the objective of comparing two complementary approaches: (i) Machine learning regressors that predict the energy yield (Wh) of multiple rooftop PV systems using contemporaneous solar irradiance as the sole input, and (ii) Deep Learning forecasters that predict solar irradiance 15 min ahead to provide these regressors with reliable short-term inputs.
This study benchmarks six supervised algorithms for PV energy prediction (RF, XGB, LGBM, MLP, KNN, DT) and evaluates sequence models (GRU, LSTM, BiLSTM) together with CNN-LSTM and LSTM-CNN for short-term irradiance forecasting. This leads to two research questions: RQ1—Can multi-household PV energy within a single energy community be accurately predicted using only solar irradiance, and which regressor offers the best cross-household generalization? RQ2—Which DL architecture yields the most accurate 15 min irradiance forecasts?
The most important finding of this study is that a single-input, irradiance-only, pooled ML model can accurately predict multi-household PV generation and generalize to previously unseen and newly added rooftops. This provides an affordable and easily deployable forecasting solution for energy communities.
This paper is organized as follows: Section 2 details the data preparation and preprocessing used for model development, Section 3 presents and discusses the results, and Section 4 concludes by summarizing the work findings.

2. Materials and Methods

2.1. Data

2.1.1. Study Area

The objective of this study is to develop an accurate model that can predict solar energy generation for multiple houses in the same location, based on relevant climatic features. To do so, we need solar radiation data and PV energy yield data from the photovoltaic (PV) systems installed on these houses. To support this work, we utilized a dataset provided by Trivedi et al. [2] in their study titled Comprehensive Dataset on Electrical Load Profiles for Energy Communities in Ireland. The dataset [2] includes weather information, as well as residential electricity consumption and production data collected from households within an energy community located in the Dingle Peninsula, Ireland (see Figure 1).
The participating energy community consists of 20 households connected to a low-voltage distribution network. Each household is fitted with a 3.3 kW/10 kWh Sonnen residential battery (Sonnen, Wildpoldsried, Germany) and a smart meter configured for day/night tariff rates. Only ten of these houses are equipped with rooftop solar PV systems, with capacities ranging from 2.0 to 2.2 kWp. The PV panels are predominantly oriented at an angle of approximately 35° and face mostly south. Furthermore, the dataset comprises local weather parameters alongside per-household power (W) and energy (Wh) measurements, covering aspects such as active power consumption, PV generation, grid import and export, battery charging and discharging, and the state of charge of energy storage. It also contains location-specific weather data recorded at a one-minute temporal resolution in 2020 [2].
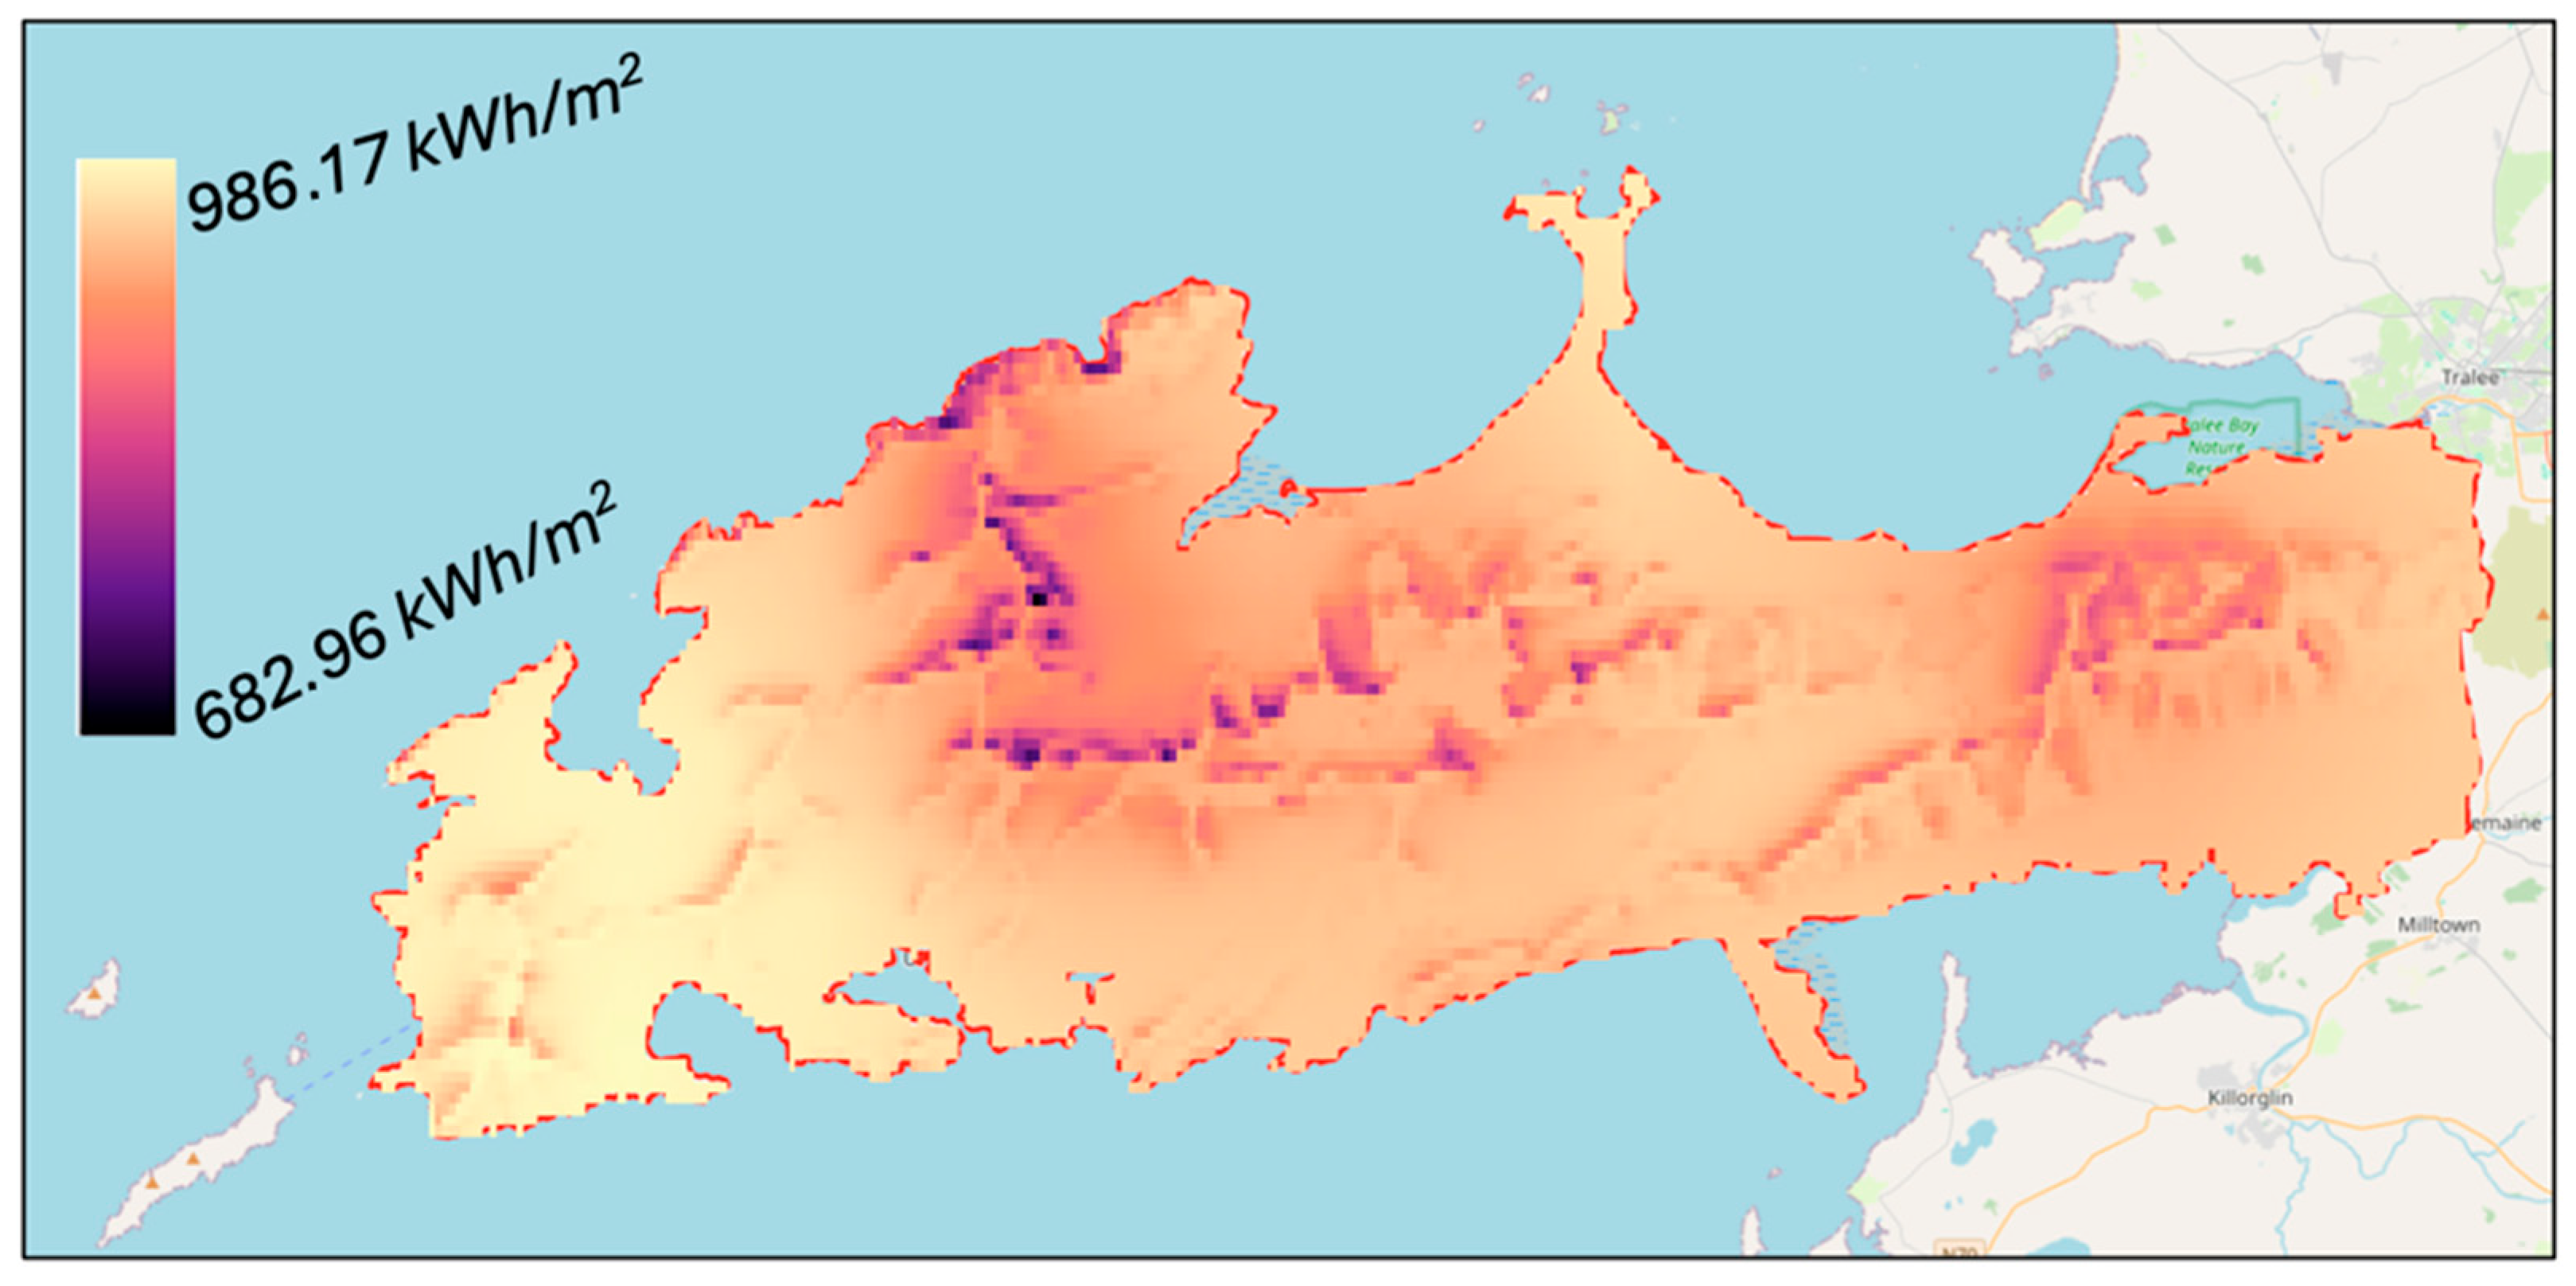
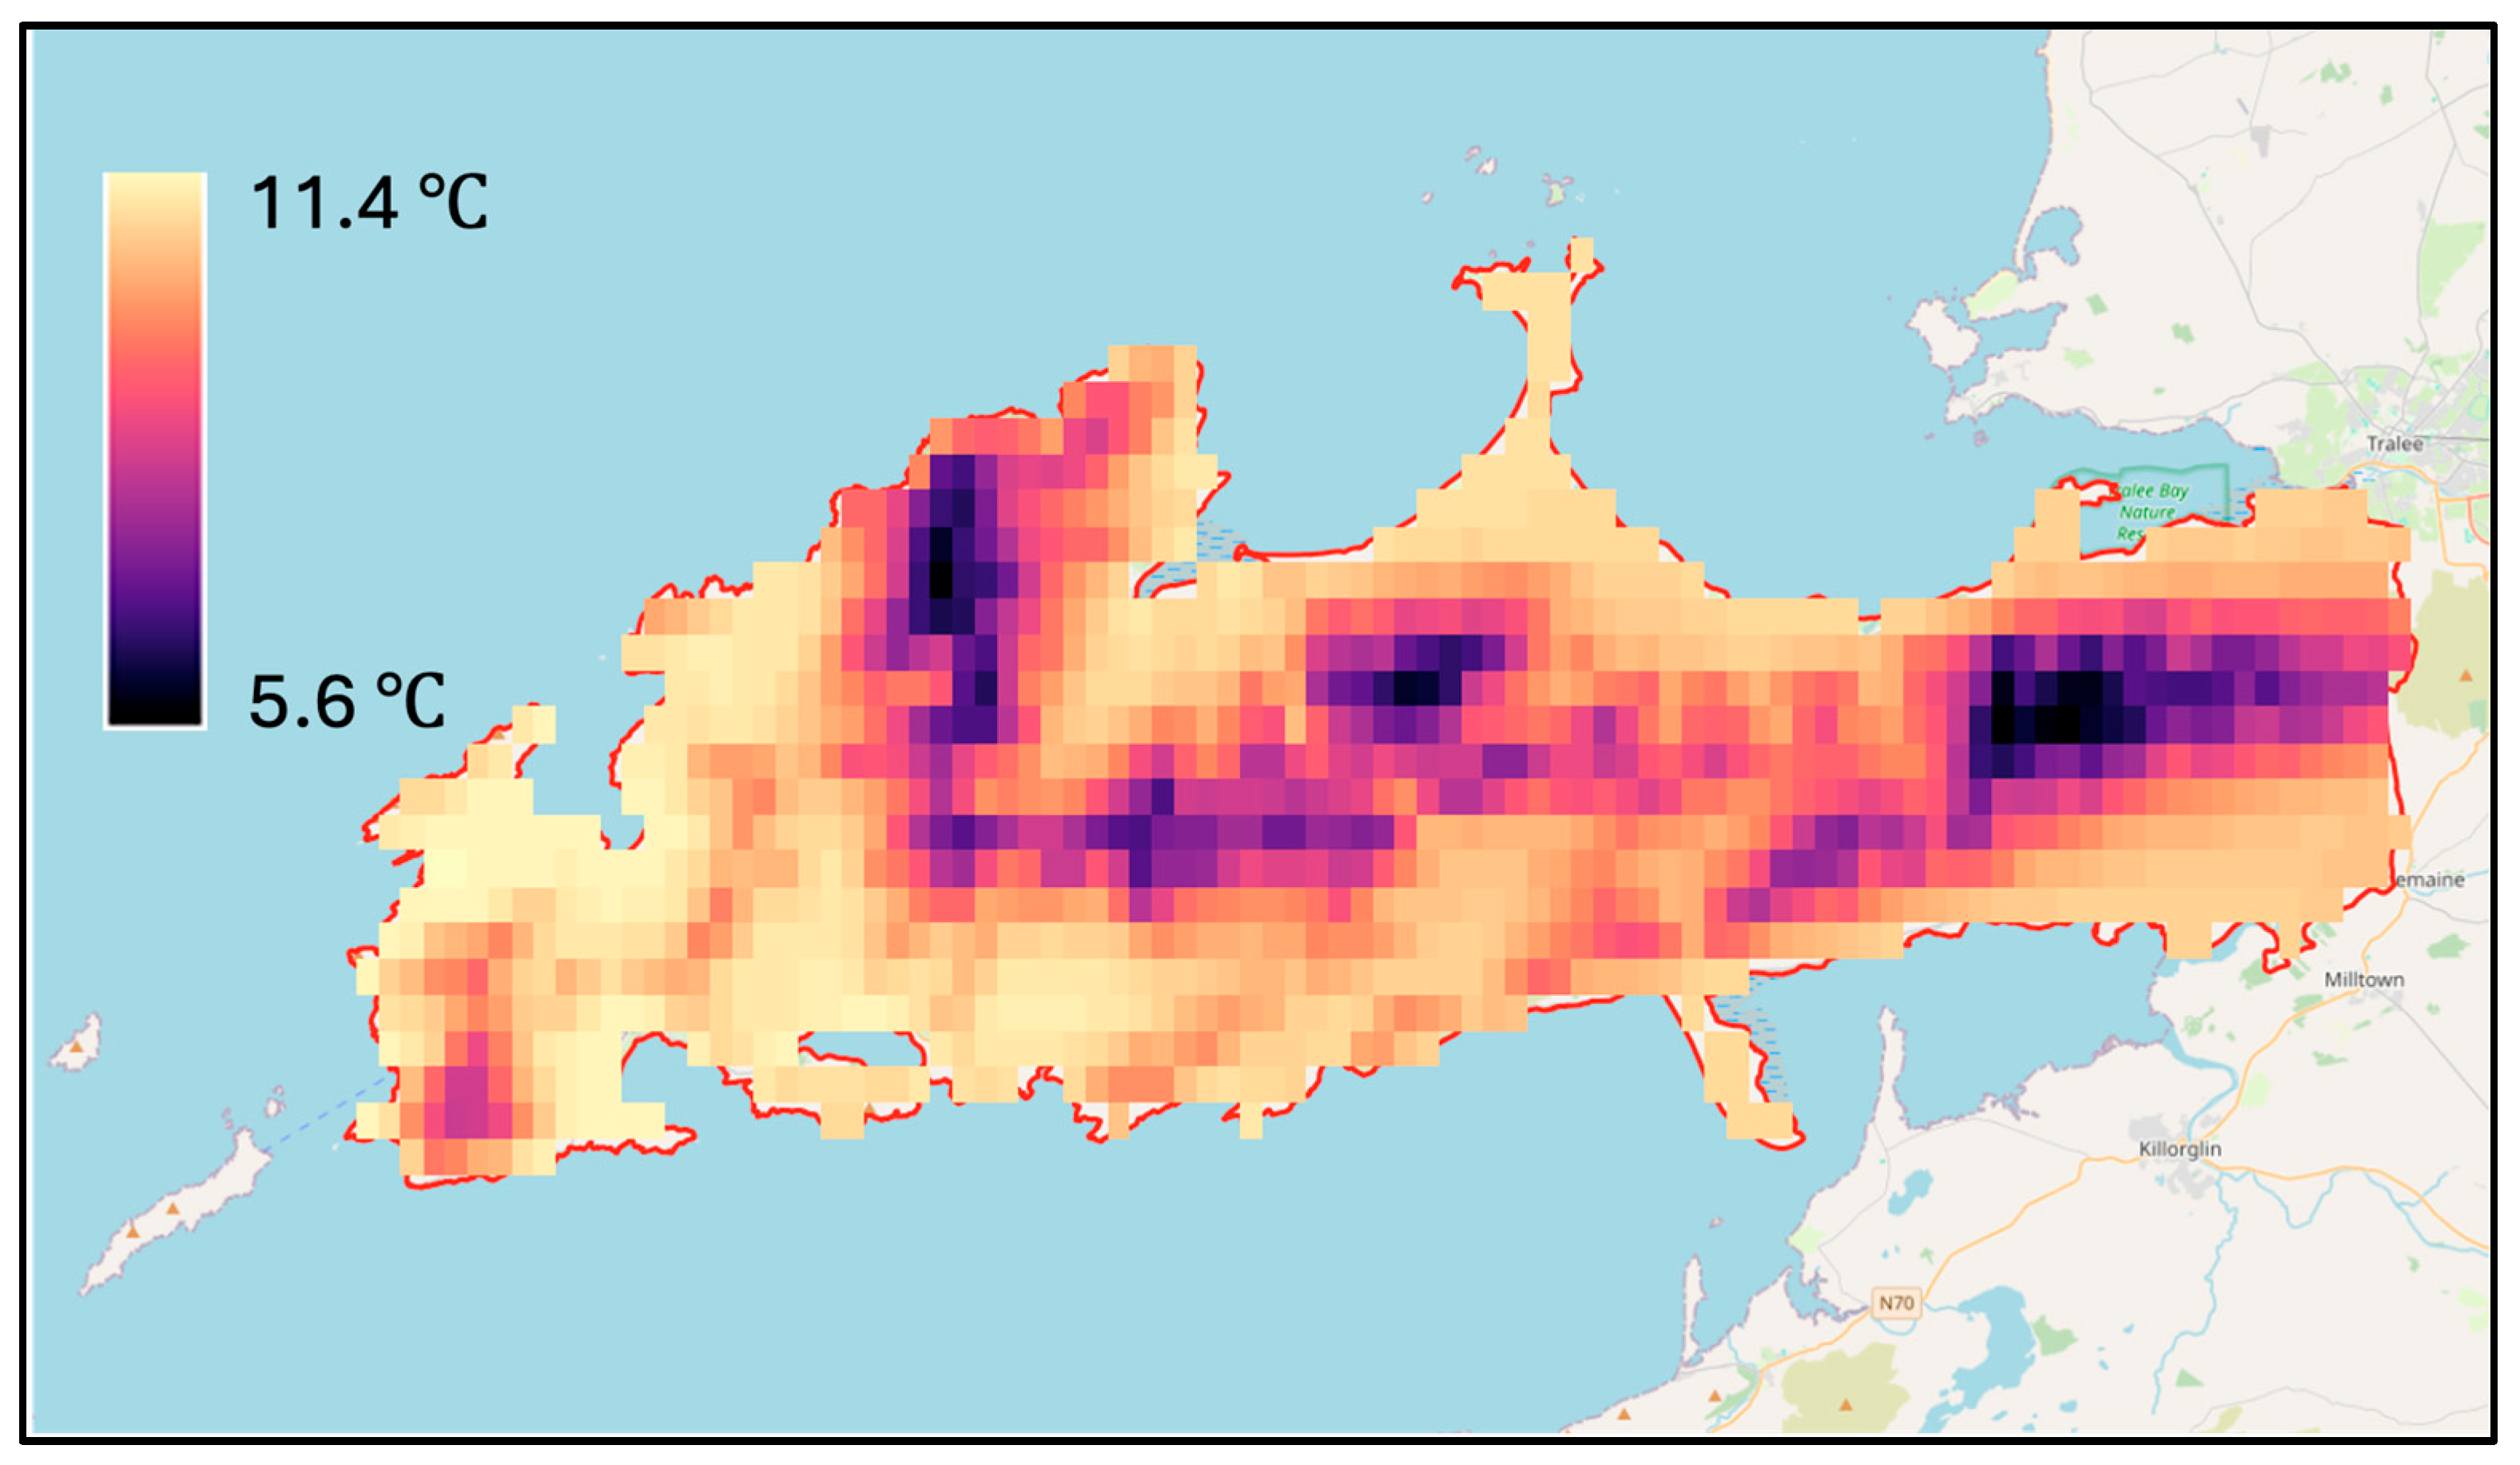
To support this work, we started by analyzing the study area using the Solar Resources Map in QGIS software and incorporating Solargis data [19]. This dataset provides long-term annual averages of global horizontal irradiation (GHI) in kWh/m2 and temperature in °C for Ireland, based on measurements and modelled data from 1994 to 2018. These two weather parameters influence solar energy generation by impacting PV performance. Solar irradiance, which exhibits strong geographic and temporal variability, is the most significant factor. Additionally, an increase in module temperature reduces efficiency by around 0.4–0.5% per degree Celsius, which can limit productivity in warmer conditions [20]. For this reason, particular attention is given to this parameter in our analysis of the study area. As shown in Figure 2, the annual average GHI on the Dingle Peninsula ranges from 682.96 to 986.17 kWh/m2, while the annual average temperature varies from 5.6 to 11.4 °C (see Figure 3).

2.1.2. Dataset Exploration

The original dataset comprised ten houses fitted with battery storage and rooftop PV panels installed at an inclination of around 35° and facing predominantly south. Given this uniform configuration, we assumed that the PV systems were in comparable condition. Therefore, it was considered more advantageous to predict PV energy generation for all houses simultaneously using only relevant weather parameters than to develop separate predictions for each household. For this study, we used a weather dataset alongside data from four randomly selected PV households with battery storage. This approach was adopted to avoid selection bias, ensure reproducibility and simplify the initial stage of the analysis. The energy-related dataset for each house in the study area comprised the following variables: PV energy generation (Wh), household energy consumption (Wh), battery charging/discharging (Wh), battery state of charge (%), energy imported from the grid (Wh), and energy exported to the grid (Wh). The weather dataset included measurements of wind speed (knots), wind direction (degrees), dry-bulb temperature (°C), CBL pressure (hPa), rainfall (mm), and solar radiation (J/cm2). In this study, the solar radiation values were converted to Wh/m2 by multiplying the original values by 2.778. Both datasets were recorded at one-minute intervals throughout 2020.
The correlation between weather parameters and PV energy yield (Wh) for each selected house was examined in further analysis. The Pearson correlation coefficient (via the Pandas library [21]) was used, with a range of −1 to +1: A perfect positive linear association is indicated by +1, no linear association by 0, and a perfect negative linear association by −1. As Figure 4 illustrates, the total solar radiation (Soltot) is the key factor influencing PV electricity generation, demonstrating a strong positive relationship with production across all rooftop systems (Prod_h1–Prod_h4). A positive correlation between dry-bulb temperature (drybulb) and production has been observed, but its effect appears secondary and may be nonlinear due to module efficiency losses at elevated temperatures. Other meteorological variables display weak correlations. This suggests limited direct influence on PV generation. These results support our assumption of single-input modelling: solar irradiance alone is sufficient for predicting multi-household rooftop PV electricity generation within the same neighborhood. Consistent with a shared irradiance forcing and local micro-weather conditions, the PV electricity generation series of different households are also strongly correlated, which reinforces the feasibility of a pooled, irradiance-only forecasting approach.
Since our work focuses on solar energy generation, we exclude all other energy-related variables and consider PV energy generation variable only. For weather parameters, we only take into account solar radiation because it shows a moderate correlation with solar energy generation, as determined by correlation analysis above. The visual presentation of the final dataset for solar energy generation and solar radiation can be seen in Figure 5.

2.2. Model

The aim of this study is to develop two separate models: one for predicting PV energy yield and another for forecasting solar radiation. According to the literature, machine learning models are primarily used for regression tasks, such as predicting PV energy generation, whereas deep learning architectures are more commonly used for solar radiation forecasting with multi step ahead. In this study, we evaluate several machine learning models for predicting solar energy generation. The models are: Random Forest; XGBoost; K-Nearest Neighbors; LightGBM; Decision Tree; and a Multilayer Perceptron (MLP) neural network. The hyperparameters for each model were selected based on literature reviews and preliminary testing, as summarized in Table 1.
The second objective of this study is to forecast solar irradiance. To achieve this, the selected models must be capable of time series analysis to enable them to learn from past observations and predict future values. For this purpose, we employed several widely used models and evaluated their performance. These were LSTM, Bidirectional LSTM, GRU, Hybrid CNN–LSTM and Hybrid LSTM–CNN. The architecture of model can be seen in Table 2.

2.3. Proposed Workflow

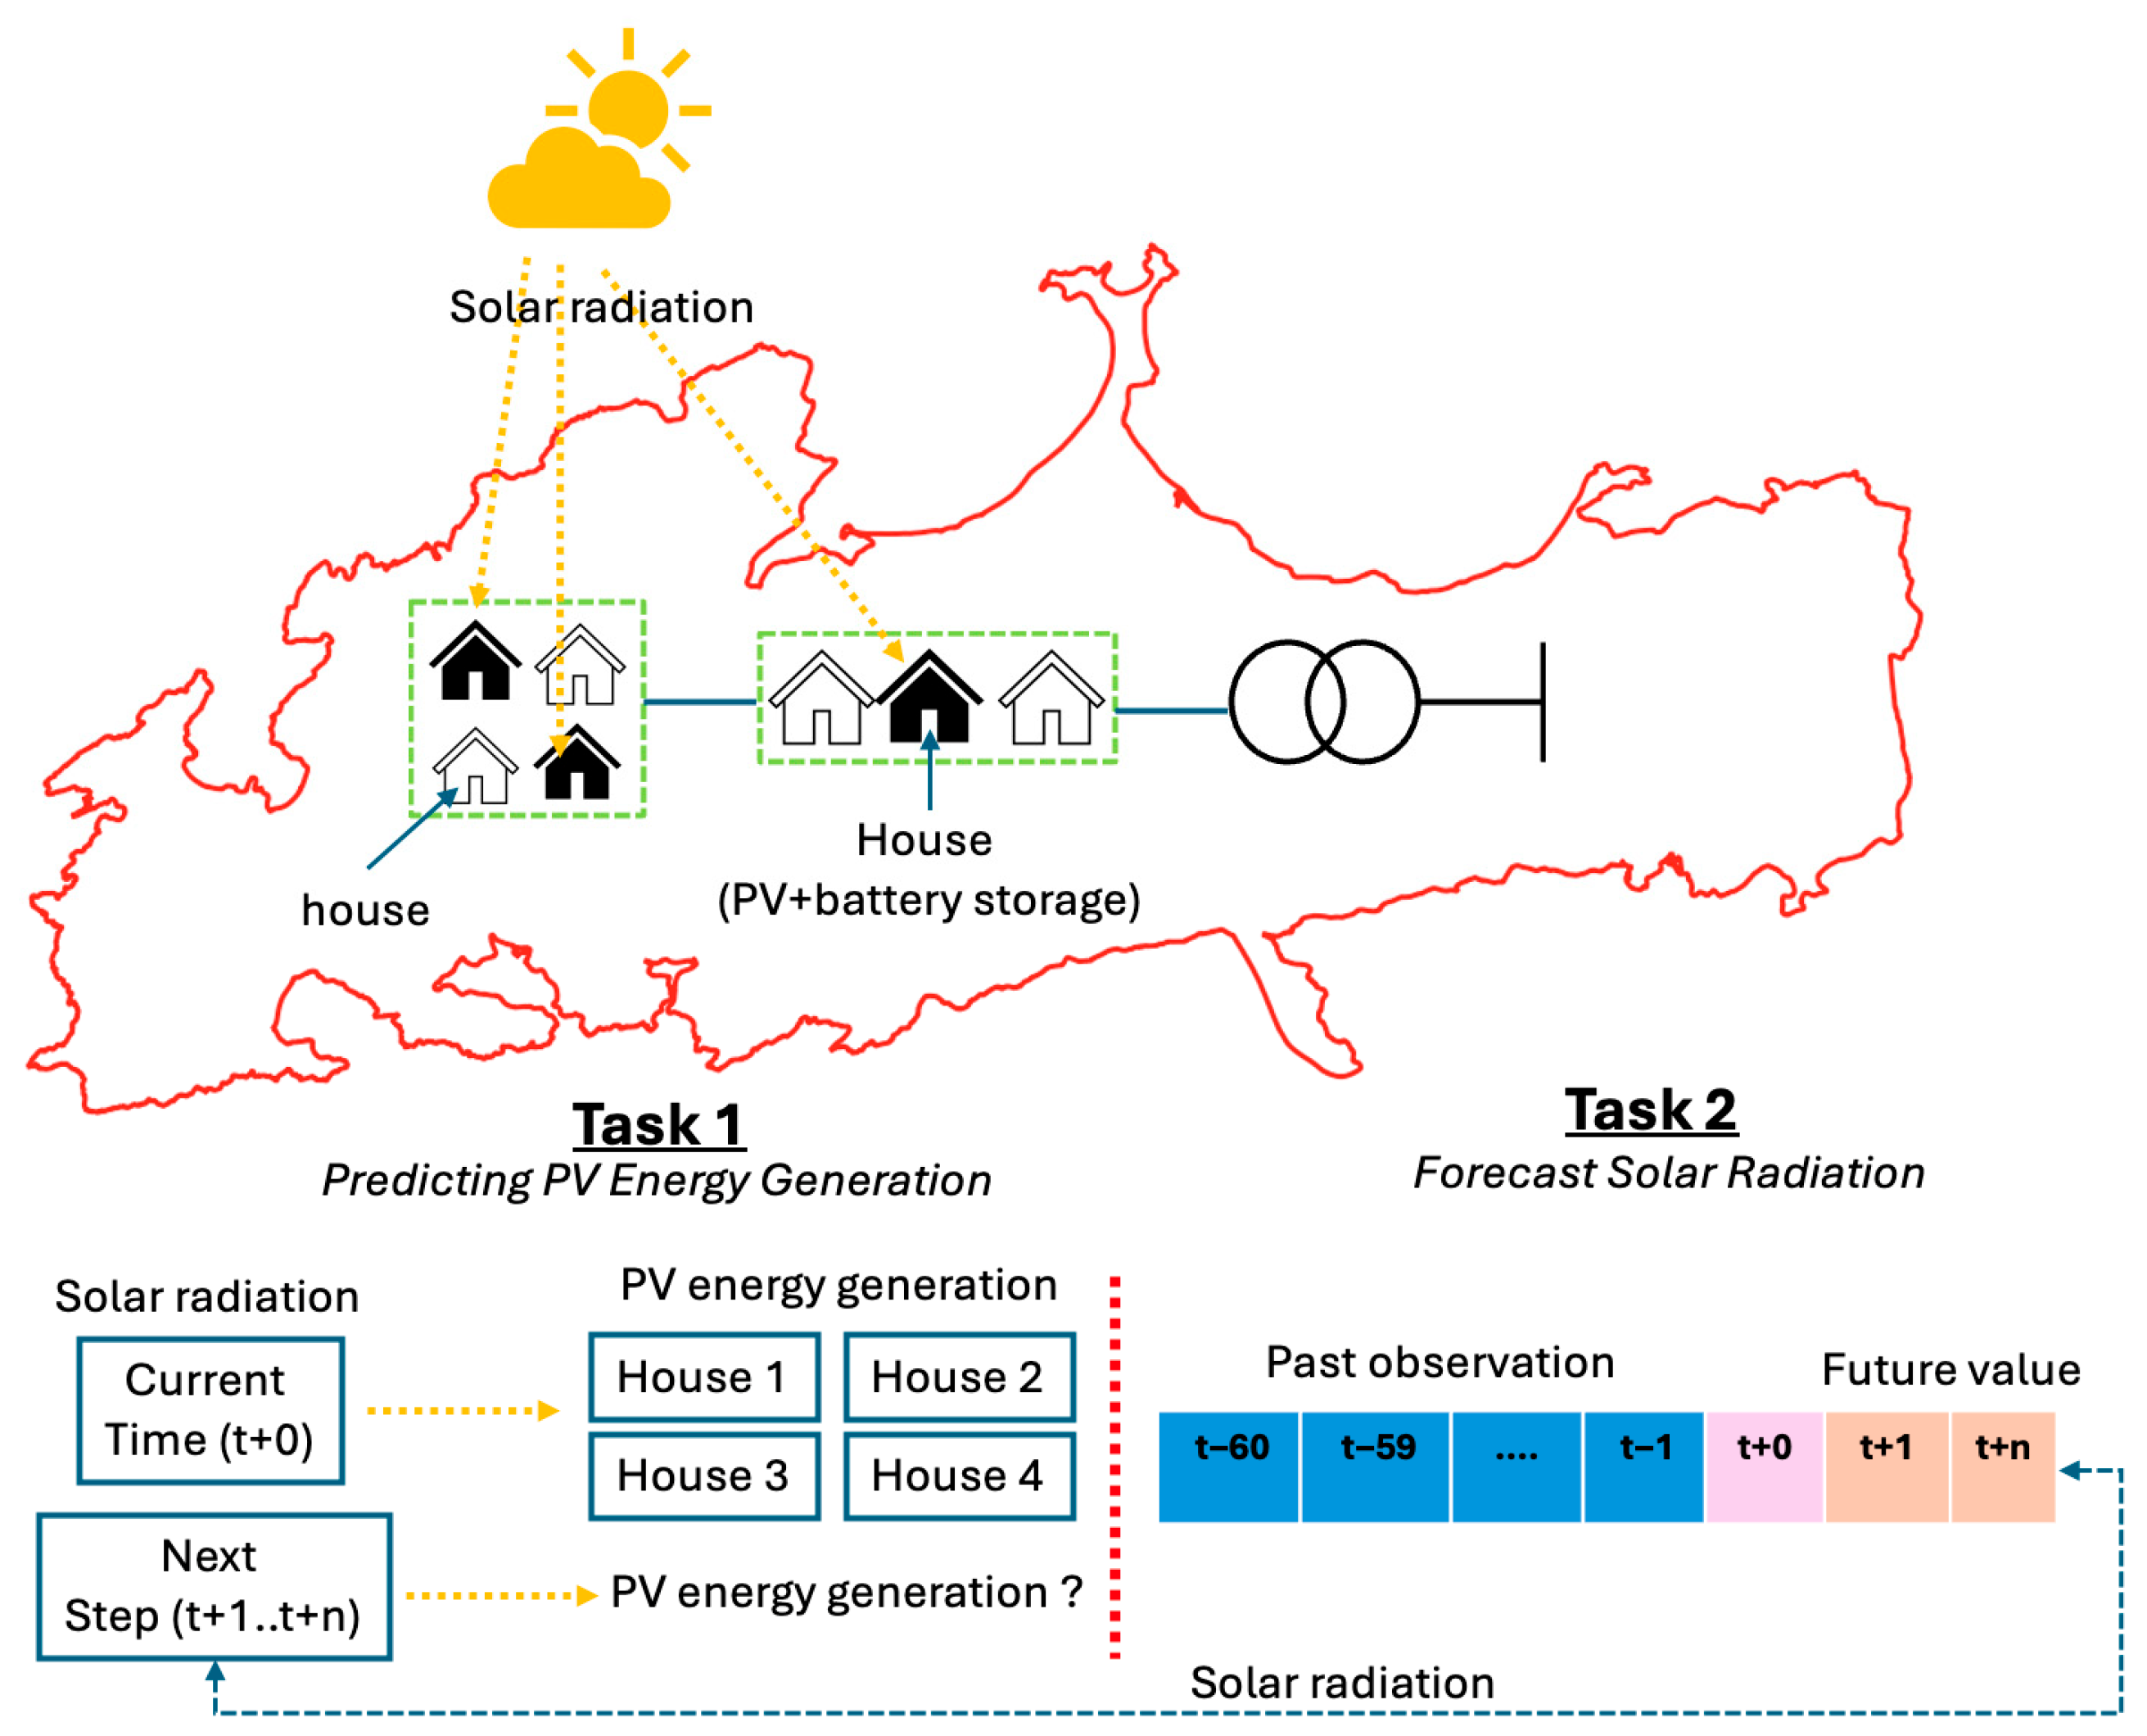
This stage outlines the technical workflow designed to address the study’s two primary objectives. The first task is to predict the PV energy yield of all households in the energy community simultaneously using solar radiation only as the main predictor. However, in this work, short-term PV generation forecasting (e.g., one or 15 min ahead) requires forecasted solar radiation values, which are not always directly available. To overcome this limitation, historical solar radiation data in this study were used to develop a forecasting model that can predict the next time step of solar radiation as the second task of this research. The forecasting results from Task 2, which predict future solar irradiation values, were used as inputs for the PV generation prediction model. This enabled short-term forecasting of PV energy production. Figure 6 illustrates the overall task.
In both Task 1 and Task 2, the process began with the collection of data to standardize and align the formats of the weather and PV energy yield data within the selected energy community. This step ensured proper time synchronization between the two datasets. As the datasets were not originally recorded over the same time period, each was filtered to include records only from 01:01:00 on 1 January 2020 to 23:59:00 on 31 December 2020. Subsequently, correlation analysis was used to visually explore the weather parameters and PV energy yield variables to identify those that exhibited the strongest relationship with PV energy production.
Data preprocessing was then performed as a crucial step in the workflow to ensure the accuracy and reliability of the prediction and regression models. Once the raw data had been collected, it was validated for completeness to prevent missing values and confirm the availability of all the necessary parameters. At this stage, Task 1 involved predicting PV energy generation for multiple entities using solar irradiation data as the sole input. The dataset was then restructured by defining the X (input) and Y (output) variables for the machine learning models. Here, X represents the solar irradiation data and Y corresponds to the PV energy production of four households. The X and Y values were then normalized to a range between 0 and 1 using the Min–Max Scaler method to ensure consistent scaling across the variables. Finally, the dataset was divided into 80% for training and 20% for testing to enable evaluation of the models’ performance.
In contrast, the data preprocessing procedure for Task 2 differed from that for Task 1, as the main objective was to predict solar irradiation 15 min ahead based on historical values. Consequently, the time-series data required different treatment and specific pre-processing rules tailored to this forecasting task. First, the historical solar irradiation dataset is normalized using the min–max scaler method within the range of 0 to 1, and then it is restructured using a sliding window technique to create input–output sequences. The input window size is 60 steps, the output window size is 1, and the forecast horizon is 15 steps ahead. This means that the model uses data from the previous 60-time steps to predict the solar irradiation value 15-time steps into the future. Finally, the generated sequence data is split into training and testing sets in the same ratio as in Task 1: 80% for training and 20% for testing.
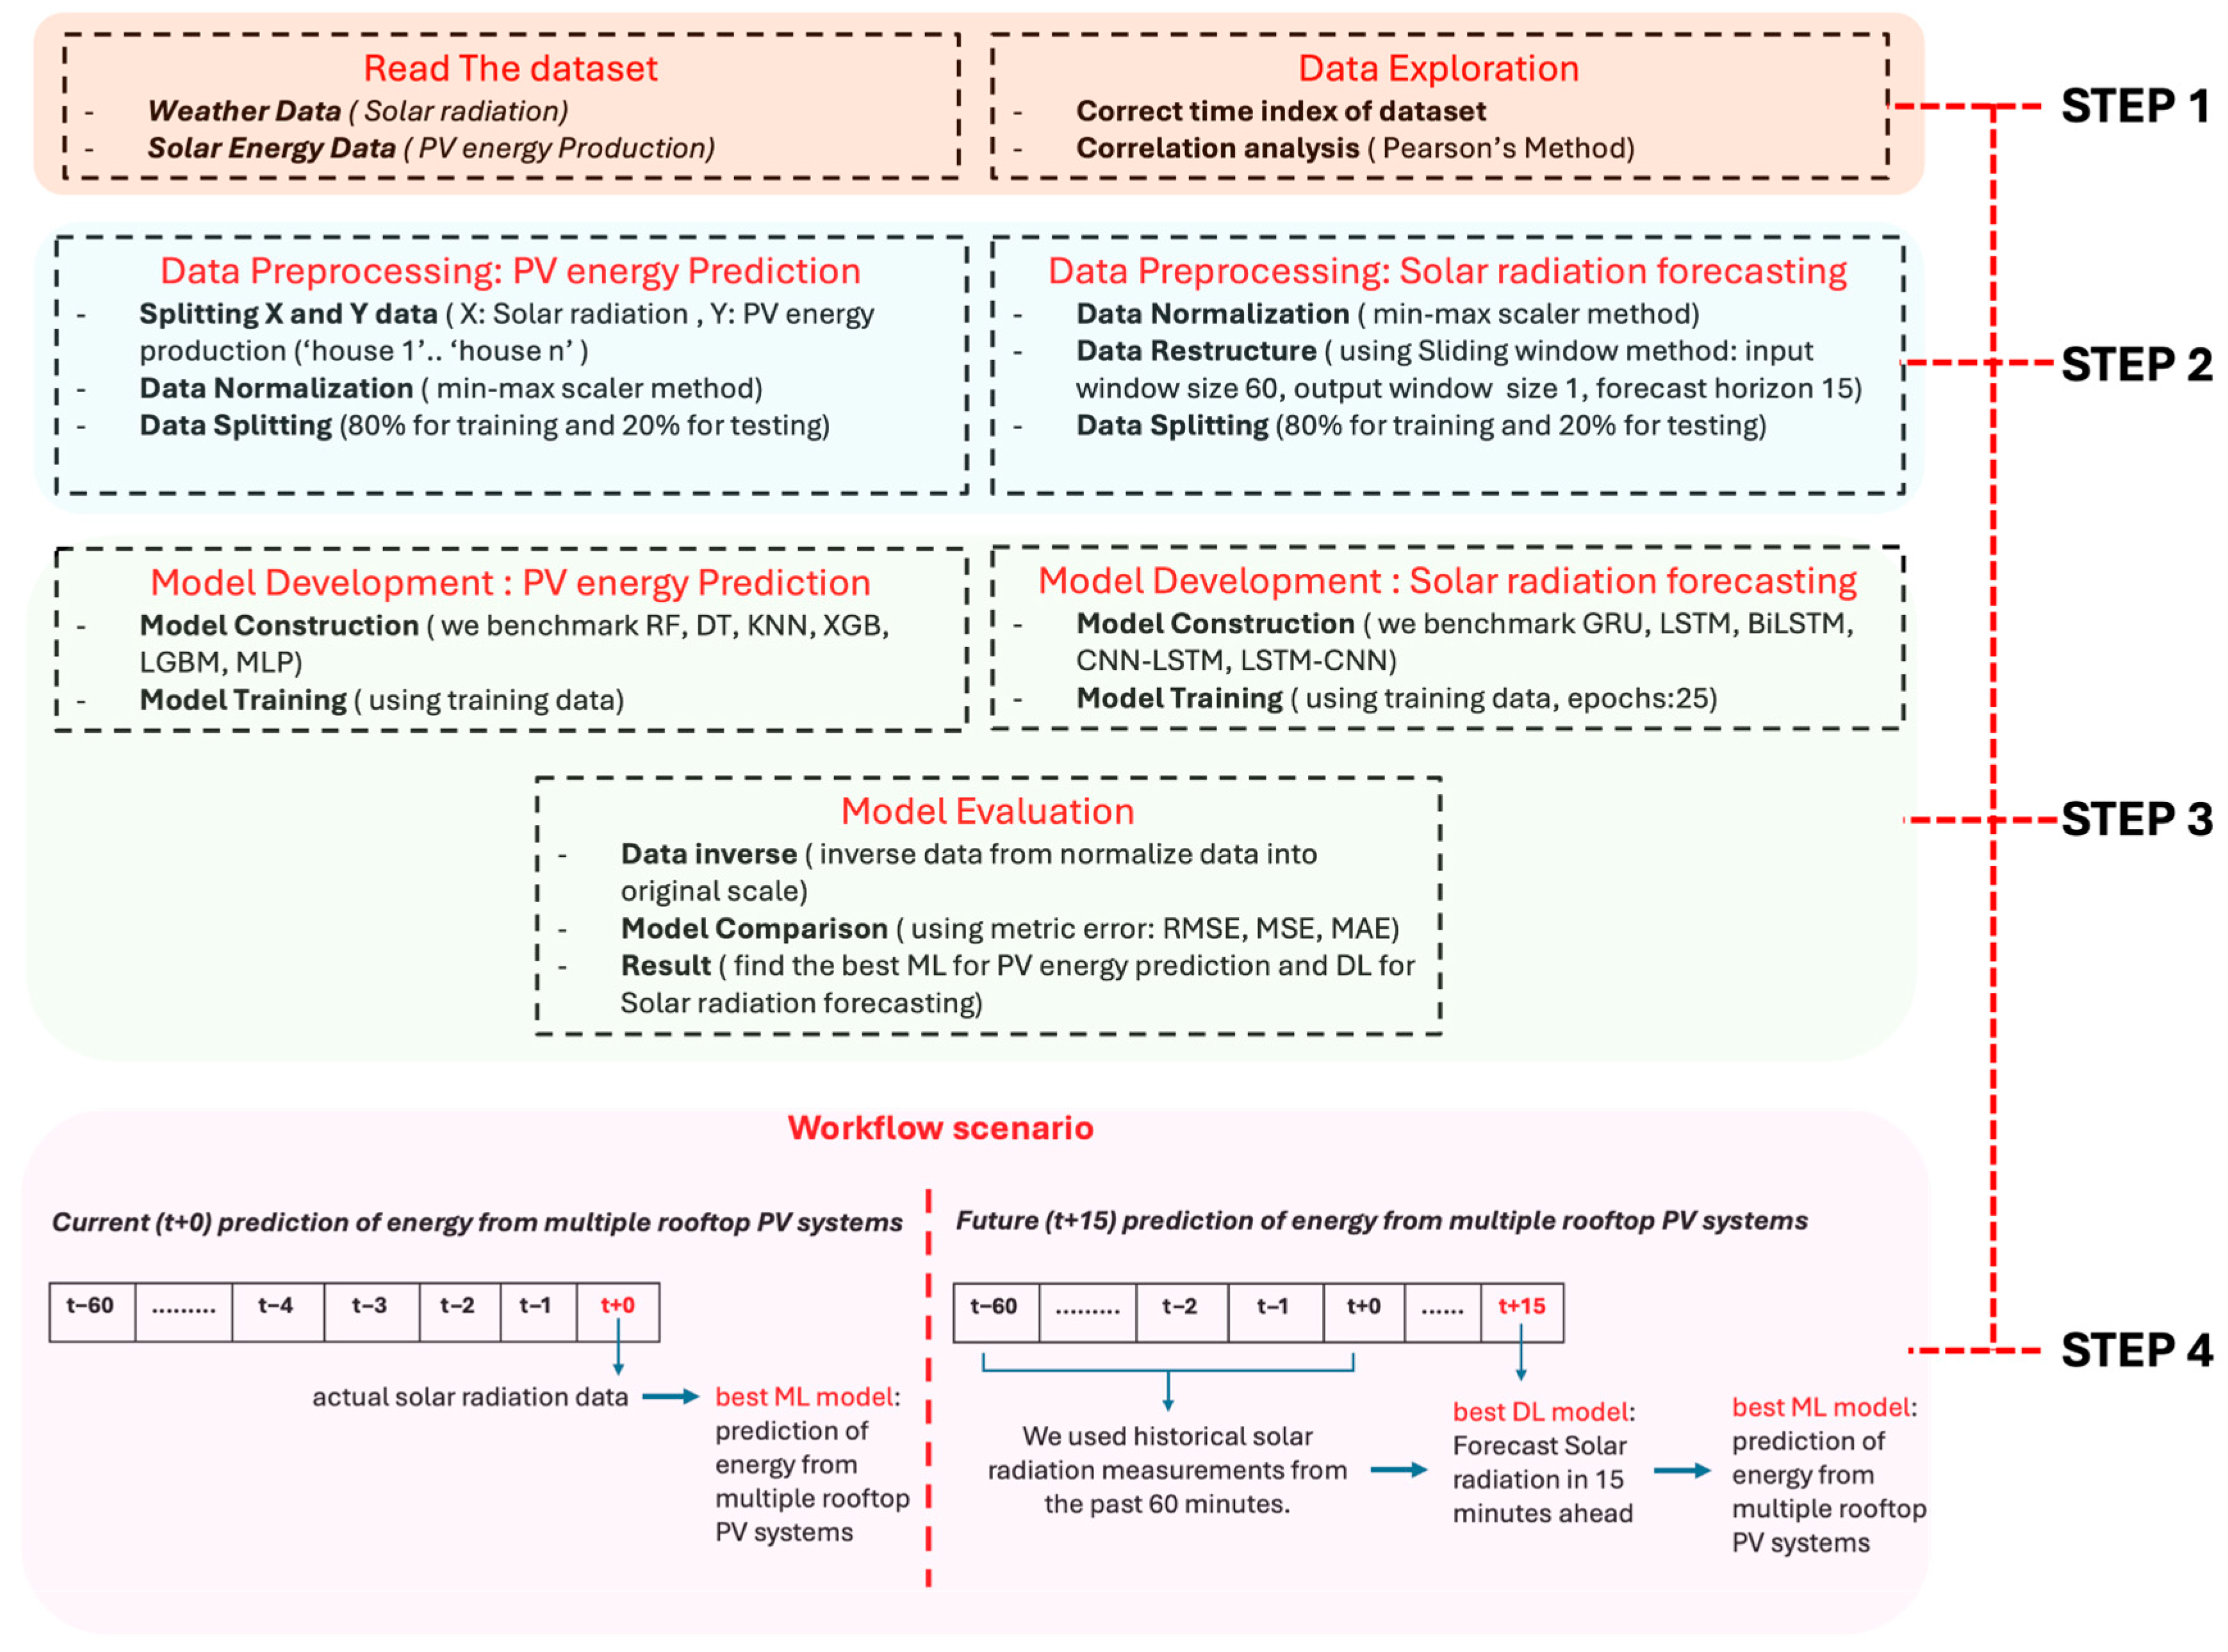
The main objective of this research is to develop a reliable, data-driven model that can predict PV energy generation across multiple households based solely on forecasted solar irradiation. To achieve this, two separate models were developed: The first focuses on predicting PV energy generation and the second on forecasting solar irradiation. During the model development stage, several machine learning algorithms (see Table 1) were trained to predict PV energy generation, and various deep learning architectures (see Table 2) were trained to forecast solar irradiation time series. Following the training phase, the model was evaluated using the testing dataset. We converted the prediction results from the normalized to the original scale and assessed their performance using error metrics (as presented in Equations (1)–(3). Finally, the best-performing model for PV energy generation was selected among the trained machine learning models, and the best-performing model for solar irradiation forecasting was chosen among the trained deep learning models. The visual concept of the workflow of both task 1 and task 2 is presented in Figure 7.
R M S E = t = 1 N y t y ^ t 2 N
M S E = t = 1 N y t y ^ t 2 N
M A E = t = 1 N y t y ^ t N

3. Results and Discussion

3.1. Predicting PV Energy Generation

At this stage, several machine learning models were compared in order to predict PV energy generation of selected houses in energy communities. Each model was trained using a training dataset in which X denotes solar irradiation and Y represents the PV energy generation (Wh/1 min) of four households (Y1—House 1; Y2—House 2; Y3—House 3; Y4—House 4). The trained models were subsequently evaluated. This was done using unseen testing data. This was used to assess their generalization performance.
As shown in Table 3, the root mean square error (RMSE) results indicate that the Random Forest model produced the most accurate predictions across all households, followed by the decision tree model. Similarly, the mean squared error (MSE) results (see Table 4) show that the Random Forest model outperformed the other models, with the decision tree and LightGBM models ranking next. Furthermore, the mean absolute error (MAE) results in Table 5 consistently confirm that the Random Forest model achieved the best performance of all the models evaluated across the four households. Based all the evaluated performance metrics, the Random Forest model demonstrated the highest predictive accuracy across the four households. It achieved an average root mean square error (RMSE) of 5.352 Wh, a mean squared error (MSE) of 28.742 Wh, and a mean absolute error (MAE) of 2.853 Wh.
Based on our research, the Random Forest model performed robustly in predicting PV energy generation of selected household in energy community when solar irradiation was the only input. This model’s effectiveness has also been confirmed in reference [29], which proposed combining the Random Forest model with a bidirectional LSTM network for PV power forecasting. This hybrid model achieved superior accuracy in predicting ultra-short-term PV power under varying meteorological conditions. Meanwhile, A study [33] presents a Random Forest (RF)-based forecasting model designed to predict daily photovoltaic (PV) power generation in northern China during winter, effectively overcoming the challenges posed by severe air pollution and variable weather conditions. The findings show that the Random Forest model is highly effective for winter PV forecasting, especially in regions with limited data availability and complex weather variability. Another study (preprint, reference [34]) compares the performance of two ensemble machine learning algorithms, Random Forest (RF) and Extreme Gradient Boosting (XGBoost), for forecasting solar radiation in Ho Chi Minh City, Vietnam. Both models achieved high predictive accuracy (R2 ≈ 0.955), but the RF model produced slightly lower error values (RMSE = 61.09, MAE = 24.37) than XGBoost (RMSE = 61.31, MAE = 25.08). The findings suggest that Random Forest offers marginally superior predictive capability, establishing it as a robust approach for solar radiation estimation in tropical climates.
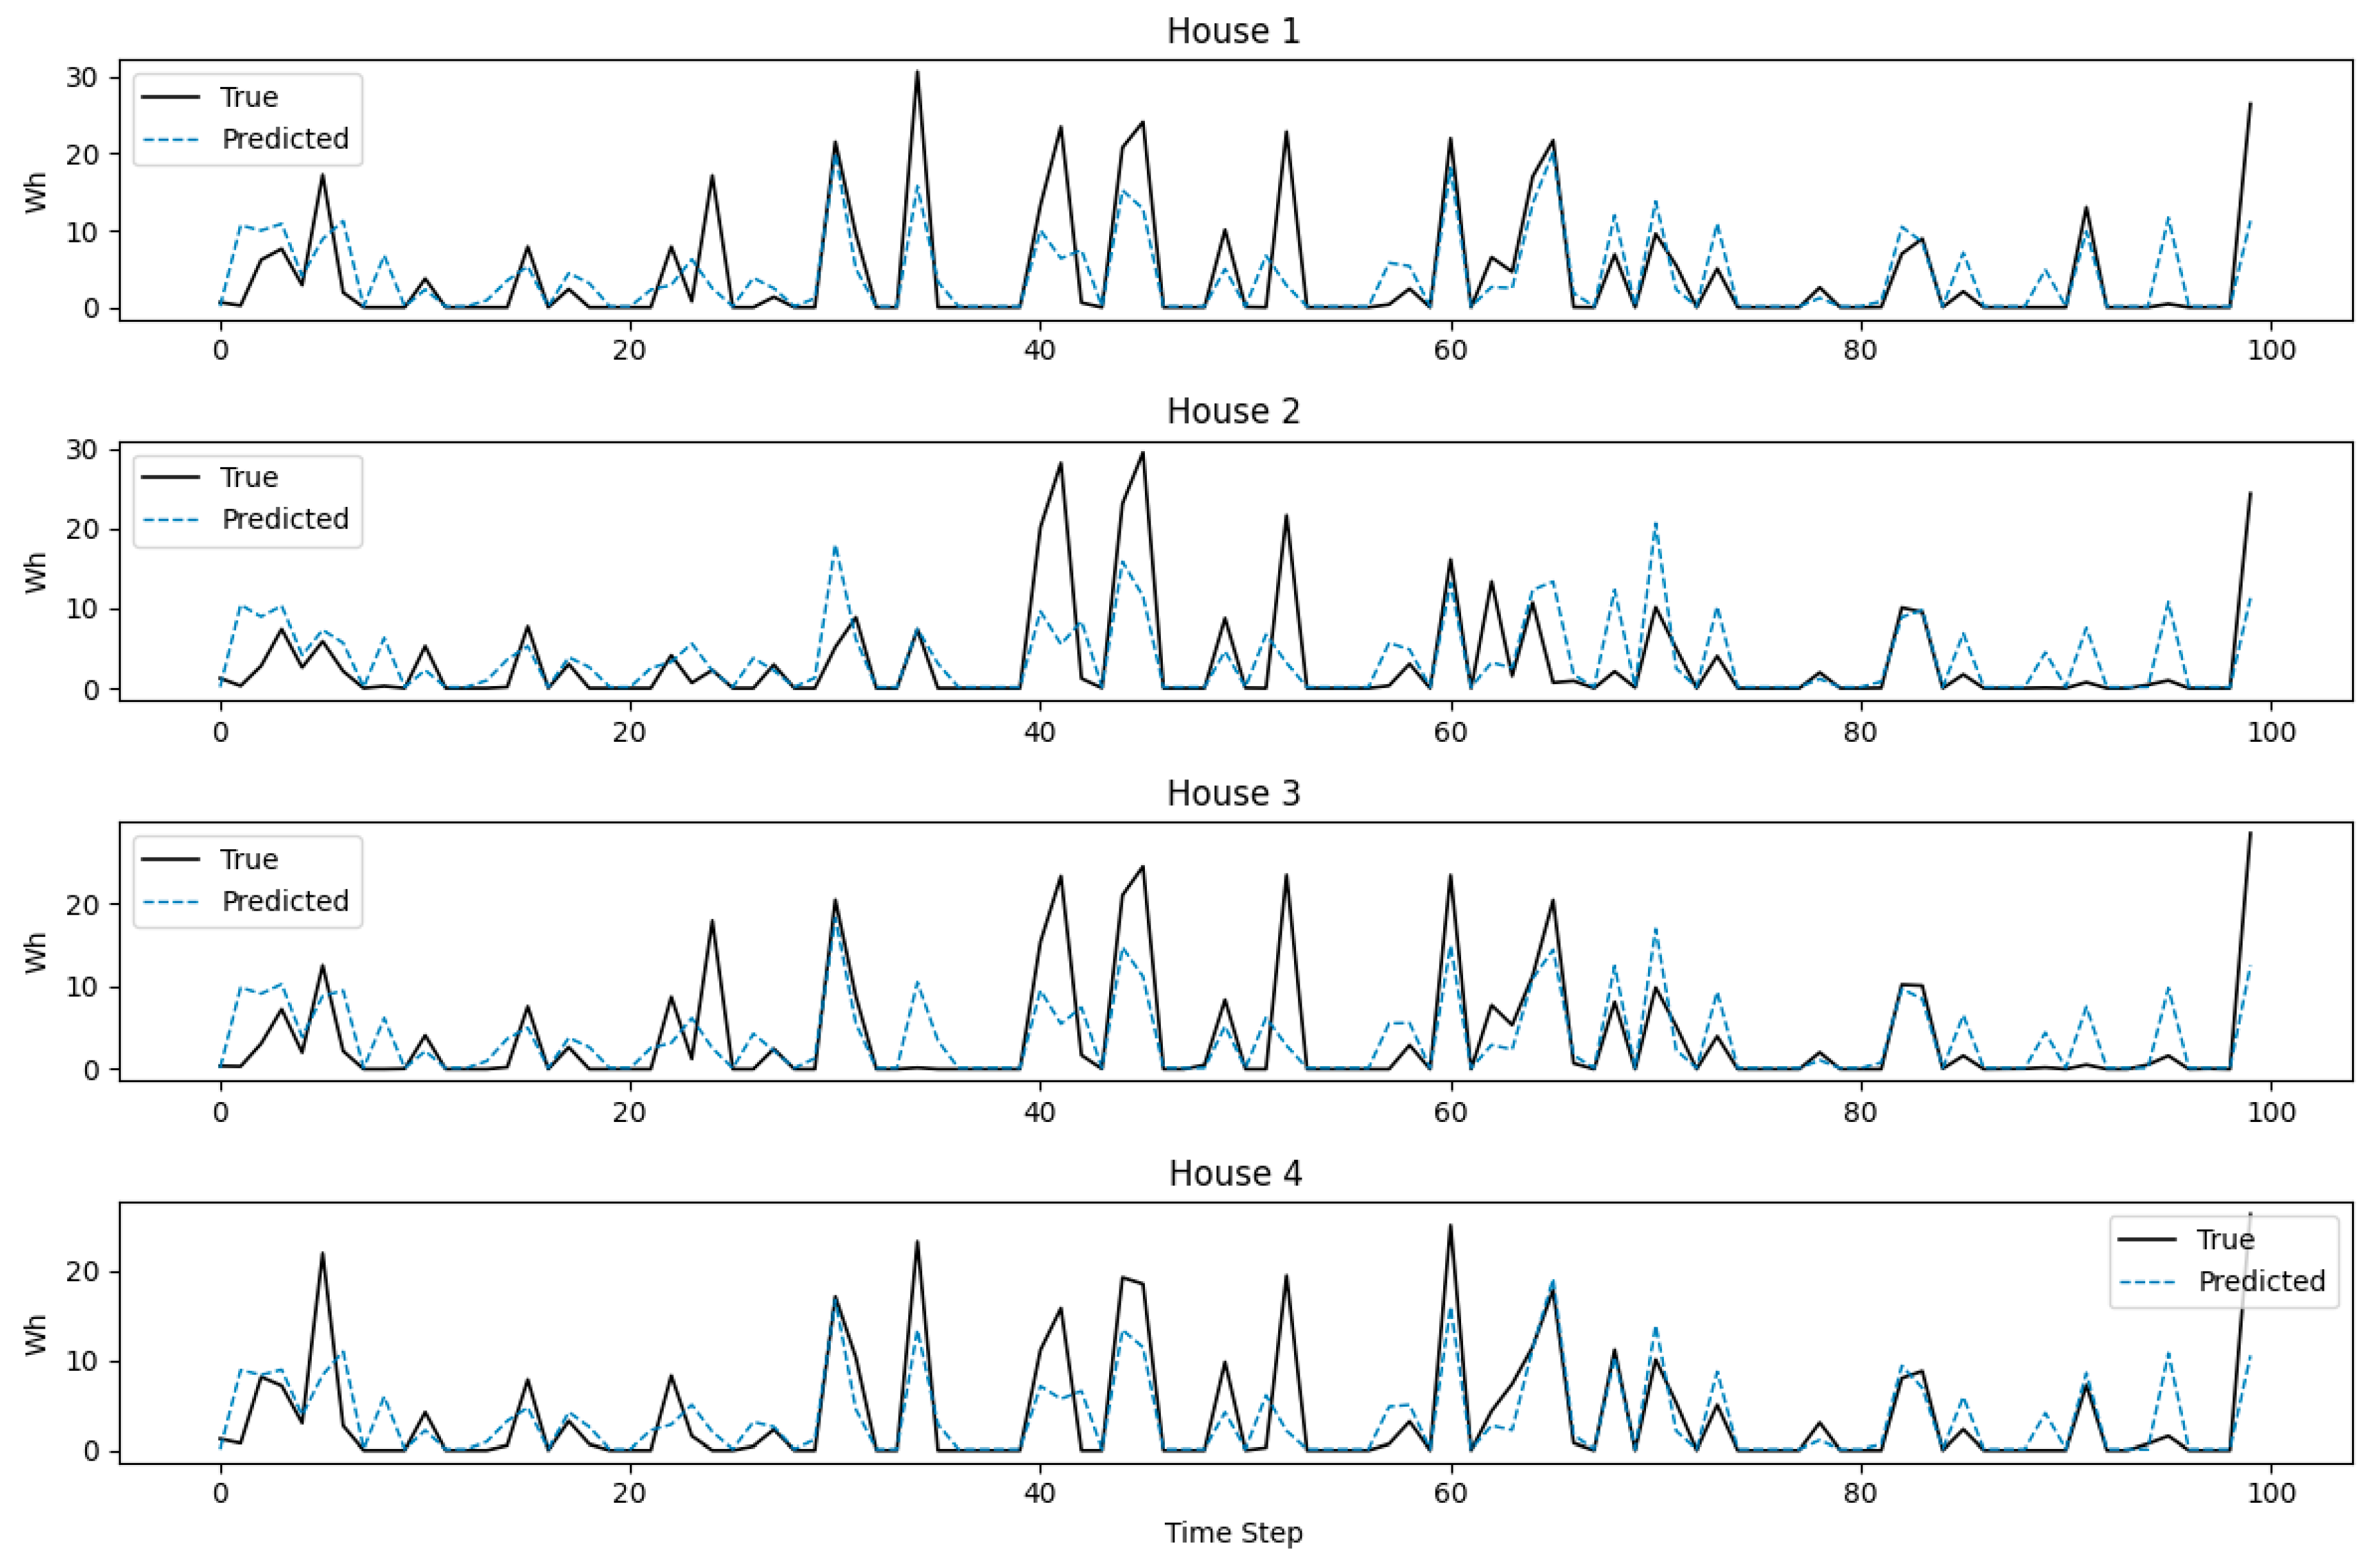
Since the Random Forest model demonstrated robust performance at this stage, it was used to predict the solar energy production of four households selected from within the energy community. Figure 8 below shows a comparison of the predicted and actual solar energy production for each household.

3.2. Solar Irradiation Forecasting (Minutes Ahead)

In Task 2, the primary variable to be predicted is solar irradiation. The objective is to forecast future solar irradiation values, which will then be used to predict photovoltaic (PV) energy production. Several deep learning architectures that are well-suited to time series analysis were tested to identify the most effective model for solar irradiation forecasting. These included LSTM, Bidirectional LSTM, GRU, CNN-LSTM and LSTM-CNN.
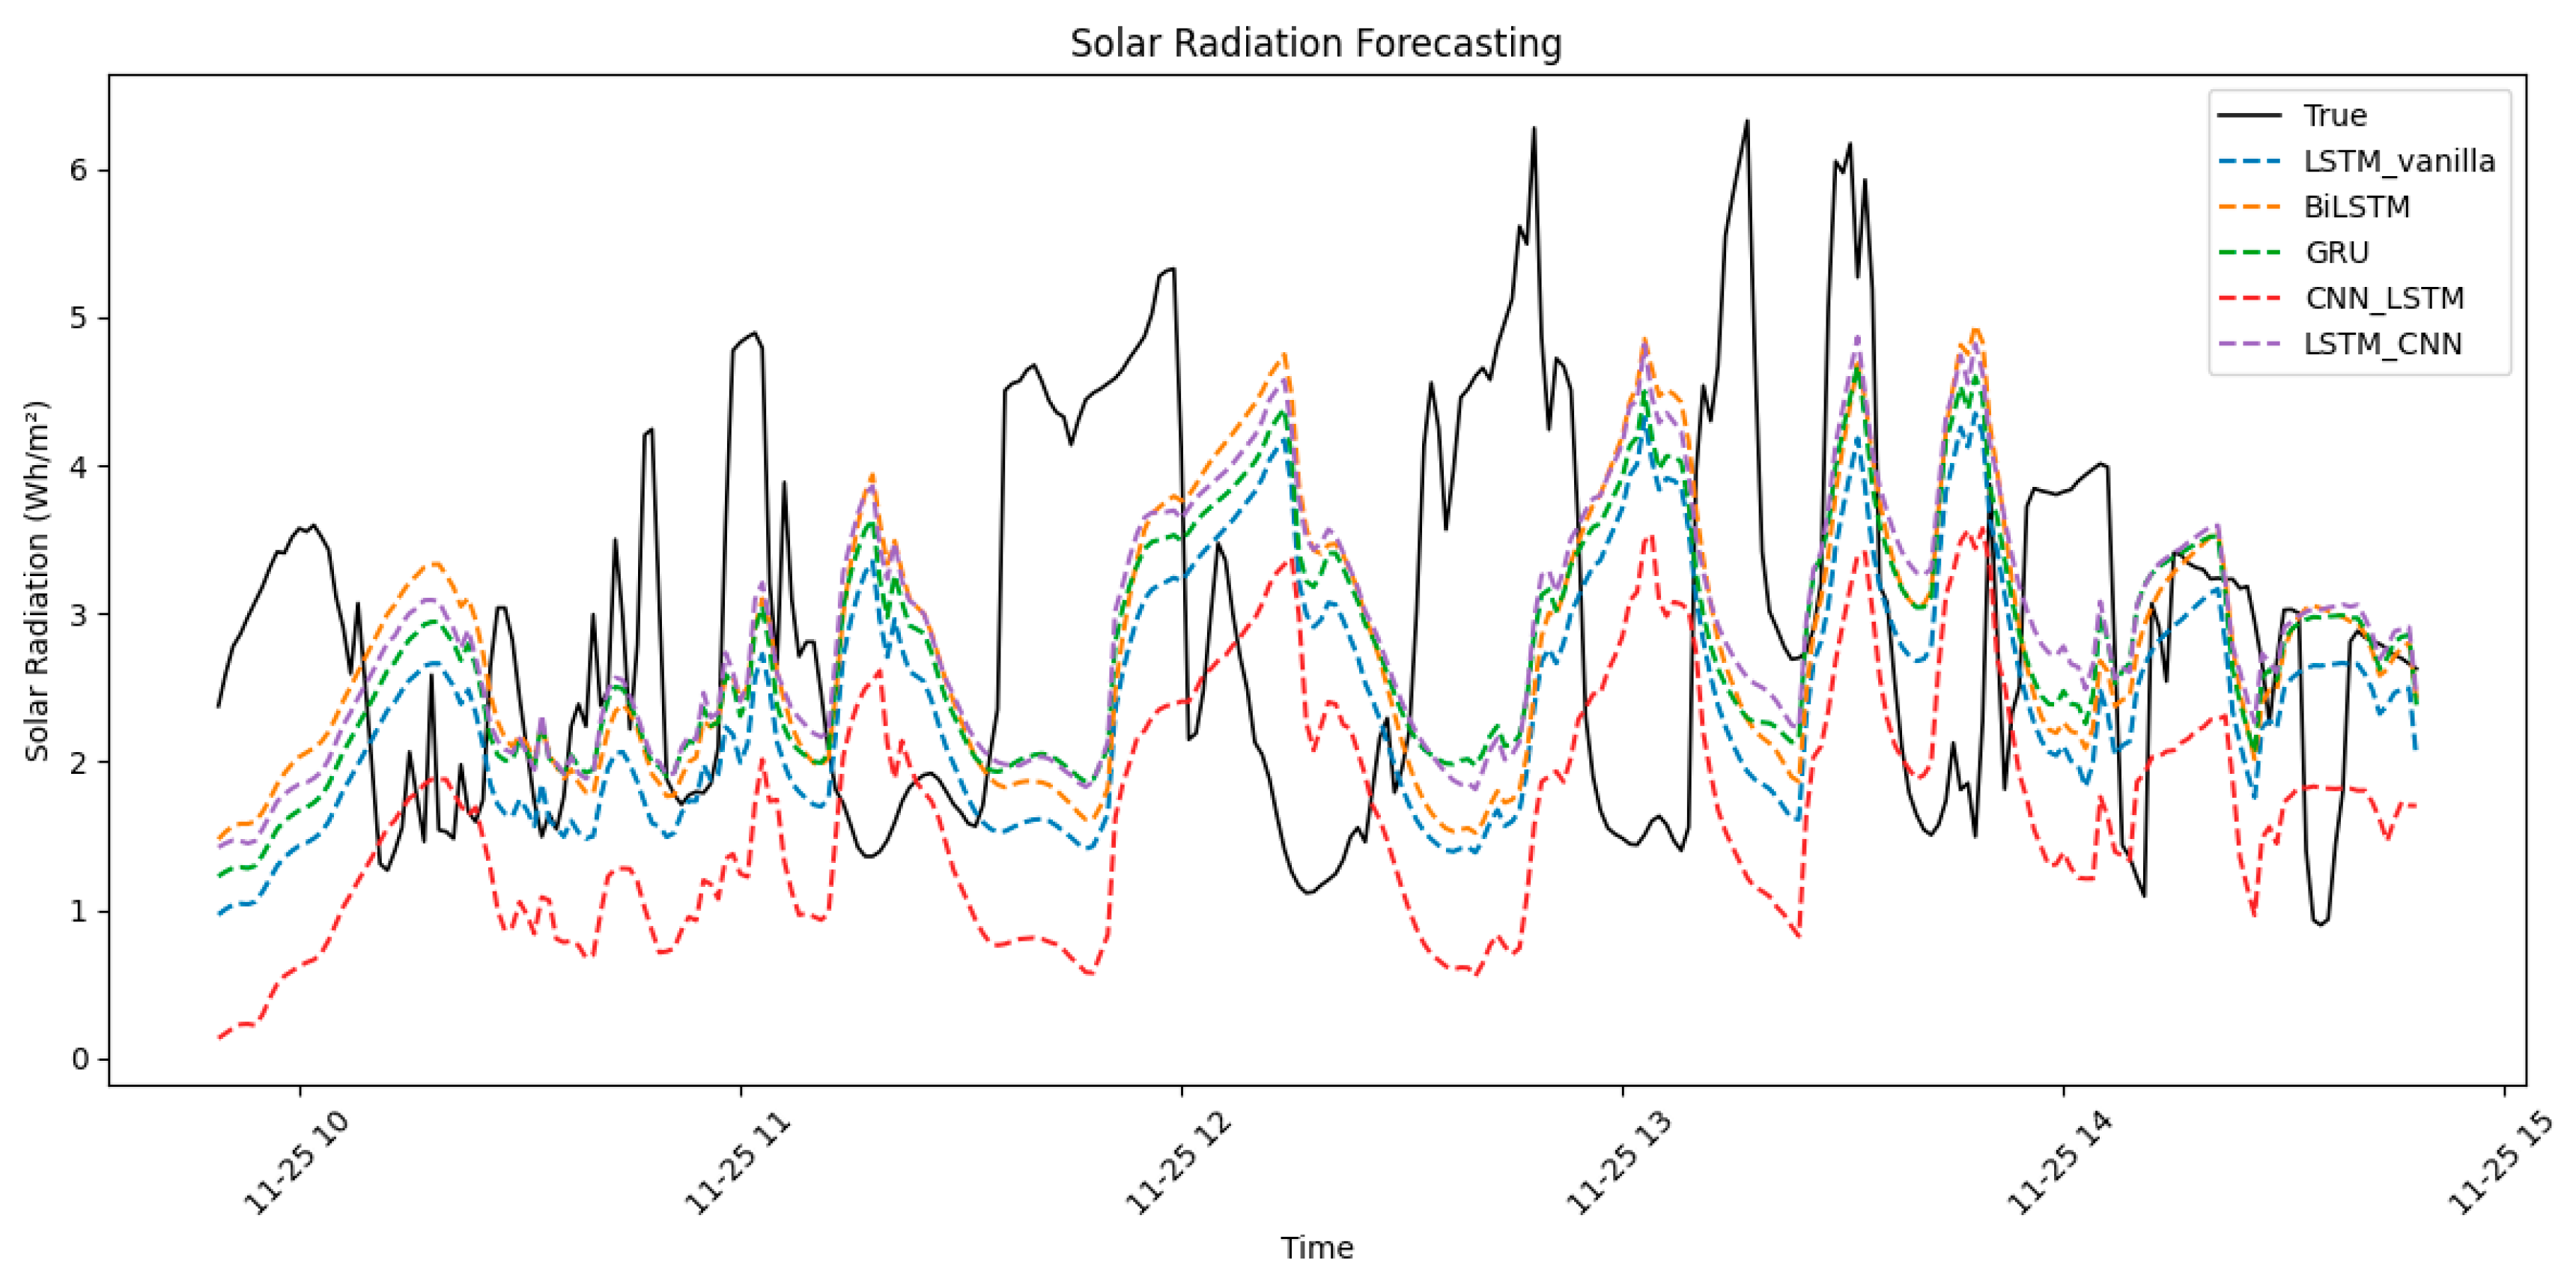
As shown in Table 6, the GRU model achieved the best performance based on the RMSE evaluation with an error of 0.611 Wh/m2, followed by the LSTM-CNN model with an error of 0.622 Wh/m2. In terms of MSE, the GRU model again outperformed the others with an error of 0.373 Wh/m2, achieving the lowest MAE value of approximately 0.238 Wh/m2. These results highlight the GRU model’s robustness for short-term solar irradiation forecasting, particularly in predicting values 15 min ahead using data from the previous 60 min.
The GRU model has demonstrated strong performance in this forecasting task. This finding is consistent with Reference [35], which states that the GRU architecture’s simplicity and efficiency make it well-suited to PV power forecasting using limited data. It provides reliable short-term predictions with low error rates. In reference [36], the authors presented a hybrid model integrating a Gated Recurrent Unit (GRU) and a Temporal Convolutional Network (TCN) for the ultra-short-term forecasting of global horizontal irradiance (GHI). The GRU part adeptly captures both temporal and spatial dependencies within the solar irradiance data. In the forecasting result, we illustrate (see Figure 9) forecast value of solar radiation using unseen data from historical value from 09:49 to 14:48 on 25 November 2020.
This study presents a workflow for predicting household PV energy generation and forecasting solar irradiance within an energy community, implemented using the Streamlit platform version 1.51.0 (see Figure 10). Streamlit is an open-source Python framework (Python version 3.10 in this study) that allows data scientists to create interactive, dynamic data applications with customizable workflows [37]. We developed our analytical workflow and models on this platform to ensure seamless data processing, visualization and model execution. Consequently, the preprocessing stage, including data cleaning, visualization and preparation for machine learning and deep learning models, can be performed efficiently within the selected energy community scenarios for forecasting and prediction tasks.

4. Conclusions

Recently, energy communities have gained increasing attention as local entities that enable neighborhoods to actively participate in organizing actions in support of the clean energy transition through the use of solar energy. However, the unpredictability of PV energy production is often linked to the variability of weather conditions. Therefore, accurate prediction and forecasting are crucial in helping energy communities to optimize their operations and maintain a balance between energy supply and demand.
This study investigated several machine learning models to predict the PV energy production of multiple household rooftop photovoltaic (PV) systems within an energy community, using solar irradiance as the sole input parameter. Accurate solar irradiance predictions are required to enable future energy production forecasting. However, as such data is not always readily available, this research also explores various deep learning architectures to identify the most effective model configuration for forecasting solar radiation.
Our findings show that the Random Forest model performed better than the other models tested, achieving the lowest RMSE, MAE and MSE values when predicting PV energy generation from multiple household rooftop PV systems based on only the solar radiation value. On the other hand, the GRU model excelled in solar radiation forecasting due to its simplicity and ability to capture temporal dependencies. Furthermore, we developed our analytical workflow using the Streamlit platform, which will facilitate future extensions to this research, particularly regarding prediction and forecasting tasks within energy communities.

Author Contributions

Conceptualization, F.A., P.J., V.S. and A.P.; methodology, F.A. and P.J.; software, F.A. and V.S.; validation, F.A., P.J. and A.P.; formal analysis, F.A. and V.S.; investigation, F.A. and A.P.; resources, F.A. and P.J.; data curation, A.P. and V.S.; writing—original draft preparation, F.A., P.J., A.P. and V.S.; writing—review and editing, F.A., P.J. and A.P.; visualization, F.A.; supervision, P.J. and V.S. All authors have read and agreed to the published version of the manuscript.

Funding

This research received no external funding.

Data Availability Statement

The raw data supporting the conclusions of this article will be made available by the authors on request.

Conflicts of Interest

The authors declare no conflicts of interest.

Abbreviations

The following abbreviations are used in this manuscript:
IRENAInternational Renewable Energy Agency
PVPhotovoltaic
CNN-LSTMConvolutional Neural Network—Long Short-Term Memory
LSTM-CNNLong Short-Term Memory—Convolutional Neural Network
WhWatt-hour
GWGigawatt
RMSERoot Mean Square Error
MSEMean Square Error
MAEMean Absolute Error
KNNK-Nearest Neighbors
MLPMultilayer Perceptron
GRUGated Recurrent Unit

References

  1. International Renewable Energy Agency. Renewable Power Generation Costs in 2024. Available online: https://www.irena.org (accessed on 2 November 2025).
  2. Trivedi, R.; Bahloul, M.; Saif, A.; Patra, S.; Khadem, S. Comprehensive Dataset on Electrical Load Profiles for Energy Community in Ireland. Sci. Data 2024, 11, 621. [Google Scholar] [CrossRef]
  3. Coignard, J.; Janvier, M.; Debusschere, V.; Moreau, G.; Chollet, S.; Caire, R. Evaluating forecasting methods in the context of local energy communities. Int. J. Electr. Power Energy Syst. 2021, 131, 106956. [Google Scholar] [CrossRef]
  4. Gaboitaolelwe, J.; Zungeru, A.M.; Yahya, A.; Lebekwe, C.K.; Vinod, D.N.; Salau, A.O. Machine Learning Based Solar Photovoltaic Power Forecasting: A Review and Comparison. IEEE Access 2023, 11, 40820–40845. [Google Scholar] [CrossRef]
  5. Lari, A.J.; Sanfilippo, A.P.; Bachour, D.; Perez-Astudillo, D. Using Machine Learning Algorithms to Forecast Solar Energy Power Output. Electronics 2025, 14, 866. [Google Scholar] [CrossRef]
  6. Singh, U.; Singh, S.; Gupta, S.; Alotaibi, M.A.; Malik, H. Forecasting rooftop photovoltaic solar power using machine learning techniques. Energy Rep. 2025, 13, 3616–3630. [Google Scholar] [CrossRef]
  7. Suanpang, P.; Jamjuntr, P. Machine Learning Models for Solar Power Generation Forecasting in Microgrid Application Implications for Smart Cities. Sustainability 2024, 16, 6087. [Google Scholar] [CrossRef]
  8. Aouidad, H.I.; Bouhelal, A. Machine learning-based short-term solar power forecasting: A comparison between regression and classification approaches using extensive Australian dataset. Sustain. Energy Res. 2024, 11, 1–21. [Google Scholar] [CrossRef]
  9. Shah, A.; Viswanath, V.; Gandhi, K.; Patil, N.M. Predicting Solar Energy Generation with Machine Learning based on AQI and Weather Features. arXiv 2024, arXiv:2408.12476. [Google Scholar] [CrossRef]
  10. Hayajneh, A.M.; Alasali, F.; Salama, A.; Holderbaum, W. Intelligent Solar Forecasts: Modern Machine Learning Models and TinyML Role for Improved Solar Energy Yield Predictions. IEEE Access 2024, 12, 10846–10864. [Google Scholar] [CrossRef]
  11. Nastić, F.; Jurišević, N.; Nikolić, D.; Končalović, D. Harnessing open data for hourly power generation forecasting in newly commissioned photovoltaic power plants. Energy Sustain. Dev. 2024, 81, 101512. [Google Scholar] [CrossRef]
  12. Dimitropoulos, N.; Mylona, Z.; Marinakis, V.; Kapsalis, P.; Sofias, N.; Primo, N.; Maniatis, Y.; Doukas, H. Comparative analysis of AI-based models for short-term photovoltaic power forecasting in energy cooperatives. Intell. Decis. Technol. 2022, 15, 691–705. [Google Scholar] [CrossRef]
  13. Dimitropoulos, N.; Sofias, N.; Kapsalis, P.; Mylona, Z.; Marinakis, V.; Primo, N.; Doukas, H. Forecasting of short-term PV production in energy communities through Machine Learning and Deep Learning algorithms. In Proceedings of the IISA 2021-12th International Conference on Information, Intelligence, Systems and Applications, Chania, Crete, Greece, 12–14 July 2021. [Google Scholar] [CrossRef]
  14. Capotosto, T.; di Fazio, A.R.; Perna, S.; Conte, F.; Iannello, G.; de Falco, P. Day-ahead Forecast of PV Systems and End-Users in the Contest of Renewable Energy Communities. In Proceedings of the 2022 AEIT International Annual Conference, Rome, Italy, 3–5 October 2022. [Google Scholar] [CrossRef]
  15. Mazzeo, D.; Herdem, M.S.; Matera, N.; Bonini, M.; Wen, J.Z.; Nathwani, J.; Oliveti, G. Artificial intelligence application for the performance prediction of a clean energy community. Energy 2021, 232, 120999. [Google Scholar] [CrossRef]
  16. Rajendran, S.S.P.; Gebremedhin, A. Deep learning-based solar power forecasting model to analyze a multi-energy microgrid energy system. Front. Energy Res. 2024, 12, 1363895. [Google Scholar] [CrossRef]
  17. De Paola, A.; Musiari, E.; Fortunati, L.; Gregori, F.; Anselmi, G.P.; Andreadou, N.; Kotsakis, E.; Fulli, G. An Open-Source IT Tool for Energy Forecast of Renewable Energy Communities. IEEE Access 2025, 13, 69619–69630. [Google Scholar] [CrossRef]
  18. Dattola, F.; Iaquinta, P.; Iusi, M.; Federico, D.; Greco, R.; Talerico, M.; Coscarella, V.; Legato, L.; Pellegrino, I.; Bergamaschi, S.; et al. PRECEDE: Climate and Energy Forecasts to Support Energy Communities with Deep Learning Models. In Proceedings of the 2024 IEEE International Conference on Big Data (BigData 2024), Washington, DC, USA, 15–18 December 2024; pp. 4650–4658. [Google Scholar] [CrossRef]
  19. Solargis. Solar Resource Maps & GIS Data For 200+ Countries. Available online: https://solargis.com/resources/free-maps-and-gis-data?locality=ireland (accessed on 12 August 2025).
  20. Bamisile, O.; Acen, C.; Cai, D.; Huang, Q.; Staffell, I. The environmental factors affecting solar photovoltaic output. Renew. Sustain. Energy Rev. 2024, 208, 115073. [Google Scholar] [CrossRef]
  21. Agrawal, R. Fundamentals of Machine Learning. In Machine Learning for Healthcare, 1st ed.; CRC Press: Boca Raton, FL, USA, 2020. [Google Scholar] [CrossRef]
  22. Nguyen, N.T.; Dao, T.C.T.; Nguyen, L.N.T.; Nguyen, T.-D.; Le, M.-V.; French, I.T.; Doan, V.-T.; Vo, V.H.K.; Tran, N.C.; Pham, D.-H.; et al. Solar Radiation Forecasting Based on Random Forest and XGBoost. In Proceedings of the 2024 7th International Conference on Green Technology and Sustainable Development, GTSD 2024, Ho Chi Minh City, Vietnam, 25–26 July 2024; pp. 136–140. [Google Scholar] [CrossRef]
  23. Azman, M.A.; Jantan, H.; Bahrin, U.F.M.; Kadir, E.A. Solar Power Production Forecasting Model Using Random Forest Algorithm. In Lecture Notes in Networks and Systems; Springer Science and Business Media: Berlin/Heidelberg, Germany, 2024; pp. 135–144. [Google Scholar] [CrossRef]
  24. Lahouar, A.; Slama, J.B.H. Day-ahead load forecast using random forest and expert input selection. Energy Convers. Manag. 2015, 103, 1040–1051. [Google Scholar] [CrossRef]
  25. Dong, Y.; Ma, X.; Fu, T. Electrical load forecasting: A deep learning approach based on K-nearest neighbors. Appl. Soft Comput. 2021, 99, 106900. [Google Scholar] [CrossRef]
  26. Aksan, F.; Suresh, V.; Janik, P. Optimal Capacity and Charging Scheduling of Battery Storage through Forecasting of Photovoltaic Power Production and Electric Vehicle Charging Demand with Deep Learning Models. Energies 2024, 17, 2718. [Google Scholar] [CrossRef]
  27. Aksan, F.; Suresh, V.; Janik, P. PV Generation Prediction Using Multilayer Perceptron and Data Clustering for Energy Management Support. Energies 2025, 18, 1378. [Google Scholar] [CrossRef]
  28. Siami-Namini, S.; Tavakoli, N.; Namin, A.S. The Performance of LSTM and BiLSTM in Forecasting Time Series. In Proceedings of the 2019 IEEE International Conference on Big Data (Big Data 2019), Los Angeles, CA, USA, 9–12 December 2019; pp. 3285–3292. [Google Scholar] [CrossRef]
  29. Li, Z.; Li, J.; Ye, X.; Xiong, X.; Li, T. Photovoltaic Power Forecasting Model based on Random Forest and BiLSTM Neural Network. In Proceedings of the IEEE Advanced Information Technology, Chongqing, China, 15–17 March 2024; pp. 1345–1348. [Google Scholar] [CrossRef]
  30. Mazen, F.M.A.; Shaker, Y.; Seoud, R.A.A. Forecasting of Solar Power Using GRU–Temporal Fusion Transformer Model and DILATE Loss Function. Energies 2023, 16, 8105. [Google Scholar] [CrossRef]
  31. Aksan, F.; Li, Y.; Suresh, V.; Janik, P. CNN-LSTM vs. LSTM-CNN to Predict Power Flow Direction: A Case Study of the High-Voltage Subnet of Northeast Germany. Sensors 2023, 23, 901. [Google Scholar] [CrossRef]
  32. Wang, K.; Qi, X.; Liu, H. Photovoltaic power forecasting based LSTM-Convolutional Network. Energy 2019, 189, 116225. [Google Scholar] [CrossRef]
  33. Meng, M.; Song, C. Daily photovoltaic power generation forecasting model based on random forest algorithm for north china in winter. Sustainability 2020, 12, 2247. [Google Scholar] [CrossRef]
  34. Guan, L.; Zou, L. Study on solar power prediction model by random forest method based on a numerical weather prediction model. Authorea 2024. Preprint. [Google Scholar] [CrossRef]
  35. Nguyen, T.A.; Pham, M.-H.; Phap, V.M.; Do, Q.-H.; Nguyen, N.-T.; Nguyen, D.-T.; Nguyen, T.N. Forecasting of solar power generation in Vietnam deploying a simple GRU model. In Proceedings of the 2023 IEEE Asia Meeting on Environment and Electrical Engineering, EEE-AM 2023, Hanoi, Vietnam, 13–15 November 2023. [Google Scholar] [CrossRef]
  36. Elmousaid, R.; Drioui, N.; Elgouri, R.; Agueny, H.; Adnani, Y. Ultra-short-term global horizontal irradiance forecasting based on a novel and hybrid GRU-TCN model. Results Eng. 2024, 23, 102817. [Google Scholar] [CrossRef]
  37. Streamlit. A Faster Way to Build and Share Data Apps. Available online: https://streamlit.io/ (accessed on 9 October 2025).
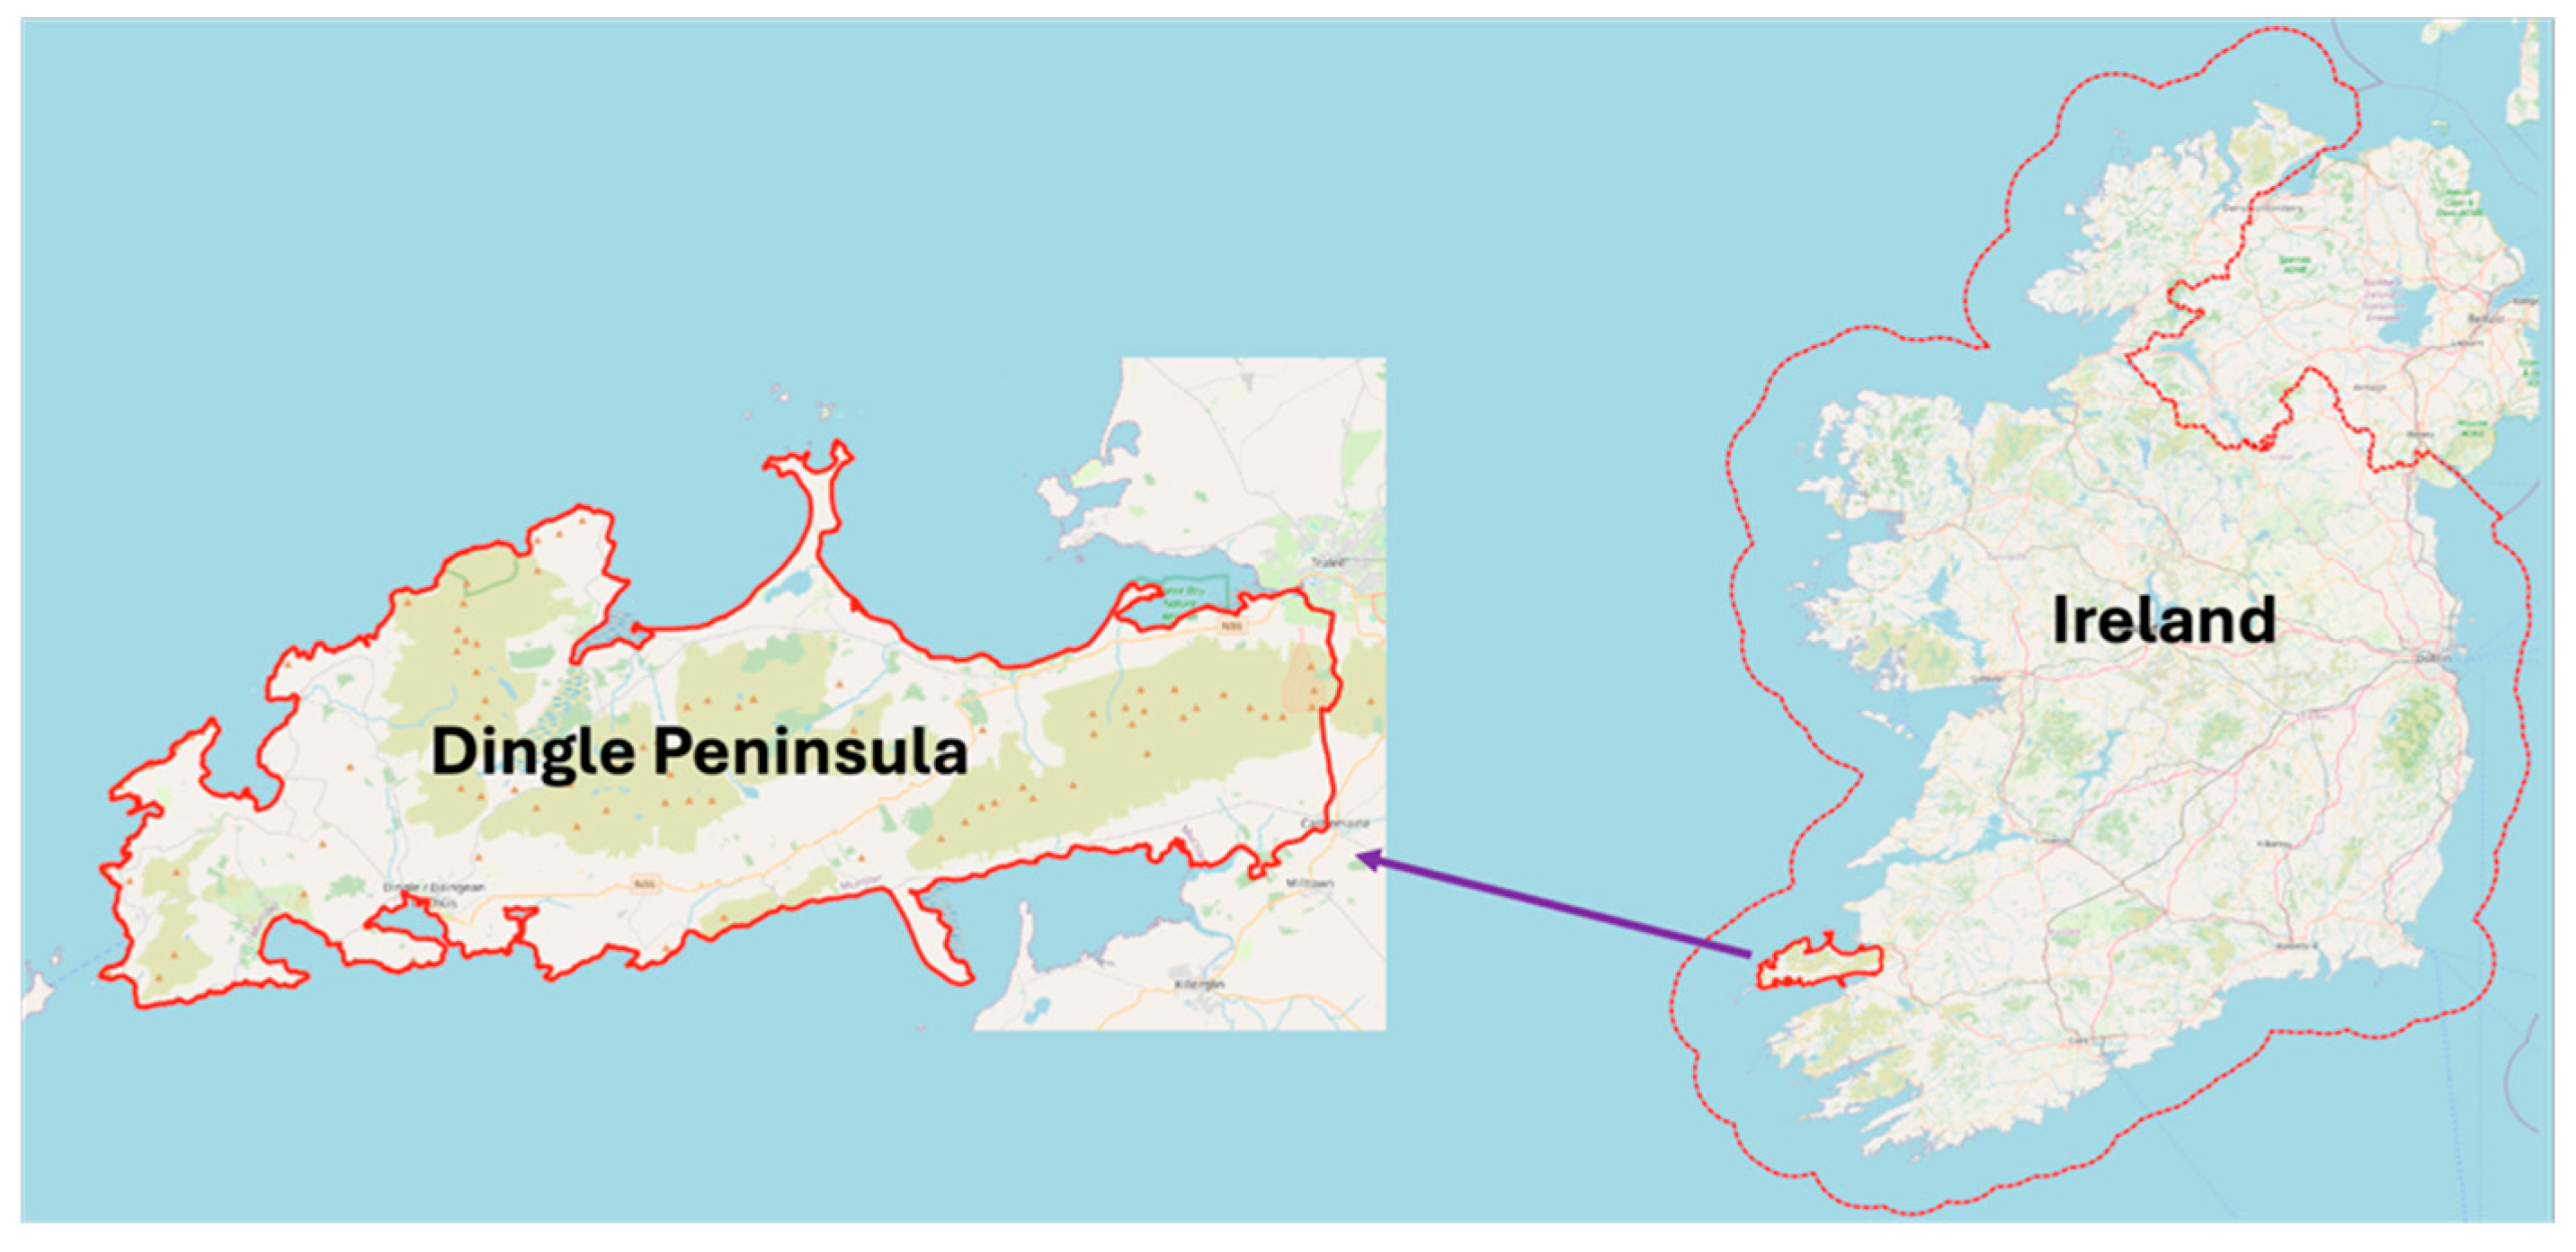
Figure 1. Energy community location.
Energies 18 05980 g001
Figure 2. Annual average GHI.
Energies 18 05980 g002
Figure 3. Annual average temperature.
Energies 18 05980 g003
Figure 4. Correlation Analysis.
Energies 18 05980 g004
Figure 5. Solar radiation vs. PV energy production.
Energies 18 05980 g005
Figure 6. Overall task.
Energies 18 05980 g006
Figure 7. The structure of Workflow.
Energies 18 05980 g007
Figure 8. Comparison actual and prediction result.
Energies 18 05980 g008
Figure 9. Solar radiation forecasting.
Energies 18 05980 g009
Figure 10. Developed workflow via Streamlit.
Energies 18 05980 g010
Table 1. Machine learning model’s structure.
ModelImplementationKey Hyperparameters
Random Forest
[22,23,24]
RandomForest wrapped in
MultiOutputRegressor
n_estimators = 200, random_state = 42
XGBoost [22]XGB wrapped in
MultiOutputRegressor
n_estimators = 200, random_state = 42,
learning_rate = 0.1, max_depth = 15
K-Nearest
Neighbors [25]
KNeighbors wrapped in
MultiOutputRegressor
n_neighbors = 5
LightGBMLGBM wrapped in
MultiOutputRegressor
n_estimators = 200, random_state = 42,
learning_rate = 0.1, max_depth = 15
Decision Tree [26]DecisionTree wrapped
In MultiOutputRegressor
max_depth = 10, random_state = 42
Multilayer
Perceptron [27]
Keras SequentialInput = X_train.shape [1], hidden layers: 128 (ReLU), 64 (ReLU), output = y_train.shape [1], optimizer = Adam, loss = MSE, metric = MAE
Table 2. Deep learning model’s architecture.
ModelArchitectureKey Layer & ParametersCompilerFitting
LSTM [28] SequentialInput: (timesteps, 1)
LSTM (64 units, activation = tanh)
Dense (output steps)
Optimizer: Adam,
Loss: MSE,
Metric: MAE
Validation split: 0.1,
Epochs: 25,
Batch size: 32
Bidirectional
LSTM [29]
SequentialInput: (timesteps, 1)
Bidirectional LSTM (64 units, activation = tanh)
Dense (output steps)
Optimizer: Adam,
Loss: MSE,
Metric: MAE
Validation split: 0.1,
Epochs: 25,
Batch size: 32
GRU [30]SequentialInput: (timesteps, 1)
GRU (64 units, activation = tanh)
Dense (output steps)
Optimizer: Adam,
Loss: MSE,
Metric: MAE
Validation split: 0.1,
Epochs: 25,
Batch size: 32
CNN-LSTM [31]SequentialInput: (timesteps, 1)
Conv1D (filters = 64, kernel size = 3, activation = relu)
MaxPooling1D (pool size = 2),
LSTM (unit = 64, activation = tanh),
Dense (output steps)
Optimizer: Adam,
Loss: MSE,
Metric: MAE
Validation split: 0.1,
Epochs: 25,
Batch size: 32
LSTM-CNN [31,32]SequentialInput: (timesteps, 1)
LSTM (unit = 64, activation = tanh),
Conv1D (filters = 64, kernel size = 3, activation = relu),
GlobalMaxPooling1D(),
Dense (output steps)
Optimizer: Adam,
Loss: MSE,
Metric: MAE
Validation split: 0.1,
Epochs: 25,
Batch size: 32
Table 3. RSME score.
House
Number
RMSE
Random ForestXGBoostKNNLightGBMDecision TreeMLP
15.58135.65875.99045.65835.64725.6892
25.47295.54785.88065.54755.53875.5823
35.51815.59585.9165.59715.58855.6303
44.83914.90555.21244.9054.89674.9373
Table 4. MSE score.
Table 4. MSE score.
House
Number
MSE
Random ForestXGBoostKNNLightGBMDecision TreeMLP
131.150732.021435.88532.01631.891232.3669
229.952930.777634.58130.774830.67731.1617
330.449531.312934.999631.327531.231631.6999
423.417224.064327.169124.058923.977224.3774
Table 5. MAE score.
Table 5. MAE score.
House
Number
MAE
Random ForestXGBoostKNNLightGBMDecision TreeMLP
12.97683.03443.0973.03363.02553.226
22.93212.98753.0492.98712.98033.2937
32.93352.99523.05052.99532.9893.2631
42.57262.62212.69272.62192.61682.8214
Table 6. Comparison result of deep learning models.
ModelRMSEMSEMAE
LSTM0.6890.4750.435
Bidirectional LSTM0.6260.3910.27
GRU0.6110.3730.238
CNN-LSTM1.2991.6881.194
LSTM-CNN0.6220.3870.327
Disclaimer/Publisher’s Note: The statements, opinions and data contained in all publications are solely those of the individual author(s) and contributor(s) and not of MDPI and/or the editor(s). MDPI and/or the editor(s) disclaim responsibility for any injury to people or property resulting from any ideas, methods, instructions or products referred to in the content.