Author Contributions
Conceptualization, A.S., N.G. and M.M.; Methodology, A.S., M.S. and K.N.G.; Software, A.S. and M.S.; Validation, N.G. and M.S.; Formal analysis, A.S., N.G. and K.N.G.; Investigation, N.G.; Data curation, N.G.; Writing—original draft, A.S., M.M. and K.N.G.; Supervision, M.M. and K.N.G.; Funding acquisition, M.M. and K.N.G. All authors have read and agreed to the published version of the manuscript.
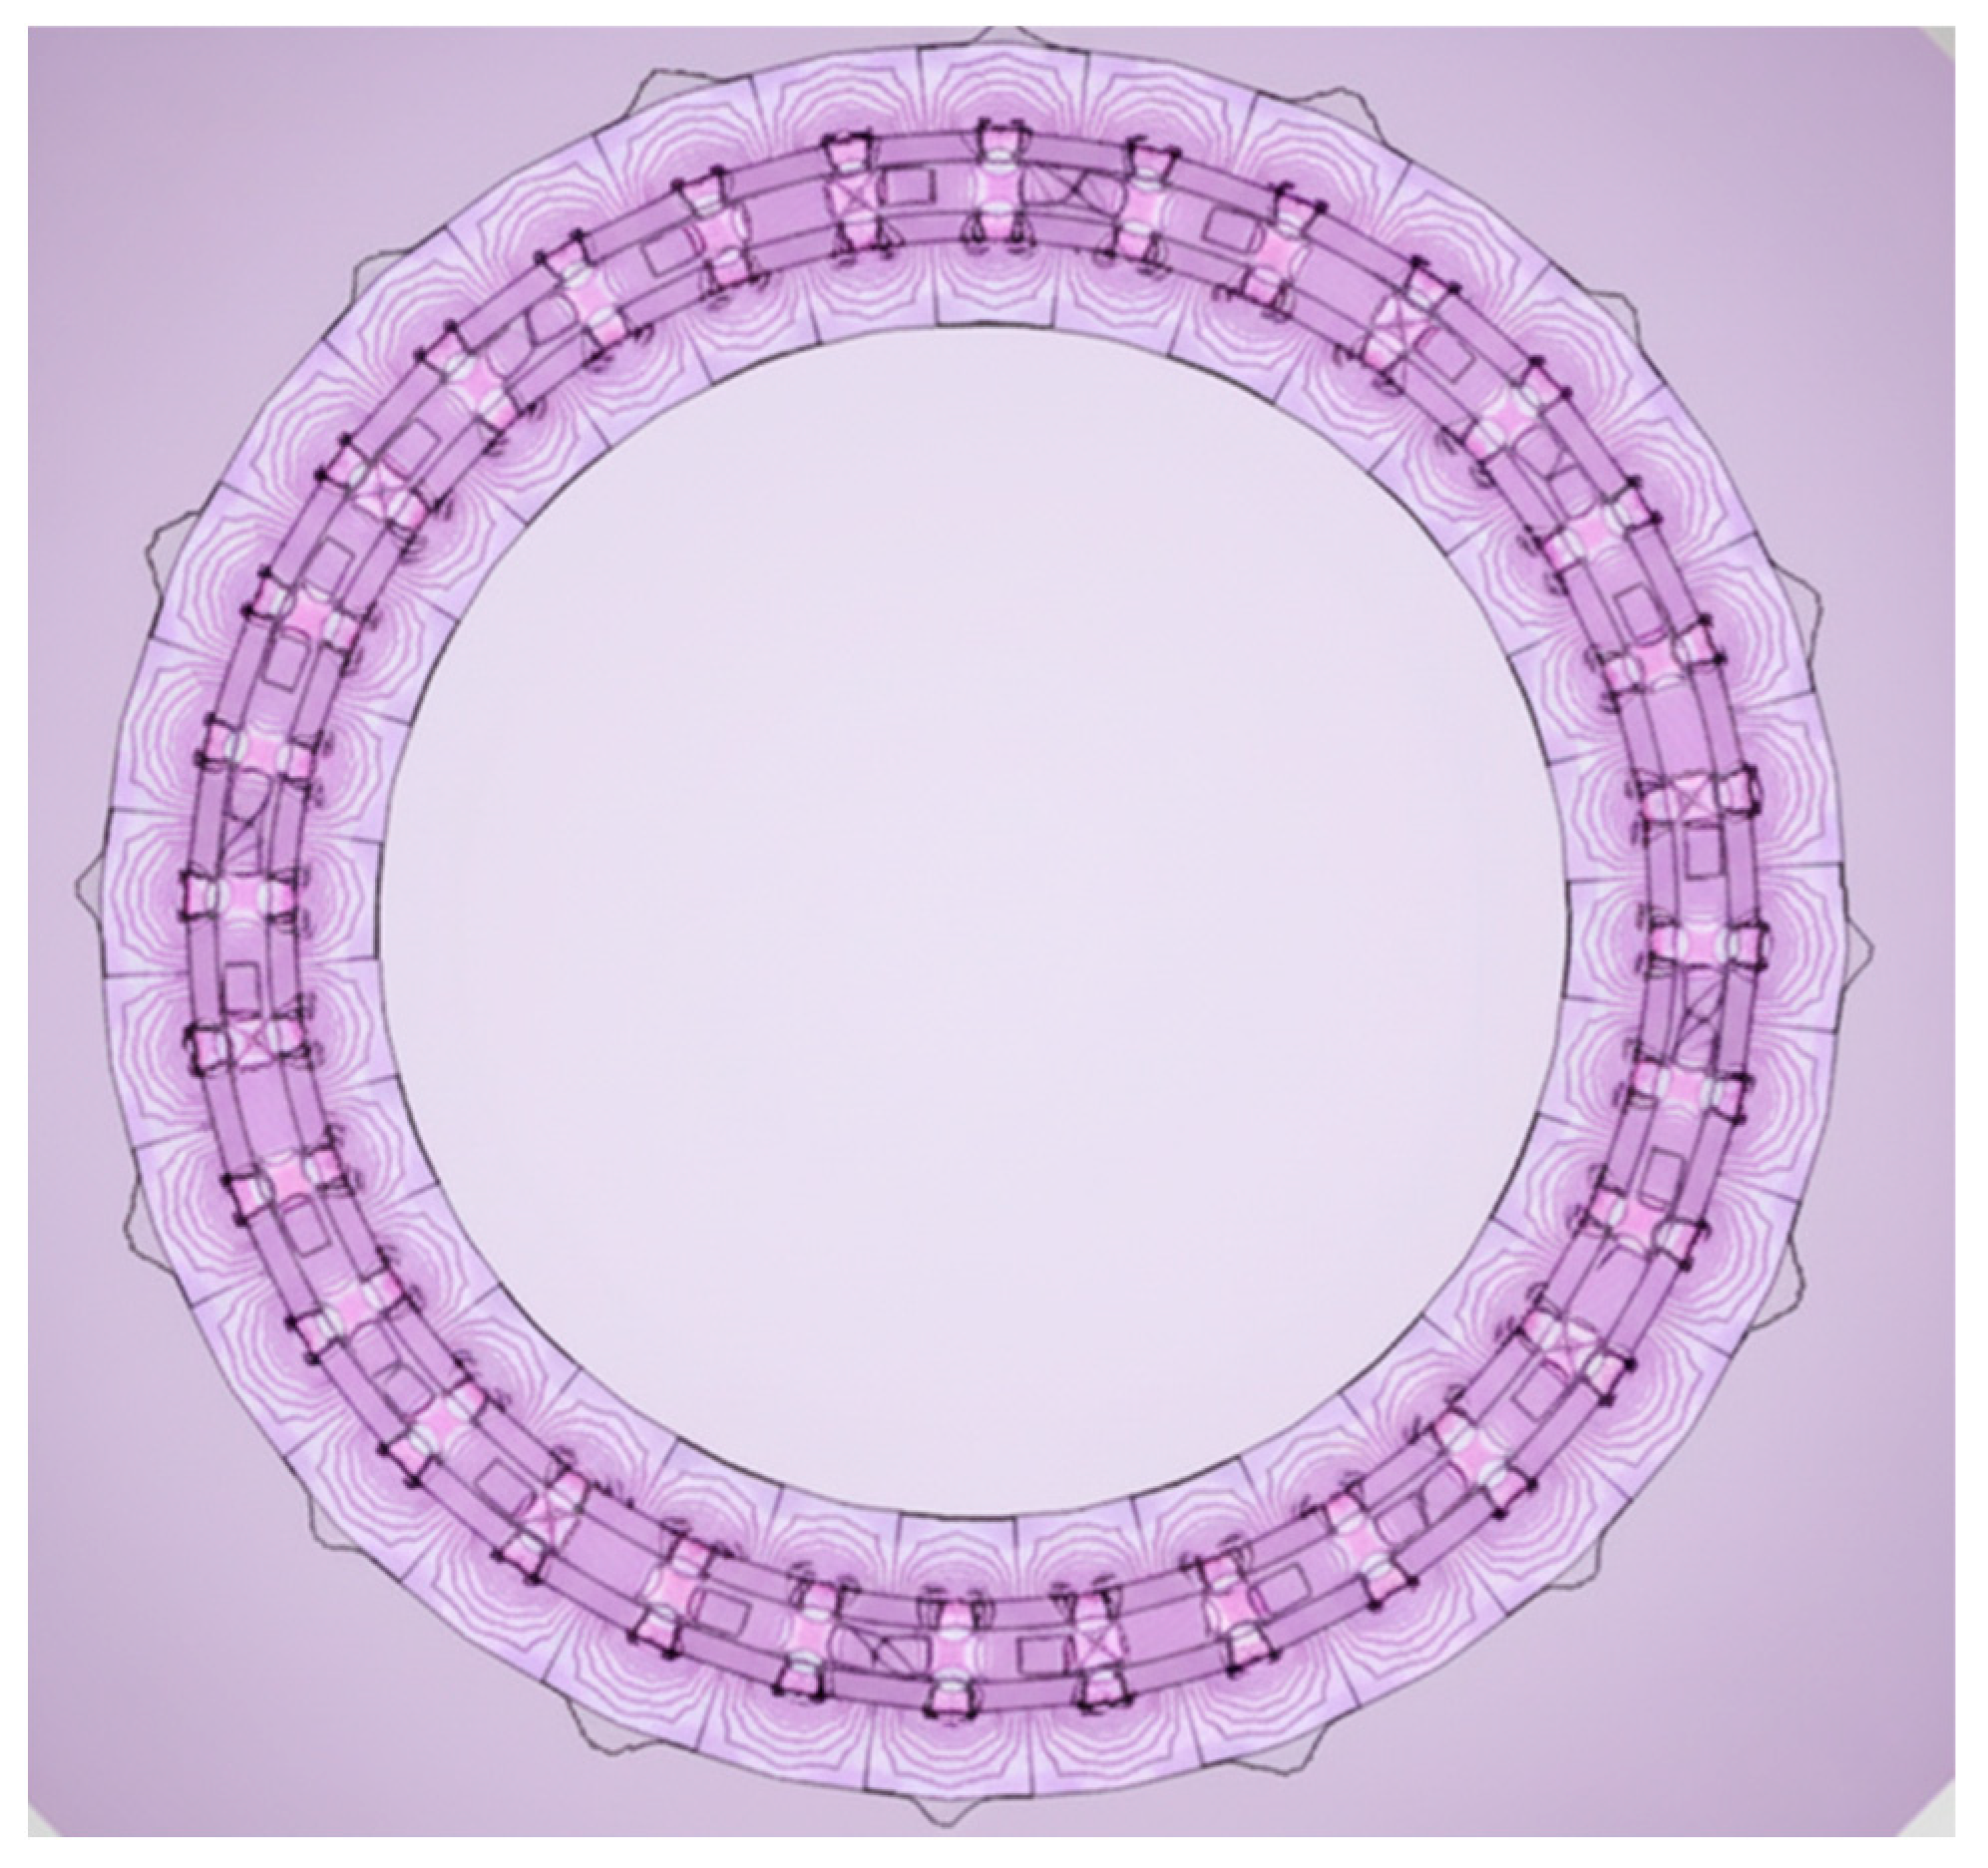
Figure 1.
FEA model of the C-GEN generator.
Figure 1.
FEA model of the C-GEN generator.
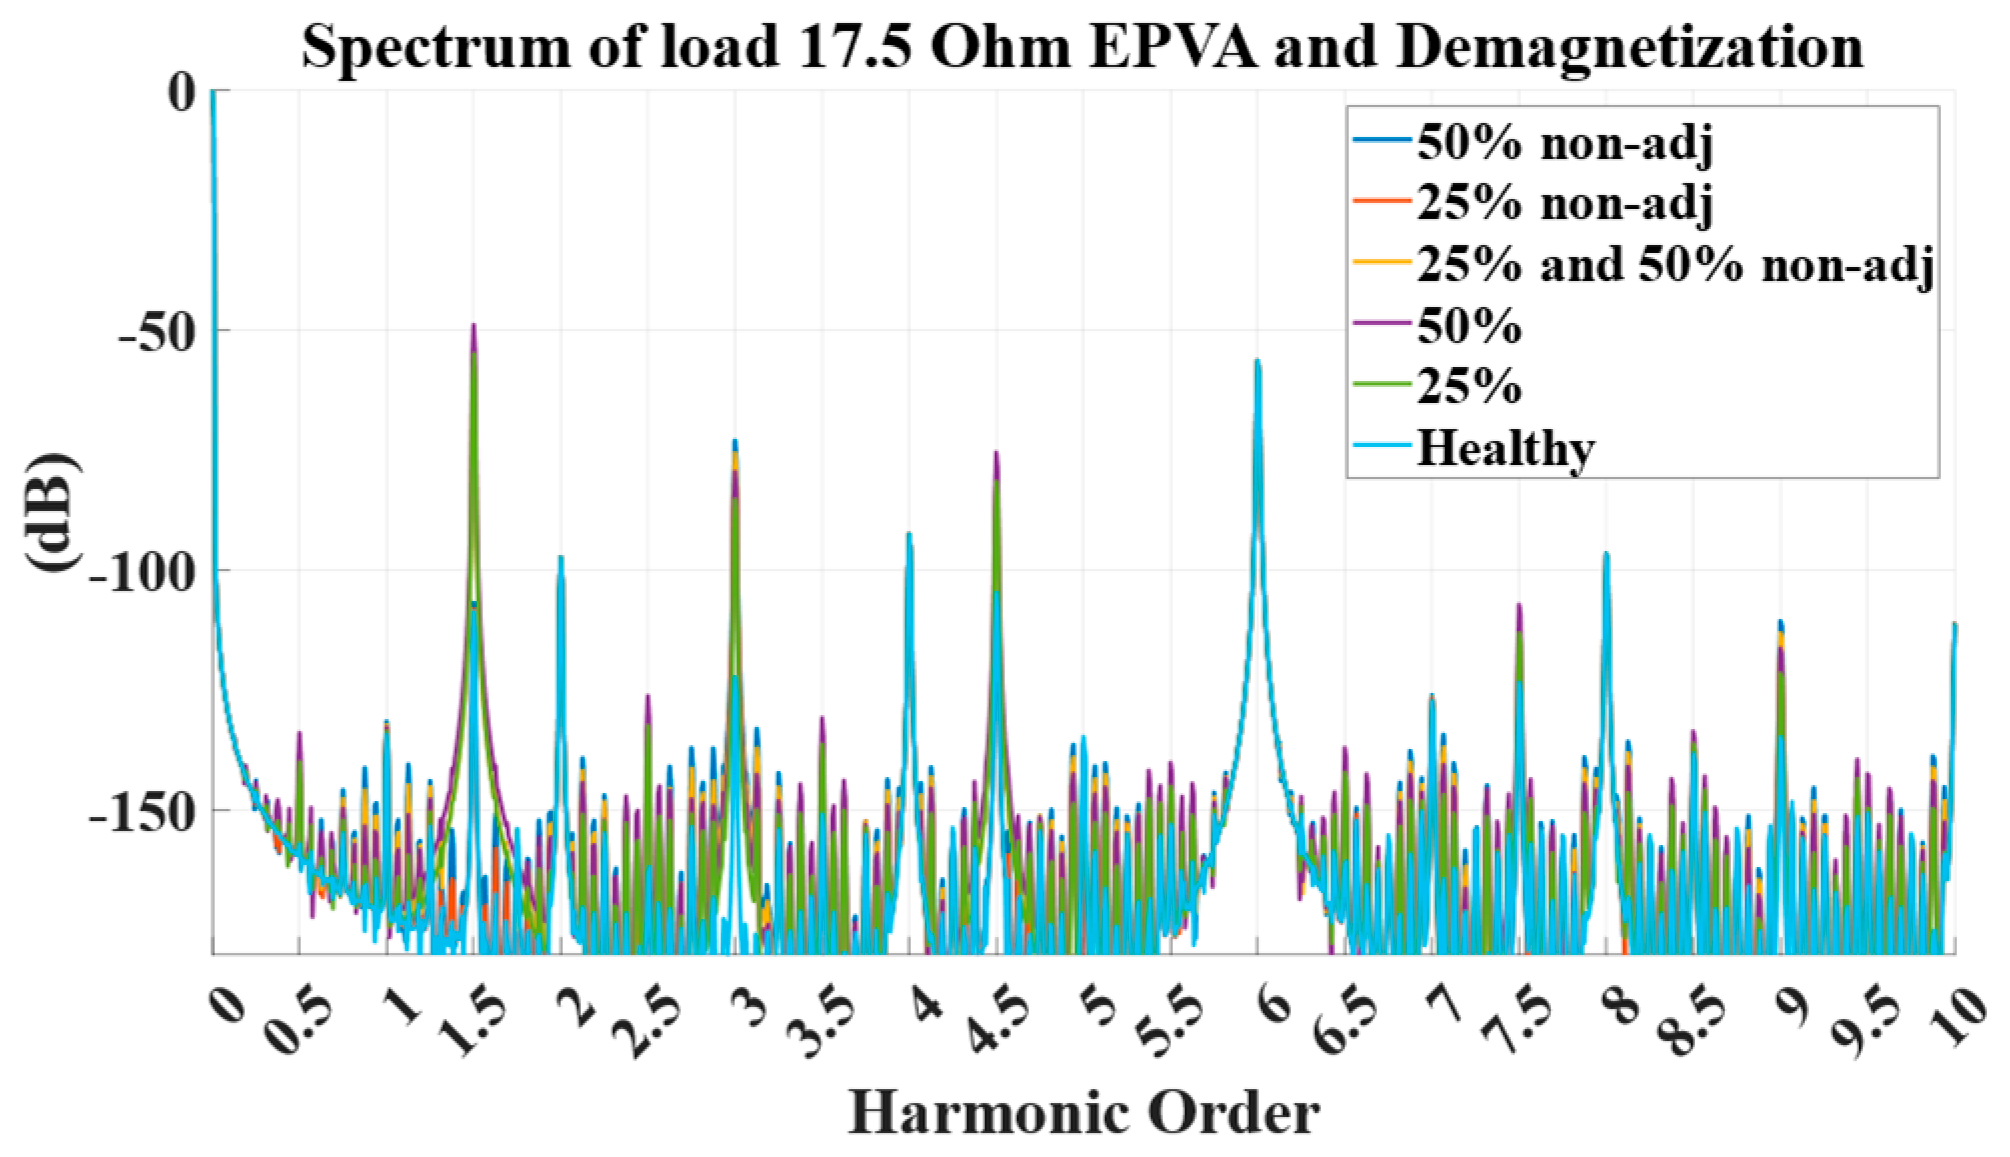
Figure 2.
EPVA results for faulty cases (where green-1 magnet demagnetized by 25%; purple-1 magnet demagnetized by 50%; red-2 nonadjacent magnets demagnetized by 25%; blue-2 nonadjacent magnets demagnetized by 50% and yellow-1 magnet demagnetized by 25% and a nonadjacent by 50%) versus the healthy (cyan) with the generator phases connected to resistive loads of 17.5 Ω.
Figure 2.
EPVA results for faulty cases (where green-1 magnet demagnetized by 25%; purple-1 magnet demagnetized by 50%; red-2 nonadjacent magnets demagnetized by 25%; blue-2 nonadjacent magnets demagnetized by 50% and yellow-1 magnet demagnetized by 25% and a nonadjacent by 50%) versus the healthy (cyan) with the generator phases connected to resistive loads of 17.5 Ω.
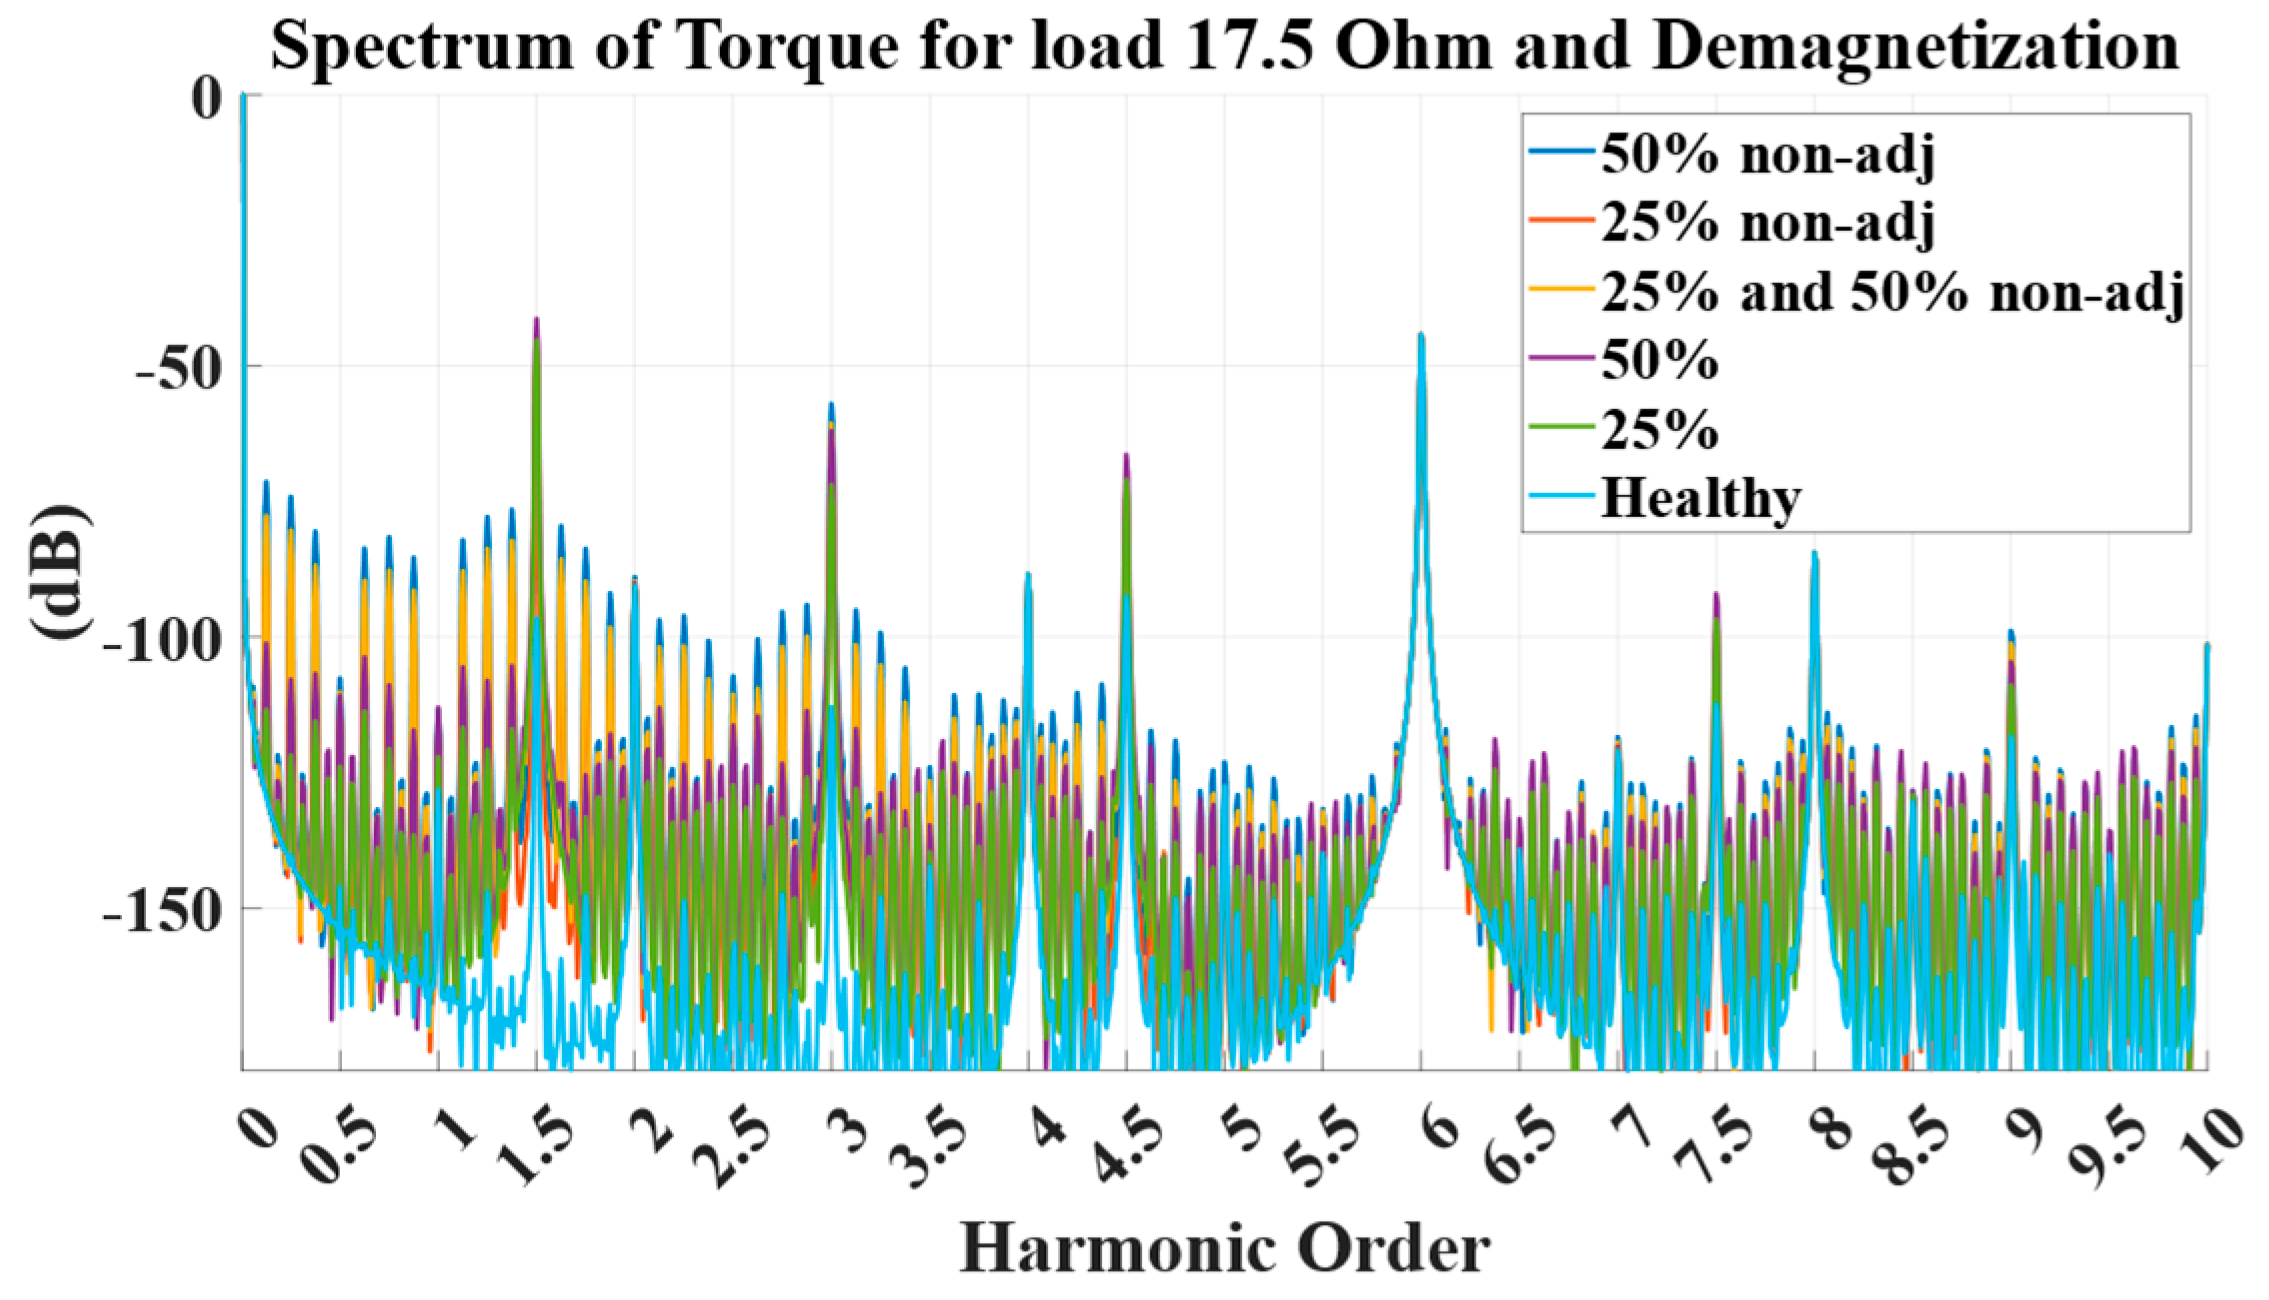
Figure 3.
Torque results for faulty cases (where green-1 magnet demagnetized by 25%, purple-1 magnet demagnetized by 50%, red-2 nonadjacent magnets demagnetized by 25%, blue-2 nonadjacent magnets demagnetized by 50% and yellow-1 magnet demagnetized by 25% and a nonadjacent by 50%) versus the healthy (cyan) with the generator phases connected to resistive loads of 17.5 Ω.
Figure 3.
Torque results for faulty cases (where green-1 magnet demagnetized by 25%, purple-1 magnet demagnetized by 50%, red-2 nonadjacent magnets demagnetized by 25%, blue-2 nonadjacent magnets demagnetized by 50% and yellow-1 magnet demagnetized by 25% and a nonadjacent by 50%) versus the healthy (cyan) with the generator phases connected to resistive loads of 17.5 Ω.
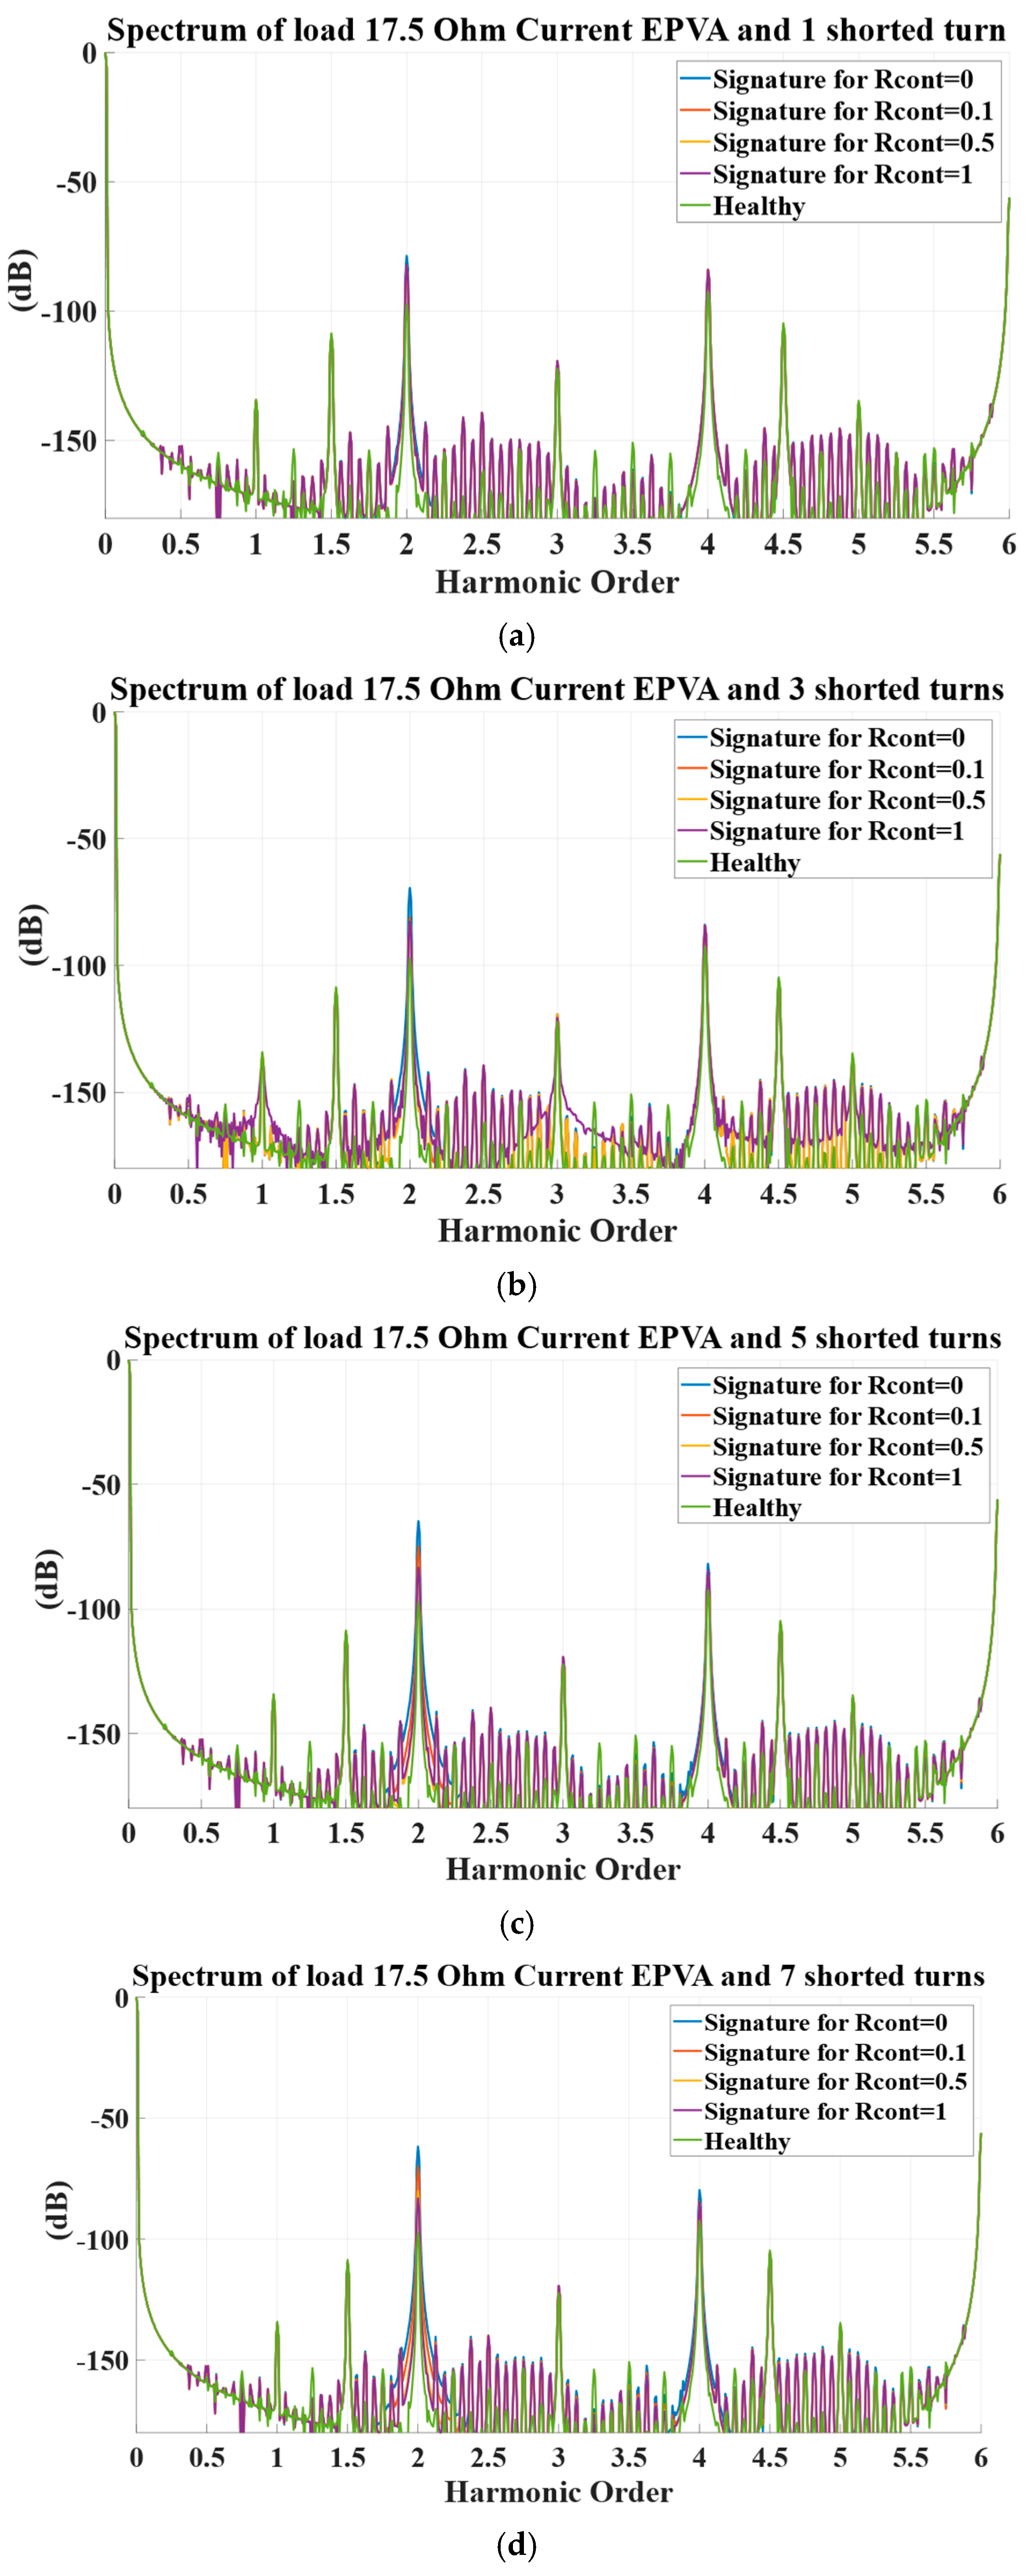
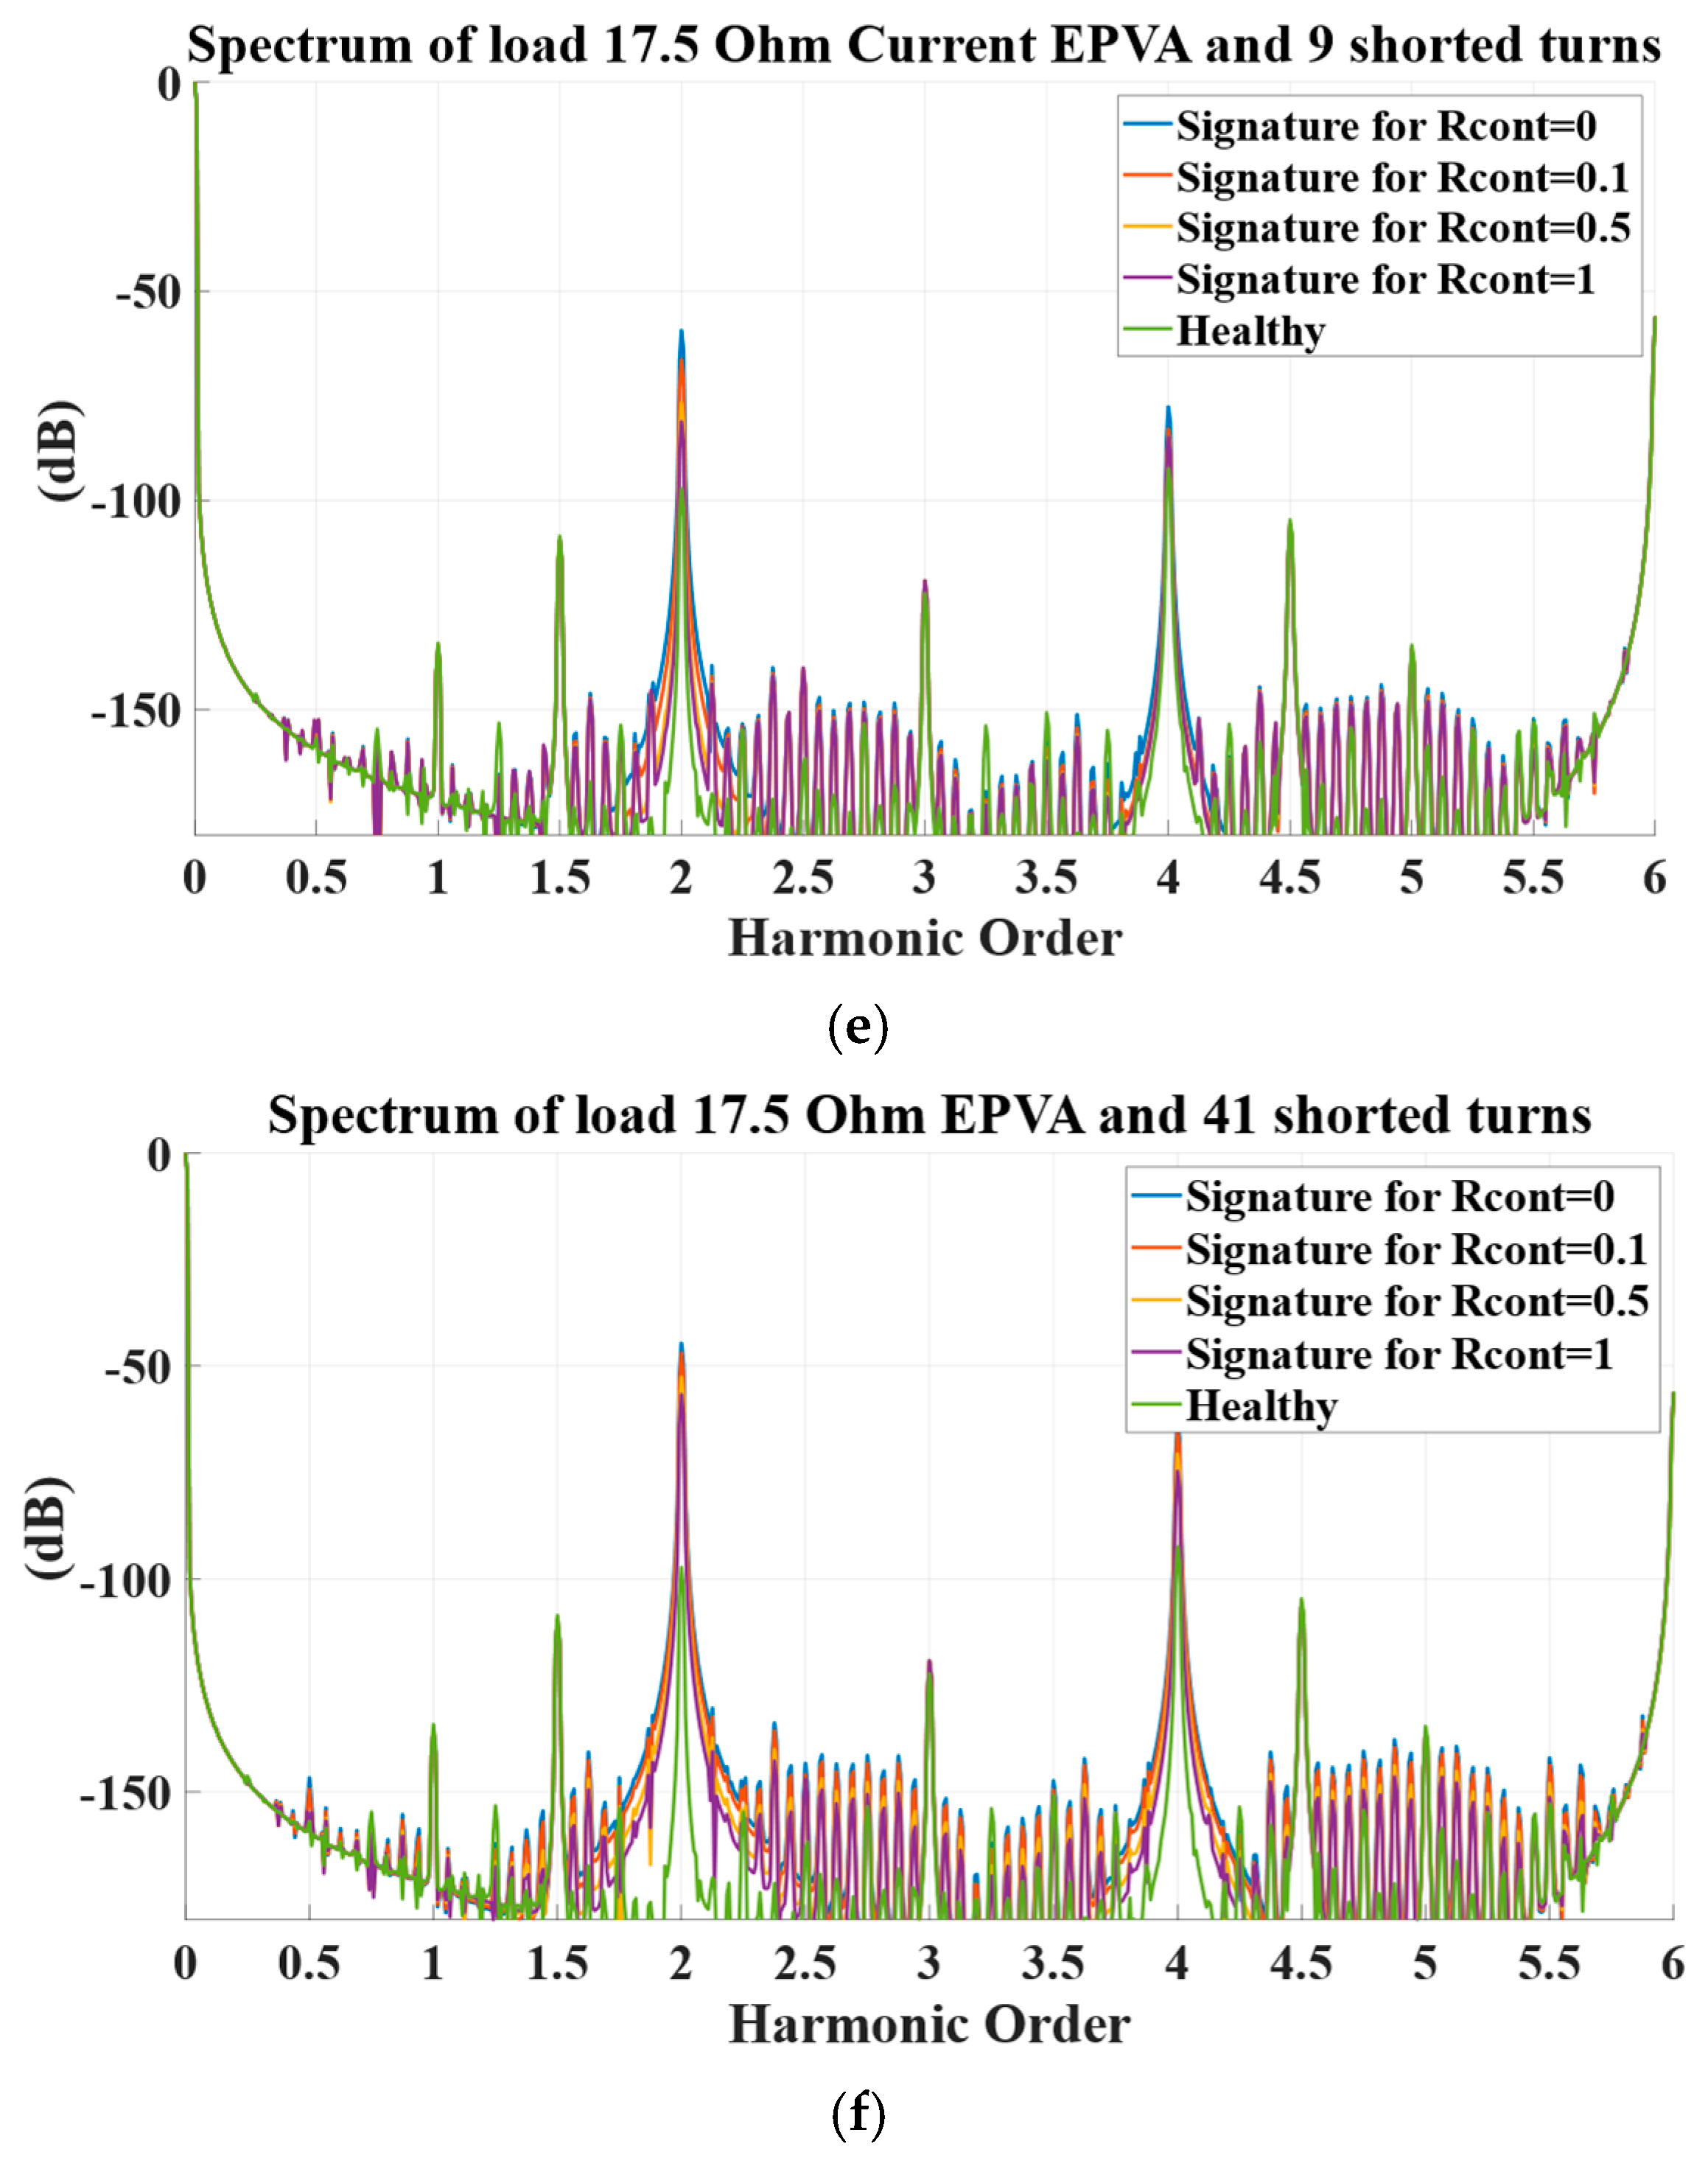
Figure 4.
EPVA results for faulty cases (blue R_cont = 0, red R_cont = 0.1, orange R_cont = 0.5, purple R_cont = 1) versus the healthy (green) showing (a) 1 shorted turn, (b) 3 shorted turns, (c) 5 shorted turns, (d) 7 shorted turns, (e) 9 shorted turns, and (f) 41 (20%) shorted turns with the generator phases connected to resistive loads of 17.5 Ω.
Figure 4.
EPVA results for faulty cases (blue R_cont = 0, red R_cont = 0.1, orange R_cont = 0.5, purple R_cont = 1) versus the healthy (green) showing (a) 1 shorted turn, (b) 3 shorted turns, (c) 5 shorted turns, (d) 7 shorted turns, (e) 9 shorted turns, and (f) 41 (20%) shorted turns with the generator phases connected to resistive loads of 17.5 Ω.
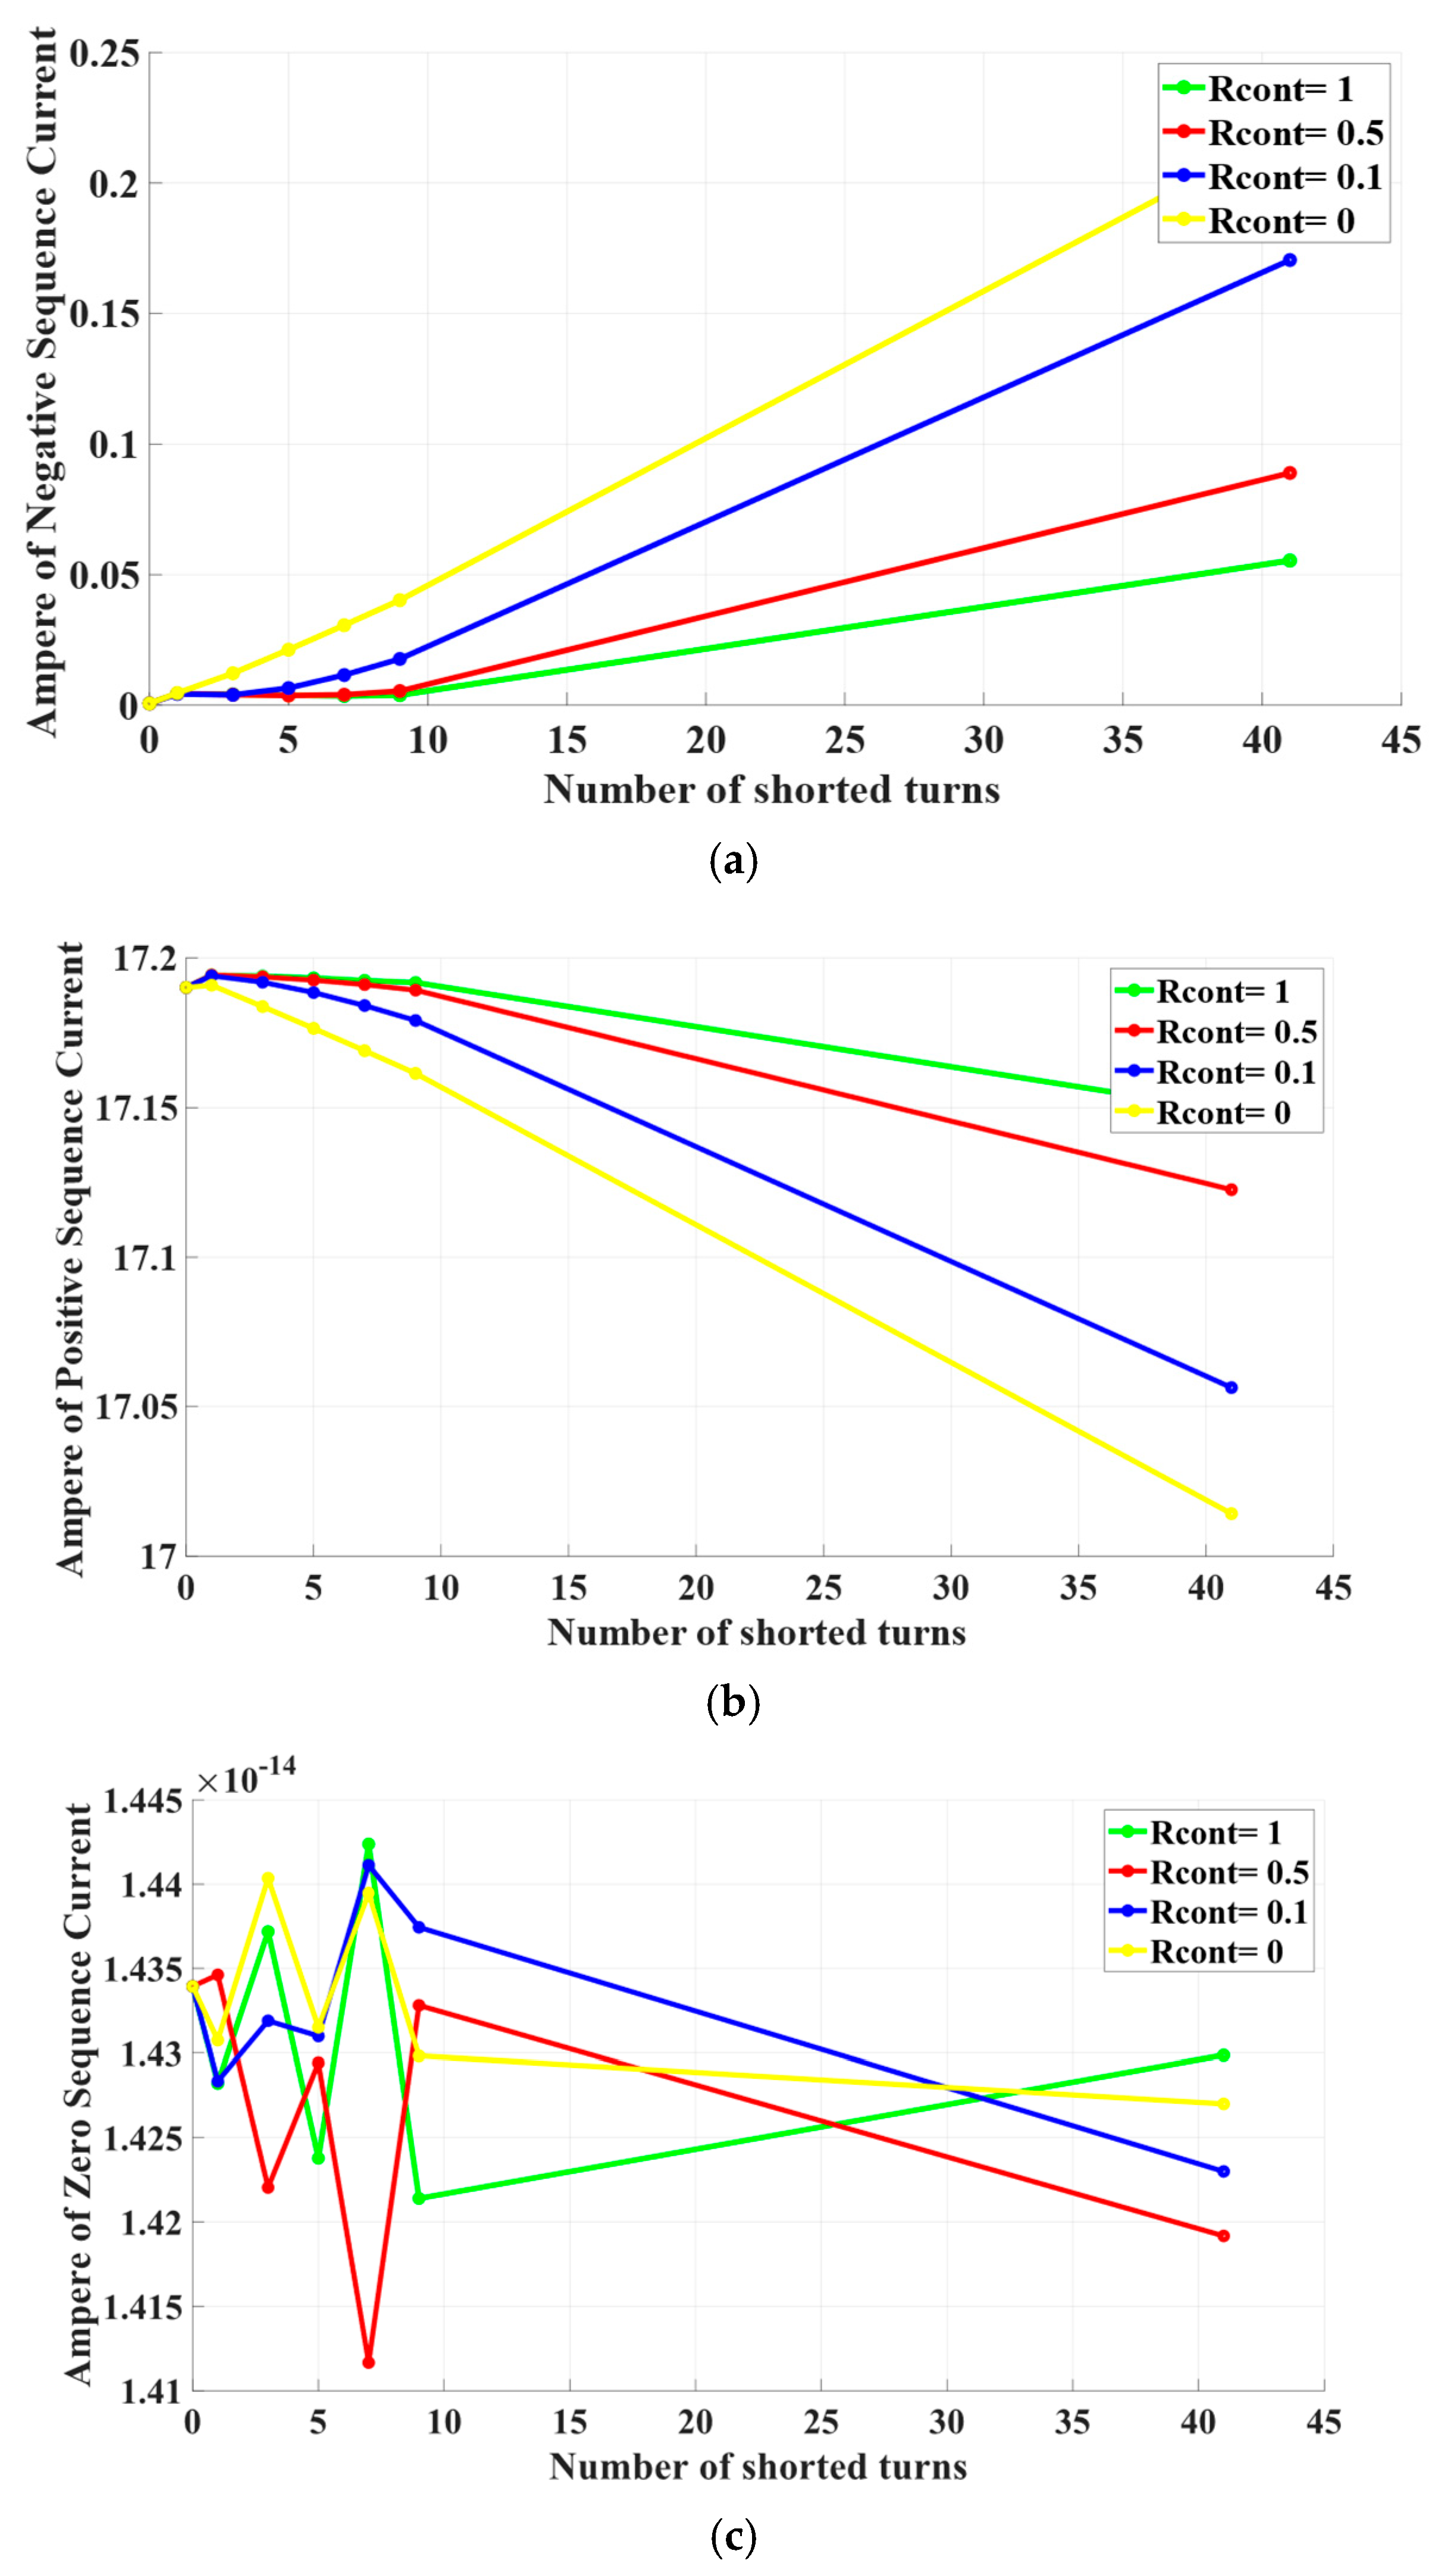
Figure 5.
Current results for faulty cases (yellow R_cont = 0, blue R_cont = 0.1, red R_cont = 0.5, green R_cont = 1) where (a) negative-sequence current, (b) positive-sequence current, (c) zero-sequence current.
Figure 5.
Current results for faulty cases (yellow R_cont = 0, blue R_cont = 0.1, red R_cont = 0.5, green R_cont = 1) where (a) negative-sequence current, (b) positive-sequence current, (c) zero-sequence current.
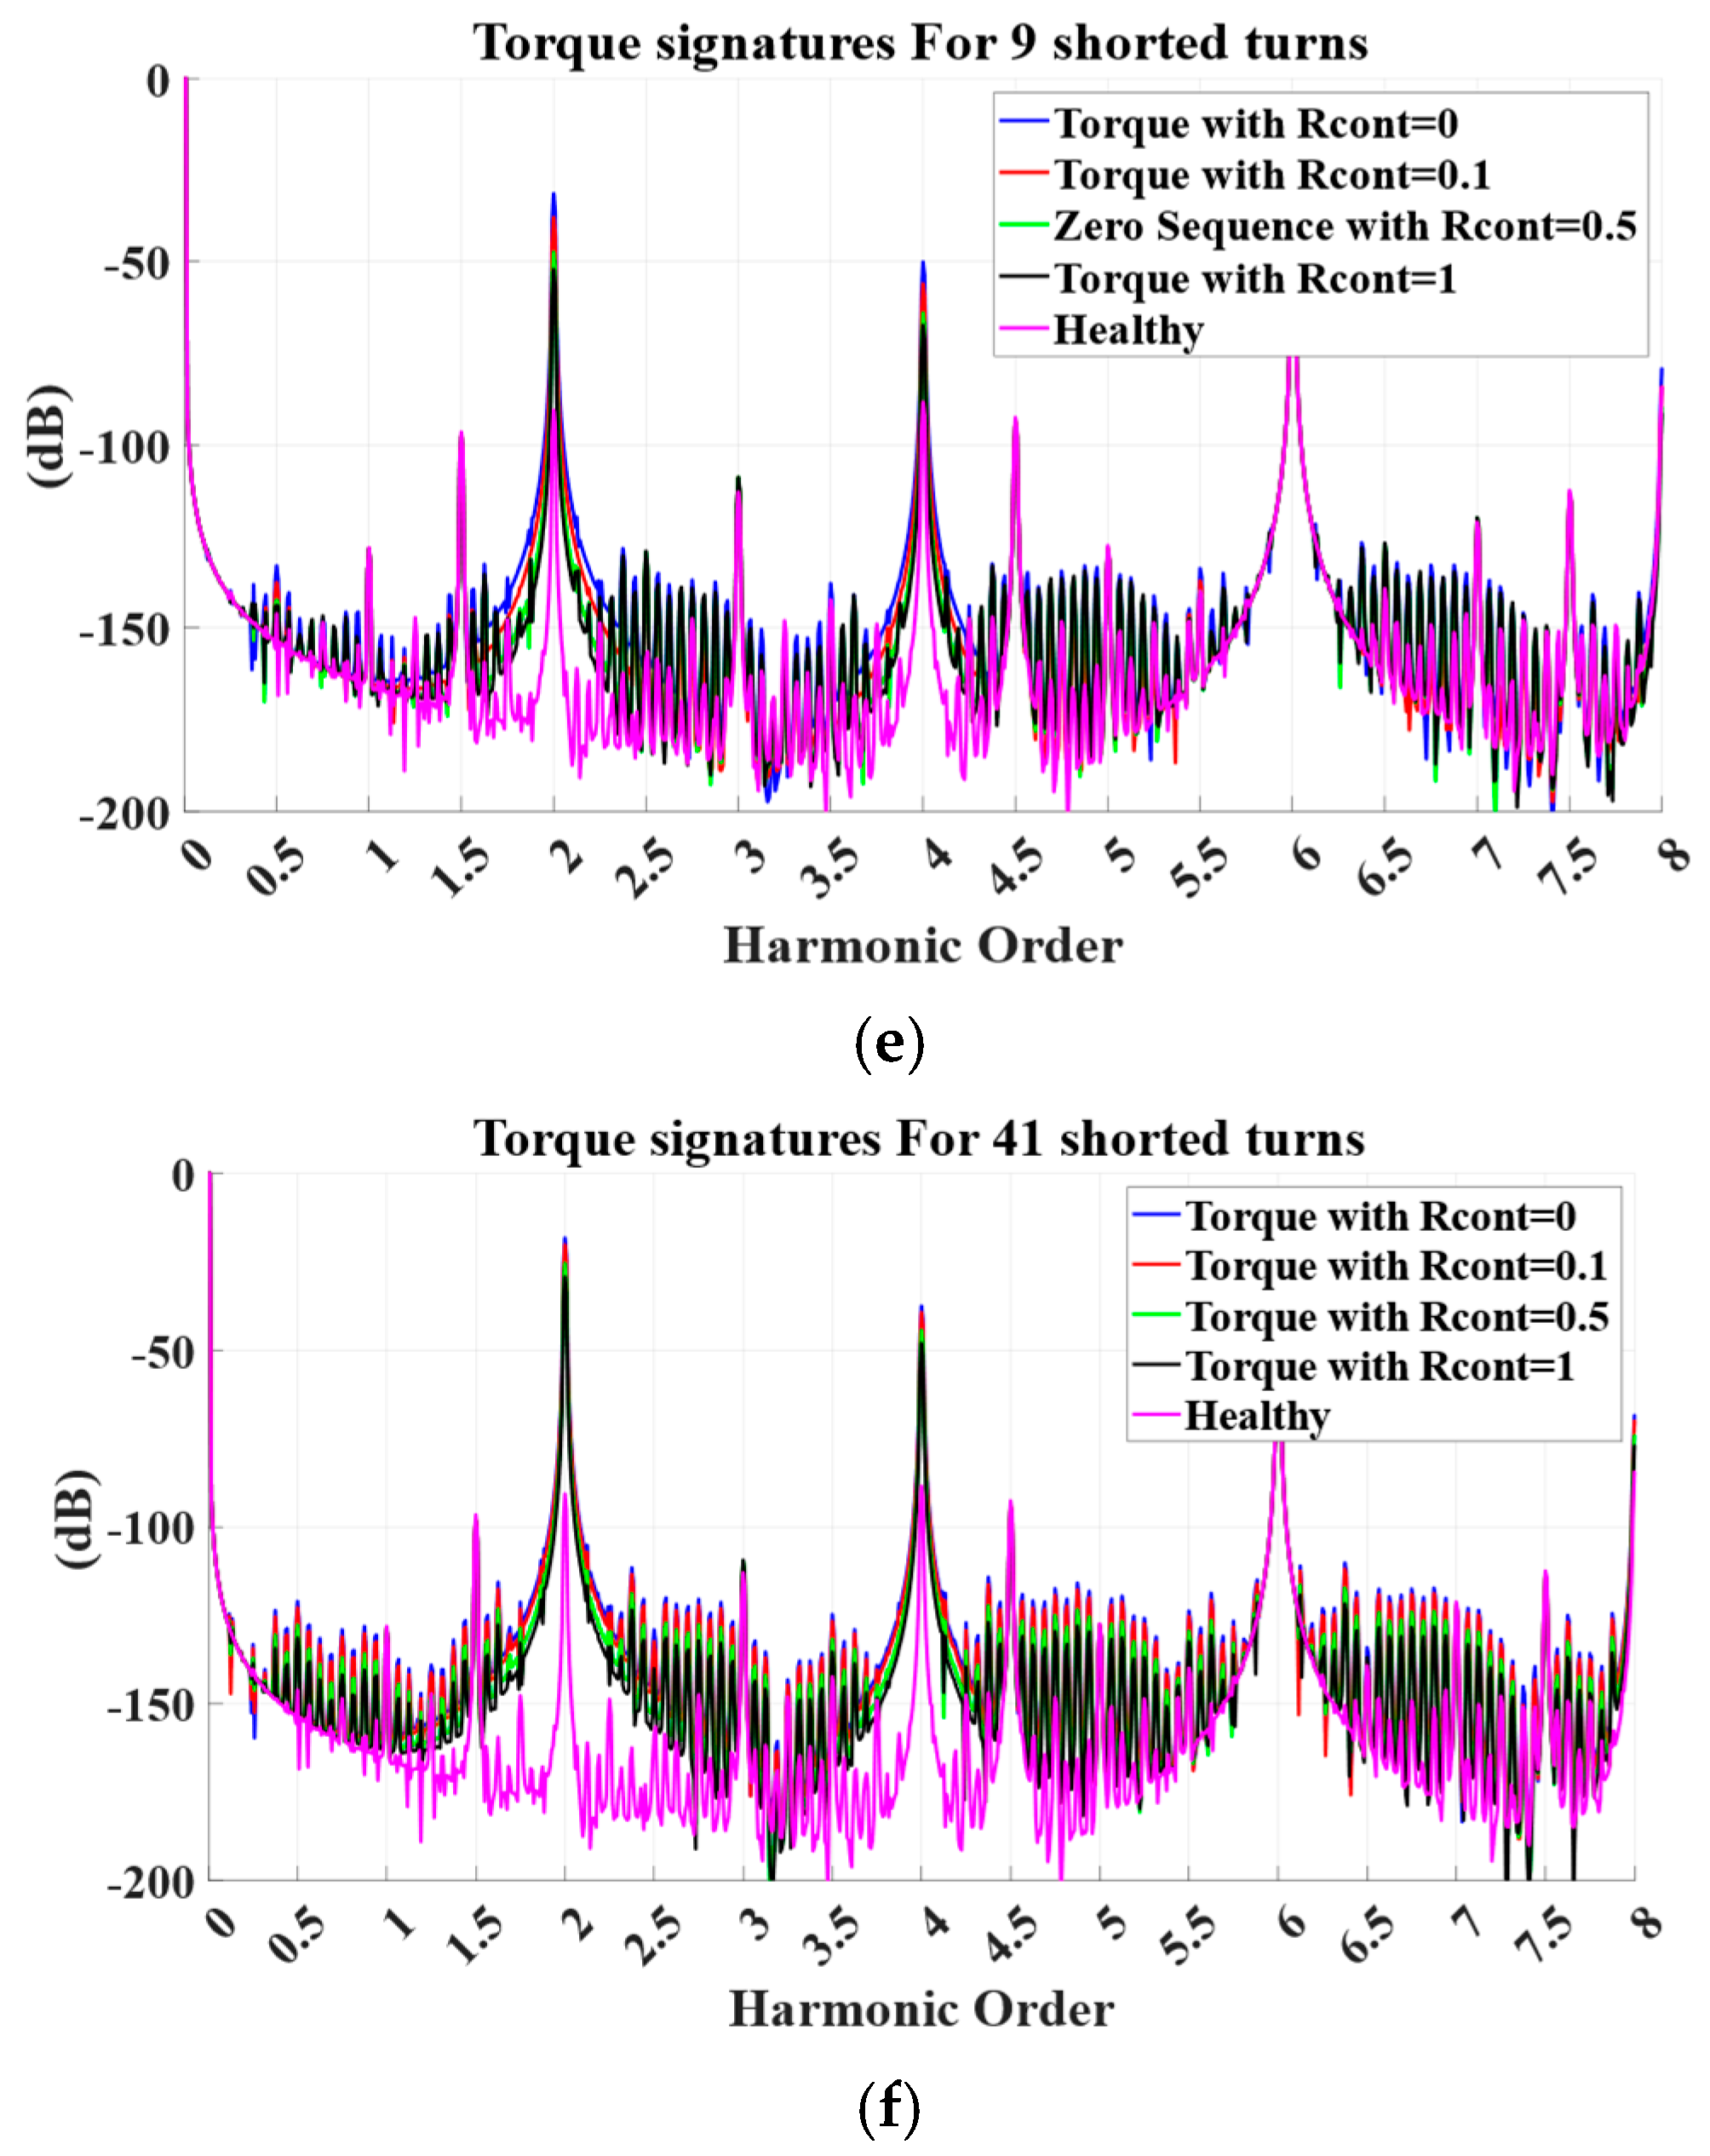
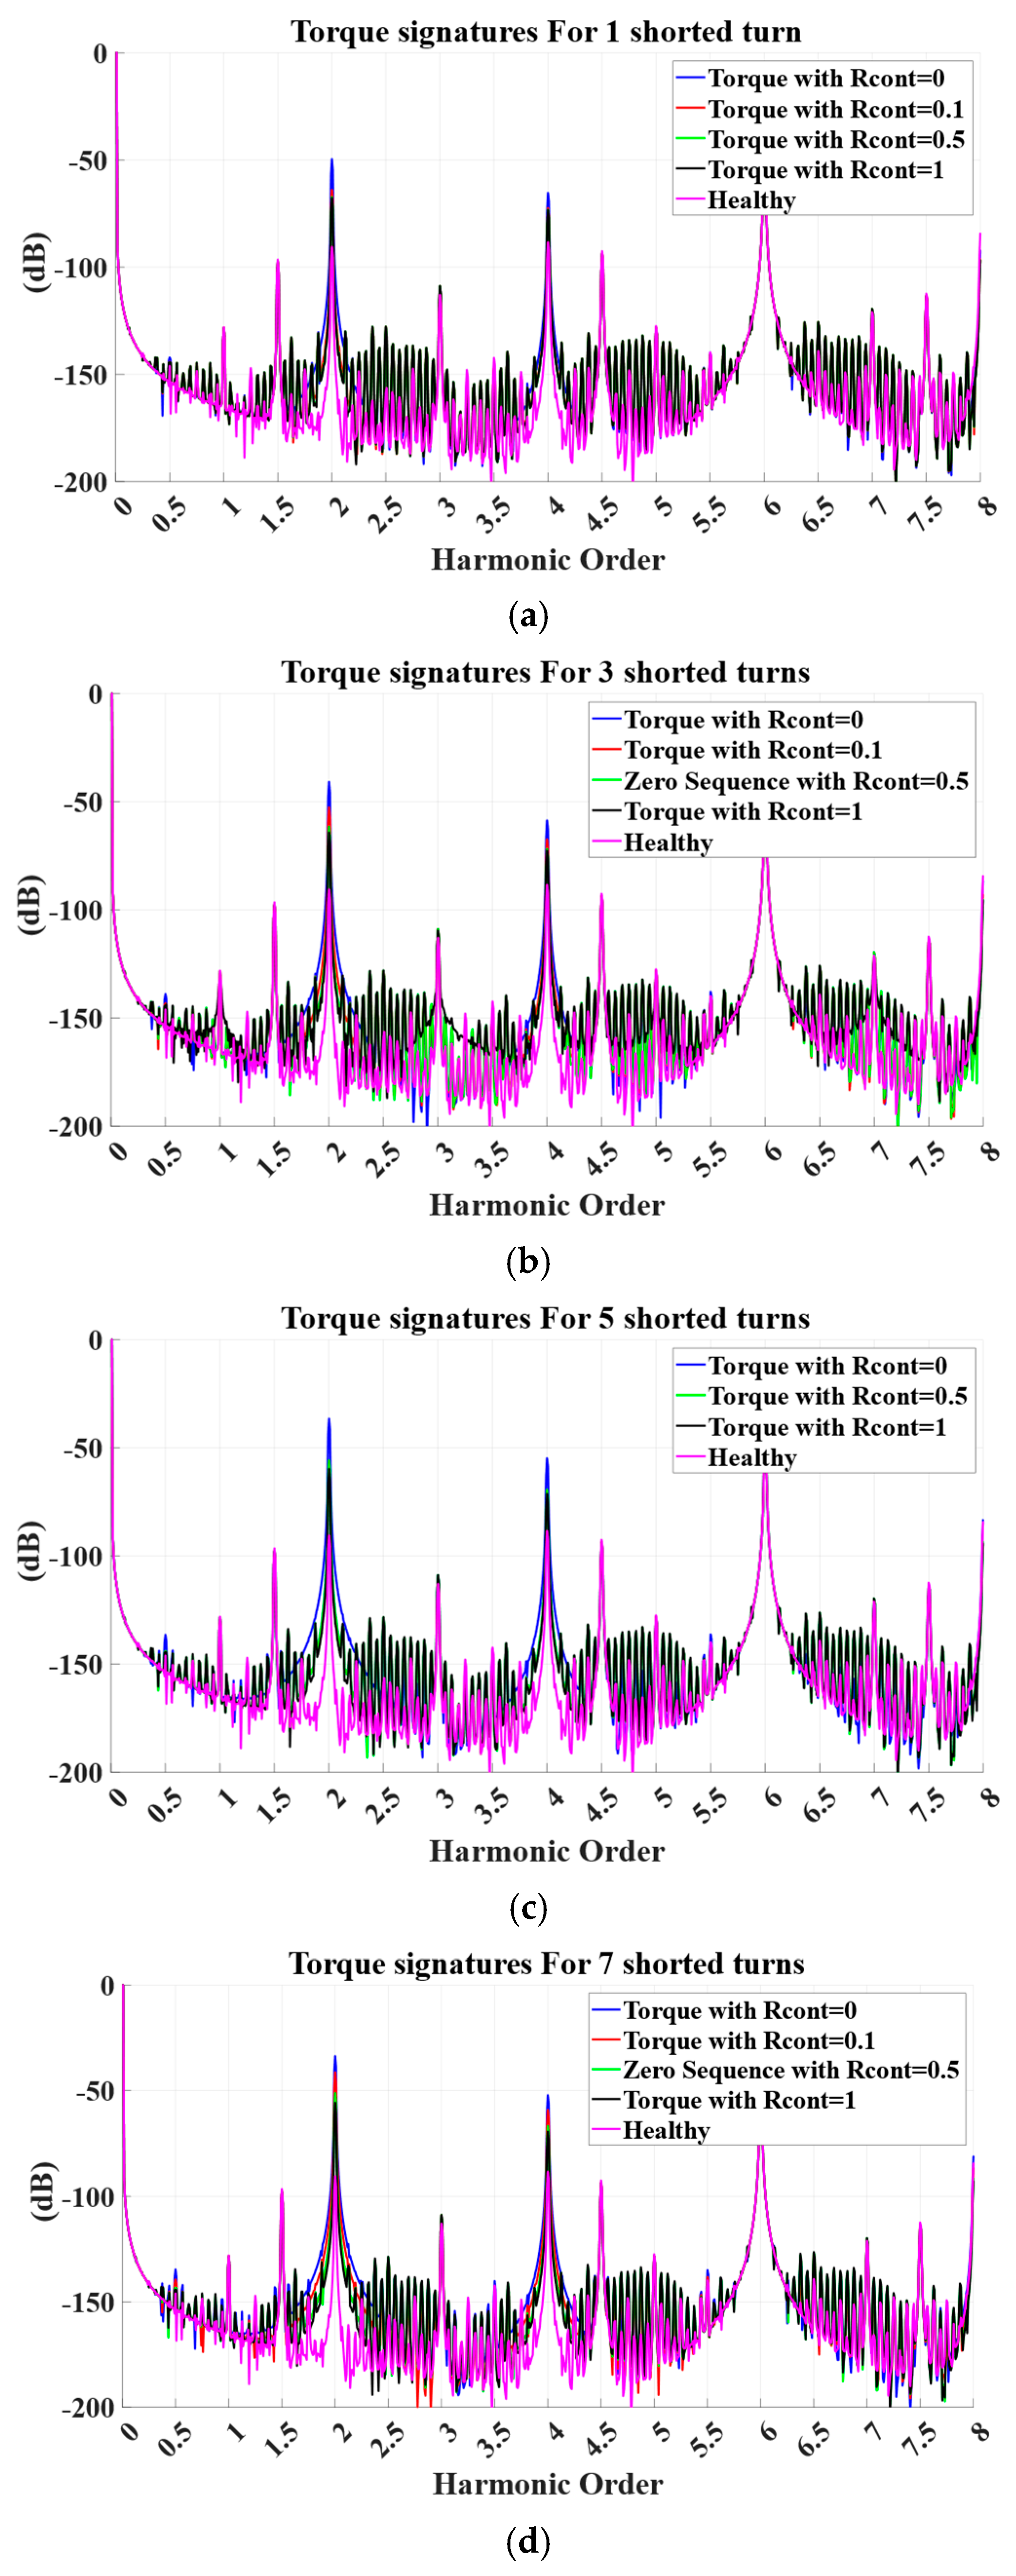
Figure 6.
Torque results for faulty cases (blue R_cont = 0, red R_cont = 0.1, green R_cont = 0.5, black R_cont = 1) versus the healthy (magenta) where (a) 1 shorted turn, (b) 3 shorted turns, (c) 5 shorted turns, (d) 7 shorted turns, (e) 9 shorted turns, and (f) 41 (20%) shorted turns.
Figure 6.
Torque results for faulty cases (blue R_cont = 0, red R_cont = 0.1, green R_cont = 0.5, black R_cont = 1) versus the healthy (magenta) where (a) 1 shorted turn, (b) 3 shorted turns, (c) 5 shorted turns, (d) 7 shorted turns, (e) 9 shorted turns, and (f) 41 (20%) shorted turns.
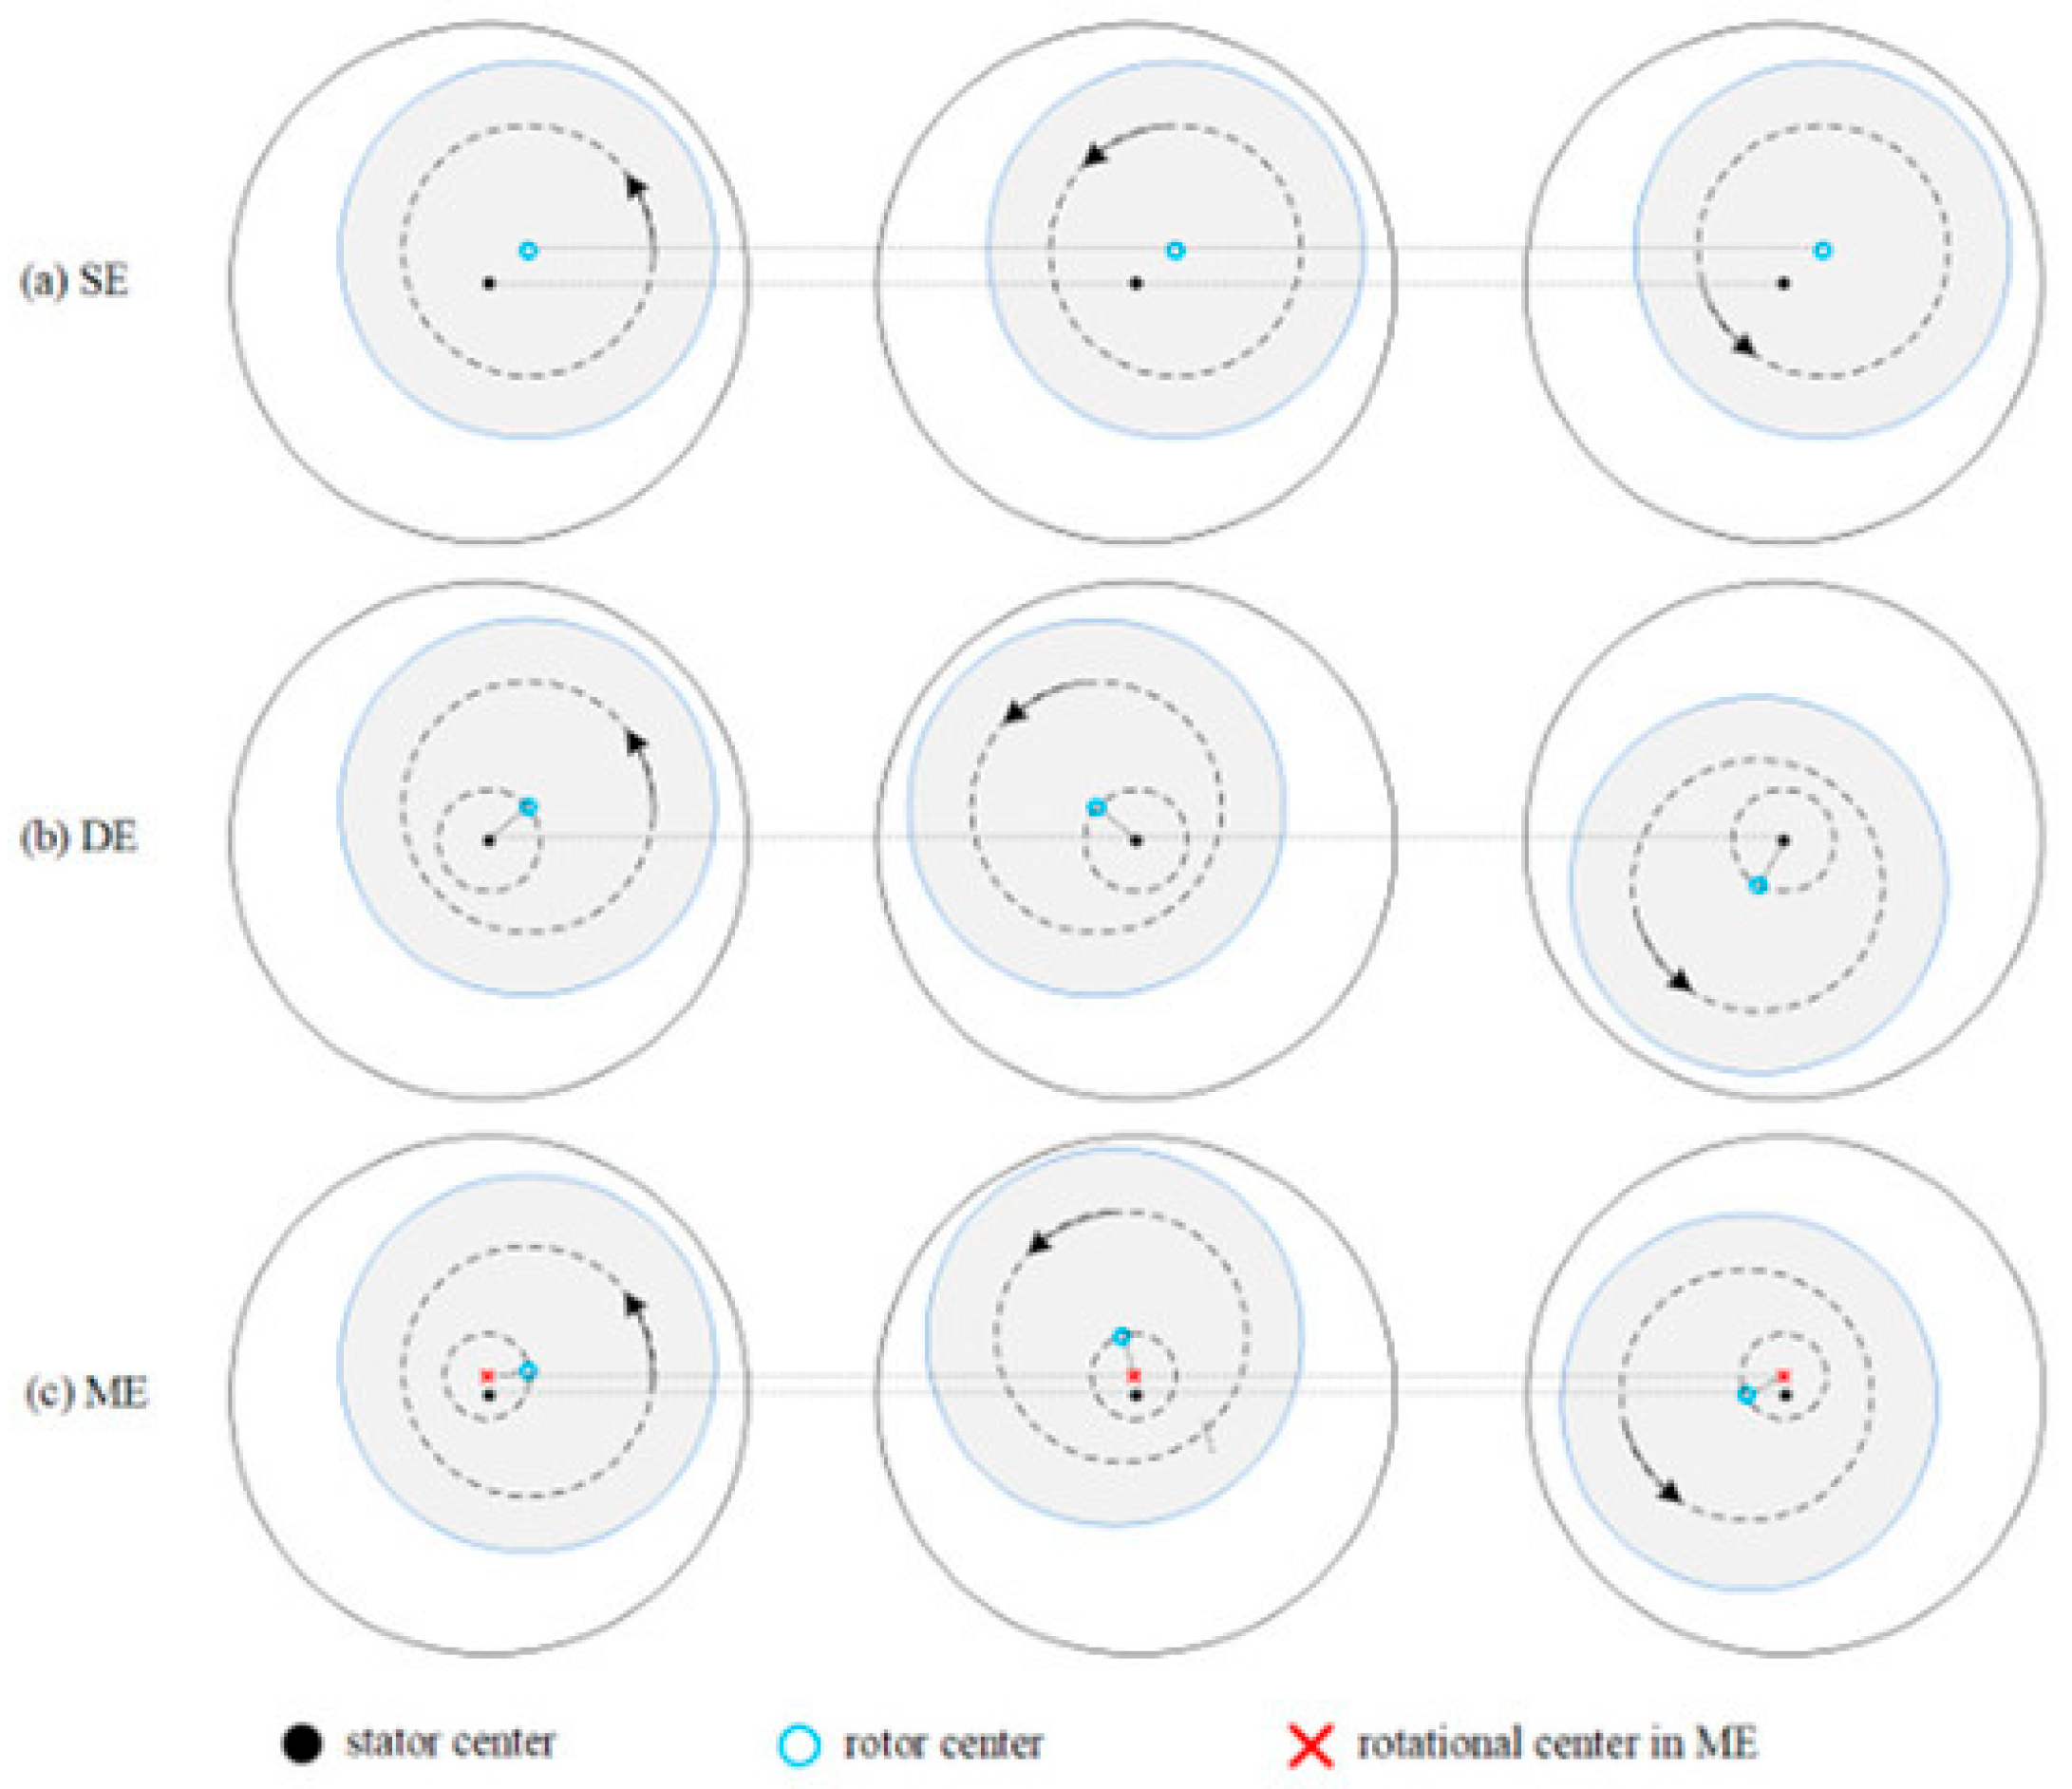
Figure 7.
Illustration of eccentricity faults (
a) SE, (
b) DE, and (
c) ME [
33].
Figure 7.
Illustration of eccentricity faults (
a) SE, (
b) DE, and (
c) ME [
33].
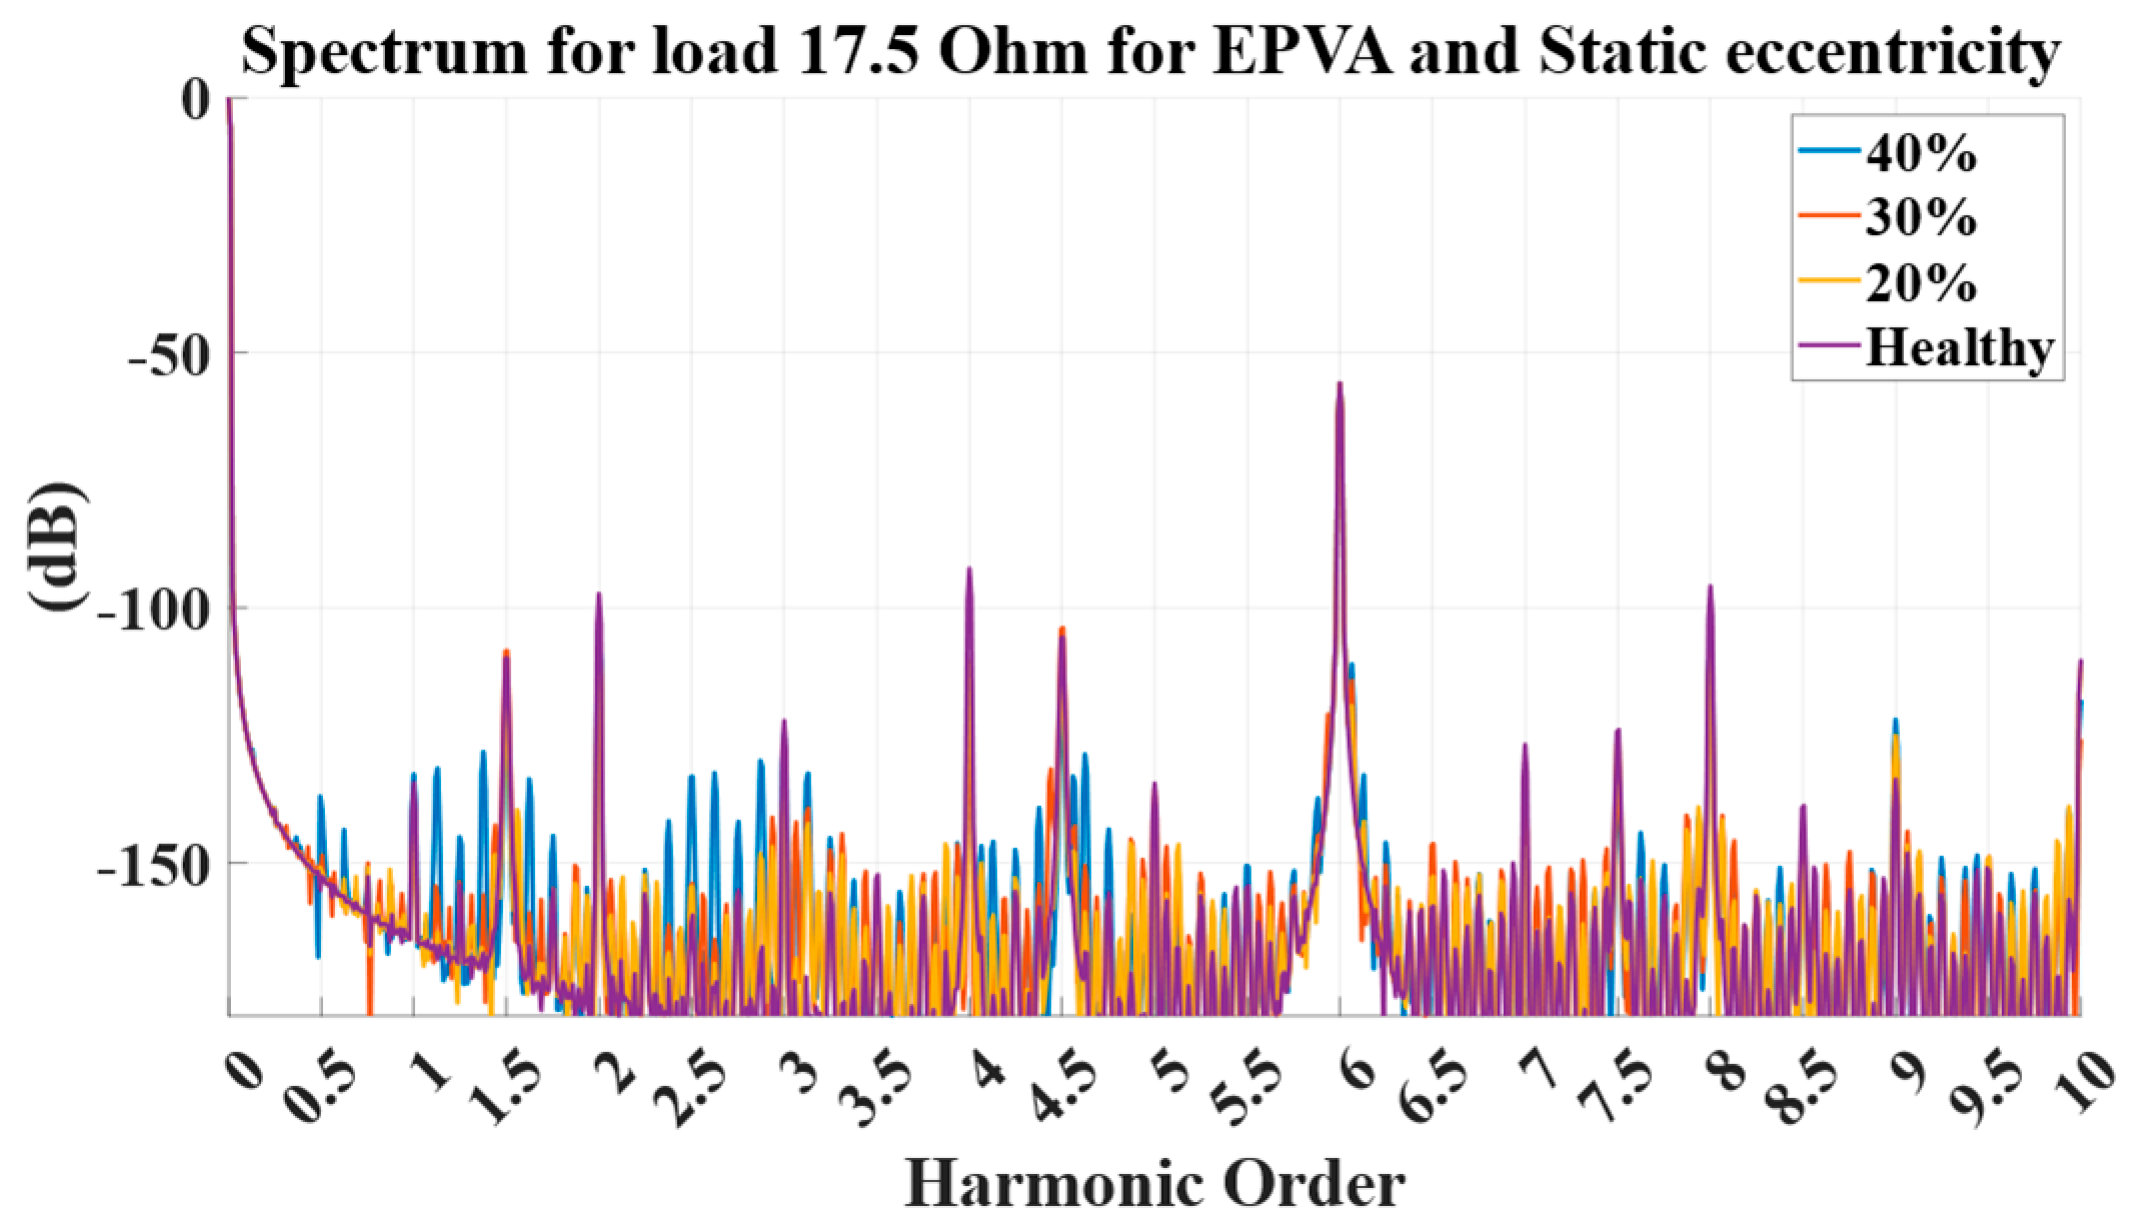
Figure 8.
EPVA results for faulty cases (where yellow—20% static eccentricity, red—30% static eccentricity, blue—40% static eccentricity) versus those that are healthy (purple).
Figure 8.
EPVA results for faulty cases (where yellow—20% static eccentricity, red—30% static eccentricity, blue—40% static eccentricity) versus those that are healthy (purple).
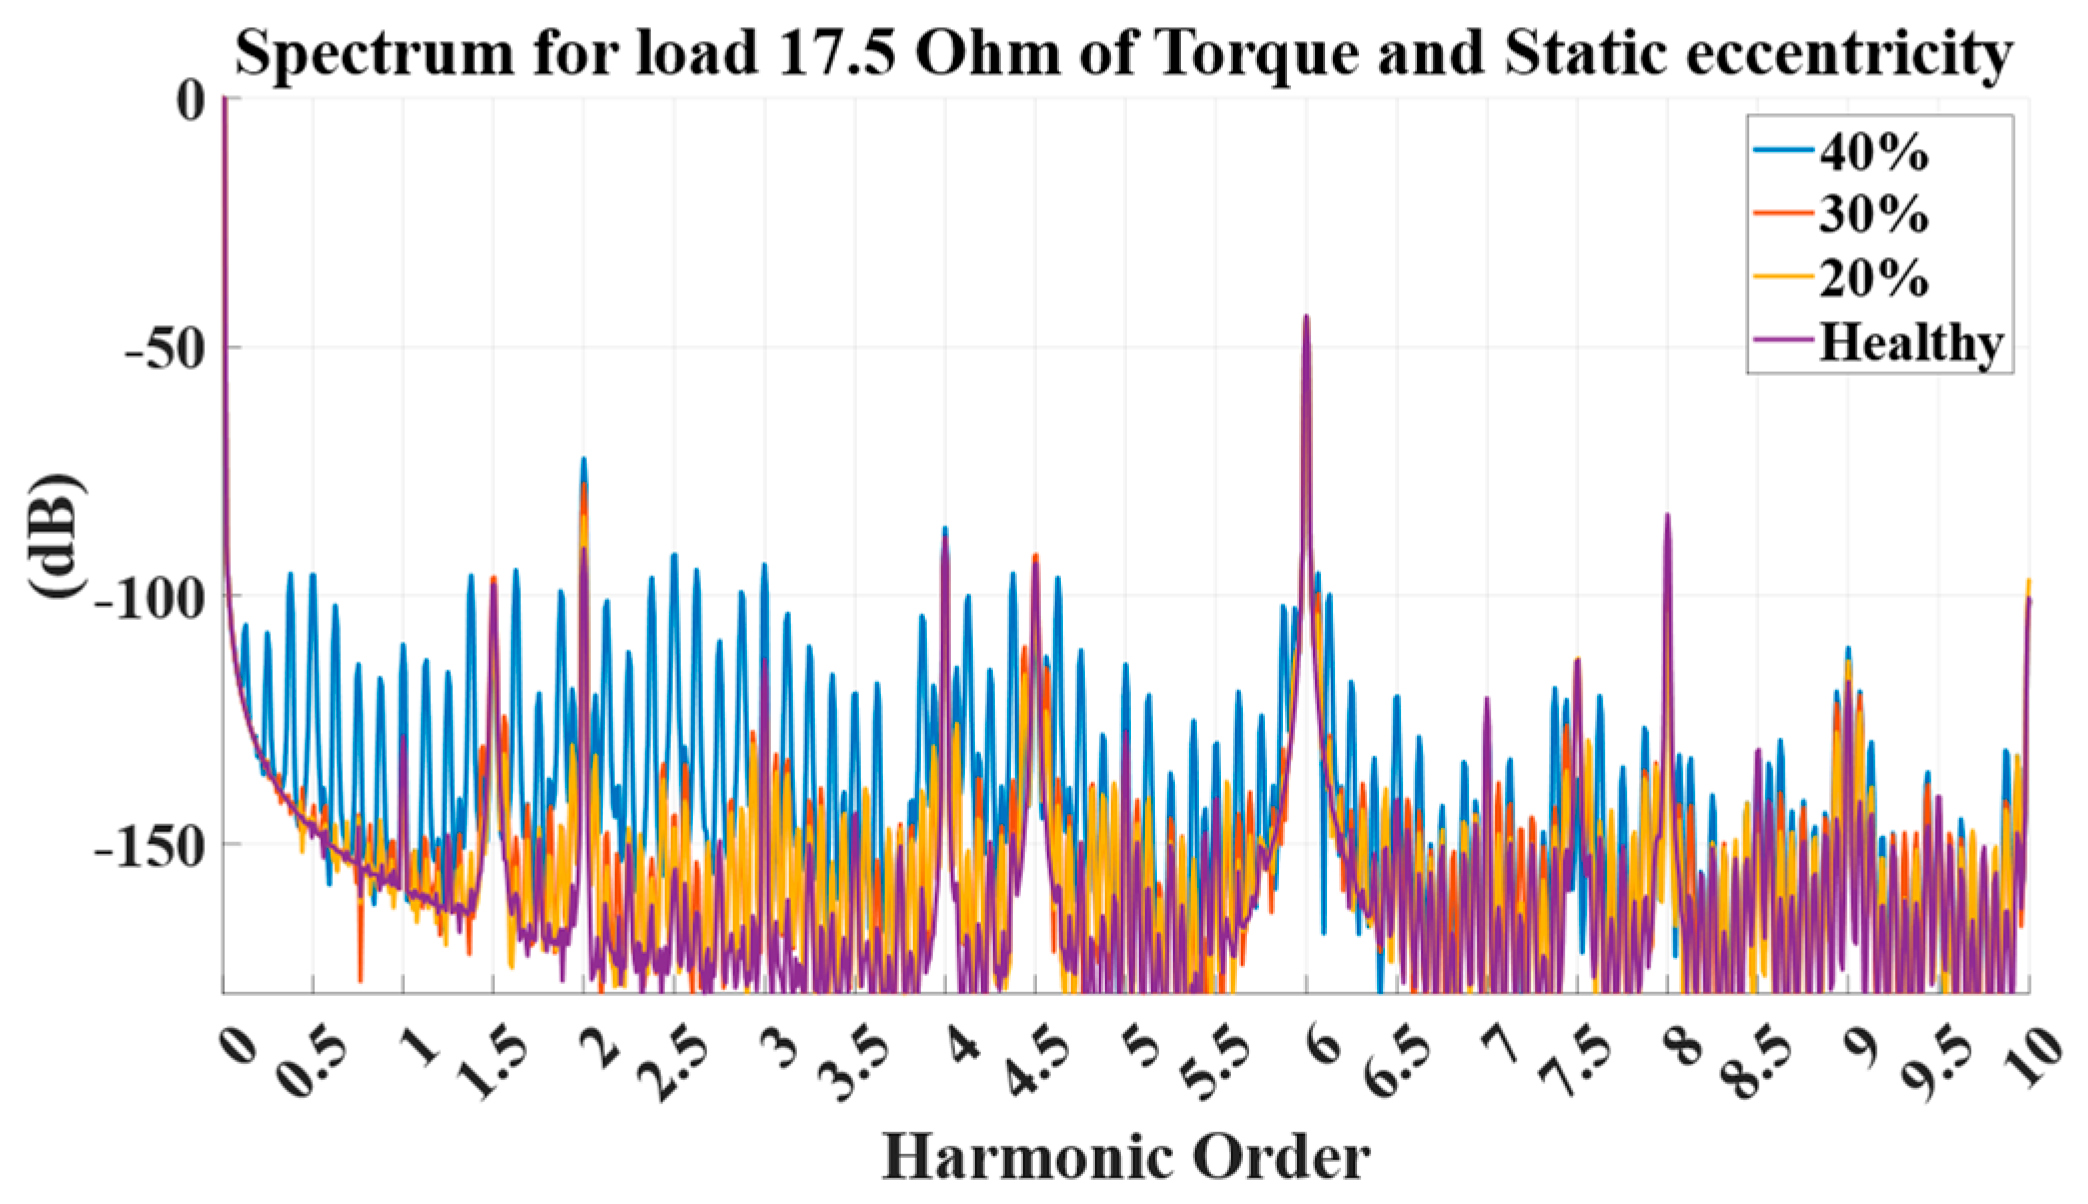
Figure 9.
Torque results for faulty cases (where yellow—20% static eccentricity, red—30% static eccentricity, blue—40% static eccentricity) versus those that are healthy (purple).
Figure 9.
Torque results for faulty cases (where yellow—20% static eccentricity, red—30% static eccentricity, blue—40% static eccentricity) versus those that are healthy (purple).
Figure 10.
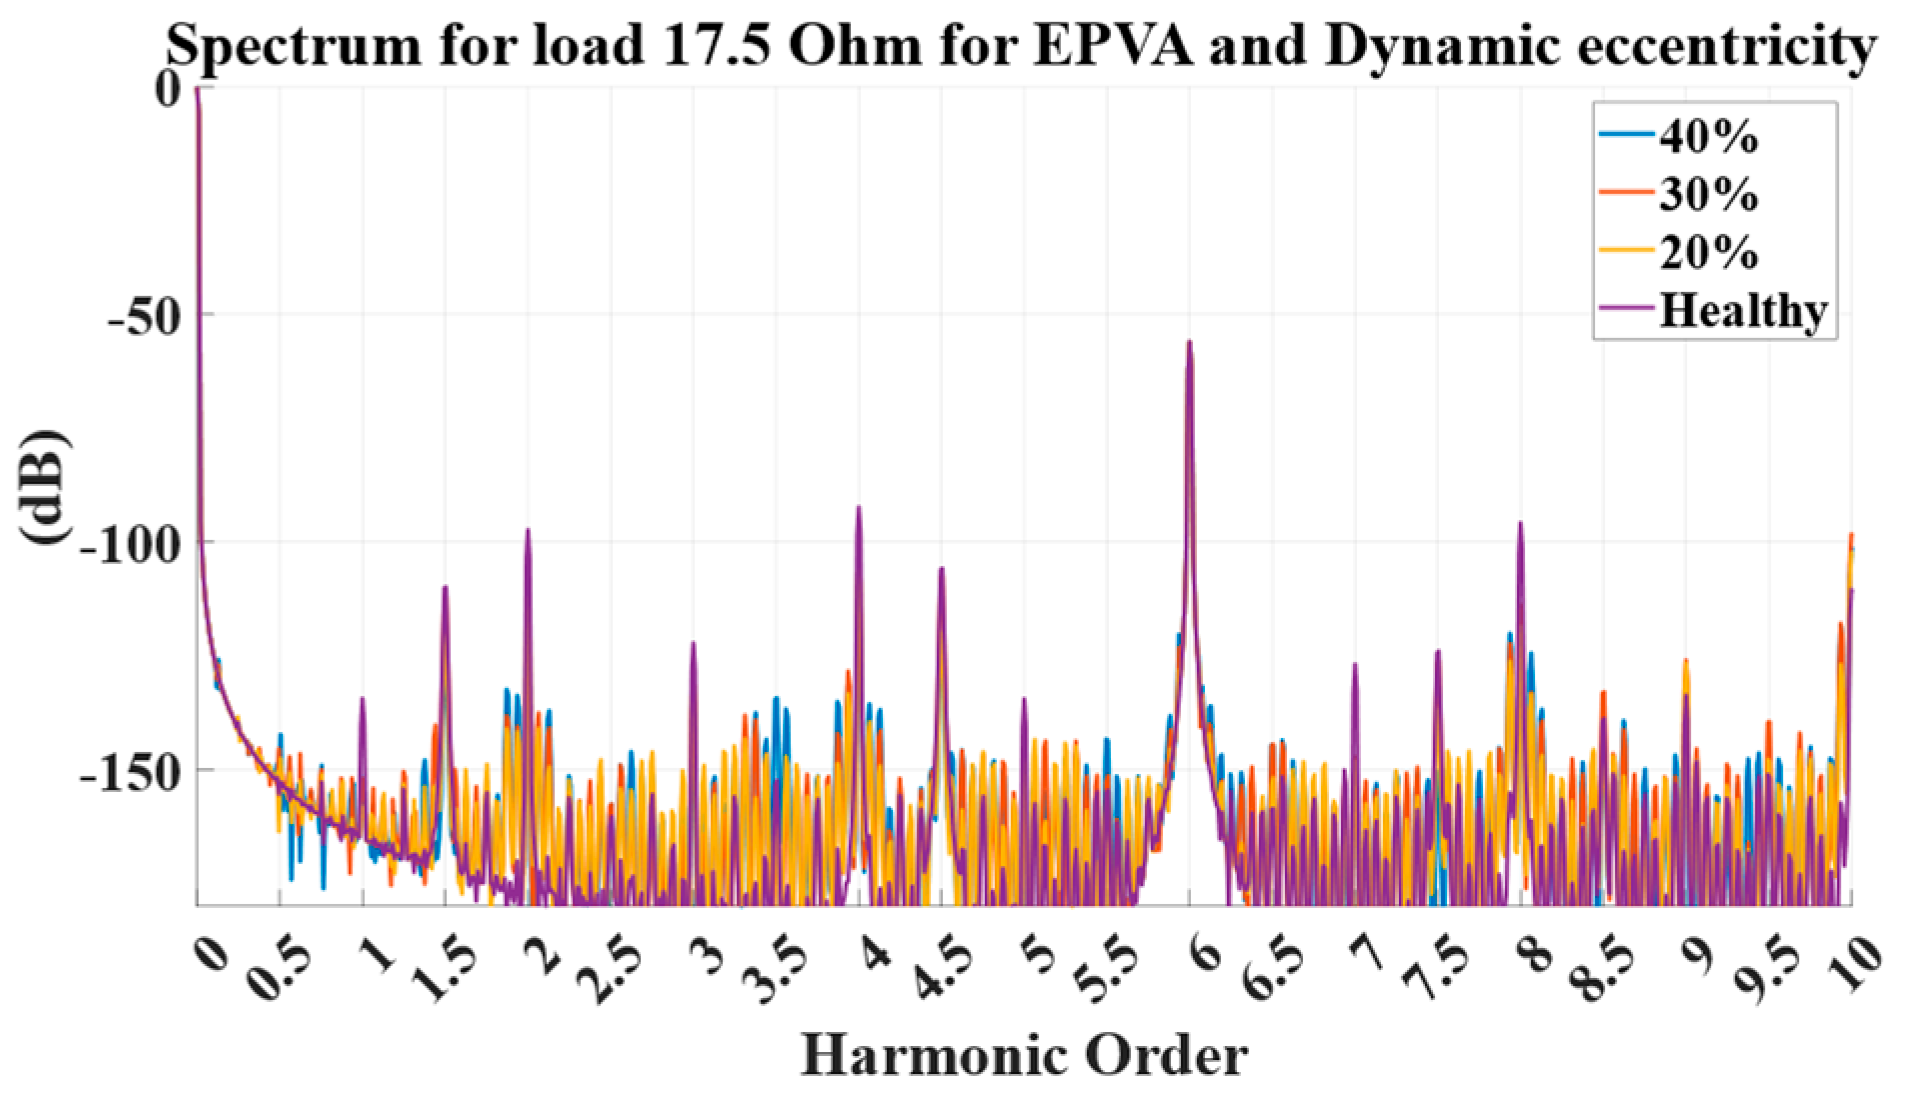
EPVA results for faulty cases (where yellow—20% dynamic eccentricity, red—30% dynamic eccentricity, blue—40% dynamic eccentricity) versus those that are healthy (purple).
Figure 10.
EPVA results for faulty cases (where yellow—20% dynamic eccentricity, red—30% dynamic eccentricity, blue—40% dynamic eccentricity) versus those that are healthy (purple).
Figure 11.
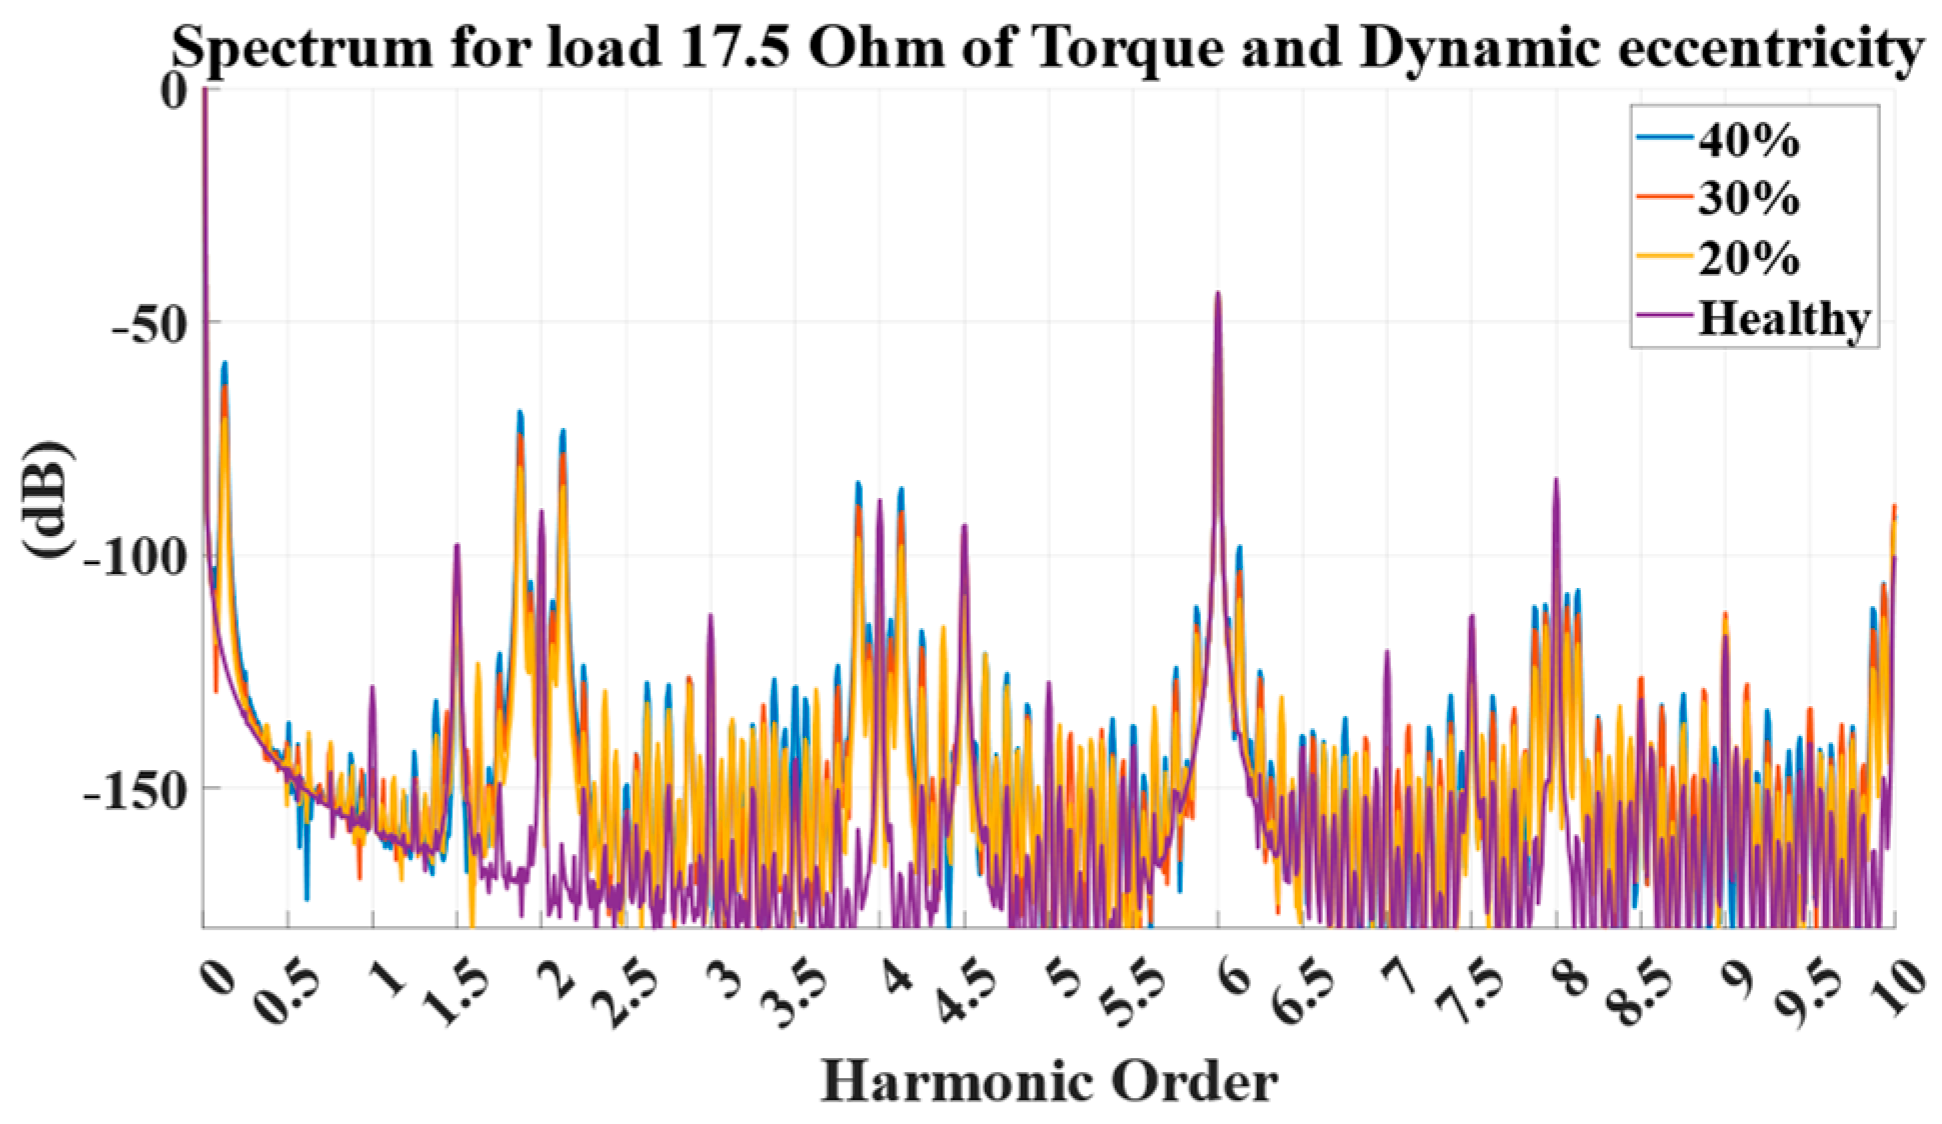
Torque results for faulty cases (where yellow—20% dynamic eccentricity, red—30% dynamic eccentricity, blue—40% dynamic eccentricity) versus those that are healthy (purple).
Figure 11.
Torque results for faulty cases (where yellow—20% dynamic eccentricity, red—30% dynamic eccentricity, blue—40% dynamic eccentricity) versus those that are healthy (purple).
Table 1.
Generator properties.
Table 1.
Generator properties.
| Rated Power (kW) | 21.5 |
| Rated Speed (rpm) | 100 |
| Stator | Coreless |
| Frequency (Hz) | 26.67 |
| Pole Pairs | 16 |
| Stator Coils | 24× single concentrated |
| Stator Coil Turns | 205 |
| Magnet Material | N42 |
Table 2.
FEA Verification.
Table 2.
FEA Verification.
| | FEA | Experimental | Deviation (%) |
|---|
| Phase Voltage (V) | 301.2 | 306.7 | 1.79 |
| Phase Current (A) | 17.19 | 17.41 | 1.28 |
| Torque (Nm) | 1565 | 1575 | 0.63 |
| Electrical Power (kW) | 15.5 | 15.4 | −0.65 |
| Mechanical Power (kW) | 16.4 | 16.5 | 0.61 |
| Efficiency (%) | 94.5 | 93.3 | −1.29 |
Table 3.
EPVA-demagnetization fault signatures amplitudes in decibels relative to the fundamental harmonic.
Table 3.
EPVA-demagnetization fault signatures amplitudes in decibels relative to the fundamental harmonic.
| Machine Condition | /2 | | /2 |
|---|
| Healthy | −108.57 dB | −122.28 dB | −104.63 dB |
| 1 Demagnetized Magnet: 25% | −54.96 dB | −85.24 dB | −81.52 dB |
| 1 Demagnetized Magnet: 50% | −48.89 dB | −79.49 dB | −75.46 dB |
| 2 Demagnetized Magnets: 25% | −108.09 dB | −79.00 dB | −104.60 dB |
| 2 Demagnetized Magnets: 50% | −106.74 dB | −72.98 dB | −104.56 dB |
| 2 Demagnetized Magnets: 25% and 50% | −54.87 dB | −75.56 dB | −81.52 dB |
Table 4.
Torque-demagnetization fault signatures amplitudes in decibels relative to the fundamental harmonic.
Table 4.
Torque-demagnetization fault signatures amplitudes in decibels relative to the fundamental harmonic.
| Machine Condition | /2 | |
|---|
| Healthy | −103.02 dB | −123.49 dB |
| 1 Demagnetized Magnet: 25% | −51.84 dB | −77.94 dB |
| 1 Demagnetized Magnet: 50% | −47.95 dB | −67.96 dB |
| 2 Demagnetized Magnets: 25% | −72.41 dB | −72.72 dB |
| 2 Demagnetized Magnets: 50% | −60.38 dB | −62.53 dB |
| 2 Demagnetized Magnets: 25% and 50% | −53.05 dB | −66.53 dB |
Table 5.
EPVA second harmonic-ITSC fault signatures amplitudes in decibels relative to the fundamental harmonic.
Table 5.
EPVA second harmonic-ITSC fault signatures amplitudes in decibels relative to the fundamental harmonic.
| Nshorted/Rcont | 0 (Ω) | 0.1 (Ω) | 0.5 (Ω) | 1 (Ω) |
|---|
| 1 | −78.68 dB | −82.40 dB | −82.15 dB | −82.10 dB |
| 3 | −69.48 dB | −81.08 dB | −83.78 dB | −82.75 dB |
| 5 | −64.82 dB | −74.90 dB | −83.20 dB | −83.05 dB |
| 7 | −61.73 dB | −69.98 dB | −80.21 dB | −83.08 dB |
| 9 | −59.42 dB | −66.37 dB | −76.67 dB | −81.22 dB |
| 41 | −44.74 dB | −47.00 dB | −52.67 dB | −56.76 dB |
Table 6.
EPVA fourth harmonic-ITSC fault signatures amplitudes in decibels relative to the fundamental harmonic.
Table 6.
EPVA fourth harmonic-ITSC fault signatures amplitudes in decibels relative to the fundamental harmonic.
| Nshorted/Rcont | 0 (Ω) | 0.1 (Ω) | 0.5 (Ω) | 1 (Ω) |
|---|
| 1 | −84.42 dB | −84.02 dB | −83.97 dB | −83.97 dB |
| 3 | −83.92 dB | −84.48 dB | −84.32 dB | −84.17 dB |
| 5 | −81.96 dB | −84.73 dB | −84.83 dB | −84.42 dB |
| 7 | −79.73 dB | −84.24 dB | −84.85 dB | −84.07 dB |
| 9 | −77.70 dB | −82.93 dB | −85.07 dB | −84.70 dB |
| 41 | −63.17 dB | −65.26 dB | −70.72 dB | −74.74 dB |
Table 7.
Torque 2nd harmonic-ITSC fault signatures amplitudes in decibels relative to the fundamental harmonic.
Table 7.
Torque 2nd harmonic-ITSC fault signatures amplitudes in decibels relative to the fundamental harmonic.
| Nshorted/Rcont | 0 (Ω) | 0.1 (Ω) | 0.5 (Ω) | 1 (Ω) |
|---|
| 1 | −49.66 dB | −64.02 dB | −67.35 dB | −67.92 dB |
| 3 | −40.78 dB | −52.61 dB | −61.48 dB | −64.30 dB |
| 7 | −33.61 dB | −41.26 dB | −51.07 dB | −55.68 dB |
| 9 | −31.45 dB | −37.96 dB | −47.43 dB | −52.14 dB |
| 41 | −18.20 dB | −20.18 dB | −25.34 dB | −29.19 dB |
Table 8.
Torque 4th harmonic-ITSC fault signatures amplitudes.
Table 8.
Torque 4th harmonic-ITSC fault signatures amplitudes.
| Nshorted/Rcont | 0 (Ω) | 0.1 (Ω) | 0.5 (Ω) | 1 (Ω) |
|---|
| 1 | −65.46 dB | −72.45 dB | −73.31 dB | −74.43 dB |
| 3 | −58.59 dB | −67.45 dB | −71.76 dB | −72.68 dB |
| 7 | −52.16 dB | −59.05 dB | −66.61 dB | −69.37 dB |
| 9 | −50.14 dB | −56.16 dB | −64.07 dB | −67.41 dB |
| 41 | −37.48 dB | −39.33 dB | −44.29 dB | −48.02 dB |
Table 9.
Torque analysis-DE fault signatures amplitudes in decibels relative to the fundamental harmonic.
Table 9.
Torque analysis-DE fault signatures amplitudes in decibels relative to the fundamental harmonic.
| Machine Condition | | | | | |
|---|
| Healthy | −123.51 dB | −167.13 dB | −166.81 dB | −158.86 dB | −167.39 dB |
| 20% dynamic eccentricity | −72.17 dB | −81.20 dB | −85.30 dB | −96.33 dB | −98.08 dB |
| 30% dynamic eccentricity | −63.70 dB | −74.18 dB | −78.23 dB | −89.48 dB | −90.76 dB |
| 40% dynamic eccentricity | −58.71 dB | −69.19 dB | −73.24 dB | −84.48 dB | −85.77 dB |
Table 10.
Comparison of different fault-detection approaches.
Table 10.
Comparison of different fault-detection approaches.
| Fault Signature/Approaches | Observable & Key Indicators | Sensitivity (Demag) | Sensitivity (ITSC) | Sensitivity (SE) | Sensitivity (DE) | Robustness to Speed/Load |
|---|
| EPVA | Park/phase-voltage space-vector; 2nd harmonic and negative sequence ratios (normalized indices recommended) | Low–Moderate (not primary channel) | Moderate–High (theoretically strong 2nd harmonic; in practice weak for few turns or finite Rcont) | Low (static asymmetry yields small sequence imbalance) | Moderate (better than MCSA if baseline-normalized; healthy 2nd-harmonic floor can mask) | Moderate (baseline subtraction improves) |
| Torque Analysis | | High for incipient demag (≥40 dB rise at lower sideband); moderate otherwise | Low–Moderate (visible mainly at higher severity) | Moderate (ripple increase) | Moderate–High (time-varying permeance produces clear oscillations) | Moderate (requires effective filtering of inverter ripple |




 ,
,