Abstract
Energy-intensive sectors in emerging nations have the simultaneous difficulties of trying to diminish greenhouse gas emissions while maintaining a stable and cost-effective energy supply. Rooftop solar photovoltaic (PV) systems offer a viable solution, especially in tropical areas like Indonesia that have elevated solar irradiance. This study employs a comprehensive methodology to evaluate the structural, economic, and safety viability of rooftop photovoltaic adoption in the Fast-Moving Consumer Goods (FMCG) sector. Structural analysis utilizing the PMM Ratio verified that industrial rooftops can support a 599 kWp photovoltaic system with minimal reinforcements. The economic assessment revealed substantial feasibility, featuring a Levelized Cost of Energy (LCOE) of Rp 261.40/kWh (about USD 0.016/kWh), yearly savings of Rp 1.36 billion (approximately USD 89,000), a Return on Investment (ROI) of 570%, and a payback duration of 3.73 years. The safety evaluation utilizing the Hazard Identification and Risk evaluation (HIRA) technique found significant hazards—working at height, electrical faults, and fire risks—and recommended mitigation measures in accordance with IEC and Indonesian standards. The findings establish a replicable paradigm for assessing rooftop photovoltaic systems in energy-intensive sectors and furnish actionable recommendations for policymakers and industry executives to expedite the adoption of renewable energy in tropical emerging economies.
1. Introduction
The global shift to low-carbon energy systems has increased the demand for enterprises to incorporate renewable energy solutions that provide sustainability, dependability, and cost effectiveness [1]. Photovoltaic (PV) systems are unique among renewable technologies due to their scalability, low installation costs, and quick technological advancements [2]. Rooftop PV is a strategic way to reduce greenhouse gas emissions and enhance energy resilience in tropical nations like Indonesia, where solar irradiation averages 4.8 kWh/m2 [3].
Indonesia’s National Energy Policy (Presidential Regulation No. 79/2014) aims to achieve a 23% renewables contribution of the national energy mix by 2025 [4]. However, fossil-based energy sources continue to dominate the industrial sector, which accounts for over 40% of the total power usage [5]. This reliance exposes sectors to cost volatility and carbon-related risks, particularly in the Fast-Moving Consumer Goods (FMCG) industry, which is distinguished by continuous 24-h operations and energy-intensive equipment including chillers, conveyors, and packing systems [6].
In this regard, the Fast-Moving Consumer Goods (FMCG) industry is notably energy-intensive. Manufacturing facilities function on continuous 24-h production cycles, utilizing high-capacity machinery including chillers, automated packaging systems, and storage units with stringent cooling specifications [6]. Notwithstanding prior attempts to harness alternative renewable resources like biomass and biogas, their dependability is frequently constrained by irregular fuel availability and variable energy production [7]. Thus, rooftop photovoltaic systems present a viable alternative; yet, their adoption in the fast-moving consumer goods sector is limited.
Previous research has looked into rooftop PV applications in residential, commercial, and utility-scale settings, but their relevance to the FMCG industry remains unknown. Singh et al. [8] investigated the economic benefits of PV adoption in India, but neglected structural reliability issues in existing industrial buildings. Coglan et al. [9] found that roof material and geometry have a substantial impact on module temperature and long-term performance. However, their analysis was limited to technical issues and did not include economic or safety concerns. Broader investigations, such as the IEA (2021) and Naspolini et al. [10], corroborated the global competitiveness of rooftop PV systems, but only a few studies have addressed occupational safety or contextualized findings for tropical industrial environments. In the Indonesian context, Rababah et al. [11] evaluated PV feasibility for factories but limited their scope to techno-economic evaluation, leaving structural and HSE (Health, Safety and Environment) factors unexplored.
These limitations underscore the lack of an integrated framework that takes into account structural integrity, economic feasibility, and safety risks, especially in energy-intensive FMCG factories operating in tropical climates.
The uniqueness of this study stems from its complete methodology, which combines structural, economic, and safety considerations into a unified scientific framework. The structural evaluation uses the PMM (Axial Force-Moment-Moment) Ratio to account for the combined effects of axial compression and biaxial bending on rooftop elements, assuring load-bearing safety. Economic viability is assessed using important variables such as the Levelized Cost of Energy (LCOE), Return on Investment (ROI), and Payback Period. Meanwhile, safety is assessed using the Hazard Identification and Risk Assessment (HIRA) approach, which is compliant with IEC 60364 and ISO 45001 standards [12]. Figure 1 outlines the primary concerns evaluated in these three dimensions—structural, economic, and safety—as well as environmental conditions that affect module performance, such as temperature rise and limited cooling on industrial rooftops. By incorporating these factors, the study presents a repeatable and contextually appropriate approach for evaluating rooftop PV systems in the FMCG sector, thereby filling a significant vacuum in academic literature and industrial practice.
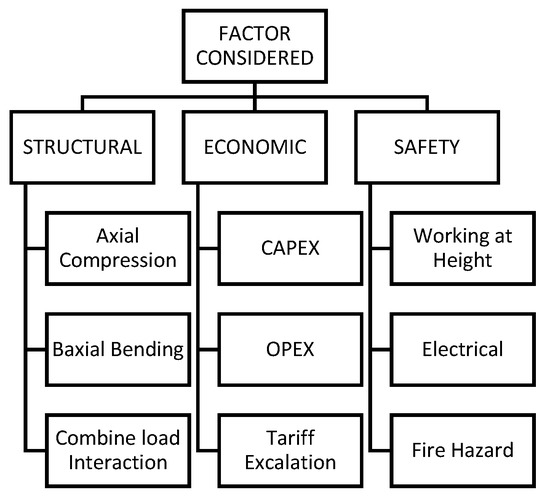
Figure 1.
Classification of factors considered in the integrated techno-economic and safety assessment of rooftop PV systems.
This research utilizes real electricity consumption data from an FMCG company in Indonesia, offering a detailed case study that enhances both academic discussion and practical decision-making. The results illustrate the technical and economic appeal of rooftop photovoltaic systems while also suggesting a repeatable framework for mitigating risks associated with solar investments in the industrial sectors of tropical emerging nations.
The implementation of rooftop photovoltaic systems in industrial buildings necessitates thorough structural assessment, as the majority of fast-moving consumer goods industries in Indonesia were not initially engineered to support extra rooftop weight [13]. This study employs the PMM (Axial Force–Moment–Moment) Ratio approach to assess the synergistic impacts of axial loads and biaxial bending moments on structural components [14]. A PMM ratio under 1.0 signifies secure structural performance for simultaneous loading conditions, thereby guaranteeing that the roofing can consistently sustain PV installations without jeopardizing factory safety [15].
Moreover, the on-grid rooftop photovoltaic (Figure 2) arrangement is chosen for its appropriateness for uninterrupted industrial activities. In contrast to off-grid systems that necessitate costly battery storage, the on-grid architecture directly links to the public power grid, facilitating immediate utilization of solar energy and effortless integration with current factory systems [16]. In the utilities section of the case study, the system is integrated via a Change Over Switch (COS) network, which was selected over the Static Transfer Switch (STS) to protect production lines from instability during switching events [17].
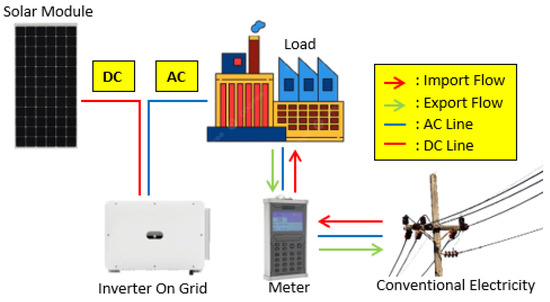
Figure 2.
On-Grid Rooftop PV system.
Notwithstanding the optimistic prospects, space constraints hinder the comprehensive implementation of rooftop photovoltaic systems in the FMCG case study plan [18]. The available roof surface is inadequate to accommodate a system that can fulfill the factory’s whole energy requirement, which surpasses 200,000 kWh per month [19]. This study concentrates on the utility area, an essential support zone comprising chillers, compressors, lighting systems, and auxiliary pumps to mitigate this constraint. This location was deliberately chosen due to its significant contribution to daily electricity consumption (about 6982 kWh) and its relative insensitivity to brief switching delays compared to production lines. By focusing on the utility area, the rooftop photovoltaic system can optimize the integration of renewable energy within current spatial constraints, diminish reliance on grid electricity, and maintain continuous production in essential manufacturing processes [20].
The configuration of photovoltaic (PV) systems consists of three main types: on-grid, off-grid, and hybrid. The on-grid photovoltaic (PV) system is a system directly connected to the public electricity grid, where the energy produced by solar panels can be used directly for daily needs, and excess energy can be fed back into the grid. This system does not require batteries for energy storage, resulting in a lower initial installation cost; however, it relies on a stable electricity grid. Unlike on-grid systems, off-grid solar power systems operate independently, without being connected to the electrical grid, and require batteries to store energy so that it can still be used at night or during cloudy weather. This system is suitable for remote areas that lack access to the electrical grid, although the initial cost is higher due to the requirement for batteries. Meanwhile, the hybrid photovoltaic (PV) system is a combination of on-grid and off-grid, with the system connected to the electrical grid and equipped with batteries for energy storage. Thus, hybrid Rooftop PV systems allow users to store excess energy in batteries, utilize energy from the grid when needed, and continue operating during power outages. Although more flexible in energy management, hybrid Rooftop PV systems tend to have higher installation costs due to the inclusion of more complex components and controls.
2. Materials and Methods
The case study in this research was a Fast-Moving Consumer Goods (FMCG) enterprise in Indonesia characterized by significant electricity usage and ongoing production cycles. The scientific approach incorporates structural, economic, and safety evaluations to thoroughly assess the viability of using rooftop photovoltaic (PV) systems in industrial settings.
2.1. Structural Assessment
A structural integrity examination was initially performed to verify that the existing factory rooftop could safely support the extra photovoltaic loads. The majority of FMCG manufacturing structures in Indonesia were not initially engineered to accommodate additional rooftop loads, including photovoltaic modules, mounting frameworks, and inverters.
The analysis utilized the PMM (Axial Force–Moment–Moment) Ratio approach, which assesses the cumulative effect of axial compression and biaxial bending moments on structural components [21]:
where is the axial load, is the nominal axial capacity, and are the applied bending moments, and and are their corresponding nominal moment capacities. A ratio < 1.0 indicates structural safety.
The computations were executed with SAP2000 version 23 software [22]. Load assumptions adhered to Indonesian standards: SNI 1727:2020 for dead and live loads, SNI 1726:2019 for seismic design, and SNI 1727:2020/ASCE 7-16 for wind loads [23]. In instances where structural elements neared critical thresholds, reinforcements like steel brackets and angle profiles were recommended. These efforts were classified as ordinary building maintenance instead of direct photovoltaic project expenses.
The PMM ratio study was performed to assess the roof structure’s capacity to endure supplementary loads from the PV modules. The results indicated that most of the structural functions were within acceptable safety margins; however, several spots neared the maximum permitted stress limit. This circumstance is represented in Figure 3, which demonstrates the distribution of PMM ratios among the building elements. The visualization distinctly identifies structural components nearing their maximum design limits, thereby acting as an essential reference for assessing reinforcing requirements.
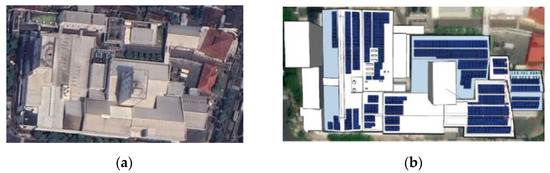
Figure 3.
Depicts (a) the configuration of the FMCG facility in Indonesia and (b) the implementation of the rooftop solar power system.
The reinforcement assessment was represented in a structural map, as illustrated in Figure 4. The green portions in this picture denote roof sections with adequate structural integrity to securely support the solar modules without alterations. Conversely, red sections denote areas of the building necessitating supplementary reinforcement measures, such as the installation of steel brackets or angle profiles, to assure load-bearing capacity. This color-coded depiction offers a clear differentiation between secure areas and reinforcement zones, facilitating a focused and effective fortification plan.
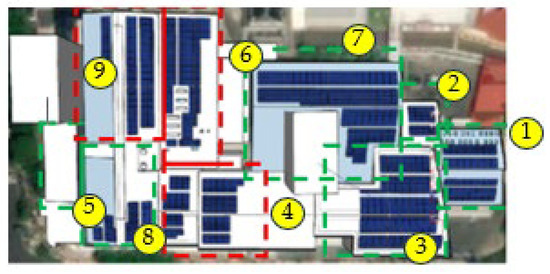
Figure 4.
Rooftop structural map showing areas suitable for PV installation and sections requiring reinforcement.
Figure 4 depicts both the level and slightly sloped roof structures of the FMCG plant. The majority of roof sections are flat, but some segments—particularly those above the utility and packaging zones—have slopes of 5–10° relative to the horizontal plane. To maximize incident irradiance, all photovoltaic modules were oriented north-northwest, in accordance with Indonesia’s ideal sun azimuth. The row-to-row spacing of 1.2 m was chosen to reduce self-shading while maintaining adequate airflow for module cooling. These geometric characteristics were included in the structural and energy simulations to ensure that the combined impacts of tilt, spacing, and wind loads were appropriately represented in the PMM ratio study.
2.2. Analysis of Electricity Consumption
The utility area was designated as the integration point for the rooftop PV system since geographical constraints on the factory rooftop rendered full-scale backup impractical. The utilities section includes essential supporting systems such as chillers, compressors, pumps, and lighting, which together consume roughly 6982 kWh daily.
Electricity use was tracked daily, weekly, and monthly to create a baseline load profile, as summarized in Table 1 [24]. Integration was implemented via a Change Over Switch (COS) network instead of a Static Transfer Switch (STS) to mitigate the risks of instability in production lines [25]. The photovoltaic system was designed to accommodate chillers and lighting loads, which represent the predominant portion of utility demand, while maintaining operational safety.

Table 1.
Electricity usage in each period.
Analysis of Economic Feasibility
The economic evaluation was conducted utilizing three financial metrics: Levelized Cost of Energy (LCOE), Return on Investment (ROI), and Payback Period (PBP) [26].
Principal assumptions encompassed:
- -
- Capital Expenditure: Rp 8,500,000 per kilowatt-peak (total about Rp 5.09 billion for 599 kilowatt-peak).
- -
- Operational Expenditure: Rp 80,000 per kWp annually (about Rp 47.9 million per year).
- -
- Annual inflation rate: 3% (average from Bank Indonesia, 2020–2024).
- -
- Module degradation: 0.5–0.7% year (according to IEC 61724-2 and IEA PVPS data) [27].
- -
- Operational lifespan: 25 years.
- -
- Tariff benchmark: Rp 1444.70/kWh (PLN unsubsidized 2024).
A sensitivity analysis was conducted to evaluate differences in CAPEX, OPEX, inflation, and PLN tariff hikes to improve robustness [28]. Results were illustrated using tornado charts, highlighting the elements that most significantly impact ROI and return.
Evaluation of System Safety.
A safety assessment was performed utilizing the Hazard Identification and Risk Assessment (HIRA) technique to identify potential hazards and establish suitable control measures [29]. The investigation identified many significant risks, including more labor during rooftop installation, electrical failures in inverters or wiring, and fire threats due to overheating modules or short circuits. To mitigate these risks, fall protection devices, full-body harnesses, and scaffolding were utilized for elevated work; grounding, surge protection, and overcurrent devices compliant with IEC 60364 were installed to manage electrical hazards [30]; and arc fault detection, fire suppression systems, and thermal monitoring were employed to reduce fire risks. All steps were executed in accordance with IEC 62446 and IEC 60364 [31], assuring conformity with Law No. 30/2007 on Energy and MEMR Regulation No. 2/2024 in Indonesia [32].
3. Results
Some structures require reinforcement, as depicted in the figure below. Therefore, the reinforcement that will be carried out will be illustrated.
Figure 5 illustrates the structural analysis of the building after reinforcement has been implemented. The diagram on the left represents the distribution of the stress ratio, also known as the PMM (P-M-M Ratio), on the building frame elements [33]. The colors in the diagram indicate the level of utilization of the structural element’s capacity, where the green color signifies a safe utilization ratio (<1.0). The analysis results show that all frame elements have a PMM Ratio below 1.0, which means that the structure is in a safe condition and capable of withstanding the applied load.
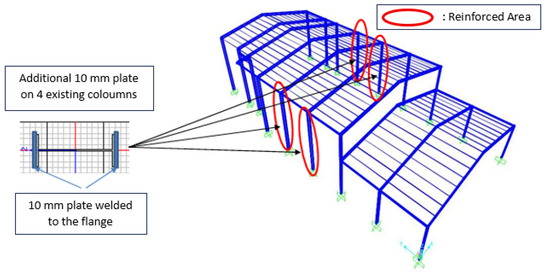
Figure 5.
Strengthening of building structure 4.
Meanwhile, the diagram in Figure 6 shows the maximum deformation or displacement of the structure after reinforcement. The maximum displacement recorded was 76.6 mm, which is smaller than the allowed limit, namely L/240 = 108.33 mm (where L is the length of the structural element) [34]. This indicates that the deformation remains within safe limits and does not compromise the structure’s stability.
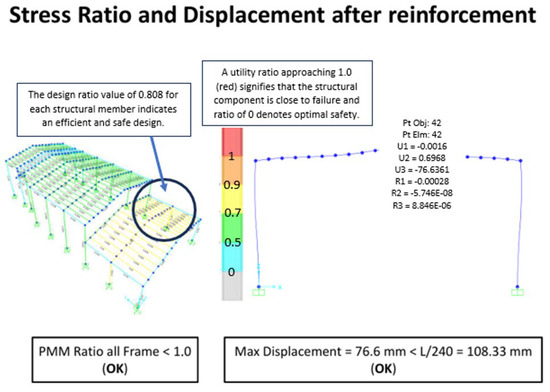
Figure 6.
Strengthening of building structure 6.
Figure 7 illustrates the strengthening design concept for Building Structure 9. The central diagram on the left shows a 3D model of the building structure with areas requiring reinforcement marked by dashed circles labeled A, B, and C. This model provides an overview of the structural elements that will be reinforced to enhance their stability and strength. On the right, three detailed sections illustrate the structural elements to be reinforced. Label A illustrates reinforcement on the central vertical elements, including columns. Label B shows reinforcement on the horizontal aspects, such as beams, in the middle of the structure, and Label C shows the addition of truss or frame elements to increase the rigidity and stability of the structure. This reinforcement aims to ensure that the structure in building nine can withstand additional loads or meet new design standards, particularly if there are changes in function or an increase in load capacity [35]. With this reinforcement design, the structure is expected to exhibit improved strength and stability, meeting the specific needs.
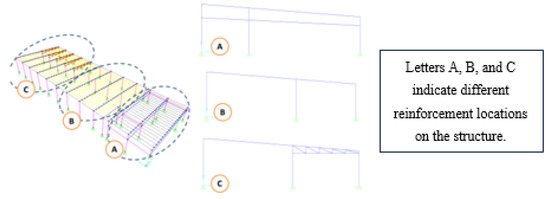
Figure 7.
Preliminary concept for reinforcing structural integrity of building structure 9.
The summary of all structural reinforcement measures discussed above is presented in Table 2.
Table 2.
Summary of Structural Reinforcement Measures for Rooftop Solar PV Implementation.
Figure 8 illustrates the structural reinforcement plan for critical elements, employing two primary methods: the use of knee braces and angle profiles. (2L). In the first part, reinforcement is carried out by adding a knee brace using a WF200 × 100 profile, which serves as a diagonal element to connect the horizontal beam with the vertical column [36]. This reinforcement aims to increase the stiffness and stability of the structure, especially at critical points marked with red circles. In the second part, the same reinforcement method is applied, but at more points to provide additional stability to the structure that requires greater support. Meanwhile, in the third section, reinforcement is carried out by adding a 2L 60 × 60 × 6 profile, which is an “L”-shaped angle profile installed in certain areas to provide additional stiffness to horizontal or diagonal elements. The installation locations of these profiles are also marked with red circles. Overall, this image illustrates a structural reinforcement strategy by utilizing knee braces and angle profiles to enhance the strength, stiffness, and stability of the structure, thereby enabling it to withstand additional loads and ensuring the safety of the building.
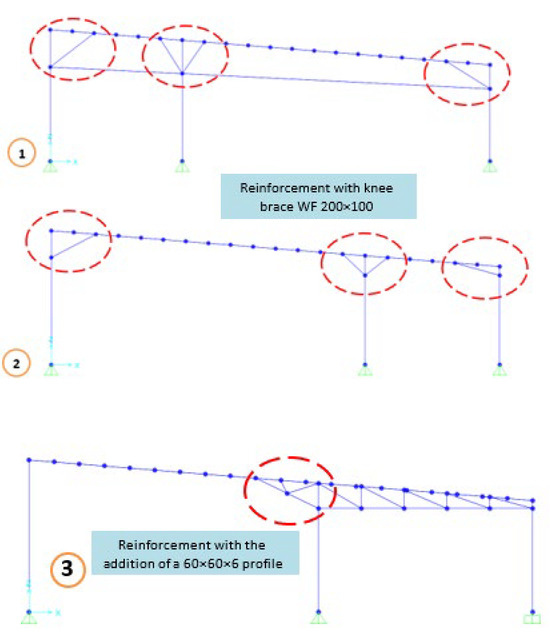
Figure 8.
Preliminary concept for reinforcing structural integrity of building structure 9. (Note: 1,2, and 3 identify the critical reinforcement details and sections to be strengthened).
Figure 9 illustrates the distribution of stress ratios in the reinforced structure. The colored diagram uses a color scale to depict the stress ratio values, where red indicates a ratio approaching the maximum limit (1.0), and green or blue indicates lower values, showing that the structure is within safe limits. The text “Stress Ratio Frame < 1000 (OK)” suggests that all frame elements have a stress ratio below 1, which means the structure has been adequately reinforced and is in a safe condition against material failure. The additional diagram at the bottom shows the stress ratio details for various structural elements.
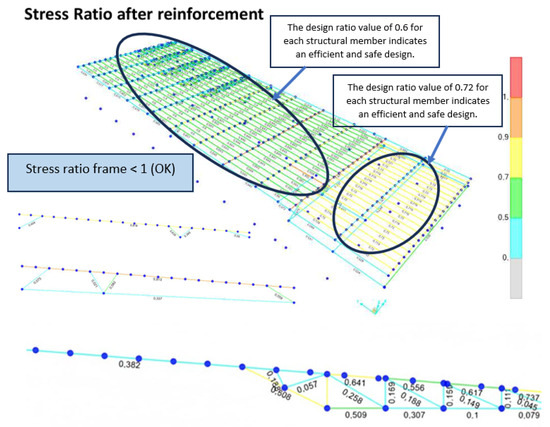
Figure 9.
After the structural reinforcement of building 9.
After the structural reinforcement of the building is completed, the installation of the rooftop PV system will be carried out as part of the initiative to utilize renewable energy within the industrial environment. The system design considers the limited available roof area, thereby restricting the number of solar modules that can be installed. Despite this limitation, the configuration has been optimized to deliver a significant energy contribution to the facility.
This solar power system will consist of two types of photovoltaic (PV) modules: 681 units of the first solar module type and 395 units of the second solar module type, both of which are newly acquired [37] (Figure 10). The average peak power output of these modules is approximately 540 Wp and 560 Wp, respectively. In total, 1076 modules will be installed, with a combined installed capacity of roughly ±599 kWp.
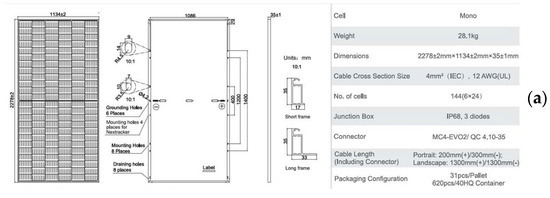
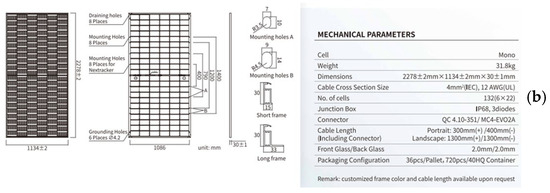
Figure 10.
The first solar module with a total installation of 681 units (a), and the second solar module with a total installation of 395 units (b).
The total surface area required for the installation of all PV modules is estimated to be approximately 2615 m2. Each module type has similar dimensions, measuring approximately 2.278 m × 1.134 m (±2.58 m2 per unit). Thus, the first module type will occupy an estimated 1758 m2, while the second module type will require approximately 1020 m2. These figures do not account for spacing between modules, maintenance pathways, or other technical allowances, so in practice, the actual roof space required will be slightly greater than the calculated module footprint alone.
Although the number of panels used is relatively limited due to land constraints, this system is designed to generate electricity in optimal amounts. Assuming an average solar irradiation intensity of 4.5 kWh/kWp per day, this solar power system is estimated to produce approximately 2695 kWh of electrical energy per day [38], or around 80,850 kWh per month under ideal operational conditions. This estimate remains theoretical and can be influenced by various factors, including system efficiency, ambient temperature, panel orientation and tilt, as well as weather conditions. Nevertheless, this solar power system is expected to provide significant energy savings and support more efficient and sustainable industrial operations.
As part of the rooftop solar power system to be installed, a total of five inverter units (Table 3) will be used to convert the direct current (DC) electricity generated by the solar panels into alternating current (AC) electricity suitable for industrial use. These inverters comprise three high-capacity units that will be reused, along with two newly procured units with varying capacities [39]. All inverters are designed to ensure optimal performance of the solar power system and are equipped with advanced features such as multi-MPPT technology for improved efficiency, overcurrent protection, and intelligent monitoring systems that support remote operation and maintenance.
Table 3.
The inverter that will be used.
With a total inverter capacity of 500 kWac, this system is optimized to match the total solar panel capacity of 599 kWp, ensuring the configuration remains within the reasonable limits of the DC/AC ratio, which typically ranges from 1.1 to 1.3 [40]. This ratio aims to optimize the inverter’s utilization without experiencing excessive loading or significant energy loss. The installation of the inverter will be carried out strategically, based on the panel installation zoning, to minimize losses and facilitate future maintenance processes. The presence of this inverter system becomes a vital component to ensure reliability, efficiency, and safety in the distribution of electrical energy from the solar power system to the internal industrial electrical network.
The utility area was designated as the integration point for the rooftop photovoltaic system due to space constraints. Consumption monitoring revealed an average daily demand of 6982 kWh, with chillers accounting for around 67% and lighting for 33%. A rooftop photovoltaic system with a total capacity of 599 kWp was designed, comprising 1,076 modules and five inverters (total capacity of 500 kWac, DC/AC ratio = 1.2). Given Indonesia’s average irradiation of 4.5–4.8 kWh/kWp/day, the system is projected to generate 944,271 kWh per year, reflecting a capacity factor of approximately 18% [41]. This generation is predominantly assigned to utility loads, such as chillers and lighting. Given the cessation of export compensation under MEMR Regulation No. 2/2024, Table 4 presents four self-consumption (SC) scenarios (85–100%) were assessed to quantify the real contribution of photovoltaic (PV) energy to the facility’s demand.
Table 4.
Self-consumption scenarios for the 599 kWp rooftop photovoltaic system, together with their associated energy coverage and cost savings.
The financial evaluation indicated that the rooftop photovoltaic system presents substantial economic feasibility. The projected capital expenditure (CAPEX) was assessed at Rp 5.09 billion (about USD 334,000), whilst the annual operating expenditure (OPEX) totaled Rp 47.9 million (approximately USD 3140 per year). The computed Levelized Cost of Energy (LCOE) was Rp 261.40/kWh (about USD 0.016/kWh), significantly cheaper than the existing grid rate [42]. The system is anticipated to yield yearly savings of Rp 1.36 billion (about USD 89,000), leading to a return on investment (ROI) of 570% and a payback period of 3.73 years. Sensitivity analysis (Figure 11) revealed that ROI is predominantly influenced by variations in the PLN tariff, followed by capital expenditure, whilst inflation and OPEX have comparatively negligible effects.
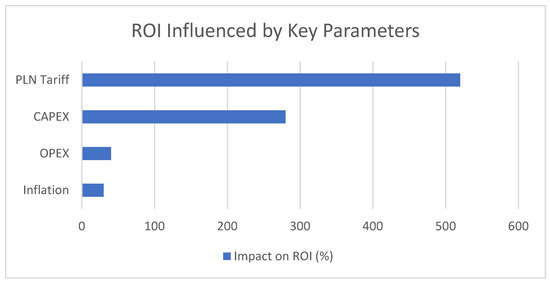
Figure 11.
Sensitivity analysis of ROI for the rooftop PV system.
The safety assessment was conducted using the Hazard Identification, Risk Assessment, and Determining Control (HIRADC) methodology [43], in accordance with the project-specific HSSE strategy developed for the rooftop PV installation. The principal hazards identified included working at height during photovoltaic module installation and maintenance, as well as lifting and rigging operations using cranes and hoists for module and inverter placement. Additional risks were electrical hazards, particularly short circuits and inverter malfunctions during commissioning and fire hazards resulting from overheated modules or damaged cable insulation. These hazards were evaluated through a risk matrix (Figure 12), where likelihood and severity determined their classification. Preliminary assessments categorized working at height and electrical hazards as high-risk activities.
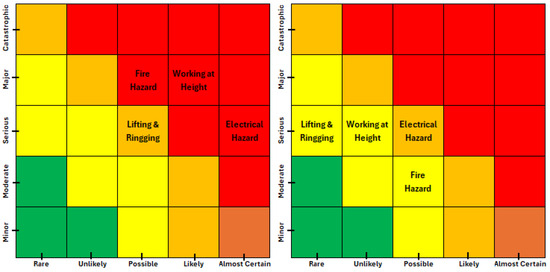
Figure 12.
Risk levels of rooftop PV installation hazards before (left) and after (right) mitigation. (Note: Green: Low Risk/Acceptable, Yellow: Moderate Risk/Tolerable with Control, Orange: Significant Risk/Requires Immediate Action, Red: High Risk/Unacceptable/Immediate Stop Work).
Mitigation measures were implemented in line with the HSSE plan. Personal Protective Equipment (PPE) included safety helmets (SNI/ANSI Z89.1), protective footwear (EN ISO 20345), full-body harnesses (EN361), safety goggles (ANSI Z87.1), and insulated gloves for electrical work [44]. Operational protocols required Job Safety Analyses (JSAs) prior to each task, the use of certified scaffolding, controlled lifting and rigging procedures, lockout–tagout (LOTO) systems for electrical operations, and permits for welding and cutting. Emergency preparedness provisions included fire extinguishers (APAR), spill kits, first aid kits, stretchers, and communication devices stationed onsite, alongside regular emergency drills and toolbox meetings. Training and competency measures ensured that all personnel underwent HSE induction and task-specific training, while specialist roles such as scaffolders, hoist operators, first aiders, and fire wardens were staffed by certified individuals.
Following the implementation of these controls, residual risk levels were reduced to medium or low, ensuring compliance with the Indonesian Occupational Safety Law (Law No. 1 of 1970), Ministry of Manpower Regulation No. 5/2018, and international standards, including ISO 45001:2018 and IEC 60364 [45].
4. Discussion
The study demonstrated that installing a 599 kWp rooftop PV system on an FMCG utility building can reduce annual grid electricity consumption by up to 37%, depending on self-consumption levels [46]. These results align with Rababah et al. [11], who observed 35% coverage in tropical factories.
Structurally, the analysis considered both flat and slightly inclined roof segments, as shown in Figure 3, where spatial orientation and inter-row spacing were optimized to minimize shading and thermal accumulation. Roof inclination angles ranged between 5° and 10° relative to the horizon, typical for industrial sheds in Indonesia. This parameter, together with row spacing (1.2 m), was factored into irradiance modeling and structural loading distribution.
The use of the PMM Ratio method ensured that axial compression and biaxial bending interactions remained below safety thresholds, consistent with standards suggested by Galvis & Smith-Pardo [21]. After reinforcement, all structures achieved a PMM < 1.0, validating safe operation even under combined loading and wind pressure conditions.
Economically, the calculated LCOE (Rp 261.40/kWh or USD 0.016) is highly competitive compared to local grid tariffs and international benchmarks [47]. The projected payback period of 3.73 years is less than the figures documented in numerous international studies [48]. For instance, Naspolini et al. (2019) reported LCOEs of USD 0.020–0.025 in Brazil, while IRENA [49] projected USD 0.018–0.021 for Southeast Asia. The achieved payback period (3.73 years) also outperforms the global average of 5–7 years in similar contexts [50], primarily due to Indonesia’s high solar irradiance and relatively low installation cost.
In contrast, research conducted in China has demonstrated quicker returns of 3–5 years, mostly attributable to economies of scale and reduced capital expenditures [51]. The swift 3.73-year payback period in the Indonesian scenario is thus deemed extremely competitive, akin to the top-performing markets. This result is influenced by three primary factors: (1) elevated solar irradiation in tropical Indonesia (4.5–4.8 kWh/kWp/day), (2) competitive local installation expenses, and (3) comparatively high grid energy pricing, which enhance the economic benefit of self-consumption.
Safety wise, findings corroborate earlier works by Seklecki et al. [52], which emphasized that rooftop PV deployment introduces high-risk activities such as electrical faults, working at height, and fire hazards. By implementing HIRA-based controls, PPE compliance, lockout–tagout, and scaffolding standards—the residual risk level was reduced to “low” or “medium,” consistent with ISO 45001:2018 and IEC 60364 requirements [53]. This aligns with other research on renewable energy construction safety, emphasizing the significance of comprehensive HSSE planning in extensive rooftop PV initiatives.
When compared to other studies, the integration of structural reinforcement, economic sensitivity analysis, and formal HSE evaluation distinguishes this research. It not only quantifies energy and cost benefits but also ensures occupational safety and structural reliability—dimensions often neglected in similar techno-economic analyses [54].
Nevertheless, this study recognizes certain limitations. The case study focuses on a single FMCG facility and does not incorporate dynamic modeling of module temperature variations due to deteriorating cooling conditions. Future research should employ computational fluid dynamics (CFD) or empirical temperature monitoring to assess this impact on module efficiency and lifespan more accurately [55].
This study has significant drawbacks. The analysis concentrated on a singular FMCG plant and may not adequately reflect other industrial environments with varying load characteristics. The lack of hourly load data limits the accuracy of self-consumption modeling; future research should use high-resolution demand profiles to enhance the temporal alignment between photovoltaic output and industrial operations [56]. Third, the study excluded hybridization with battery storage, which might further augment reliability and extend photovoltaic contributions beyond daylight hours [57]. Mitigating these constraints would yield a more thorough comprehension of the function of photovoltaic rooftop systems in ensuring energy reliability for uninterrupted industrial activity.
As shown in the comparative Table 5 and the radar diagram in Figure 13, earlier studies typically focused on either structural, techno-economic, or contextual aspects in isolation. In contrast, this work uniquely integrates structural PMM-based evaluation, comprehensive financial analysis including sensitivity scenarios, and a formal HIRA-based safety framework tailored to the FMCG sector in a tropical emerging economy. This holistic assessment distinguishes the present study and demonstrates a replicable model for safe, economically optimized, and structurally compliant industrial rooftop PV deployment.
Table 5.
Comparison of the methodology scope between prior rooftop PV studies and this study.
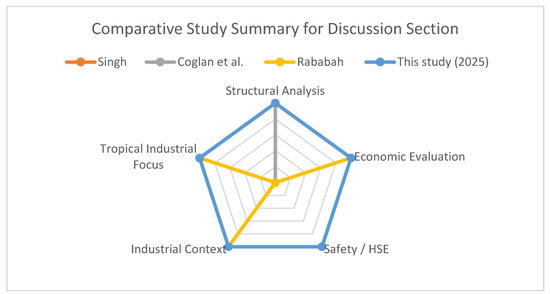
Figure 13.
Comparative analysis of the rooftop PV research scope across prior studies and this study, based on Singh [8], Rababah [11], Coglan et al. [9], and This study (2025).
5. Conclusions
This study assessed the technical, economic, and safety dimensions of incorporating a 599 kWp rooftop photovoltaic system within the utility zone of a fast-moving consumer goods business in Indonesia [58]. The results indicate that, under existing policy settings, the system can fulfill roughly 35–37% of the yearly utility electricity demand, predominantly addressing chiller and lighting loads during daylight hours [59]. The economic research validated substantial financial viability, with a Levelized Cost of Energy (LCOE) of Rp 261.40/kWh (about USD 0.016/kWh), yearly net savings above Rp 1.2 billion, and a payback duration of 3.73 years [60]. These findings are exceptionally competitive when juxtaposed with worldwide standards, demonstrating Indonesia’s advantageous solar resources, competitive installation expenses, and comparatively elevated grid pricing [61].
The safety evaluation highlighted critical hazards—working at height, lifting and rigging, electrical malfunctions, and fire hazards—and illustrated that systematic HSSE methods can mitigate residual risks to acceptable levels, assuring adherence to Indonesian and international safety standards [62].
The study demonstrates that rooftop photovoltaic systems provide a technically feasible and economically advantageous solution for decreasing energy expenses and promoting sustainability in the fast-moving consumer goods sector [63]. Spatial limitations restrict load coverage, while the lack of energy storage confines the backup capacity to daytime hours exclusively [64]. Subsequent research ought to integrate high-resolution load data and hybrid photovoltaic-battery setups to augment system reliability and support uninterrupted industrial production [65].
Supplementary Materials
The following supporting information can be downloaded at: https://www.mdpi.com/article/10.3390/en18215859/s1.
Author Contributions
Conceptualization, A.P.G. and M.K.R.; methodology, A.P.G., M.K.R. and A.N.I.W.; software, A.P.G. and A.N.I.W.; validation, M.K.R. and A.N.I.W.; formal analysis, A.P.G., M.K.R. and A.N.I.W.; investigation, A.P.G., M.K.R. and A.N.I.W.; resources, A.P.G., M.K.R. and A.N.I.W.; data curation, M.K.R. and A.N.I.W.; writing—original draft preparation, A.P.G., M.K.R. and A.N.I.W.; writing—review and editing, A.P.G., M.K.R. and A.N.I.W.; visualization, A.P.G. and A.N.I.W.; supervision, M.K.R. and A.N.I.W.; project administration, M.K.R. and A.N.I.W. All authors have read and agreed to the published version of the manuscript.
Funding
This research received no external funding.
Data Availability Statement
The original contributions presented in the study are included in the article/Supplementary Material, further inquiries can be directed to the corresponding author.
Conflicts of Interest
The authors declare that they have no conflicts of interest.
Abbreviations
The following abbreviations are used in this manuscript:
| PV | Photovoltaic |
| FMCG | Fast-Moving Consumer Goods |
| COS | Change Over Switch |
| STS | Static Transfer Switch |
| FCU | Fan Coil Unit |
| PMM | Between the axial force (P) and the bending moment (M) |
| LCOE | Levelized Cost of Energy |
| ROI | Return on Investment |
| HIRA | Hazard Identification and Risk Assessment |
| SOP | Standard Operating Procedure |
| OSH | Occupational Safety and Health |
| PPE | Personal Protective Equipment |
| DC | Direct Current |
| AC | Alternating Current |
| HIRADC | Hazard Identification, Risk Assessment, and Determining Control |
References
- International Energy Agency (IEA). Net Zero by 2050: A Roadmap for the Global Energy Sector; IEA: Paris, France, 2021; Available online: https://www.iea.org/reports/net-zero-by-2050 (accessed on 26 April 2025).
- Victoria, M.; Haegel, N.; Peters, I.M.; Sinton, R.; Jäger-Waldau, A.; del Cañizo, C.; Breyer, C.; Stocks, M.; Blakers, A.; Kaizuka, I.; et al. Solar Photovoltaics Is Ready to Power a Sustainable Future. Joule 2021, 5, 1041–1056. [Google Scholar] [CrossRef]
- Veldhuis, A.J.; Reinders, A.H.M.E. Reviewing the potential and cost-effectiveness of grid-connected solar PV in Indonesia on a provincial level. Renew. Sustain. Energy Rev. 2013, 27, 315–324. [Google Scholar] [CrossRef]
- Government of Indonesia. Presidential Regulation No. 79/2014 on National Energy Policy; Ministry of Energy and Mineral Resources: Jakarta, Indonesia, 2014; Available online: https://jdih.esdm.go.id/index.php/web/result/1819/detail (accessed on 9 May 2025).
- International Energy Agency (IEA). World Energy Balances 2022; IEA: Paris, France, 2022; Available online: https://www.iea.org/reports/world-energy-balances-overview (accessed on 20 May 2025).
- Ladha-Sabur, A.; Bakalis, S.; Fryer, P.J.; Lopez-Quiroga, E. Mapping energy consumption in food manufacturing. Trends Food Sci. Technol. 2019, 86, 270–280. [Google Scholar] [CrossRef]
- Wardle, J.M.; Fischer, A.; Tesfaye, Y.; Smith, J. Seasonal variability of resources: The unexplored adversary of biogas use in rural Ethiopia. Curr. Res. Environ. Sustain. 2021, 3, 100072. [Google Scholar] [CrossRef]
- Kumar Singh, A.; Prasath Kumar, V.R.; Krishnaraj, L. Emerging technology trends in the C&I rooftop solar market in India: Case study on datacentre–Retrofit with BIPV by U-Solar. Solar Energy 2022, 238, 203–215. [Google Scholar] [CrossRef]
- Coglan, J.; Gharineiat, Z.; Kurdi, F.T. Automatic Rooftop Solar Panel Recognition from UAV LiDAR Data Using Deep Learning and Geometric Feature Analysis. Remote Sens. 2025, 17, 3389. [Google Scholar] [CrossRef]
- Rigo, P.D.; Siluk, J.C.M.; Lacerda, D.P.; Rediske, G.; Rosa, C.B. The competitiveness factors of photovoltaic installers companies and a BSC model. Solar Energy 2022, 235, 36–49. [Google Scholar] [CrossRef]
- Rababah, H.E.; Ghazali, A.; Isa, M.H.M. Building Integrated Photovoltaic (BIPV) in Southeast Asian Countries: Review of Effects and Challenges. Sustainability 2021, 13, 12952. [Google Scholar] [CrossRef]
- IEC 31010:2019; Risk Management—Risk Assessment Techniques. IEC: Geneva, Switzerland, 2019. Available online: https://www.iso.org/standard/72140.html (accessed on 2 June 2025).
- Ghaleb, B.; Asif, M. Application of solar PV in commercial buildings: Utilizability of rooftops. Energy Build. 2022, 257, 111774. [Google Scholar] [CrossRef]
- Galvis, F.A.; Smith-Pardo, J. Axial load biaxial moment interaction (PMM) diagrams for shallow foundations: Design aids, experimental verification, and examples. Eng. Struct. 2020, 213, 110582. [Google Scholar] [CrossRef]
- Neumüller, A.; Geier, S.; Österreicher, D. Life Cycle Assessment for Photovoltaic Structures—Comparative Study of Rooftop and Free-Field PV Applications. Sustainability 2023, 15, 13692. [Google Scholar] [CrossRef]
- Ndwali, K.; Njiri, J.G.; Wanjiru, E.M. Multi-objective optimal sizing of grid connected photovoltaic batteryless system minimizing the total life cycle cost and the grid energy. Renew. Energy 2020, 148, 1256–1265. [Google Scholar] [CrossRef]
- Predescu, D.-M.; Roșu, Ș.-G. Solid State Transformers: A Review—Part I: Stages of Conversion and Topologies. Technologies 2025, 13, 74. [Google Scholar] [CrossRef]
- Mah, D.N.; Wang, G.; Lo, K.; Leung, M.K.H.; Hills, P.; Lo, A.Y. Barriers and policy enablers for solar photovoltaics (PV) in cities: Perspectives of potential adopters in Hong Kong. Renew. Sustain. Energy Rev. 2018, 92, 921–936. [Google Scholar] [CrossRef]
- Brown, M.A.; Hubbs, J.; Gu, V.X.; Cha, M.-K. Rooftop Solar for All: Closing the Gap Between the Technically Possible and the Achievable. Energy Res. Soc. Sci. 2021, 80, 102203. [Google Scholar] [CrossRef]
- Yao, H.; Zhou, Q. Research status and application of rooftop photovoltaic generation systems. Clean. Energy Syst. 2023, 5, 100065. [Google Scholar] [CrossRef]
- Zheng, J.; Huang, Y.; Qu, Z. Proper interpretation of sectional analysis results. Earthquake Res. Adv. 2024, 4, 100238. [Google Scholar] [CrossRef]
- Computers and Structures Inc. SAP2000 Integrated Software for Structural Analysis and Design, Version 23; CSI: Berkeley, CA, USA, 2021; Available online: https://www.csiamerica.com/products/sap2000 (accessed on 13 June 2025).
- Nugroho, W.O.; Sagara, A.; Imran, I. The evolution of Indonesian seismic and concrete building codes: From the past to the present. Structures 2022, 41, 1092–1108. [Google Scholar] [CrossRef]
- Pinheiro, M.G.; Madeira, S.C.; Francisco, A.P. Short-term electricity load forecasting—A systematic approach from system level to secondary substations. Appl. Energy 2023, 332, 120493. [Google Scholar] [CrossRef]
- Alexander, S.A. Development of solar photovoltaic inverter with reduced harmonic distortions suitable for Indian sub-continent. Renew. Sustain. Energy Rev. 2016, 56, 694–704. [Google Scholar] [CrossRef]
- Cucchiella, F.; D’Adamo, I.; Gastaldi, M. Economic Analysis of a Photovoltaic System: A Resource for Residential Households. Energies 2017, 10, 814. [Google Scholar] [CrossRef]
- Aghaei, M.; Fairbrother, A.; Gok, A.; Ahmad, S.; Kazim, S.; Lobato, K.; Oreski, G.; Reinders, A.; Schmitz, J.; Theelen, M.; et al. Review of degradation and failure phenomena in photovoltaic modules. Renew. Sustain. Energy Rev. 2022, 159, 112160. [Google Scholar] [CrossRef]
- Langer, J.; Kwee, Z.; Zhou, Y.; Isabella, O.; Ashqar, Z.; Quist, J.; Praktiknjo, A.; Blok, K. Geospatial analysis of Indonesia’s bankable utility-scale solar PV potential using elements of project finance. Energy 2023, 283, 128555. [Google Scholar] [CrossRef]
- Sunaryo; Hamka, M.A. Safety Risks Assessment on Container Terminal Using Hazard Identification and Risk Assessment and Fault Tree Analysis Methods. Procedia Eng. 2017, 194, 307–314. [Google Scholar] [CrossRef]
- Duroha, J.C.; Macht, G.A. Solar installation occupational risks: A systematic review. Saf. Sci. 2023, 160, 106048. [Google Scholar] [CrossRef]
- Wang, Y.; Li, X.; Ban, Y.; Ma, X.; Hao, C.; Zhou, J.; Cai, H. A DC Arc Fault Detection Method Based on AR Model for Photovoltaic Systems. Appl. Sci. 2022, 12, 10379. [Google Scholar] [CrossRef]
- Government of Indonesia. Law No. 30/2007 on Energy; Ministry of Energy and Mineral Resources: Jakarta, Indonesia, 2007; Available online: https://jdih.esdm.go.id (accessed on 2 July 2025).
- Mincigrucci, L.; Civera, M.; Lenticchia, E.; Ceravolo, R.; Rosano, M.; Russo, S. Comparative Structural Analysis of GFRP, Reinforced Concrete, and Steel Frames under Seismic Loads. Materials 2023, 16, 4908. [Google Scholar] [CrossRef]
- Maidi, M.; Shufrin, I. Evaluation of Existing Reinforced Concrete Buildings for Seismic Retrofit through External Stiffening: Limit Displacement Method. Buildings 2024, 14, 2781. [Google Scholar] [CrossRef]
- ASCE. Structural Condition Assessment of Existing Buildings. ASCE Manuals and Reports on Engineering Practice No. 158. American Society of Civil Engineers. 2024. Available online: https://ascelibrary.org/doi/epdf/10.1061/9780784485422.fm (accessed on 5 July 2025).
- Mokhtari, M.; Islam, A.; Imanpour, A. Comparison of the Seismic Performance of Steel Moment-Resisting Frames and Moment-Resisting Knee Braced Frames. In Proceedings of the Canadian Society of Civil Engineering Annual Conference 2021; Lecture Notes in Civil Engineering; Springer : Berlin/Heidelberg, Germany, 2022; Volume 240, Available online: https://link.springer.com/chapter/10.1007/978-981-19-0507-0_25 (accessed on 3 May 2025).
- Lazaroiu, A.C.; Osman, M.G.; Strejoiu, C.V.; Lazaroiu, G. A Comprehensive Overview of Photovoltaic Technologies and Their Efficiency for Climate Neutrality. Sustainability 2023, 15, 16297. [Google Scholar] [CrossRef]
- Zdyb, A.; Sobczyński, D. An Assessment of a Photovoltaic System’s Performance Based on the Measurements of Electric Parameters under Changing External Conditions. Energies 2024, 17, 2197. [Google Scholar] [CrossRef]
- Thanikanti, S.B.; Yousri, D.; Allam, D.; Etebia, M.B.; Balasubramanian, K. Converter/Inverter Topologies for Standalone and Grid-Connected PV Systems. In Renewable Energy and Future Power Systems; Springer: Berlin/Heidelberg, Germany, 2021; pp. 35–80. Available online: https://link.springer.com/chapter/10.1007/978-981-33-6753-1_2 (accessed on 28 May 2025).
- Díaz-Bello, D.; Vargas-Salgado, C.; Águila-León, J.; Lara-Vargas, F. Methodology to Estimate the Impact of the DC to AC Power Ratio, Azimuth, and Slope on Clipping Losses of Solar Photovoltaic Inverters: Application to a PV System Located in Valencia, Spain. Sustainability 2023, 15, 2797. [Google Scholar] [CrossRef]
- Silalahi, D.F.; Blakers, A.; Stocks, M.; Lu, B.; Cheng, C.; Hayes, L. Indonesia’s Vast Solar Energy Potential. Energies 2021, 14, 5424. [Google Scholar] [CrossRef]
- Ludin, N.A.; Affandi, N.A.A.; Purvis-Roberts, K.; Ahmad, A.; Ibrahim, M.A.; Sopian, K.; Jusoh, S. Environmental Impact and Levelised Cost of Energy Analysis of Solar Photovoltaic Systems in Selected Asia Pacific Region: A Cradle-to-Grave Approach. Sustainability 2021, 13, 396. [Google Scholar] [CrossRef]
- Kamenopoulos, S.N.; Tsoutsos, T. Assessment of the safe operation and maintenance of photovoltaic systems. Energy 2015, 93, 1633–1638. [Google Scholar] [CrossRef]
- Kineber, A.F.; Antwi-Afari, M.F.; Elghaish, F.; Zamil, A.M.A.; Alhusban, M.; Qaralleh, T.J.O. Benefits of Implementing Occupational Health and Safety Management Systems for the Sustainable Construction Industry: A Systematic Literature Review. Sustainability 2023, 15, 12697. [Google Scholar] [CrossRef]
- Marhavilas, P.K.; Pliaki, F.; Koulouriotis, D. International Management System Standards Related to Occupational Safety and Health: An Updated Literature Survey. Sustainability 2022, 14, 13282. [Google Scholar] [CrossRef]
- Başaran, K.; Özdemir, M.T.; Bayrak, G. Sizing and Techno-Economic Analysis of Utility-Scale PV Systems with Energy Storage Systems in Factory Buildings: An Application Study. Appl. Sci. 2025, 15, 3876. [Google Scholar] [CrossRef]
- Cristea, M.; Cristea, C.; Tîrnovan, R.-A.; Șerban, F.M. Levelized Cost of Energy (LCOE) of Different Photovoltaic Technologies. Appl. Sci. 2025, 15, 6710. [Google Scholar] [CrossRef]
- Carvalho, J.P.; Lopes, E.B.; Santos, J.B.; Monteiro, J.; Cabrita, C.; Pacheco, A. Comparative Viability of Photovoltaic Investments Across European Countries Using Payback Periods and the Levelized Cost of Energy. Energies 2025, 18, 4676. [Google Scholar] [CrossRef]
- Naspolini, H.F.; Rüther, R. Impacts of the active power demand measurement-time resolution on the financial attractiveness of domestic solar hot water systems. Renew. Energy 2019, 139, 336–345. [Google Scholar] [CrossRef]
- IRENA (2024). Renewable Power Generation Costs in 2023. International Renewable Energy Agency. Available online: https://www.irena.org/Publications/2024/Sep/Renewable-Power-Generation-Costs-in-2023 (accessed on 7 June 2025).
- Pu, Y.; Wang, P.; Wang, Y.; Qiao, W.; Wang, L.; Zhang, Y. Environmental effects evaluation of photovoltaic power industry in China on life cycle assessment. J. Clean. Prod. 2021, 278, 123993. [Google Scholar] [CrossRef]
- Seklecki, K.; Olesz, M.; Adamowicz, M.; Nowak, M.; Litzbarski, L.S.; Balcarek, K.; Grochowski, J. A Comprehensive System for Protection of Photovoltaic Installations in Normal and Emergency Conditions. Energies 2025, 18, 1749. [Google Scholar] [CrossRef]
- Almaskati, D.; Kermanshachi, S.; Pamidimukkala, A.; Loganathan, K.; Yin, Z. A Review on Construction Safety: Hazards, Mitigation Strategies, and Impacted Sectors. Buildings 2024, 14, 526. [Google Scholar] [CrossRef]
- Shahverdian, M.H.; Najaftomaraei, M.; Chimeh, A.F.; Yavarzadeh, N.; Sohani, A.; Javadijam, R.; Sayyaadi, H. Towards Zero-Energy Buildings: A Comparative Techno-Economic and Environmental Analysis of Rooftop PV and BIPV Systems. Buildings 2025, 15, 999. [Google Scholar] [CrossRef]
- Tu, R.; Guo, Z.; Liu, L.; Wang, S.; Yang, X. Reviews of Photovoltaic and Energy Storage Systems in Buildings for Sustainable Power Generation and Utilization from Perspectives of System Integration and Optimization. Energies 2025, 18, 2683. [Google Scholar] [CrossRef]
- Ciocia, A.; Amato, A.; Di Leo, P.; Fichera, S.; Malgaroli, G.; Spertino, F.; Tzanova, S. Self-Consumption and Self-Sufficiency in Photovoltaic Systems: Effect of Grid Limitation and Storage Installation. Energies 2021, 14, 1591. [Google Scholar] [CrossRef]
- Migliari, L.; Cocco, D.; Petrollese, M. Levelized Cost of Storage (LCOS) of Battery Energy Storage Systems (BESS) Deployed for Photovoltaic Curtailment Mitigation. Energies 2025, 18, 3602. [Google Scholar] [CrossRef]
- Hamzaoğlu, A.; Erduman, A.; Kırçay, A. Deep Learning-Based Rooftop PV Detection and Techno Economic Feasibility for Sustainable Urban Energy Planning. Sustainability 2025, 17, 6853. [Google Scholar] [CrossRef]
- Deshmukh, R.; Wang, L.; Kammen, D.M. Geospatial and techno-economic analysis of wind and solar co-location potential to meet electricity demand. Renew. Energy 2019, 136, 253–267. [Google Scholar] [CrossRef]
- Pramadya, F.A.; Kim, K.N. Promoting residential rooftop solar photovoltaics in Indonesia: Net-metering or installation incentives? Renew. Energy 2024, 222, 119901. [Google Scholar] [CrossRef]
- Pambudi, N.A.; Ulfa, D.K.; Nanda, I.R.; Gandidi, I.M.; Wiyono, A.; Biddinika, M.K.; Rudiyanto, B.; Saw, L.H. The Future of Wind Power Plants in Indonesia: Potential, Challenges, and Policies. Sustainability 2025, 17, 1312. [Google Scholar] [CrossRef]
- Patil, R.B.; Khalkar, A.; Al-Dahidi, S.; Pimpalkar, R.S.; Bhandari, S.; Pecht, M. A Reliability and Risk Assessment of Solar Photovoltaic Panels Using a Failure Mode and Effects Analysis Approach: A Case Study. Sustainability 2024, 16, 4183. [Google Scholar] [CrossRef]
- Lee, B.; Trčka, M.; Hensen, J.L.M. Rooftop photovoltaic (PV) systems for industrial halls: Achieving economic benefit via lowering energy demand. Front. Archit. Res. 2012, 1, 326–333. [Google Scholar] [CrossRef]
- Fakhraian, E.; Alier, M.; Valls Dalmau, F.; Nameni, A.; Casañ Guerrero, M.J. The Urban Rooftop Photovoltaic Potential Determination. Sustainability 2021, 13, 7447. [Google Scholar] [CrossRef]
- Luthander, R.; Widén, J.; Nilsson, D.; Palm, J. Photovoltaic self-consumption in buildings: A review. Appl. Energy 2015, 142, 80–94. [Google Scholar] [CrossRef]


Disclaimer/Publisher’s Note: The statements, opinions and data contained in all publications are solely those of the individual author(s) and contributor(s) and not of MDPI and/or the editor(s). MDPI and/or the editor(s) disclaim responsibility for any injury to people or property resulting from any ideas, methods, instructions or products referred to in the content. |
© 2025 by the authors. Licensee MDPI, Basel, Switzerland. This article is an open access article distributed under the terms and conditions of the Creative Commons Attribution (CC BY) license (https://creativecommons.org/licenses/by/4.0/).