Abstract
Energy security is a growing societal and industrial concern that leads research and development toward more sustainable options. Biogas, a bio-alternative to conventional fuels, is a product generated from the anaerobic digestion of organic matter. This source of fuel production is more environmentally friendly compared to traditional fossil fuels, leading to a lower carbon footprint, higher air quality, and the promotion of a circular economy. Impurities of raw biogas, such as carbon dioxide, hydrogen sulfide, and other trace contaminants, make biogas conditioning necessary for most applications. In addition, biogas upgrading, technologies furthering biogas purity, is an important factor in the production of biomethane, a sustainable biofuel known more commonly as renewable natural gas (RNG). Diversifying fuel sources and providing energy sustainability while mitigating negative environmental effects makes RNG an attractive alternative to conventional natural gas. This document, Part I, provides an overview of current technologies related to biogas conditioning, such as sorption, oxidation, and biological treatments aimed at the removal of a wide variety of contaminants. Processes developed for biogas upgrading are also discussed, including physical/chemical absorption, pressure swing adsorption, and membrane separation. The focus of upgrading applies approaches in meeting a higher quality biofuel by further carbon dioxide exclusion to ease pipeline transport and increase combustion efficiency. These technologies present the core foundation of processes in the production of RNG; however, all face inherent challenges that deem further research and development a requirement for global adoption. The biggest challenges are either in the cost of reaching higher purities or the inability to do so without other operations. Thus, in conjunction with this document, emerging and developing technologies are provided in a separate analysis deemed Part II. Together, these documents offer a comprehensive understanding of current practices and growing technological developments.
1. Introduction
Biogas is an attractive renewable energy resource derived from biological raw feedstocks for a carbon-emission-restricted future. It can reduce the world demand for fossil fuel-based natural gas and mitigate the accumulation of greenhouse gases in the atmosphere. Projections to 2050 established in the 2022 Annual Energy Outlook by the Energy Information Administration (EIA) of the USA natural gas production will grow steadily at about a 0.9% rate through the coming years [1]. Natural gas exports and industrial applications drive the current production of natural gas [2]. Additionally, carbon dioxide (CO2) emissions related to the energy used by the industrial sector are forecast to grow, showing a 0.6% per year increase from 2017 to 2050 in the USA. The EIA also states that natural gas generates most of the energy and CO2 emissions in the industrial sector during the entire projection period [1]. In fact, the EIA predicts that natural gas-fueled power plants will be, by far, the largest source of electricity within the USA for many years to come, with the use of coal steadily decreasing over time. Currently, electrical power generation is the largest sector contributing to natural gas consumption due to its use as a feedstock in various chemical processes. Due to the demand and considerable benefits, renewable natural gas (RNG) as an additional source or an alternative to natural gas is growing in appeal in global energy markets. An advantage of RNG is its cleaner production, and with costs expected to continue decreasing with further development, RNG can be a promising and more attractive option for industrial processes. Research into biogas production, conditioning, and use will also continue to increase over the coming years. Figure 1 shows an analysis of publications and topics collated from the Web of Science database on “Renewable Natural Gas” from 2014 to 2023. Total yearly publications in RNG research increased from roughly 546 to over 2100 from 2014 to 2023. This trend in publication production shows higher interest in the topic and can be directly correlated to increased energy sustainability efforts and technological advancements. Analysis of citation topics provides the highest discussion of RNG production in the fields of sustainable sciences, energy and fuels, power systems, and electric vehicles. The diversity of applications within the vast research areas of RNG incites further investment into growing generative technologies on a global scale.
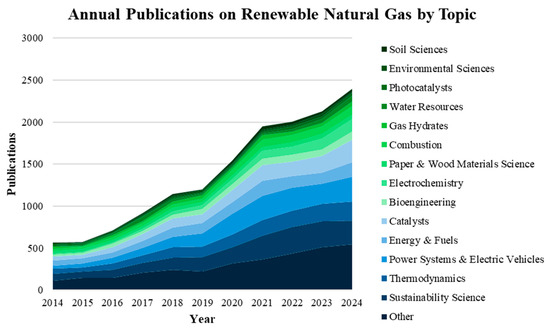
Figure 1.
Annual Publications on Renewable Natural Gas by Topic collated from Web of Science (2014–2023).
Biogas is a gaseous product generated from the complete anaerobic digestion of organic materials. Most biogas produced for use as fuel is generated within artificially constructed anaerobic digesters or landfills. These can be designed using various reactor systems with the resulting product labeled biogas. The majority of biogas produced by volume is primarily composed of methane (CH4) and carbon dioxide in the range of 40–75% and 25–60%, respectively. A recent trend has been upgrading biogas into a fuel gas product with at least 90% methane through some form of conditioning or removal of CO2; albeit, for over ten years, this has been a goal of many government agencies [2]. More recently, upgraded biogas is beginning to be utilized on a larger scale. The upgraded product is commonly referred to as “RNG”, “sustainable natural gas”, or “biomethane” with RNG being the most commonly used term [2]. These conversions aim to position biogas as energetically similar to fossil fuel natural gas while capturing renewable fuel funding incentives. Within the USA, RNG is considered by the Environmental Protection Agency (EPA) as a “cellulosic biofuel” under its Renewable Fuels requirements set by its Renewable Fuels Standard portfolio [3,4]. Because of its ease of production, RNG has become the most common alternative to conventional fuel used within the USA, meeting EPA goals (i.e., volume targets, 60% lifecycle greenhouse gas reduction, etc.) [4]. The usage of RNG is expected to increase over the coming years. In 2025, the coupling of the Inflation Reduction Act of 2022 and the One Big Beautiful Bill of 2025, the IRS Tax Code 45V was refined to provide staggered tax credit incentives for the use of RNG to serve as a viable feedstock into the production of clean hydrogen [5]. This amended tax code will opened up new opportunities and markets for RNG for use in the production of clean hydrogen, particularly, RNG converted into hydrogen via several similar commercialized processes such as steam methane reforming and autothermal reforming [6]. Hence, there is an envisioned expansion of RNG markets as clean hydrogen production increases across the USA stimulated by the 45V tax credits.
It is envisioned that by 2050, RNG will be produced as a truly renewable source of methane, applying new and updated technologies from all types of organic wastes, by-products, and other renewable raw materials. RNG derived from biogas will likely provide the green component of the natural gas fuel mixture distributed throughout the European gas network along with increased usage within the USA. This gas will be used to generate electricity, provide heating and refrigeration, and even serve as a biofuel in the transportation sector. The European Biogas Association (EBA) suggested that by 2030 the goal for biogas production could reach 35 billion cubic meters per year in Europe, or about 10 percent of the European Union’s (EU) natural gas consumption [7,8].
Considering these projections and advances in biogas improvement technologies it is necessary to highlight several available technologies for biogas conditioning and upgrading that hold reasonable promise for large-scale application.
Thus, the objectives of this work are:
- Describe biogas, natural gas compositions, and the standard requirements for RNG in five European countries and the USA.
- Describe conditioning methods for typical contaminants present in the biogas matrix that yield higher methane compositions.
- Details on technology options for biogas upgrading that are currently being utilized.
- Discuss case studies and process designs.
As a product that can be an alternative to fossil fuel-based natural gas, biogas provides an attractive renewable energy source, creates local industry, reduces dependence on foreign gas imports, and decreases adverse environmental impacts. This information is intended to emphasize activities regarding biogas production, conditioning, and upgrading while also providing some basis for transitioning toward increasing global use.
2. Composition: Natural Gas and Biomethane
As outlined in Section 1, biogas is an important product of the anaerobic digestion of organic substrates. It is mainly composed of methane, carbon dioxide, and trace compounds like water vapor, hydrogen sulfide, oxygen, nitrogen, ammonium, siloxanes, hydrocarbons, and particles.
The methane content of biogas, and therefore the performance, depends on a wide variety of factors with varying levels of control [9,10,11,12,13]. Most commonly, the contributing factors are the following:
- Type of substrate material used.
- Concentrations of carbon contained in each substrate (see Table 1).
 Table 1. Biogas Yield and Methane Content for Different Groups of Substances [10,11].
 - Weather conditions.
- The location of gas production.
- Type of technology used for production.
- Process conditions (Temperature, Residence Time, etc.).
Currently, the energy potential from biogas is being used on increasing scales; countries like Poland, the United Kingdom, Sweden, France, and Germany are taking advantage of this energy source. The last three (Sweden, France, and Germany) were among the most developed countries for electricity production and the three leading countries in European RNG production in 2016 [14]. The USA is falling behind other countries in its adoption of RNG as a realistic commercial fuel. The quality of biogas can vary significantly by country, as seen in Table 2. Natural Gas quality is shown in Table 3 for comparison. The quality of RNG is increased through two main steps:
- A conditioning process where trace components like water vapor, hydrogen sulfide, oxygen, nitrogen, ammonium, siloxanes, halogenated hydrocarbons, and particles are removed.
- An upgrading process to yield biogas containing the typical values of natural gas.
Table 2.
Raw Biogas Composition in Different Countries.
Table 2.
Raw Biogas Composition in Different Countries.
| Biogas Component | Units | Poland [15,16] | United Kingdom a [17,18,19] | Germany a,b [16,17,18,19] | France b [17,18,19] | Sweden b [18] | United States [20,21,22] |
|---|---|---|---|---|---|---|---|
| Methane | v/v% | 63.4 ± 1.1 | 50–70 | 54.4 ± 0.9 | 50–75 | 65 | 50–70 |
| v/v% | 60.2–67.7 | 60–70 | 53–70 | 60 | |||
| v/v% | 53–70 | ||||||
| Other Hydrocarbons c | mg/Nm3 | 0–200 | Trace | ||||
| Hydrogen | v/v% | <1 | Trace | ||||
| Carbon Dioxide | v/v% | 36.6 ± 1.0 | 25–45 | 45.5 ± 0.8 | 25–45 | 35 | 25–50 |
| v/v% | 32.2–39.5 | 30–47 | 30–47 | 36 | |||
| v/v% | <2 | <2 | |||||
| Nitrogen | v/v% | 0.003–0.525 | 0–3 | 0.1 ± 0.1 | 0–3 | 0.2 | 0–5 |
| Oxygen | v/v% | 0–0.083 | <2 | Trace | |||
| v/v% | 0–1 | Trace | |||||
| Hydrogen Sulfide | ppmv | <1000 | <1000 | 0–7500 | |||
| ppmv | 0–194 | <500 | 16.0 ± 0.7 | <500 | <500 | 1000–1400 | |
| Ammonium | ppmv | 0–0.84 | <1 | 3.6 ± 1.0 | <1 | 100 | 0–500 |
| ppmv | 100 | 100 | |||||
| Min. Heating Valve | Btu/ft3 | 564 | 893 | ||||
| Btu/ft3 | 617 | ||||||
| Water | v/v% | 2–7 d | 1–5 | ||||
| v/v% | 5–10 | ||||||
| Chlorine | ppmv | 0–40 | 0–5 | ||||
| Fluorine | ppmv | 0–5 | |||||
| Siloxane | mg/Nm3 | 0–41 |
a Most Developed Electricity Generation, 2016. b Most Developed Biomethane Generation, 2016. c C2 through C5 n and i hydrocarbons. d Measured throughout the temperature range of 20–40 °C.
Table 3.
Natural Gas Composition.
Table 3.
Natural Gas Composition.
| Biogas Component | Units | Wet a | Dry a | United Kingdom | Germany [11,23] | France [11] | Sweden [11] | United States [24,25,26] |
|---|---|---|---|---|---|---|---|---|
| Methane | v/v% | 84.6 | 96 | ≥70 | 87.0–97.0 | |||
| Other Hydrocarbons | v/v% | 0.1–6.4 | 0.06–2 | 0 | 0–9.0 | |||
| Hydrogen | v/v% | 0–0.02 | ||||||
| Carbon Dioxide | v/v% | <5 | <5 | 0–1.8 | <5 | 2.5 | 3 | 0.05–1.0 |
| Nitrogen | v/v% | <10 | <10 | <10 | 0.2–5.5 | |||
| Oxygen | v/v% | 0–0.2 | 3 | 1 | 1 | 0–0.1 | ||
| Hydrogen Sulfide | ppmv | <5 | <5 | 5 | <6.5 | 5 | 10 | 0.0055 |
| Ammonium | ppmv | 3 | 20 | |||||
| Min. Heating Valve | Btu/ft3 | 1047 | 1047 | 37–47 | 36.0–45.72 | 38.5–46.1 H | 39.6–43.2 | 36.0–40.2 |
| Btu/ft3 | 30.2–47.2 | 34.2–37.7 L | ||||||
| Water | mg/Nm3 | <32 | 16–32 |
a Typical Composition [17,27]. H High Quality Gas. L Low Quality Gas.
Many contaminant compounds removed during the conditioning process can cause corrosion and mechanical wear in equipment. For this reason, RNG is almost always treated in a conditioning process, while upgrading depends on the initial gas quality and desired end use. Usually, conditioning is performed to meet standards to allow for RNG injection into the natural gas network or as fuel for power generation or vehicles. Table 4 shows some of these standard requirements [13].
Table 4.
Standard Requirements for Renewable Natural Gas by Country.
3. Conditioning of Typical Contaminants
Biogas is produced from a wide variety of sources, and each can bring unique challenges to the utilization of the resulting product gas. Table 5 shows common contaminants found in biogas as well as the major benefits of their removal. This section deals with technologies that remove and/or reduce these contaminants in preparation for direct end use or further upgrading. In contrast to chemical species covered here, carbon dioxide reduces the heating value of biogas but does not otherwise affect its chemical compatibility or reactivity. Removal of CO2 by current methods is therefore covered separately in Section 4.
Table 5.
Benefits of Contaminant Removal from Biogas.
3.1. Water Removal
When biogas is saturated with water vapor flows through a pipe, water condenses and accumulates inside the pipeline, reducing available space for the proper flow of biogas. This biphasic flow of gas–liquid mixtures creates an unstable system and decreases total gas flow. In addition, condensate water and biogas-sourced impurities cause corrosion and clogging of metal pipes, making frequent conditioning a necessity. The removal of water is of concern in many industrial processes and allows for the repurposing of technology from other sectors. All of the water removal methods listed here work more efficiently at low temperatures and elevated pressures.
3.1.1. Condensate Traps
Liquid water can be separated from biogas by increasing pressure and reducing temperature to condense water vapor. This technology is best suited for bulk removal and leaves trace amounts of residual water behind, but it is a cheap and effective first step. If total water vapor elimination is desired, the biogas can then be treated with further cooling, compression, absorption, and adsorption processes.
3.1.2. Absorption and Adsorption
Contacting biogas with a liquid that exhibits a high affinity for water and a low affinity for methane can absorb water out of the gas phase. Absorption is commonly performed in a counter-current liquid–vapor contactor where a liquid phase, such as glycol, falls down through biogas as water vapor rises to the top. The water vapor is then absorbed into the liquid phase and exits the apparatus, where it can be regenerated for reuse.Contacting biogas with a solid that traps water vapor via chemical or physical interaction is known as adsorption. Gas is pushed through a pipe or bed where water is trapped on the surface of a chosen adsorbent allowing dewatered gas to exit the process. Unlike absorption, adsorption equipment can be mounted in any orientation and does not require liquid handling. Silicon dioxide, aluminum oxide (alumina), activated coal, hygroscopic salts, and molecular sieves are commonly used adsorbents in industrial processes. The absorption and adsorption materials can be regenerated by increasing the temperature or lowering the pressure [10,13,29].
3.2. Hydrogen Sulfide Removal
Hydrogen sulfide (H2S) is an extremely toxic and flammable gas, harmful to human health and the environment. The Occupational Safety and Health Administration (OSHA) limits long-term exposure to 20 ppm of H2S during an 8 h shift, with 100 ppm listed as immediately threatening to life and health [30]. It is commonly found in anaerobic digesters resulting from a microbiological reduction of sulfur-containing compounds (peptides, amino acids, etc.). The concentration of H2S gas can be reduced within the biogas reactor by precipitation within the liquid of the digester. Biogas can be de-sulfured using multiple processes, including physical, chemical, and biological sulfate reduction. Removal limits are normally dependent on application, examples of which can include: 100 ppm concentration for internal combustion engines, 3–4 ppm for most applications as a substitute for natural gas applications, and less than 1 ppm for gas grid injection and transport [31]. Selection of the best process for each digester depends on gas composition, the H2S levels to be treated, and the mass flow of treated gas [10,29,32,33].
3.2.1. Precipitation
When absorbed into water, hydrogen sulfide disassociates into ions, as seen in Equations (1) and (2). One proven method of H2S removal is treatment with compounds that disassociate into iron ions, such as ferrous and ferric chloride (Fe2+ & Fe3+). These react with sulfide ions to precipitate iron sulfide, shown in Equations (3) and (4), thus removing it from the digester before it can be released as a gas. This process is mainly used when hydrogen sulfide concentrations in the biogas are high, often 1000 ppm or higher [10,34].
3.2.2. Adsorption Technologies
Similarly to water vapor removal, the adsorption of hydrogen sulfide gas onto solid substrates removes the H2S from biogas. The use of granular activated carbon (GAC) and iron oxide as adsorbents is effective, operationally simple, and has a long history of implementation in industry. As demonstrated in Equation (5), iron oxide reacts with hydrogen sulfide to produce ferric sulfide. However, these adsorbents are generally suited for treating lower concentrations of H2S (<300 ppm) and mostly operated as a batch process due to the spent bed requiring regeneration for continuous processes [35]. Treating a 100 L per minute gas stream with 300 ppm H2S would have an estimated annual media cost of $59 for iron sponge units, $272 for GAC, and $590 for activated carbon [36]. Further, the spent adsorbent can be regenerated by treatment with oxygen but only recovers about 60% of the original removal capacity [37].
Activated carbon can treat significantly higher levels of H2S but at a substantial increase in cost. For example, reference studies on a hog farm treated hydrogen sulfide at 2400 ppm over a projected installation lifetime. The economic analysis revealed that activated carbon usage caused an increase in the payback period from 4.3 to 7.9 years versus the baseline option [38]. While regeneration of activated carbon is possible, the recovery is poor. Coppola & Papurello (2018) used data from a municipal wastewater treatment plant and found their maximum activated carbon regeneration to be 30% [39]. The calculated savings in this case study equated to 16% over the projected 4-year lifetime. Without increases in adsorption capacity, higher regeneration limits, or lowered cost, activated carbon is generally inferior to iron oxide in small biogas operations [40].
One removal method commonly under consideration is the use of low-cost alternative adsorbents produced from natural materials such as wood, peat, coal, lignite, or agricultural waste [41,42]. Domestic and industrial waste treatment operations by-products such as slag, sludge, and other solid wastes have also been considered [43]. As seen in Table 6 these low-cost alternatives have significantly lower surface areas and a correspondingly small adsorption capacity versus commercially produced GAC. Enhancing adsorption capacity by chemically conditioning the material is one way to increase economic value. The carbon in these alternatives can be doped with catalysts by the addition of permanganate reactive species, potassium iodide, potassium carbonate, zinc oxide, sodium hydroxide, or ferric oxide, increasing reaction kinetics, total adsorption capacity, and sulfide-reduction [44]. Even though carbon impregnated with zinc oxide is expensive, it effectively removes hydrogen sulfide at concentrations higher than 1 ppm [10,42,45]. Makaruk et al. used water hyacinth biomass modified via carbonization and achieved H2S removal of 31.85 g per 100 g of biomass [46].
Table 6.
Surface Area of Various Adsorbents [41,43].
3.2.3. Photocatalytic Oxidation
Another alternative method for desulfurization is photocatalytic oxidation. Xiaoyan Hao et al. found promising results by using zeolite/TiO2 granules within a photocatalytic reactor, achieving an H2S removal rate of 98.1%. However, this process contained issues with the regeneration of the oxidizing granules due to performance depletion [47]. Jung-Jeng Su et al. proposed a photocatalytic biogas desulfurizing reactor system that oxidizes biogas with TiO2-coated clay aggregate carriers in conjunction with U.V. irradiation [48]. A proposed mechanism for converting H2S to SO2 is below in Equations (6)–(11).
All experimental results from this study provided >99% removal of H2S from biogas in the presence of sufficient oxygen. However, at H2S concentrations higher than 836 mg/m3, oxidation of H2S on the surface of TiO2 and the lightweight expanded clay aggregate was hindered due to sulfate absorbance [48]. Costs associated with this technology are low in installation, operation, and maintenance compared with conventional methods [47,48]. This process negates expensive or timely carrier or sorbent replacement.
3.2.4. Chemical Absorption
Several commercial processes use chemical absorption to remove hydrogen sulfide from raw biogas. One of the most established systems handling large volumes and high concentrations of H2S is washing with sodium hydroxide solutions (NaOH) [49]. However, it has drawbacks in biogas use due to the high carbon dioxide content interfering with and consuming hydroxide reagents more rapidly. Other forms of absorption may be utilized, such as chelating solutions with iron/ethylenediaminetetraecetic acid (EDTA), which converts the hydrogen sulfide into elemental sulfur [50]. These processes can eliminate up to 2000 ppm of hydrogen sulfide of the gas at 40 °C, atmospheric pressure, and with a capacity of 1000 Nm3 of crude gas per hour. When the absorbent material becomes saturated, it is necessary to regenerate or replace it. An important point is the recovery and reuse of the spent material. For example, the metal ion can be regenerated by oxidation, converting sulfur dioxide into sulfur to produce sulfuric acid or gypsum [10,51].
3.2.5. Biological Treatment
The biological treatment of biogas with sulfur-oxidizing bacteria (SOB) allows for hydrogen sulfide conversion into elemental sulfur or sulfate within the liquid phase. Hydrogen sulfide can be oxidized by Sulfolobus and Thiobacillus species, among others [10]. Cheng et al. detail a commercial pilot study involving multi-stage removal of H2S from biogas [32]. An inlet biogas stream with high H2S concentrations is contacted in a counter-current spray tower where the sulfide is absorbed into a slightly alkaline liquid solution. This sulfide-rich liquid stream continues into a controlled aeration tank where SOB converts the dissolved sulfide into elemental sulfur. The effluent from this tank passes through a settling process to remove the clarified, low-sulfide liquid, where it can then be recycled back to absorb more H2S. Stable sulfide removal rates of up to 95% were seen during the two-month operation [32]. The transformation performance depends on several operating conditions, including the composition of the substrate, pH of the culture medium, hydrogen sulfide loading, suspended or immobilized conditions of SOB, level of adaptation to changes of H2S content in biogas, and the dissolved oxygen (D.O.) in solution. Dissolved oxygen levels are critical to the production of elemental sulfur. Excess oxygen can lead to sulfite production and will remain as a contaminant in the solution. Separating the H2S absorption step from the oxidation step is advantageous since it does not add additional oxygen to the clean biogas effluent. Some advantages of this treatment are its low operating cost, high efficiency toward sulfur separation, minimal sludge production, and no secondary pollution [10,32].
3.3. Oxygen and Nitrogen Removal
During anaerobic digestion, it can be difficult to prevent the introduction of oxygen into the digester. However, Methanogenic Archaea are resilient microorganisms that can tolerate small changes in digester conditions. Introducing relatively low oxygen concentrations will not cause a complete collapse of the microbial community. The digester environment will also contain some facultative anaerobic bacteria capable of consuming oxygen at low levels and avoiding significant methane production interruptions. Any air added into the digester due to poor operation or equipment design will result in the presence of nitrogen in the biogas. For example, oxygen and nitrogen may be present in landfill gas if the gas is collected using vacuum systems. These gases can be removed by adsorption with activated carbon, molecular sieves, or membranes [52]. They can also be eliminated to some extent via sulfate-reduction processes. Using biogas as RNG necessitates removing both nitrogen and oxygen gases to achieve the required purity. The most utilized processing method for removal is catalytic elimination with palladium–platinum catalysts and chemisorption with copper contacts [10,11]. Another method that Ming Xu et al. presented involves co-culturing microalgae with endophytic bacteria to increase nitrogen and oxygen removal efficiency for biogas purification [53].
3.4. Ammonium Removal
Ammonium (NH4+) can serve as an inhibitor of the anaerobic digestion process and is formed naturally during protein degradation. Equation (12) presents that dissolved ammonium is in equilibrium with an ammonia (NH3) concentration, which is dependent on the temperature and pH of the digester. Aqueous solutions with a basic pH will create higher concentrations of aqueous ammonia, which is in balance with gaseous NH3 in the digester’s headspace.
Absolute limits cannot be placed on aqueous NH3 concentrations as even low amounts of ammonia can have a harmful impact on bacteria. For example, an increase in the pH value from 6.5 to 8.0 causes a 30× increase in ammonium concentrations. Digester temperature also positively correlates with the equilibrium between ammonium and ammonia, with increasing temperatures driving higher ammonia concentrations. The ammonium can be separated when biogas is dried or upgraded. Therefore, a separate conditioning step is not usually necessary [10,11].
3.5. Siloxane Removal
Siloxanes are a family of compounds containing silicon, oxygen, and methyl groups commonly called Volatile Organic Silicon Compounds (VOSCs). These compounds can be found in the biogas generated in municipal wastewater treatment plants and landfill gas since they are commonly used to manufacture personal hygiene, health care, and industrial products [54]. When burned, siloxane-containing biogas is converted into silicon dioxide (SiO2). Power production equipment such as gas turbines, boilers, and internal combustion engines can experience deposition of SiO2 as a white powder in their combustion and exhaust stages, resulting in significant maintenance costs and downtime. Buildups of SiO2 also occur in heat exchangers and as a coating on post-combustion catalysts. The maximum allowable level for siloxane concentration in biogas is generally given as 5 mg/Nm3 or lower for internal combustion and 0.1 mg/Nm3 or lower for turbines [54,55,56]. These limits are significant given that VOSCs from most sources range well above the recommended limits, necessitating conditioning or processing of the gas. An overview of different biogas sources can be seen in Table 7 in both the USA and EU. The biogas from manure digesters contain very few VOSCs due to the lack of siloxanes in the feedstock.
Table 7.
Reported Values of Siloxane by Process.
Several methods can eliminate these siloxanes depending on the facilities available and the desired treatment level. Bio-trickling filtration is typically cheaper than other methods. However, this process removes less than half of the siloxanes and often requires a subsequent treatment with other high-cost methods [60]. Cooling the gas to condense VOSCs, adsorption (on GAC, alumina, or silica gel), degrading with a mineral acid, biological removal, or absorption into liquid hydrocarbon mixtures are all able to provide removal efficiencies of greater than 95% [54]. Comparing treatment options to that of H2S, there is significant overlap. Adsorption and absorption can provide simultaneous H2S and VOSCs removal which leads to a lower overall treatment cost [10,11,29]. As a low-cost commercial precursor, silicon dioxide is not valuable enough to offset removal costs during processing; therefore, it is unnecessary to remove unless needed to meet vendor or regulatory requirements.
3.6. Hydrocarbon Removal
Heavy hydrocarbon removal from biogas may be required depending on the end use case, including transportation or 3rd-party sale. The target regulations include a hydrocarbon dew point specification of −10 °C [61]. This helps ensure no liquid species condenses in pipelines or equipment. Specifications for halogenated hydrocarbons depend on the end-use type but fall in the ppm range. For example, fuel cells are limited to 0.1–1 ppm of halogenated compounds [62].
Pressure swing adsorption (PSA) and temperature swing adsorption (TSA) are commonly used methods for reducing the hydrocarbon dew point and removing contaminants. Carbon dioxide and heavy hydrocarbons are adsorbed on a solid bed at either high pressure (PSA) or high temperature (TSA). Depending on processing time and other operating conditions, the effluent gas can contain less than 50 ppm CO2 and have a hydrocarbon point of less than −10 °C [61]. After purification, the beds are regenerated by lowering the pressure or raising the temperature.
Halogenated hydrocarbons (HHCs), particularly chlorine and fluorine compounds, are not common in agricultural or commercial digester biogas. However, the compounds are often found in landfill gas as a by-product of waste decomposition. Ong et al. collated reported sources and determined that MWTPs and agricultural digesters contained between 0 and 2 mg/Nm3 while landfill sources contained 0.3–2900 mg/NmHHCs3 [63]. When halogens combine with water, they cause corrosion in combined heat and power (CHP) engines and related piping, resulting in costly maintenance [64]. In comparison to other impurities covered above, removal can be easily accomplished via washing. In one such study by Rasi et al., 96% of halogenated hydrocarbon compounds were removed from a target gas stream with counter-current water washing under 20 bar pressure [65]. This process has the beneficial side effect of simultaneously removing CO2 as well, thus increasing the value of effluent biogas. Gas-to-water volumetric flow ratios across the range of 5–20:1 all showed removal exceeding 85% CO2 at 20 bar.
Activated carbon can be used to adsorb hydrocarbons at atmospheric pressure and is more efficient at removal than absorption into liquid. However, doing so will not remove significant amounts of carbon dioxide, nitrogen, oxygen, or other gases. Activated carbon can also not regenerate to its original adsorption capacity and must, therefore, be replaced regularly [39].
3.7. Particle Removal
Production of biogas often entrains small particles in the vapor stream as it leaves digestion systems. Depending on the targeted use of the biogas generated, particles must be removed to avoid mechanical wear in internal combustion engines and gas turbines. The most common method of removal is separation, which employs mechanical filters that physically trap particles as gas flows through them. Removal requirements vary by manufacturer but can range from a maximum particle loading of 10–50 mg/Nm3 of gas with sizes no larger than 0.3–10 µm [29]. Stirling engine burners have a high tolerance for siloxanes and other particles, so it may not be necessary to pretreat the gas if this applies [29,66]. Particles are also produced during combustion itself, but with a much smaller diameter on the nanometer scale. While these may pose a health risk similar to particulate matter from other combustion engines, they are not mechanical concerns or are limited only to biogas [67].
4. Current Technologies for Biogas Upgrading
Biogas upgrading technologies have traditionally focused on removing carbon dioxide to improve the heating value of raw gas. While some of the conditioning processes covered previously reduce CO2 as a side effect, their removal efficiency is too low for producing pipeline-quality biogas. As detailed in Table 8, several commercial processes are currently used to further condition raw biogas to meet a specified use. These processes are based on physical/chemical absorption, adsorption, and membrane separation [68].
Table 8.
Technologies Available for the Improvement of Clean Biogas.
The main objective of each process is removing carbon dioxide while retaining the maximum amount of methane. However, each treatment has specific drawbacks related to its use. In 2018, five technologies were reported to be successfully used at reasonable scales for biogas upgrading in Europe [68]. At their core, each is based on water purification, chemical absorption, adsorption by oscillation pressure, membrane separation, or physical absorption. The landscape of regulatory requirements, public support, investor willingness, biogas source, clean gas target, and many other unknown factors contribute to the particular technologies utilized at treatment plants. A snapshot of historical plant populations in Europe and Asia can be seen in Table 9, where both the total number of upgrading facilities and technologies utilized are organized by year. Germany contains the largest number of upgrading sites of all polled countries, with 200 locations in 2017, compared to 532 locations in all fourteen countries combined [14]. The polled data shows a dramatic increase in the use of membrane separation versus traditional absorption methods over the past few years.
Table 9.
Upgrading Technology Plant Type by Year.
4.1. Physical Absorption via Water Washing
Although other technologies are gaining market share, water washing is still the most used technology for conditioning and improving biogas quality. Water is a low-cost solvent compared to many organic chemicals and is often more environmentally friendly as well [69,70]. Carbon dioxide is removed preferentially compared to methane because of its higher solubility in water. This is detailed in Table 10 for 0 °C and 25 °C, where the solubility of methane is several orders of magnitude lower than carbon dioxide.
Table 10.
Solubility of Biogas Components in Water [71].
Henry’s Law states that the concentration of a gaseous compound in water is proportional to its vapor phase concentration and inversely proportional to system temperature. Absorption is most efficient at low temperatures and high pressures, allowing minimization of the process water needed during treatment [72]. Figure 2 presents a typical continuous flow water absorption process. During this treatment, the biogas is pressurized between 6 and 12 bar with temperatures up to 40 °C. Biogas is injected into the bottom of the absorption column while process water is injected at the top. Carbon dioxide and methane transfer from gas to liquid phase inside the absorption column according to solubility, flow rates, and system conditions [73,74,75,76]. In normal practices, the column is filled with a crush-resistant, high surface area packing material, allowing for a large contact area between gas and water to increase the transfer of gas into the liquid phase [69,73,76]. After contact the column’s liquid effluent stream consists of water, dissolved CO2, and small amounts of CH4, while the vapor stream is purified methane ready for further processing [68]. Methane stream purities of up to 95% are obtainable with this method [77].
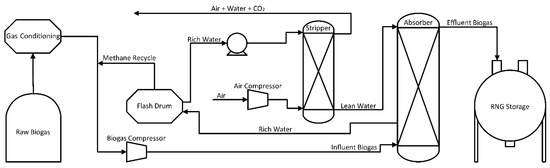
Figure 2.
CO2 Removal Process Flow Diagram Using Water Absorption.
Costs can be minimized by processing the used absorption water and recycling it back into the process, which is the most common configuration [64]. The effluent aqueous phase is transferred from the bottom of the column to a flash drum, where the pressure drops from 6–12 bar to 2–4 bar. Due to changing solubility, most of the CO2 absorbed in the solution is released during the pressure drop. Water leaving the flash drum still contains enough CO2 to prevent its use in absorption so it continues into a stripping column and is contacted with fresh air. The counter-current contact of the spent water and fresh air strips the remaining CO2 out of the solution and allows the process water to be recycled [68,73,76]. Carbon dioxide exiting the desorption column, along with other trace gases, is deodorized by its passage through a filter and is in many cases released into the atmosphere, which increases the carbon footprint of the process due to greenhouse gas (GHG) emissions [78]. In comparison, the CO2 can be captured, stored, or utilized to reduce GHG release and facilitate a reduced carbon footprint [79]. Data from pilot studies found an overall energy efficiency of 89.8% relative to the produced gas energy content when used for grid injection [12]. Continued studies, observed by Vilardi et al. [80] found that through simulations, water scrubbing had the largest exergy efficiency of 94.5% and a 99% methane recovery. In addition to the resulting exergy efficiencies of 91.1% and 90.8%, these two recovery percentages were found for membrane separation and amine scrubbing, respectively.
Alternatives for the utilization of CO2 to reduce emissions into the atmosphere have been proposed and tested by several groups. Microalgae utilizes CO2 as a carbon source for cell growth and is one of the most promising sequestration technologies. Capture efficiencies of >80% are easily obtained with some configurations removing >95% of released carbon dioxide [81,82,83].
4.2. Physical Absorption Using Organic Solvents
This method is based on the absorption of unwanted components, CO2 and H2S, into non-reactive organic solvents [68,84]. In contrast to chemical absorption, this process describes the interaction between compounds and the organic solvent that is physical. Commonly, the most used organic solvents are mixtures of methanol and dimethyl ethers of polyethylene glycol (DEPG). Marketable chemicals are also available under the trade name of GenosorbⓇ (Clariant), the commercialized SelexolⓇ (DOW Chemicals) process [42,84,85,86]. The advantage of organic solvents over water washing is the increased solubility of CO2. The SelexolⓇ processes using DEPG can absorb three times more CO2 than water, giving an advantage to biogas conditioning units with smaller process footprints. However, the high solubility of both CO2 and H2S in these solvents could also be viewed as a disadvantage in terms of energy consumption because of the high temperatures for solvent regeneration.
Energy consumption could be reduced by removing H2S before applying organic solvents [64,84]. In this case, H2S-free biogas is compressed (7–8 bars), cooled, and injected into the bottom of the absorption column visualized in Figure 3. The organic solvent is added in counter-current flow at approximately 20 °C. As with water/amine systems, temperature influences CO2 solubility in the solvent and gas/liquid equilibrium. The column is filled with a random packing material (pall rings) to increase the contact surface between the solvent and biogas [68,72,73,76]. Once the organic solvent absorbs CO2, the conditioned biogas, RNG, can be delivered into a gas network for distribution or other uses. The spent organic solvent exiting the bottom of the absorption column is introduced to a flash drum for CO2 removal and further solvent reutilization. The pressure in the flashdrum depends on the methane losses, pressure on methane losses, pressure on the absorption column, and the methane concentration in the raw biogas. In the process of organic solvent regeneration, it is necessary to heat the solvent (40–80 °C) before entering the desorption column [72,86]. Process heat exchangers can provide some of the energy for this heating through the capture of the compressor’s wasted heat. Once heated, the solvent is injected into the upper part of the column at 1 bar. This column is also filled with random packing to increase the contact surface area between the solvent, and air, injected counter-currently as a stripping agent. Due to the non-corrosive characteristics of organic solvent, the piping does not have to be made of stainless steel. The low freezing point of organic solvents allows the system to operate at as low as −20 °C without the need for extra heating [72]. In colder climates, this lack of required heating for absorption combined with increased absorption efficiency at low temperatures provides significant benefits over water/amine systems.
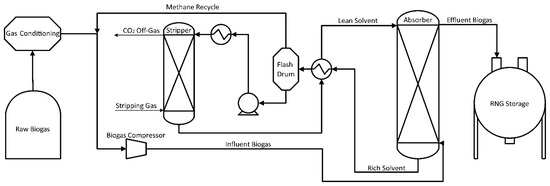
Figure 3.
CO2 Physical Absorption Flow Diagram Using an Organic Solvent System.
4.3. Chemical Absorption Using Amine Solutions
The second most popular CO2 removal method uses an amine reagent that binds chemically to carbon dioxide, thus removing it from the biogas. Water is used as the solvent with amine concentrations of 20–50% by weight depending on the chosen compounds [87]. In practice, common amines used for CO2 removal are methyl diethanolamine (MDEA), diethanolamine (DEA), and monoethanolamine (MEA). Similarly to water absorption, CO2 dissolves into solution, leaving a purified methane vapor stream. In contrast, however, further reactions with liquid amine convert the CO2 to other compounds, dramatically increasing the liquid’s capacity for CO2 removal. Absorption at low temperatures leads to more CO2 dissolved in solution, while higher temperatures increase the reaction speed of CO2 conversion. Chemical reactions in amine systems can be very complex with many intermediate steps. A simplified formula for the process can be seen in Equation (13) for the case of MEA, denoted as RNH2. Reactions during absorption are exothermic, leading to a temperature increase of 20–65 °C. This may necessitate cooling of the liquid stream before it can be recycled for further use. As detailed earlier, another advantage of this technology is that amines selectively absorb sulfides and CO2, allowing for the simultaneous removal of H2S. Amine absorption is commonly used for upgrading fossil fuel-based natural gas as well [88].
A description of the aminization process is shown in Figure 4. After initial conditioning, biogas enters through the column’s bottom and contacts the amine solution, flowing counter-current from the top at pressures of 1–2 bar. Molar feed ratios of amine to CO2 vary from 2 to 7:1 to avoid reaction equilibrium restrictions and keep amine in excess [89]. Biogas containing purified methane exits the column’s top, while the amine solution with the captured CO2 exits below. Within the stripper column, the liquid is rapidly depressurized in a flash unit where equilibrium changes release large amounts of CO2 from the solution. The liquid is then distributed and passed over packing material, where it contacts clean vapor, stripping the remaining CO2. A kettle boiler at the stripper’s bottom is used to heat the system to 120–150 °C, partially boiling the amine and water solution. The reboiler’s purpose includes: first, providing the heat of reaction required for the release of CO2 bound with amine; and second, generating steam to reduce the partial pressure of CO2 in the column [89]. Although limited by equilibrium, the high temperatures and low concentration of CO2 in vapor push a majority of the carbon dioxide out of the liquid phase, allowing the liquid to be reused in further absorption. If a reboiler is used, provided heat at 90 °C or lower a vacuum-operated stripping column is required to pull CO2 out of the solution. Effluent vapor from the stripper is cooled to condense any steam and amines; then it is sent back to the column while CO2 remains in the vapor phase for release or capture [72].
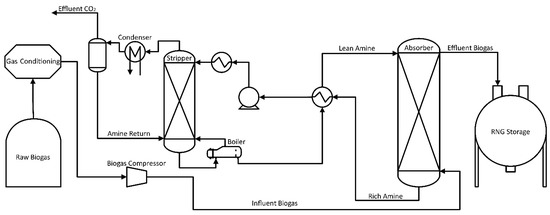
Figure 4.
Chemical Absorption Flow Diagram of CO2 using an Amine/Water System.
Unlike water absorption systems, the pH of amine columns is high enough to retard bacterial growth. Therefore, any vapor/liquid contact method, such as packing, trays, or hybrid combinations may be utilized. The amine absorption system can be used for systems ranging from small scales such as biogas applications, to applications in the oil, gas, and chemical industries with units several meters in diameter [9].
Newer amine structures are being introduced and studied for the potential increase in CO2 absorption such as benzylamine (BZA). Eskandari et al. studied BZA within hollow fiber membrane contactors (HFMCs) [90]. This system was tested against the more common amines, such as MEA and DEA. It was concluded that BZA had an increased absorption flux, comparatively, in many operating parameter variations, including amine concentration, sorbate partial pressure, phase velocities, temperature, and wettability. In addition to this study, BZA was utilized as a promoter in solutions of methyldiethanolamine (MDEA) and potassium carbonate (K2CO3), resulting in an increased absorption flux significantly [90].
In addition to amine solutions, other aqueous alkaline salts, such as calcium, potassium, and sodium hydroxides, can make a solvent that reacts chemically with CO2 Sodium hydroxide has a higher absorption capacity for CO2 compared to solvents such as monoethanolamine. For example, the theoretical amount of monoethanolamine required to capture 1 ton of CO2 is 1.39 tons, while sodium hydroxide only demands 0.9 tons [91]. However, these systems are not commonly used to absorb CO2 due to the difficulty of regenerating the solvents. This limits their use in acid gas removal to systems with low overall gas concentrations or small-scale temporary installations. The drawbacks of these methods include toxicity of the solvents to human beings and the environment, significant energy loads needed for regeneration of amines, initial cost of amine solvents, and amine losses due to evaporation [28]. The final content of methane in cleaned gas can reach up to 99% purity due to the high selectivity of amines for CO2, with overall CH4 losses as low as 0.1% [68]. As with water washing, the resulting gas must be dried before use in sensitive applications [72].
4.4. Pressure Swing Adsorption
PSA is a dry-contact method that separates gases based on the target compound’s molecular characteristics and the adsorbent material’s affinity. Utilizing the different interaction parameters of biogas compounds will allow for adsorption at different rates and concentrations on solid substrates. Equilibrium-based adsorbents have a higher affinity for holding CO2 on their surface than CH4, which results in an increased concentration of CH4 in the vapor phase.
Neutral adsorbents have similar affinities for both gases and utilize pore size differences to change desorption rates, resulting in separation based on kinetics versus equilibrium [92,93]. Higher system pressure corresponds to high partial pressures, which drive high adsorption rates. Releasing this pressure causes desorption of gaseous compounds at different rates, allowing for physical separation. As an example, a methane stream containing 10% CO2 was adsorbed on carbon molecular sieves (CMS) at 10 bar and 315 K. After approximately 15 min over 90% of the CO2 had been adsorbed on the surface, but less than 5% of the CH4 was adsorbed [94]. During blow-down, the methane was released first, followed by the desorption of CO2. PSA systems are capable of producing high-purity gas streams but suffer from expensive capital cost requirements [13]. In addition, standard PSA configurations only recover 97% of the starting methane since it is lost to the waste stream when small amounts of CH4 desorb with the CO2 [95]. Adsorption of H2S is irreversible on commonly used adsorbents, which reduces the usability of the system over time. To extend the life of the adsorbent and reduce operating costs, H2S is separated from the raw gas prior to injection into the PSA system. Figure 5 presents a basic flow diagram of PSA systems in which treatment is divided into four overall steps (pressurization, adsorption, blow-down, and purge) performed in parallel to ensure continuous system operation. The main factors influencing PSA unit performance are injection pressure, purge pressure, type of adsorbent, cycle time, and interconnection of various columns [9,13,28,72,95,96]. PSA application advantages include compactness of the equipment, relatively low energy costs, a good safety record, and simplicity of operation.
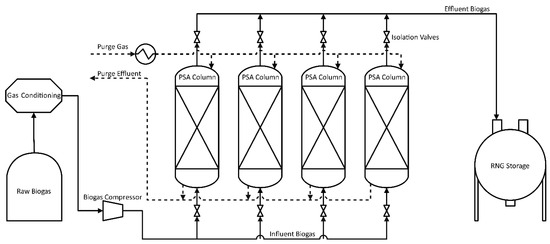
Figure 5.
Flowchart for Adsorption by Pressure Swing Oscillation.
Pressurization of clean biogas is performed between 4 and 10 atm during injection into a column containing adsorbate. The specific adsorbate used will depend on many factors, including concentrations of impurities in the biogas, desired treatment levels, cost restrictions, and end-use of the cleaned gas. Adsorption of clean biogas proceeds and temporarily traps gases such as CH4, CO2, N2, O2, and H2. Equilibrium-based adsorbents are held under pressure until the system is close to equilibrium conditions. Impurities in the biogas will have adsorbed onto the surface material at higher concentrations than the gas phase, leading to an increase in gas phase methane purity. Kinetic-based adsorbents are held under pressure until the adsorbate is saturated with gas species. Methane does not adsorb with equilibrium-based adsorbents as strongly as carbon dioxide.
Blow-down begins by releasing the column pressure and allowing gases to exit. The methane, which is only weakly adsorbed, flows through the column and is collected at the top. The result from both equilibrium and kinetic adsorbents is an initial effluent gas very high in methane content, although some CO2 is also released. As the system continues to depressurize, concentrations of CO2 increase over time until its concentration in the effluent gas is higher than the level in the original biogas. To stop this from contaminating the first high-purity split, valves are used to divert flow when CO2 concentrations begin to rise. This results in two separate gas collections from the original biogas stream: a high-purity CH4 stream with some CO2; and a high-concentration CO2 stream with residual CH4. The residual CH4 gas stream contains significant amounts of methane, and though the concentration is low, it should be recycled back to the PSA entry. Further purification of one or both streams requires either multiple simultaneous adsorption columns or repeated treatment on the same column.
Purging involves flushing the column with nitrogen or other inert gases to remove any residual compounds still adsorbed after blow-down. Depending on the adsorbents utilized and the compounds collected, a heated gas stream may be needed to force desorption at the desired levels. A study by Ali Abd and Roslee Othman analyzed six separate adsorbents to compare differences in methane purity, and it was found that the carbon molecular sieve (CMS-3K) provided the highest biomethane recovery at 86.2% as well as the highest purity at 97.165% [97]. The selection of the adsorbent material plays a crucial role in the desired outcome of biogas upgrading and depends on the application and desired product.
4.5. Membrane Separation
Membrane technology is based on the selective permeability properties of a membrane, which allows the discriminatory separation of targeted gas components from a biogas matrix. A membrane is a dense filter that can separate the components in a gas or liquid at the molecular level. Membranes commonly used for upgrading biogas retain most of the methane while carbon dioxide and other trace, yet unwanted gases, penetrate through the membrane. There are two factors that affect the selection of membranes for the separation of gases: molecular size and solubility [98].
Polymer membranes can be classified as glassy, rubbery, or gel-like due to the increased freedom of movement that polymer chains can exhibit. In general, a higher freedom of movement means higher diffusivity of compounds but lower selectivity. For example, the permeability (low to high) of biogas components in a glassy polymer membrane is as follows: C3H8, CH4, N2, H2S, CO2, and H2O. Preparing the membrane with a rubber polymer results in different permeability through the membrane: N2, CH4, CO2, H2S, C3H8, and H2O. This trend can be seen in Table 11, which lists the permeability of CO2 and CH4 in various membranes. It can be observed that the water molecule is the smallest and most soluble; therefore, it is easily separated from methane by vitreous and polymeric gummy membranes, while carbon dioxide and hydrogen sulfide can be separated with glassy and gummy membranes [99].
Table 11.
Permeability of Gases through Selected Membranes [100].
In practice, carbon dioxide is better separated with vitreous membranes like cellulose acetate and polyimide, using size selectivity [101]. Hydrogen sulfide, which is a larger and more soluble compound than carbon dioxide, is best separated by gummy membranes, such as ether-amide co-polymers, using absorption selectivity [102,103]. Nitrogen can be separated from methane by vitreous membranes that use the difference in size or gummy membranes that use the differences in absorption strength, such as polyimide and perfluorinated polymers or rubber membranes like silicone rubber [100]. In both cases, the selectivity of these membranes is relatively small.
Finally, due to their solubility, propane and other hydrocarbons are best separated from methane using selective rubber absorption membranes like silicone rubber. The separation can be performed with dry processes (gas/gas separation) or wet (gas/liquid separation). The dry process uses specific polymer membrane materials capable of CO2 and CH4 separation made of cellulose acetate and polyimide [99]. The speed of permeability of the membranes depends on the absorption coefficients of the gases and material used for membrane synthesis. In turn, the absorption coefficient of a gas depends on the equilibrium concentration of gas in the membrane. By considering the diffusion and absorption coefficients of different gases, it can be observed over many polymer membranes that smaller molecules (such as CO2) have a higher solubility and permeate more easily through the membrane compared to larger molecules like CH4 [99]. As a result, CH4 will be retained by the membrane while the CO2 will permeate to the low-pressure side. Unfortunately, the membranes are rarely 100% selective, and some of the CH4 (10–15%) is also transported to the low-pressure side [100].
A typical and simplified design of a membrane-based biogas enhancement unit is shown in Figure 6. In practice, raw biogas is initially cleaned by eliminating contaminants such as H2S, water, VOCs, and other trace gases to avoid corrosion-related problems. Water is eliminated by condensation prior to compression, while H2S is usually separated using activated carbon. Once water and H2S have been removed, the biogas is compressed to 6–20 bars, achieving the driving force necessary for the membrane separation. The cleaned gas is then passed through a standard commercial separator to remove residual compressor oil and sent to membrane separation. Specific pressures for separation depend on operational requirements, including processing time, membrane types, purity requirements, and ambient temperature [28,68,72].
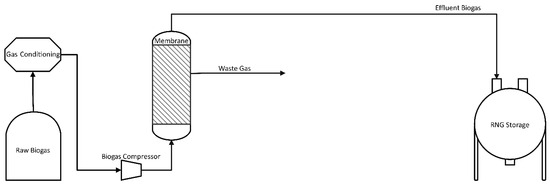
Figure 6.
Flowchart of Biogas Improvement with a Membrane.
There are three very common membrane designs on the market. The first design shown in Figure 6 does not include internal biogas circulation, and therefore exhibits a lower energy consumption for compression. However, the loss of methane is higher without reprocessing of the off-gas. Application of this system requires the use of very selective membranes to minimize methane losses. Cost savings associated with reduced compression costs need to be carefully balanced against higher membrane costs. Methane in the residual gas could be used (e.g., co-generation in a boiler or CHP engine) to improve the overall efficiency of the system.
The second design in Figure 7 contains the air–liquid membrane MedalTM and is used in most biogas upgrading operations. The permeate (gas passing through the membrane) from the first membrane stage is removed from the system, while permeate from the second stage is recirculated to minimize methane losses in off-gas. Reprocessing this second gas stream leads to increased energy consumption compared to Figure 6 but gives much better total methane recovery.
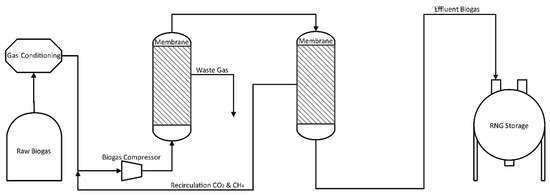
Figure 7.
Flowchart of Biogas Improvement with Two Membranes and Recycle.
The third design, Figure 8, uses Evonik SepuranⓇ membranes. The retained product (the gas that does not pass through the membrane) during the first stage is purified in the second stage, as in design two, to obtain a gas product with a purity of more than 97% methane. Additionally, permeate from Stage 1 is introduced into a third stage to minimize the concentration of CH4 in the residual gas as well as the gas circulating towards the compressor. The permeate that flows from the second and third stages is combined for recycling into the compressor. In a membrane unit, the majority of the remaining water after compression is separated from the RNG as part of a CO2 stream. Therefore, a gas dryer is not commonly needed to further decrease the dew point.
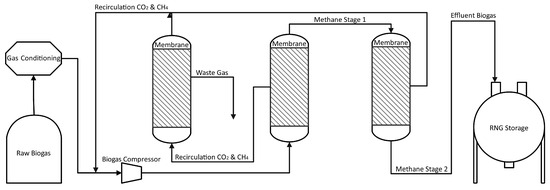
Figure 8.
Flowchart of Biogas Improvement with Three Membranes and Multiple Recycle.
The content of CH4 in the upgraded biogas is commonly 95% but can reach over 98% under certain optimized conditions [72]. Wet membrane technology combines the advantages of membranes with absorption technologies. The difference between dry and humid processes is related to the hydrophobic properties of the micro-porous membranes used in the latter. Practically, the installed membrane separates the gas and liquid while gas molecules spread through the membrane and are absorbed by the counter-current liquid medium. The liquid solution can be regenerated at high temperature, while the CO2 released is pure and can be used in other industrial applications. The main drawbacks of this technology are the high cost of membranes and their fragility. These membrane configurations provide biogas purification at an estimated cost of 0.3 kWh per cubic meter of RNG [46].
Further estimates predict the lifespan of membranes for biogas purification, in these configurations, vary between 5 and 10 years [72]. A study on multi-step membrane processes from Zito et al. found an increase in methane recovery due to higher selectivity as well as a saving in membrane area [104]. Analysis was made from 2 to 10 step paths with a significant reduction in membrane area between 2 and 5 steps. This method recovered a methane purity of 98% with a purer CO2 permeate of 97.9%, reducing methane losses [104].
5. Conclusions
At present, RNG is emerging as a promising solution to reduce greenhouse gas emissions, enhance energy security, and support the transition to a sustainable future. This paper reviewed the current technologies for biogas conditioning and upgrading, discussing the methods used to transform raw biogas into high-quality RNG that meets pipeline standards and can be used interchangeably with conventional natural gas. The core technologies for biogas upgrading—scrubbing, sorption, pressure swing adsorption, and membrane separation—have made massive advancements in recent years. Despite this, several challenges remain. These processes alone are not at a level to produce the purity and cost metrics that will bring this alternative fuel to further readiness. The energy requirements of upgrading processes, the initial capital investment, and other operational costs are significant obstacles that need to be addressed to fully realize the potential of RNG. Addressing these challenges requires continued research and development to enhance the efficiency and cost-effectiveness of existing technologies.
Each technology discussed in this paper illuminates one or more avenues into generating biogas with methods for cleaning impurities, and these operations can be tailored to fit the requirements of various applications. Not every technology will fit in every instance of RNG production, therefore it is important to understand how they function so that they can be used in conjunction with new and already implemented systems. Furthermore, exploring the potential of emerging technologies, in Part II of this assessment, such as hybrid systems (i.e., that combine multiple upgrading methods), cryogenic separation, in situ methane enrichment, and the integration of renewable energy sources for process power, offer potential pathways to mitigate inherent issues of the current RNG landscape while opening new avenues forward in research and development. Other methods for upgrading (i.e., industrial lung, supersonic separation, chemical hydrogenation, hydrate formation, biological processes, etc.) should be expanded, and these advancements can significantly impact greater RNG adoption. Government policies and regulatory frameworks are essential in promoting the implementation and expansion of RNG technologies. Financial incentives like feed-in tariffs, renewable energy credits, and carbon pricing can provide the necessary economic incentives for investing in RNG. Additionally, aligning regulations across different regions can enhance the development of a global RNG market, encouraging international cooperation and the sharing of technological advancements.
Funding
Funding was provided by the Energy Institute of Louisiana, University of Louisiana.
Data Availability Statement
No new data were created or analyzed in this study.
Conflicts of Interest
The authors declare no conflict of interest.
References
- EIA. Annual Energy Outlook 2018 with Projections to 2050; Office of Energy Analysis, U.S. Department of Energy: Washington, DC, USA, 2018. [Google Scholar]
- Jaffe, A.; Dominguez-Faus, R.; Parker, N.; Scheitrum, D.; Wilcock, J.; Miller, M. The Feasibility of Renewable Natural Gas as a Large-Scale, Low Carbon Substitute; Institute of Transportation Studies, University of California: Davis, CA, USA, 2016. [Google Scholar]
- EIA. Annual Energy Outlook 2017 with Projections to 2050; U.S. Energy Information Administration (EIA), Office of Energy Analysis, U.S. Department of Energy: Washington, DC, USA, 2017. [Google Scholar]
- USEPA. Overview of the Renewable Fuel Standard Program. Available online: https://www.epa.gov/renewable-fuel-standard/overview-renewable-fuel-standard-program (accessed on 10 May 2022).
- Faransso, R. Jumpstarting the Clean Hydrogen Economy—The Final Rule for 45v. ESG Review: 2025. Available online: https://esgreview.net/2025/01/15/jumpstarting-the-clean-hydrogen-economy-the-final-rule-for-45v (accessed on 1 October 2025).
- USDOE, North Wind Inc. 2022 Annual Site Environmental Report. 2023. Available online: https://www.energy.gov/sites/default/files/2024-06/2022%20Site%20Environmental%20Report%2C%20Department%20of%20Energy%2C%20ETEC%20-%20Area%20IV%20Santa%20Susana%20Field%20Laboratory%2C%20October%202023.pdf (accessed on 1 October 2025).
- European Biogas Association. Activity Report 2022; European Biogas Association: Brussels, Belgium, 2022. [Google Scholar]
- Lambert, M. Biogas: A Significant Contribution to Decarbonising Gas Markets? 2017. Available online: https://www.oxfordenergy.org/wpcms/wp-content/uploads/2017/06/Biogas-A-significant-contribution-to-decarbonising-gas-markets.pdf (accessed on 1 October 2025).
- Kadam, R.; Panwar, N.L. Recent advancement in biogas enrichment and its applications. Renew. Sustain. Energy Rev. 2017, 73, 892–903. [Google Scholar] [CrossRef]
- Petersson, A.; Wellinger, A. Biogas Upgrading Technologies—Developments and Innovations; IEA Bioenergy Task 37-Energy from Biogas and Landfill Gas Report No. 37; International Energy Agency (IEA): Paris, France, 2009. [Google Scholar]
- Rohstoffe, F.N. Guide to Biogas: From Production to Use, 5th ed.; Fachagentur Nachwachsende Rohstoffe e.V. (FNR): Gülzow, Germany, 2010. [Google Scholar]
- Rotunno, P.; Lanzini, A.; Leone, P. Energy and economic analysis of a water scrubbing based biogas upgrading process for biomethane injection into the gas grid or use as transportation fuel. Renew. Energy 2017, 102, 417–432. [Google Scholar] [CrossRef]
- Ryckebosch, E.; Drouillon, M.; Vervaeren, H. Techniques for transformation of biogas to biomethane. Biomass Bioenergy 2011, 35, 1633–1645. [Google Scholar] [CrossRef]
- Deremince, B.; Königsberger, S. Statistical Report of the European Biogas Association; European Biogas Association (EBA): Brussels, Belgium, 2017. [Google Scholar]
- Budzianowski, W.M. Sustainable biogas energy in poland: Prospects and challenges. Renew. Sustain. Energy Rev. 2012, 16, 342–349. [Google Scholar] [CrossRef]
- Piechota, G.; Igliński, B.; Buczkowski, R. Development of measurement techniques for determination main and hazardous components in biogas utilised for energy purposes. Energy Convers. Manag. 2013, 68, 219–226. [Google Scholar] [CrossRef]
- Centre, S.G. Basic Data on Biogas, 2nd ed.; Swedish Gas Technology Centre Ltd., (SGC): Malmö, Sweden, 2012. [Google Scholar]
- Muñoz, R.; Meier, L.; Diaz, I.; Jeison, D. A review on the state-of-the-art of physical/chemical and biological technologies for biogas upgrading. Rev. Environ. Sci. Bio. Technol. 2015, 14, 727–759. [Google Scholar] [CrossRef]
- Seadi, T.A.; Rutz, D.; Prassl, H.; Köttner, M.; Finsterwalder, T.; Volk, S.; Janssen, R. Biogas Handbook; University of Southern Denmark Esbjerg: Esbjerg, Denmark, 2008. [Google Scholar]
- Boerman, M.; Pronto, J.; Gooch, C. Anaerobic Digestion at Swiss Valley Dairy: Case Study. 2014. Available online: https://ecommons.cornell.edu/server/api/core/bitstreams/5be73af9-0f29-422a-89c2-213754f5b7e5/content (accessed on 23 August 2023).
- Gooch, C.; Labatut, R. Evaluation of the Continuously-Mixed Anaerobic Digester System at Synergy Biogas Following the Protocol for Quantifying and Reporting the Performance of Anaerobic Digestion Systems for Livestock Manures. 2014. Available online: https://lpelc.org/evaluation-of-a-continuously-mixed-farm-based-anaerobic-co-digestion-system-following-the-u-s-epa-protocol-for-quantifying-and-reporting-on-the-performance-of-anaerobic-digestion-systems-for-livestoc/#:~:text=Purpose,manure%2Dbased%20anaerobic%20digestion%20systems (accessed on 23 August 2023).
- Oliver, J.P.; Gooch, C. Emissions from Biogas-Fueled Distributed Generation Units Part 1: What Are the Potential Emissions from Engine-Generation Sets? 2016. Available online: https://ecommons.cornell.edu/server/api/core/bitstreams/305a2148-3a28-456a-b069-725683583f40/content (accessed on 12 November 2023).
- Bulgartransgaz. Invitation to Tender for Natural Gas Supply. 2014. Available online: https://bulgartransgaz.bg/files/useruploads/files/obstestveni_porachki/btg-24-00-1882_en.pdf (accessed on 28 October 2023).
- Aregbe, A.G. Natural gas flaring—Alternative solutions. World J. Eng. Technol. 2017, 5, 139–153. [Google Scholar] [CrossRef]
- Kumar, S.; Suresh, S.; Arisutha, S. Production of renewable natural gas from waste biomass. J. Inst. Eng. (India) Ser. E 2013, 94, 55–59. [Google Scholar] [CrossRef]
- UnionGas. Chemical Composition of Natural Gas. Available online: https://wecanfigurethisout.org/ENERGY/Web_notes/Carbon/Fossil_Fuels_Supporting_Files/Chemical%20Composition%20of%20Natural%20Gas%20-%20Union%20Gas.pdf (accessed on 28 October 2023).
- Faramawy, S.; Zaki, T.; Sakr, A.A.E. Natural gas origin, composition, and processing: A review. J. Nat. Gas Sci. Eng. 2016, 34, 34–54. [Google Scholar] [CrossRef]
- Awe, O.W.; Zhao, Y.; Nzihou, A.; Minh, D.P.; Lyczko, N. A review of biogas utilisation, purification and upgrading technologies. Waste Biomass Valorization 2017, 8, 267–283. [Google Scholar] [CrossRef]
- Dudek, J.; Klimek, P.; Niemczewska, J.; Zaleska-Bartosz, J. Landfill Gas Energy Technologies; Scientific Works of the Oil and Gas Institute; Oil and Gas Institute—National Research Institute: Kraków, Poland, 2010; Volume 174. [Google Scholar]
- OSHA. Occupational Safety and Health Standards—Toxic and Hazardous Substances—Air Contaminants. 2019. Available online: https://www.osha.gov/laws-regs/regulations/standardnumber/1910/1910.1000 (accessed on 20 October 2023).
- Nguyen, L.N.; Kumar, J.; Vu, M.T.; Mohammed, J.A.H.; Pathak, N.; Commault, A.S.; Sutherland, D.; Zdarta, J.; Tyagi, V.K.; Nghiem, L.D. Biomethane production from anaerobic co-digestion at wastewater treatment plants: A critical review on development and innovations in biogas upgrading techniques. Sci. Total Environ. 2021, 765, 142753. [Google Scholar] [CrossRef]
- Cheng, Y.; Yuan, T.; Deng, Y.; Lin, C.; Zhou, J.; Lei, Z.; Shimizu, K.; Zhang, Z. Use of sulfur-oxidizing bacteria enriched from sewage sludge to biologically remove H2S from biogas at an industrial-scale biogas plant. Bioresour. Technol. Rep. 2018, 3, 43–50. [Google Scholar] [CrossRef]
- Magomnang, A.-A.S.M.; Villanueva, E.P. Removal of hydrogen sulfide from biogas using dry desulfurization systems. In Proceedings of the International Conference on Agricultural, Environmental and Biological Sciences (AEBS-2014), Phuket, Thailand, 24–25 April 2014. [Google Scholar]
- Aslanidou, S.; Lydakis-Simantiris, N.; Kotsifaki, C.; Pentari, D.; Katsivela, E. Ferric Chloride (FeCl3) as Regulatory agent for the reduction of hydrogen sulfide (H2S) in municipal wastewater. In Proceedings of the 9th International Conference on Protection and Restoration of the Environment (PRE IX), Kefalonia, Greece, 29 June–3 July 2008. [Google Scholar]
- Speight, J.G. Processes. In Natural Gas; Elsevier Inc.: Amsterdam, The Netherlands, 2007; pp. 161–192. Available online: https://linkinghub.elsevier.com/retrieve/pii/B9781933762142500121 (accessed on 27 October 2025). [CrossRef]
- Technologies, M.V. H2S Media Cost Calculator|Mv Technologies. 2019. Available online: https://mvseer.com/resources/tools/h2s-media-cost-calculator/ (accessed on 30 October 2023).
- Bahadori, A. Chapter 10—Natural Gas Sweetening. In Natural Gas Processing; Bahadori, A., Ed.; Gulf Professional Publishing: Boston, MA, USA, 2014; pp. 483–518. [Google Scholar]
- Pipatmanomai, S.; Kaewluan, S.; Vitidsant, T. Economic assessment of biogas-to-electricity generation system with H2S removal by activated carbon in small pig farm. Appl. Energy 2009, 86, 669–674. [Google Scholar] [CrossRef]
- Coppola, G.; Papurello, D. Biogas Cleaning: Activated Carbon Regeneration for H2S Removal. Clean Technol. 2018, 1, 40–57. [Google Scholar] [CrossRef]
- Kulkarni, M.B.; Ghanegaonkar, P.M. Hydrogen sulfide removal from biogas using chemical absorption technique in packed column reactors. Glob. J. Environ. Sci. Manag. 2019, 5, 155–166. [Google Scholar] [CrossRef]
- De Gisi, S.; Lofrano, G.; Grassi, M.; Notarnicola, M. Characteristics and adsorption capacities of low-cost sorbents for wastewater treatment: A review. Sustain. Mater. Technol. 2016, 9, 10–40. [Google Scholar] [CrossRef]
- Samson, M.; Aboyade, A.; Muzenda, E. Enrichment of biogas for use as vehicular fuel: A review of the upgrading techniques. Int. J. Adv. Eng. Sci. Appl. Math. 2013, 1, 89–98. [Google Scholar]
- Awe, O.W.; Minh, D.P.; Lyczko, N.; Nzihou, A.; Zhao, Y. Laboratory-scale investigation of the removal of hydrogen sulfide from biogas and air using industrial waste-based sorbents. J. Environ. Chem. Eng. 2017, 5, 1809–1820. [Google Scholar] [CrossRef]
- Bagreev, A.; Bandosz, T. A role of sodium hydroxide in the process of hydrogen sulfide adsorption/oxidation on caustic-impregnated activated carbons. Ind. Eng. Chem. Res. 2002, 41, 672–679. [Google Scholar] [CrossRef]
- Castrillon, M.; Moura, K.; Alves, C.; Bastos-Neto, M.; Azevedo, D.; Hofmann, J.; Möllmer, J.; Einicke, W.-D.; Gläser, R. CO2 and H2S removal from CH4-rich streams by adsorption on activated carbons modified with K2CO3, NaOH, or Fe2O3. Energy Fuels 2016, 30, 9596–9604. [Google Scholar] [CrossRef]
- Makaruk, A.; Miltner, M.; Harasek, M. Membrane biogas upgrading processes for the production of natural gas substitute. Sep. Purif. Technol. 2010, 74, 83–92. [Google Scholar] [CrossRef]
- Hao, X.; Hou, G.; Zheng, P.; Liu, R.; Liu, C. H2S in-situ removal from biogas using a tubular zeolite/TiO2 photocatalytic reactor and the improvement on methane production. Chem. Eng. J. 2016, 294, 105–110. [Google Scholar] [CrossRef]
- Su, J.-J.; Hong, Y.-Y. Removal of hydrogen sulfide using a photocatalytic livestock biogas desulfurizer. Renew. Energy 2020, 149, 181–188. [Google Scholar] [CrossRef]
- Siemak, J.B.; Gelbs, M. Operating experience with a two-stage H2S scrubber using caustic soda. In Proceedings of the SPE California Regional Meeting CRM 1985, Anaheim, CA, USA, 27–29 March 1985; Society of Petroleum Engineers: Richardson, TX, USA, 1985; pp. 513–518. [Google Scholar]
- Horikawa, M.S.; Rossi, F.; Gimenes, M.L.; Costa, C.M.M.; Da Silva, M.G.C. Chemical absorption of H2S for biogas purification. Braz. J. Chem. Eng. 2004, 21, 415–422. [Google Scholar] [CrossRef]
- Thanakunpaisit, N.; Jantarachat, N.; Onthong, U. Removal of hydrogen sulfide from biogas using laterite materials as an adsorbent. Energy Procedia 2017, 138, 1134–1139. [Google Scholar] [CrossRef]
- van Foreest, F. Perspectives for Biogas in Europe; Oxford Institute for Energy Studies: Oxford, UK, 2012. [Google Scholar]
- Xu, M.; Xue, Z.; Sun, S.; Zhao, C.; Liu, J.; Liu, J.; Zhao, Y. Co-culturing microalgae with endophytic bacteria increases nutrient removal efficiency for biogas purification. Bioresour. Technol. 2020, 314, 123766. [Google Scholar] [CrossRef]
- Soreanu, G.; Beland, M.; Falletta, P.; Edmonson, K.; Svoboda, L.; Al-Jamal, M.; Seto, P. Approaches concerning siloxane removal from biogas—A review. Can. Biosyst. Eng. Le. Genie Des. Biosyst. Au. Can. 2011, 53, 8.1–8.18. [Google Scholar]
- Envitech. Treatment of Siloxanes in Biogas: Origin, Effect and Management. 2018. Available online: https://condorchem.com/en/blog/siloxanes-biogas-treatment/ (accessed on 1 November 2023).
- Gao, R.; Cheng, S.; Li, Z. Research progress of siloxane removal from biogas. Int. J. Agric. Biol. Eng. 2017, 10, 30–39. [Google Scholar] [CrossRef]
- Wellinger, A.; Mandereau, C. Rationale for Siloxane Levels; CEN/TC 408; European Biogas Association: Brussels, Belgium, 2010. [Google Scholar]
- Pierce, J.L. Siloxane Sampling, Analysis and Data Reporting Recommendations on Standardization for the Biogas Utilization Industry. EPA. 2011. Available online: https://www.epa.gov/sites/default/files/2016-06/documents/pierce.pdf (accessed on 9 May 2023).
- Tansel, B.; Surita, S.C. Differences in volatile methyl siloxane (vms) profiles in biogas from landfills and anaerobic digesters and energetics of vms transformations. Waste Manag. 2014, 34, 2271–2277. [Google Scholar] [CrossRef]
- Accettola, F.; Guebitz, G.; Schoeftner, R. Siloxane removal from biogas by biofiltration: Biodegradation studies. Clean Technol. Environ. Policy 2008, 10, 211–218. [Google Scholar] [CrossRef]
- Siirtec, N. Gas Dew Point Control—Siirtec Nigi. 2019. Available online: https://aig-int.com/partner/siirtec-nigi/ (accessed on 4 January 2024).
- Papadias, D.; Ahmed, S. Biogas Impurities and Cleanup for Fuel Cells; U.S. Department of Energy: Washington, DC, USA, 2012. [Google Scholar]
- Ong, M.D.; Williams, R.B.; Kaffka, S.R. Comparative Assessment of Technology Options for Biogas Clean-Up. 2014. Available online: https://ucdavis.app.box.com/s/iaog2diybkvoe5xxdjud97xsrx3ypwmq (accessed on 16 June 2022).
- Persson, M.; Jonsson, O.; Wellinger, A. Biogas upgrading to vehicle fuel standards and grid injection. IEA Bioenergy 2006, 37, 20–21. [Google Scholar]
- Rasi, S.; Läntelä, J.; Veijanen, A.; Rintala, J. Landfill gas upgrading with countercurrent water wash. Waste Manag. 2008, 28, 1528–1534. [Google Scholar] [CrossRef]
- Blanco, G.; Santalla, E.; Córdoba, V.; Levy, A. Generación de Electricidad a Partir de Biogás Capturado de Residuos Sólidos Urbanos: Un Análisis Teórico-Práctico. 2020. Available online: https://publications.iadb.org/es/publicacion/13967/generacion-de-electricidad-partir-de-biogas-capturado-de-residuos-solidos-urbanos (accessed on 10 May 2023).
- Minutolo, P.; Sgro, L.; Costagliola, M.A.; Prati, M.V.; Sirignano, M.; D’Anna, A. Ultrafine Particle Emission from Combustion Devices Burning Natural Gas. Chem. Eng. Trans. 2010, 22, 239–244. [Google Scholar] [CrossRef]
- Angelidaki, I.; Treu, L.; Tsapekos, P.; Luo, G.; Campanaro, S.; Wenzel, H.; Kougias, P. Biogas upgrading and utilization: Current status and perspectives. Biotechnol. Adv. 2018, 36, 452–466. [Google Scholar] [CrossRef]
- Budzianowski, W.M.; Wylock, C.E.; Marciniak, P.A. Power requirements of biogas upgrading by water scrubbing and biomethane compression: Comparative analysis of various plant configurations. Energy Convers. Manag. 2017, 141, 2–19. [Google Scholar] [CrossRef]
- Kapoor, R.; Subbarao, P.M.V.; Vijay, V.K.; Shah, G.; Sahota, S.; Singh, D.; Verma, M. Factors affecting methane loss from a water scrubbing based biogas upgrading system. Appl. Energy 2017, 208, 1379–1388. [Google Scholar] [CrossRef]
- Deublein, D.; Steinhauser, A. History and Status to Date in Europe. In Biogas from Waste and Renewable Resources; Wiley-VCH: Weinheim, Germany, 2008; pp. 27–33. [Google Scholar]
- Bauer, F.; Hulteberg, C.; Persson, T.; Tamm, D. Biogas Upgrading-Review of Commercial Technologies (Biogasuppgradering-Granskning Av Kommersiella Tekniker) Sgc Rapport 2013:270 Catalyzing Energygas Development for Sustainable Solutions. Available online: https://www.sgc.se (accessed on 2 June 2023).
- Håkansson, A. Preventing Microbial Growth on Pall-Rings when Upgrading Biogas Using Absorption with Water Wash. 2006. Available online: https://www.diva-portal.org/smash/get/diva2:22236/FULLTEXT01 (accessed on 15 May 2023).
- Jecha, D.; Niesner, J.; Stehlík, P. Biogas upgrading technologies: State of art review in biogas upgrading technologies: State of art review in biogas biogas upgrading techniques: State of art review in European region. Chem. Eng. Trans. 2013, 35, 517–522. [Google Scholar] [CrossRef]
- Kapdi, S.S.; Vijay, V.K.; Rajesh, S.K.; Prasad, R. Biogas scrubbing, compression and storage: Perspective and prospectus in Indian context. Renew. Energy 2005, 30, 1195–1202. [Google Scholar] [CrossRef]
- Yliopisto, J. Evaluation of Potential Technologies and Operational Scales Reflecting Market Needs for Low-Cost Gas Upgrading Systems. 2012. Available online: https://www.valorgas.soton.ac.uk/Deliverables/111129_VALORGAS_241334_D5-1_Final_version.pdf (accessed on 11 November 2023).
- Singhal, S.; Agarwal, S.; Arora, S.; Sharma, P.; Singhal, N. Upgrading techniques for transformation of biogas to bio-cng: A review: A review on upgradation techniques to transform biogas to bio-cng. Int. J. Energy Res. 2017, 41, 1657–1669. [Google Scholar] [CrossRef]
- Budzianowski, W.M. A review of potential innovations for production, conditioning and utilization of biogas with multiple-criteria assessment. Renew. Sustain. Energy Rev. 2016, 54, 1148–1171. [Google Scholar] [CrossRef]
- Cordova, S.S.; Gustafsson, M.; Eklund, M.; Svensson, N. What should we do with CO2 from biogas upgrading? J. CO2 Util. 2023, 77, 102607. [Google Scholar] [CrossRef]
- Vilardi, G.; Bassano, C.; Deiana, P.; Verdone, N. Exergy and energy analysis of three biogas upgrading processes. Energy Convers. Manag. 2020, 224, 113323. [Google Scholar] [CrossRef]
- Jankowska, E.; Sahu, A.K.; Oleskowicz-Popiel, P. Biogas from microalgae: Review on microalgae’s cultivation, harvesting and pretreatment for anaerobic digestion. Renew. Sustain. Energy Rev. 2017, 75, 692–709. [Google Scholar] [CrossRef]
- Krzemieniewski, M.; Szwarc, D.; Zielinski, M.; Kupczyk, K.; Rokicka, M.; Debowski, M. The Possibility of Using Carbon Dioxide from Biogas in the Production of Microalgae Biomass; Uniwersytet Warmińsko-Mazurski w Olsztynie: Olsztyn, Poland, 2016. [Google Scholar]
- Shin, Y.S.; Choi, H.I.; Choi, J.; Lee, J.; Sung, Y.; Sim, S. Multilateral approach on enhancing economic viability of lipid production from microalgae: A review. Bioresour. Technol. 2018, 258, 335–344. [Google Scholar] [CrossRef]
- Sahota, S.; Shah, G.; Ghosh, P.; Kapoor, R.; Sengupta, S.; Singh, P.; Vijay, V.; Sahay, A.; Vijay, V.K.; Thakur, I.S. Review of trends in biogas upgradation technologies and future perspectives. Bioresour. Technol. Rep. 2018, 1, 79–88. [Google Scholar] [CrossRef]
- Patterson, T.; Esteves, S.; Dinsdale, R.; Guwy, A. An evaluation of the policy and techno-economic factors affecting the potential for biogas upgrading for transport fuel use in the UK. Energy Policy 2011, 39, 1806–1816. [Google Scholar] [CrossRef]
- Sun, Q.; Li, H.; Yan, J.; Liu, L.; Yu, Z.; Yu, X. Selection of appropriate biogas upgrading technology—A review of biogas cleaning, upgrading and utilisation. Renew. Sustain. Energy Rev. 2015, 51, 521–532. [Google Scholar] [CrossRef]
- Kohl, A.L.; Nielsen, R.B. Alkanolamines for Hydrogen Sulfide and Carbon Dioxide Removal. In Gas Purification, 5th ed.; Kohl, A.L., Nielsen, R.B., Eds.; Gulf Professional Publishing: Houston, TX, USA, 1997; pp. 40–186. [Google Scholar]
- Vo, T.T.Q.; Wall, D.M.; Ring, D.; Rajendran, K.; Murphy, J.D. Techno-economic analysis of biogas upgrading via amine scrubber, carbon capture and ex-situ methanation. Appl. Energy 2018, 212, 1191–1202. [Google Scholar] [CrossRef]
- Gong, H.; Chen, Z.; Yu, H.; Wu, W.; Wang, W.; Pang, H.; Du, M. Methane recovery in a combined amine absorption and gas steam boiler as a self-provided system for biogas upgrading. Energy 2018, 157, 744–751. [Google Scholar] [CrossRef]
- Eskandari, M.; Khaksar, S.A.N.; Keshavarz, P. CO2 absorption using benzylamine as absorbent and promoter in a hollow fiber membrane contactor: A numerical study. J. CO2 Util. 2022, 66, 102287. [Google Scholar] [CrossRef]
- Yoo, M.; Han, S.J.; Wee, J.H. Carbon dioxide capture capacity of sodium hydroxide aqueous solution. J. Environ. Manag. 2013, 114, 512–519. [Google Scholar] [CrossRef]
- Grande, C.A. Biofuel’s Engineering Process Technology; dos Santos Bernardes, M.A., Ed.; IntechOpen: Rijeka, Croatia, 2011. [Google Scholar]
- Santos, M.; Grande, C.; Rodrigues, A. Pressure swing adsorption for biogas upgrading. Effect of recycling streams in pressure swing adsorption design. Ind. Eng. Chem. Res. 2010, 50, 974–985. [Google Scholar] [CrossRef]
- Rocha, L.A.M.; Andreassen, K.A.; Grande, C.A. Separation of CO2/CH4 using carbon molecular sieve (CMS) at low and high pressure. Chem. Eng. Sci. 2017, 164, 148–157. [Google Scholar] [CrossRef]
- Augelletti, R.; Conti, M.; Annesini, M.C. Pressure swing adsorption for biogas upgrading. A new process configuration for the separation of biomethane and carbon dioxide. J. Clean. Prod. 2017, 140, 1390–1398. [Google Scholar] [CrossRef]
- Zhao, Q.; Leonhardt, E.; Macconnell, C.; Frear, C.; Chen, S. Purification Technologies for Biogas Generated by Anaerobic Digestion. 2010. Available online: https://www.build-a-biogas-plant.com/PDF/BiogasPurificationTech2010.PDF (accessed on 11 November 2023).
- Ali Abd, A.; Roslee Othman, M. Biogas upgrading to fuel grade methane using pressure swing adsorption: Parametric sensitivity analysis on an industrial scale. Fuel 2022, 308, 121986. [Google Scholar] [CrossRef]
- Vaughn, J.T.; Koros, W.J. Analysis of feed stream acid gas concentration effects on the transport properties and separation performance of polymeric membranes for natural gas sweetening: A comparison between a glassy and rubbery polymer. J. Membr. Sci. 2014, 465, 107–116. [Google Scholar] [CrossRef]
- Baker, R.W. Membrane Technology and Applications; John Wiley & Sons: Hoboken, NJ, USA, 2012. [Google Scholar]
- Chen, X.; Vinh, H.; Ramirez, A.; Rodrigue, D.; Kaliaguine, S. Membrane gas separation technologies for biogas upgrading. RSC Adv. 2015, 5, 24399–24448. [Google Scholar] [CrossRef]
- Schell, W.J.; Wensley, C.G.; Chen, M.S.K.; Venugopal, K.G.; Miller, B.D.; Stuart, J.A. Recent advances in cellulosic membranes for gas separation and pervaporation. Gas Sep. Purif. 1989, 3, 162–169. [Google Scholar] [CrossRef]
- Chatterjee, G.; Houde, A.A.; Stern, S.A. Poly(ether urethane) and poly(ether urethane urea) membranes with high H2S/CH4 selectivity. J. Membr. Sci. 1997, 135, 99–106. [Google Scholar] [CrossRef]
- Lokhandwala, K.A.; Baker, R.W. Sour Gas Treatment Process. U.S. Patent 5,407,467, 18 April 1995. [Google Scholar]
- Zito, P.F.; Brunetti, A.; Barbieri, G. Multi-step membrane process for biogas upgrading. J. Membr. Sci. 2022, 652, 120454. [Google Scholar] [CrossRef]
Disclaimer/Publisher’s Note: The statements, opinions and data contained in all publications are solely those of the individual author(s) and contributor(s) and not of MDPI and/or the editor(s). MDPI and/or the editor(s) disclaim responsibility for any injury to people or property resulting from any ideas, methods, instructions or products referred to in the content. |
© 2025 by the authors. Licensee MDPI, Basel, Switzerland. This article is an open access article distributed under the terms and conditions of the Creative Commons Attribution (CC BY) license (https://creativecommons.org/licenses/by/4.0/).