Abstract
Steroidal pharmaceutical wastewater, such as stock liquid and cell lysate, is conventionally treated at a high cost due to its complex composition and high organic content. To treat steroidal pharmaceutical wastewater, make it harmless, and utilize it as a resource, engineering exploration of large-scale biogas engineering was carried out based on its anaerobic digestion characteristics, and the microbial population in the digestion process was analyzed. The results showed that, at a medium temperature of 35 °C and a total solid percentage of 6.5% ± 0.5%, both stock liquid and cell lysate wastewater could be anaerobically fermented normally, with the potential for anaerobic digestion treatment. The cumulative biogas production of lysate gas from the supernatant could reach 758 mL/gVS, which was significantly better than that of traditional raw materials such as straw and feces. The methane content reached 78.9%, and the total VFAs reached 10,204 mg/L on the ninth day. Moreover, we found that co-digestion of steroidal pharmaceutical wastewater with corn straw (CS) significantly enhanced system stability and biogas production efficiency, with synergistic improvement reaching up to 42%. This approach effectively shortened the lag phase observed in the mono-digestion of steroidal pharmaceutical wastewater. Actual treatment in a large-scale biogas project revealed that, after the addition of two kinds of wastewater, the main and auxiliary reactors presented serious acidification problems. Of these, the total volatile fatty acids in the main reactor reached up to 21,000 mg/L, and the methane content in the biogas production decreased to 25%. Additionally, 16S rRNA high-throughput sequencing analysis showed that, after the addition of steroidal pharmaceutical wastewater, the archaea community in the anaerobic reactor changed significantly due to the stress of changes in the fermentation environment. Euryarchaeota became the absolute dominant bacteria, and the methanogenic pathway also changed to the hydrogen trophic methanogenic pathway with Methanothermobacter as the absolute dominant bacterium. This is the first successful industrial-scale application of biogas engineering for treating steroid wastewater, demonstrating its technical feasibility and energy recovery potential. These research outcomes provide critical engineering parameters and practical experience for large-scale resource recovery from similar wastewater streams, offering important reference values for advancing pharmaceutical wastewater treatment from compliance discharge to energy utilization.
1. Introduction
With the progress of biotechnology and increased attention to health, the pharmaceutical industry has rapidly developed. The global pandemic of the novel coronavirus has also accelerated the development of the industry. Environmental problems caused by pharmaceutical wastewater have also been increasingly emphasized. In China, the total discharge of pharmaceutical wastewater accounts for about 3% of industrial wastewater [1]. Steroids, as pharmaceutical products with a yield second only to antibiotics, are also produced with a large amount of wastewater in the production process, and steroidal pharmaceutical wastewater is characterized by high organic content and complex composition [2]. Currently, the common treatment methods of pharmaceutical wastewater include the coagulation method, adsorption method, membrane bioreactor, up-flow anaerobic sludge blanket, Fenton method, and ozone oxidation method [1]. Although these technologies can remove pollutants from pharmaceutical wastewater to some extent, they are not characterized by sustainable development due to the high cost and low comprehensive interest rate of resources. Steroids are mainly generated by chemical synthesis and microbial transformation in industrial production. Therefore, despite having many raw materials, excipients, and by-products, steroidal pharmaceutical wastewater also exhibits certain biodegradability [3]. At present, steroid wastewater is mostly treated using photo catalysis, advanced oxidation, membrane adsorption, and other methods, but steroid compounds are still continuously accumulated in the environment due to the high treatment cost and low treatment efficiency [4]. It is known that a biopharmaceutical enterprise in Hubei Province, China, discharges over 40 tons of steroid wastewater daily, with off-site treatment costs reaching as high as 20 CNY/ton. The characteristic wastewater streams—stock liquid wastewater (RW) and fermentation cell lysate wastewater (FW)—exhibit high organic content (TS: 5–16%) and elevated ammonia nitrogen levels (11–15 g·L−1) and contain trace methanol (2.5–7.3%), antibiotic residues (60 mg·L−1), and microbial cell wall components.
Anaerobic digestion, as a low-cost and high-value-added organic waste treatment method, has the potential to solve the problem of pharmaceutical wastewater pollution with complex components [5]. Based on anaerobic digestion technology, biogas engineering can not only relieve energy problems but is also an important means of organic waste treatment [6]. As a result, biogas engineering has the comprehensive benefits of producing clean energy, reducing pollution and carbon emissions, and promoting the development of ecological agriculture. Recently, anaerobic digestion has been widely applied in aquaculture wastewater treatment, anaerobic digestion of food waste, and sewage treatment plants, achieving high economic efficiency [7,8]. The rapid development of the biogas engineering industry in recent years has brought new opportunities for the detoxification treatment and resource utilization of various organic wastes.
Existing studies have investigated anaerobic digestion systems for the inactivation/degradation of agricultural residues, pathogenic microorganisms, and antibiotics, as well as microbial tolerance [9], indicating the potential of steroid wastewater for anaerobic treatment toward harmless disposal and resource recovery. However, there is a lack of reliable experimental and engineering data references for treating steroidal pharmaceutical wastewater with biogas engineering [3,10]. The presence of residual antimicrobial substances in wastewater and their potential inhibitory effects on anaerobic microorganisms (particularly methanogens) constitute a critical issue requiring in-depth validation. Furthermore, given the coexisting yet potentially imbalanced characteristics of high organic content (carbon source) and elevated ammonia nitrogen (nitrogen source), another essential concern is whether co-digestion with other organic wastes (such as straw) could optimize the microbial nutritional environment by adjusting the carbon-to-nitrogen ratio (C/N). This approach may enhance the stability and efficiency of the anaerobic fermentation process.
In this study, the anaerobic digestion characteristics of two kinds of pharmaceutical wastewater in the production process of steroids were explored. Then, the feasibility of enhancing fermentation stability and biogas production was further explored through optimized feedstock formulation with C/N ratio adjustment. The engineering exploration of steroidal pharmaceutical wastewater as an anaerobic engineering raw material was carried out through a large biogas engineering project in Xiangyang City, Hubei Province. The microbial populations in the fermentation process, such as bacteria and archaea, were analyzed to provide a theoretical reference. This is the first large-scale biogas engineering demonstration for steroid wastewater treatment, providing critical reference values for the energy-oriented treatment and utilization of pharmaceutical wastewater.
2. Materials and Methods
2.1. Experimental Materials
The inoculated sludge used in the experiment was collected from the biogas fermentation tank of Hubei Green Energy Eco-Tech Co., Ltd., Yicheng, China, and the fermentation raw material was the remaining wastewater from the production of steroids in a biopharmaceutical enterprise in Hubei, including stock liquid wastewater (RW) and fermentation cell lysate wastewater (FW). The RW was the methanol crude extraction wastewater from the front end of the production process, and the fermentation cell lysate supernatant was the wastewater from the biological transformation step at the back end of the process. The RW contained methanol, trace sterols, ammonium dihydrogen phosphate, potassium dihydrogen phosphate, etc., with a chemical oxygen demand (COD) of about 220 g/L. The FW contained Escherichia coli cell lysate, glycerol, ammonium dihydrogen phosphate, potassium dihydrogen phosphate, trace peptones and yeast powder, with a COD of about 110 g/L. The physicochemical properties of the fermentation raw materials and sludge are listed in Table 1.

Table 1.
Physicochemical properties of inoculum and fermentation raw material.
2.2. Experimental Device
The experimental setup consisted of a custom-made batch anaerobic digestion reactor as illustrated in Figure 1. This system primarily included a constant-temperature water bath shaker, a 1 L sealed fermentation bottle equipped with thermometer and pH sensor, a Gasboard-3200 biogas analyzer (Hubei Cubic-Ruiyi, Wuhan, China), and a graduated gas collection bottle. The fermentation temperature was maintained at 35 °C through the water bath system. The fermentation bottle was connected to a water-filled gas collection bottle immersed in the same water bath, enabling biogas production measurement via the water displacement method.
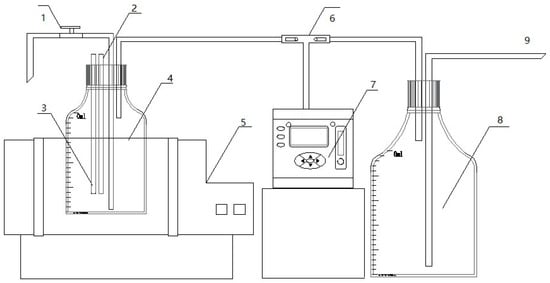
Figure 1.
Anaerobic fermentation experimental device. 1: Three-way control valve; 2: temperature detector; 3: pH detector; 4: anaerobic fermentation reactor; 5: constant-temperature bath oscillator; 6: three-way control valve; 7: gas analyzer; 8: gas cylinder; 9: drain pipe.
The biogas project was located in Liushui Town, Yicheng, Xiangyang City, Hubei Province. There were three phases of the project, with two main and two auxiliary reactors in each phase, and the volume of both the main and auxiliary reactors is 2500 m3, with an effective volume of about 2000 m3 for actual operation. In general, the raw materials were agricultural crop straw, such as wheat, rice, and corn straw. The fermentation raw materials entered the main reactor from the raw material port and stayed fermented in the main reactor. After a period of fermentation, the materials in the main reactor were pumped to the auxiliary reactor for further fermentation, and the total water retention time of the raw materials was 60 days. The biogas produced was collected through a headspace black film, dehydrated and desulfurized, and then incorporated into the natural gas pipe network.
2.3. Experimental Design
Inoculum source and pretreatment: The inoculum used in this study was collected from biogas fermentation tanks of Hubei Green Energy Eco-Tech Co., Ltd. It was sieved through a 10-mesh screen to remove straw and other debris and then diluted with tap water to adjust the total solids (TS) content to 6%.
Reactor configuration (volume, mixing method, monitoring system) and temperature control: The reactors had a total volume of 1 L with 0.8 L working volume. Manual shaking was performed twice daily for mixing. Each reactor was equipped with a pH sensor for continuous monitoring, while liquid samples were collected through three-way valves for VFA analysis. All reactors were maintained in a constant-temperature water bath shaker to ensure stable digestion temperature.
Hydraulic retention time (HRT) and loading rate: This batch study did not involve controlled HRT or loading rate parameters, as these apply specifically to continuous anaerobic digestion systems.
pH adjustment methodology: To accurately evaluate the intrinsic effects of cell wall wastewater and stock solution on anaerobic digestion, no artificial pH adjustment was implemented at any stage, avoiding potential interference with their authentic impacts.
2.3.1. Anaerobic Digestion Test of Steroid Wastewater Alone
To test the anaerobic digestion and gas production characteristics of the RW and FW, the experiment was performed at 35 ± 1 °C. Raw materials: Sludge had a feed/microorganism (F/M) ratio of 2:1, and the actual TS of the fermentation system was 6–7%. The experiment was conducted with four groups: the control group with only sludge (CK); the group with pharmaceutical wastewater (RW); the group with fermented wastewater (FW); and the group with corn straw (CS). Each group had three parallel trials. The CK group served to deduct the biogas production from the sludge itself, while the CS group, using common anaerobic fermentation substrates, helped evaluate the gas production effects of RW and FW groups. Once the fermentation device was filled, the fermentation start time was recorded, and the start time to the same time the following day was recorded as a fermentation day.
2.3.2. Co-Digestion Test of Steroid Wastewater with Corn Straw
Component analysis of cell lysate wastewater and stock solution wastewater showed their C/N ratios were relatively low at 2.39 and 10.5, respectively. However, the optimal C/N ratio for biogas fermentation typically ranges between 20 and 30:1. Therefore, co-digestion with carbon-rich materials such as corn straw (C/N = 40) was required to adjust the carbon–nitrogen ratio. To determine the optimal mixing ratios for each steroid wastewater with corn straw, tests were conducted at different blend proportions. The experimental design is shown in Table 2.
Table 2.
Experimental design for anaerobic co-digestion of cell wall wastewater, mother liquor wastewater, and corn straw.
2.3.3. Engineering Application Testing of Large-Scale Biogas Production
The large-scale biogas facility comprises three operational phases. Each phase contains two main reactors and two auxiliary reactors, all with 2500 m3 total volume and approximately 2000 m3 working volume. The system normally processes agricultural straw (wheat, rice, and corn straw) as primary feedstock. Raw materials enter the main reactor for initial fermentation before being transferred to auxiliary reactors for further processing. Collected biogas undergoes dehydration and desulfurization before pipeline injection.
Phase I testing introduced steroid pharmaceutical wastewater (containing both stock solution and cell lysate wastewater) through the homogenization tank while maintaining regular straw feeding at 25 t/day. Initial wastewater addition (2 t/day) occurred from 25–29 September, followed by a second feeding period from 10–14 October. Continuous monitoring tracked volatile fatty acids, system stability, and biogas production. Due to subsequent system instability, straw feeding was suspended on November 1 while maintaining operational monitoring until process stabilization was achieved.
2.4. Subsection
During the experiment, the parameters to be tested include those related to biogas production, like daily biogas output, cumulative gas production, and methane content in biogas. In addition, there are parameters relevant to the fermentation liquid, such as total volatile fatty acids (VFAs) and total alkalinity (TA). Moreover, data related to the microbial community structure that characterizes the reaction–fermentation system are among the tested parameters.
In order to analyze the relevant situations of anaerobic digestion for biogas production, daily biogas production was measured by the drainage method with daily timed readings, and cumulative biogas production was the sum of the daily biogas production. The methane content was measured using a gas chromatograph SP2100A (BFRL, Beijing, China) with an injection volume of 0.1 mL, injector temperature of 100 °C, oven temperature of 100 °C, detector temperature of 60 °C, and thermal conductivity detector filament temperature of 141 °C.
Parameters related to the fermentation broth were also recorded. VFAs were analyzed using gas chromatography (GC2030, Shimadzu, Tokyo, Japan) with a column SH-PolarD, injector temperature of 150 °C, column temperature of 250 °C, flame ionization detector, hydrogen flow rate of 32 mL/min, air flow rate of 170 mL/min, and tail blowing rate of 32 mL/min. The pH was measured using a pH meter (PHS-3E, Rayleigh Magnet, Shanghai, China). TS and VS were dried at 105 °C and ignited at 600 °C and then calculated via the difference method.
The sludge used to analyze the microbial community structure was collected from the main reactor of the Phase III project and each was taken three times in parallel to ensure the accuracy of the test results. Before sampling, the raw material of the Phase I project was steroidal pharmaceutical wastewater, and the fermented raw material of the Phase II and Phase III projects was CS. High-throughput sequencing of 16S rRNA was used to extract the DNA of microbial samples, and then DNA genomic extraction results were detected using agarose gel electrophoresis. Next, polymerase chain reaction (PCR) amplification (GeneAmp® 9700, ABI, Foster City, CA, USA) was carried out for the specified sequenced regions with primers 338F/806R for bacteria (amplification regions V3–V5) and 334F/915R for archaea (amplification regions V3–V5) [11]. PCR products were quantified using QuantiFluor ™-ST (Promega, Madison, WI, USA). Finally, Miseq libraries were constructed and Miseq sequencing was performed.
2.5. Calculation and Analysis
To quantitatively compare the biogas production potential and kinetic characteristics of traditional CS and pharmaceutical FW and RW, the biogas production potential (BPP) of fermentation raw materials was calculated using Formula (1), and the cumulative biogas was fitted using the Gompertz equation [12]:
where V represents the total biogas volume produced from raw materials under nominal conditions (mL); VS represents the volatile solids of the fermentation raw materials (%); M represents the total mass of fermentation raw materials (g).
where:
Y is the gas produced during fermentation (mL/g);
t is the fermentation time (d);
means the maximum gas produced by the end of fermentation (mL/g);
Rmax is the maximum gas production rate during the fermentation process (mL/g/d);
indicates the fermentation lag phase (d).
The Gompertz equation operates under the following fundamental assumptions: (1) Anaerobic microbial community growth follows a typical sigmoidal pattern. (2) Biogas production rate is proportional to microbial growth rate. (3) Substrates are biodegradable, with any potential inhibitory effects considered to prolong the lag phase without altering the fundamental growth-gas production relationship. (4) Reactors maintain ideal mixing conditions with constant environmental parameters. (5) The system’s maximum biogas potential (Pmax) remains constant.
The fitting procedure utilized nonlinear least-squares regression via Origin 2021 software to optimize Gompertz model parameters (Pmax, Rmax, and λ) through iterative calculations between experimentally measured cumulative biogas production and fermentation time. The coefficient of determination (R2) served as the statistical metric to quantify model fitting quality.
To evaluate the synergistic effects of co-digestion between two pharmaceutical wastewaters and corn straw (CS), the synergistic enhancement efficiency (SEE) under different C/N ratios was calculated using Formula (3):
Vtotal: Maximum biogas yield from co-digestion at a given C/N ratio (mL/gVS);
Pwastewater: Maximum biogas yield from mono-digestion of cell wall wastewater or stock solution wastewater (mL/gVS);
Mwastewater: Dosage of cell wall wastewater or stock solution wastewater in co-digestion trials (g);
VSwastewater: Volatile solids content of the wastewater (%);
PCS: Maximum biogas yield from mono-digestion of corn straw (mL/gVS);
MCS: Dosage of corn straw in co-digestion trials (g);
VSCS: Volatile solids content of corn straw (%).
3. Results and Discussion
3.1. Biogas Production Characteristics of Individual Anaerobic Digestion
3.1.1. Biogas Production
The fermentation periods of RW, FW, and CS were 8, 29, and 20 days, respectively. The cumulative biogas produced was 248, 758, and 191 mL/gVS, respectively, and the average methane content was 77.3%, 78.9%, and 67.7%, respectively, after biogas production was stable. RW containing a large amount of methanol had the shortest fermentation cycle. Moreover, it has been shown that methanol-containing wastewater can be anaerobically digested to remove most of the COD [13], indicating that methanol-containing wastewater can be used for biogas production, and it can be used for rapid biogas production due to the simple structure of methanol. FW had the longest fermentation cycle, probably attributable to raw material characteristics. The main components of E. coli broken cell lysate in FW are lipids and peptidoglycan, and lipids have good gas production potential. Notably, the methane produced per gram of edible oil can be up to 860 mL/g [14]. As a fermentation raw material rich in cellulose hemicellulose, straw has demonstrated potential for use in biogas production [15,16,17,18,19]. At the beginning of fermentation, the biogas production rate of RW increased rapidly and reached 63 mL/(gVS·d) on the first day, further increasing to 96.9 mL/(gVS·d) on the next day. Subsequently, biogas production in the RW group started to decline rapidly and stopped completely on the eighth day. This is because the main organic matter in RW is methanol, which has a simple structure, and methanogenic archaea can reduce it to methane using their own enzymes. CS reached the first peak of biogas production on day 5, 22 mL/(gVS·d), followed by a slow decrease in biogas production rate, and stopped biogas production after day 20, as shown in Figure 2a.
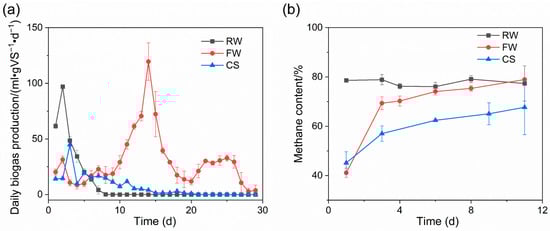
Figure 2.
Biogas production. Daily biogas production (a) and methane content (b).
In terms of the biogas production results of each group, the FW group was notable because the biogas production curve of FW presented three biogas production peaks, near the 2nd day, the 14th day, and the 25th day, respectively. Cell lysate wastewater was from the relative back end of the process and contained small amounts of methanol as well as E. coli cell lysate components, namely lipids and peptidoglycan. It was easy to speculate that the peak biogas production on day 2 was caused by residual methanol from cell lysate wastewater. The highest biogas production peak of 119 mL/(gVS·d) was observed on the 14th day, with biogas production of 595 mL (69.6% of total biogas production), which was the main biogas production stage of FW. It could be speculated from the biogas production during the period that this peak was formed by the most important components in cell lysate wastewater. Therefore, the biogas production peak on the 14th day was most likely formed by lipids. Moreover, according to the characteristics of daily biogas production rate changes around 14 days, the biogas production peak slowly increased in the early stage, increased rapidly near the biogas production peak, and decreased rapidly after reaching the peak, which was in line with the degradation gas production changes of lipids [14]. Quaiyum et al. found that peptidoglycan from E. coli has a low degradation rate [20].
Methane content is an important index to characterize the activity of methanogens and operation stability during biogas fermentation, which are of great significance for production. The methane content of RW reached 78% on the first day, which is in line with the high biogas production of RW on the first day, indicating that the substrate in RW can be rapidly utilized and converted into methane. The methane content in the headspace volume of the fermentation flasks was initially relatively low due to low biogas production and insufficient methane production in the early stages of FW and CS, ultimately becoming stable at about 70% for FW and about 60% for CS, as shown in Figure 2b.
3.1.2. Kinetic Analysis
Anaerobic digestion is a microbial process, and the Gompertz model, as a kinetic model that takes microbial growth processes into account, enables kinetic fitting of a variety of fermentation raw materials, such as pig manure, straw, and chicken manure [21,22]. According to the fitting results of the Gompertz model for the three fermentation materials, the three conditions fit well, as shown in Table 3.
Table 3.
Gompertz model fitting results.
From the experimental results, it was found that the maximum biogas production of RW, FW, and CS were 248, 758, and 191 mL/gVS, respectively. According to the kinetic fitting results, the maximum biogas production of the three was predicted to be 273, 928, and 199 mL/gVS, respectively. RW had higher COD than FW but a lower biogas production rate than that of the latter, indicating that it is less biodegradable than the latter. Despite the complex compositions of RW and FW, these two pharmaceutical wastewaters exhibited better BPP than CS in terms of gas production potential, and thus, the addition of the two raw materials could increase the total fermentation biogas production to some extent.
Moreover, among the three fermentation raw materials, the RW had the highest maximum biogas production rate of 96.7 mL·(gVS · d)–1 with a lag period of only 0.359 days, and the FW had a lag period as long as 3.68 days, despite the maximum biogas production per unit, indicating that microorganisms adapt slowly to the FW with complex components (Figure 3). Therefore, a sudden decline in biogas production due to the impact of FW on the original fermentation flora should be prevented. The content of FW should be increased slowly to improve the adaptability of the biological flora to the raw material, to achieve the goal of treating wastewater while increasing biogas production.
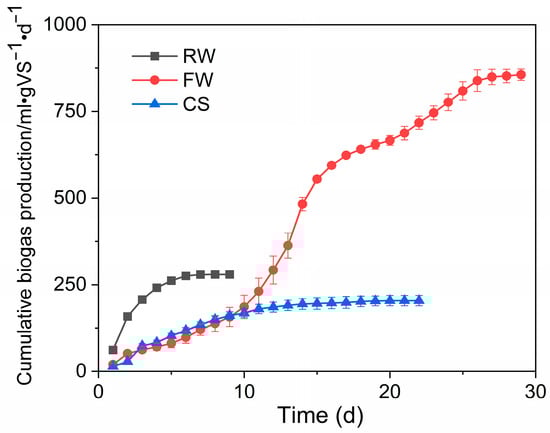
Figure 3.
Cumulative biogas production.
3.1.3. VFAs and TA in the Fermentation System
The stability of the fermentation system is directly related to the ability of the system to produce biogas consistently and stably. The indexes commonly used to measure fermentation stability include pH, total VFAs, and TA. A recent study shows that the total VFAs in an anaerobic fermentation system are stable when the VFAs are lower than 3250 mg/L [23], and some scholars believe that the system is stable when the VFAs are lower than 6000 mg/L [24]. In addition, as scholars have achieved different results on TA, it is believed that a single index is insufficient for measuring the system [25,26]. In fact, the stability of the fermentation system is attributable to acid–base balance, and VFAs/TA is a comprehensive index to evaluate the stability of the fermentation system while taking into account both VFAs and alkalinity.
For FW with the largest fluctuation in biogas production during the fermentation process, the total VFAs exceeded 4897 mg/L (Figure 4) at the beginning of fermentation and even reached 10,204 mg/L on the 9th day but decreased rapidly afterward because the system accelerated the utilization of VFAs and produced biogas. Despite the high total amount of VFAs around day 9, it was impossible to conclude whether there was acid suppression during this period. Combined with VFAs/TA, it was found that this index showed a decreasing trend during fermentation, which was 0.64 at day 9, and the TA of some groups exceeded 0.8. It is suggested that the system is stable and has a strong buffering capacity when this ratio is below 0.4 and the system is not stable enough when the ratio is in the range of 0.4 to 0.8. At this point, the system only has a certain buffering capacity, which decreases when the ratio exceeds 0.8, which is likely to cause system collapse [27]. This indicates that the overall buffering capacity of the fermentation system for FW is limited, and system acid shock due to the addition of these raw materials should be prevented in engineered fermentation.
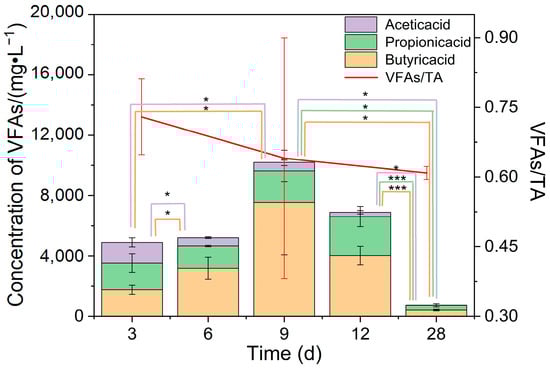
Figure 4.
Total VFAs and VFAs/TA of a fermentation system. * means 0.01 ≤ p < 0.05, and *** means p < 0.001.
3.2. Biogas Production Characteristics of Co-Digestion
3.2.1. Effect of Feedstock Mixing Ratios on Anaerobic Digestion Performance
The biogas production performance of co-digestion systems, mother liquor wastewater with corn straw (RW+CS), and cell wall wastewater with corn straw (FW+CS), under three carbon-to-nitrogen (C/N) ratios (20:1, 25:1, and 30:1), is shown in Figure 5. In the RW+CS system, all groups (RW+CS20, RW+CS25, and RW+CS30) exhibited an 18-day fermentation period, with peak biogas production occurring on day 2 at 52, 38, and 32 mL/(gVS·d), respectively, followed by a gradual decline. The cumulative biogas yields were 313, 280, and 243 mL/gVS, while the average methane content stabilized at 77.7%, 70.6%, and 66.6%, respectively. In contrast, the FW+CS system displayed distinct characteristics with no pronounced peak observed in daily biogas production. Instead, gas output remained relatively stable for the first 10 days before declining slowly. This behavior is attributed to the higher proportion of recalcitrant organics (e.g., lignocellulose and peptidoglycan) in the sycd profile. The cumulative biogas yields for FW+CS20, FW+CS25, and FW+CS30 were 271, 245, and 170 mL/gVS, with stabilized methane contents of 75.7%, 69.4%, and 76.7%, respectively.
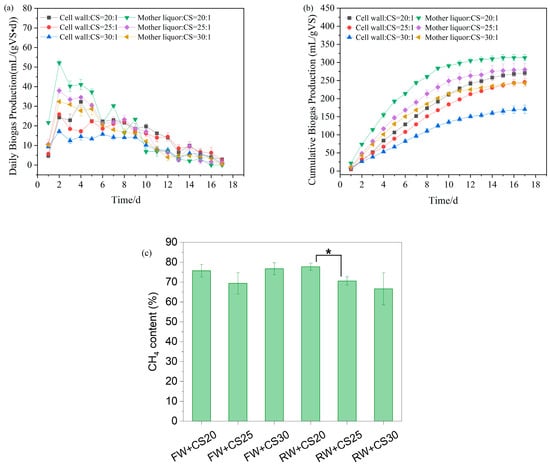
Figure 5.
Biogas production for anaerobic co-digestion. (a) Daily biogas production; (b) cumulative biogas production; and (c) methane content. * means 0.01 ≤ p < 0.05.
Based on kinetic simulations (Table 4), the mixing ratios of cell wall wastewater (FW), mother liquor wastewater (RW), and corn straw (CS) significantly affected anaerobic digestion performance. As the proportion of corn straw increased (C/N ratio rising from 20:1 to 30:1), both systems showed clear decreasing trends in biogas potential (Ppre) and maximum biogas production rate (Rm). In the FW+CS system, the FW+CS20 group achieved the highest Ppre (285 mL/gVS) with Rm reaching 27 mL/(gVS·d), while the FW+CS30 group’s Ppre decreased to 181 mL/gVS and Rm dropped to 16 mL/(gVS·d), representing reductions of 36.5% and 40.7%, respectively. Notably, the lag phase (λ) shortened with increasing straw proportion, decreasing from 1.18 days for FW+CS20 to 0.73 days for FW+CS30, indicating that while higher corn straw ratios reduced overall biogas potential, the readily degradable components (such as water-soluble sugars and hemicellulose) in straw likely accelerated the initial hydrolysis rate [28]. The performance decline was mainly attributed to the increasing prominence of lignin’s recalcitrance in corn straw at higher proportions, which hindered organic matter conversion efficiency [29]. Therefore, for FW-CS co-digestion, lower straw ratios (C/N = 20:1) are more favorable for maintaining higher methane yield and production rates, though this requires accepting longer startup times.
Table 4.
Biogas production and Gompertz kinetic fitting results for co-digestion of cell wall wastewater, mother liquor wastewater, and corn straw.
Similarly to the FW+CS system, the RW+CS system also demonstrated optimal performance at lower corn straw ratios (RW+CS20), achieving a Ppre of 316 mL/gVS and Rm of 42 mL/(gVS·d), both higher than the FW+CS groups at equivalent ratios. As the corn straw proportion increased (C/N ratio from 20:1 to 30:1), RW+CS showed reductions in Ppre to 244 mL/gVS (22.8% decrease) and Rm to 29 mL/(gVS·d) (31.0% decrease). Notably, the lag phase (λ) exhibited an opposite trend compared to the FW system: λ increased from 0.41 days for RW+CS20 to 0.61 days for RW+CS30 with higher straw proportions. The overall superior biogas production performance of RW+CS compared to FW+CS stems from the mother liquor wastewater’s abundance of readily degradable organics (e.g., methanol), which rapidly provide substrates for methanogenesis. Although the primary purpose of adding corn straw was to adjust the high nitrogen content of the mother liquor wastewater through C/N ratio modification, this study reveals that excessive straw (e.g., C/N = 30:1) actually inhibits biogas production. This inhibition likely occurs because high straw proportions dilute the readily available carbon sources in RW while simultaneously prolonging the hydrolysis phase due to straw’s slower degradation characteristics. The extended lag phase (λ increasing from 0.41 to 0.61 days) further supports this interpretation, indicating that higher lignocellulosic content requires longer microbial adaptation time [30]. Therefore, mixing RW with corn straw at C/N = 20:1 achieves the optimal balance between mitigating high nitrogen characteristics and maximizing biogas production efficiency.
3.2.2. Synergistic Enhancement Effects of Co-Digestion on BIOGAS Production Performance
The synergistic enhancement efficiency (SEE, %) was calculated to quantitatively evaluate the improvement in biogas production from mixed feedstocks compared to the weighted average of individual substrates. Positive SEE values indicate synergistic promotion, while negative values reflect inhibitory effects (Figure 6).
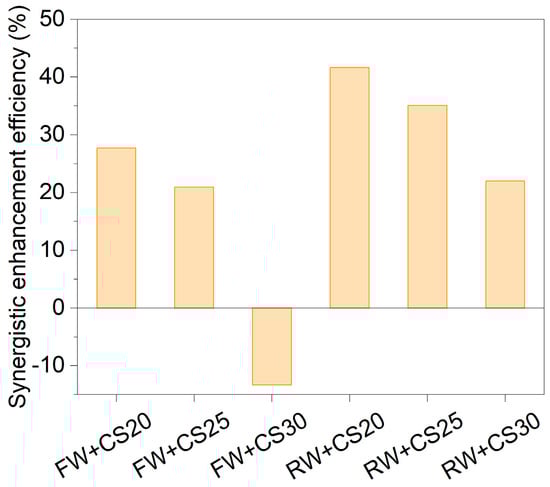
Figure 6.
Synergistic enhancement efficiency of co-digestion on biogas production.
In the FW+CS co-digestion system, appropriate mixing ratios significantly improved anaerobic digestion performance. At C/N ratios of 20:1 (FW+CS20) and 25:1 (FW+CS25), the SEE reached 28% and 21%, respectively, with experimental biogas yields (Pexp) of 271 mL/gVS and 245 mL/gVS —significantly higher than the weighted values (212 mL/gVS and 203 mL/gVS). However, when the ratio increased to 30:1 (FW+CS30), the SEE became negative (−13%) and Pexp (170 mL/gVS) dropped below the weighted value (196 mL/gVS), suggesting potential inhibition or nutrient imbalance at this ratio. The RW+CS system demonstrated more pronounced synergistic effects, showing positive SEE values of 42%, 35%, and 22% at C/N ratios of 20:1, 25:1, and 30:1, respectively, with the peak effect (42%) occurring at C/N = 20:1.
The C/N ratio of 20:1 was optimal for co-digestion of both cell wall wastewater (FW) and mother liquor wastewater (RW) with corn straw (CS). This advantage stems from balanced nutrition and substrate complementarity: the wastewaters provide nitrogen and readily degradable organics, while the straw supplies carbon skeletons and buffering capacity, synergistically optimizing the hydrolysis–methanation chain reaction and significantly shortening the lag phase of straw digestion. However, excessive straw proportions (e.g., C/N = 30:1) may inhibit biogas production due to lignin accumulation or dilution of readily available carbon sources.
3.3. Engineering Operation
Based on the above test results, it is speculated that pharmaceutical wastewater can promote fermentation to a certain extent. Therefore, pharmaceutical wastewater was used as the raw material in the Phase I project for biogas production testing. Steroidal pharmaceutical wastewater (containing both RW and FW) was fed into the homogenization tank first and then fed into the main reactor and auxiliary reactor through the homogenization tank. Under the general working conditions, the straw was fed at 25 tons per day in the Phase I project and fed normally during the addition of steroid wastewater. Steroid wastewater was added initially on 25 September 2021, with a daily feed of approximately 2 tons for five days, and pharmaceutical wastewater was added to the system again on 10 October for five days. Afterward, the VFAs, stability, and biogas production of the fermentation system were continuously monitored. Because of the instability of the fermentation system after feeding, the straw feeding to the fermentation system was stopped on November 1, and the operating conditions were continuously monitored until the fermentation state was restored to a stable state.
In terms of total VFAs and TA (Figure 7a,b), after the first steroid wastewater was added to the fermentation system, the total VFAs of the system accumulated greatly, reaching 20,819 mg/L in the main reactor and 20,530 mg/L in the auxiliary reactor, indicating that the fermentation system is in a serious acidification stage. After stopping feeding to the reactor, the total VFAs in the main and auxiliary reactors gradually decreased to about 12,000 mg/L. Meanwhile, the TA increased continuously, from 5800 mg CaCO3/L in the acidification period to 12,000 mg CaCO3/L, demonstrating that the resistance to acidification of the fermentation system improved. During the addition of steroid wastewater, the pH was maintained between 8.5 and 9. The classical theory holds that acidification inactivates methanogens primarily by lowering the pH below the lower pH limit of methanogenic tolerance (6.0–6.5). However, in this study, there was a significant accumulation of organic acids and a decrease in methanogenic activity, but no decrease in pH, probably because the fermentation system had some buffering properties, and there were still a large number of acid radical ions in the system, despite the neutralization of some of the hydrogen ions. As a result, pH is a relatively weak indicator of system stability. In the actual operation of the project, the VFAs/TA value was maintained below 1.5 when the fermentation system was stable. After steroid wastewater was added to the reaction system, the fermentation system was impacted, and the VFAs/TA increased to more than 3.50, with 3.58 for the main reactor and 3.81 for the auxiliary reactor. During the system recovery period, the system gradually stabilized after 35 days. This indicates that the addition of steroid wastewater caused acidification of the fermentation system, resulting in the instability of the fermentation system.
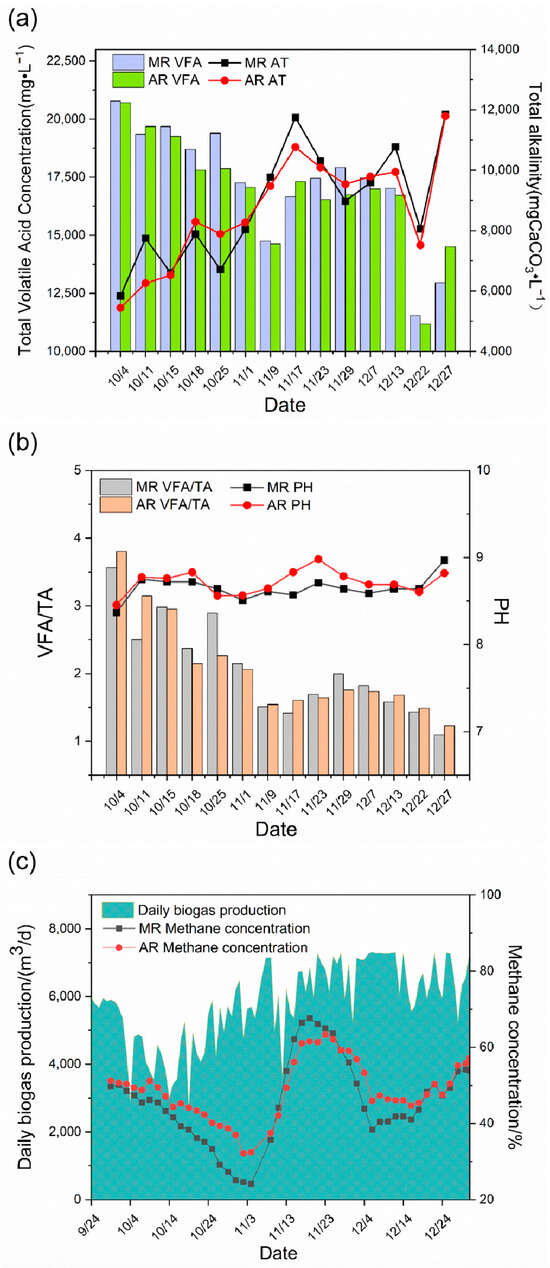
Figure 7.
Changes in acid–base, stability, and methane content in the Phase I project. Change in VFAs and TA (a); stability change of the fermentation system (b); and change in daily biogas production and methane content (c). MR, main reactor; AR, auxiliary reactor.
In terms of biogas production (Figure 7c), after the first addition of steroid wastewater, the methane content began to decrease, reaching the lowest values of 24.17% and 32.47% in both the main and auxiliary reactors on November 4, respectively, and the decrease in methane content directly led to the failure of ignition and start-up of biogas power generated at the end, mainly because the methane content was too low and the biogas calorific value was insufficient. The methane content increased gradually after stopping feeding straw to the fermentation system, and the methane content began to decrease gradually and finally stabilized between 50% and 60% when it first reached 60%. This was because the acidification of the system was relieved after straw feeding was stopped and the methane bacteria began to be active. The methane content gradually decreased and finally stabilized after the raw materials in the fermentation system were exhausted. The daily biogas production suggested that steroid wastewater caused the fermentation system to change. The daily biogas production decreased from the beginning and fluctuated greatly at the same time after the addition of steroid wastewater, probably because steroid wastewater contains liquid wastewater that is easy to ferment. The rapid degradation of such wastewater led to the production of a large number of VFAs that are easy to degrade, such as acetic acid and propionic acid in the system, which are not only the substrates of methane bacteria but also the main substances causing acidification of the system, thus leading to substantial fluctuations in the system. According to the operation process of the project, the main and auxiliary reactors exhibited a certain consistency for VFAs, TA, and methane content, but the auxiliary reactors showed a certain lag. As a result, the stability of the system should be indicated by the main reactor indexes, to prevent problems such as acid–base imbalance in the system.
Acidification emerged as a critical phenomenon in this study, with its underlying mechanism primarily attributed to dual effects induced by exceptionally high ammonia nitrogen concentrations in the wastewater: (1) severe disruption of the carbon-to-nitrogen (C/N) ratio, and (2) specific inhibition of methanogenic archaea by free ammonia. The steroid wastewater employed exhibited extremely high ammonia nitrogen levels (11.75–14.32 g/L) coupled with insufficient readily degradable organic carbon. During anaerobic digestion initiation, hydrolytic–acidogenic bacteria rapidly converted the limited organic matter into volatile fatty acids (VFAs), while the high-ammonia environment exerted strong inhibitory—even toxic—effects on methanogens, directly causing subsequent stagnation of methane production pathways. These combined effects led to rapid VFA accumulation without effective utilization, ultimately triggering system failure. Ammonia nitrogen itself constitutes the most critical inhibitory compound in this study, with clearly demonstrated and dominant mechanistic effects.
3.4. Microbiological Analysis
We used 16S rRNA gene sequencing to investigate the changes in bacterial flora in the Phase I, II and III biogas fermentation tanks, and the results revealed that the colony structure of the second and third fermentation tanks was similar to each other and significantly different from that of the Phase I fermentation tank. High-throughput sequencing results of the nine collected samples showed that an average of 394,820 valid sequences were obtained per sample. The rarefaction curves of observed species approached plateaus (Figure S1), with coverage values all exceeding 0.99 (Table S1), indicating that the sequencing depth was sufficient to capture the majority of species present in the samples. Figure 8 shows the community structure of bacteria at the phylum and genus levels in Phase I, Phase II and Phase III biogas fermentation tanks. At the phylum level, most microorganisms were affiliated with the following four phyla, i.e., Firmicutes, Bacteroidota, Proteobacteria and Synergistota. Under anaerobic conditions, many microorganisms of these phyla exhibit an important role in the hydrolysis and fermentation of macromolecular organic compounds (proteins, carbohydrates, etc.) [31]. Of these, Firmicutes were the dominant microorganisms in the three fermentation tanks, with relative abundance between 64% and 86%. Members of Firmicutes are important hydrolytic/fermentative bacteria that produce extracellular enzymes (i.e., cellulases, lipases, and proteases) and promote the degradation of cellulose, fat, and proteins [32]. Proteobacteria were present in abundances ranging from 2% to 11% of bacteria in the Phase I fermentation tank. As previously reported, many bacteria in proteobacteria are the producers of short-chain fatty acids and can produce acetic acid as their main metabolite during acid production. Bacteroidota accounted for 6% to 10% of the total bacterial abundance in the Phase II and Phase III fermentation tanks, and members of Bacteroidota can decompose a variety of complex organic compounds, such as starch, cellulose, and protein, to produce short-chain fatty acids [33].
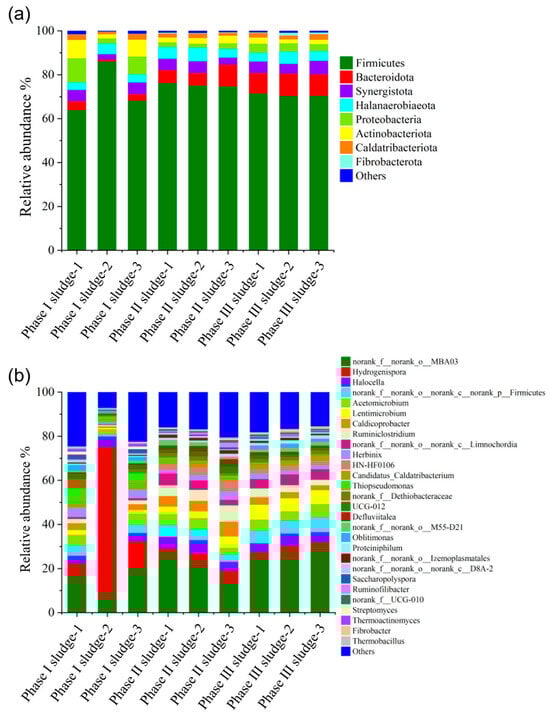
Figure 8.
Distribution of bacterial community in the Phase I, Phase II and Phase III projects. Phylum level (a) and genus level (b).
At the genus level, the bacteria in the Phase I fermentation tank were mainly norank_f__norank_o__MBA03 (7–20%) and Hydrogenispora (6–68%). Norank_f__norank_o__MBA03 can interact with hydrogenophilic methanogens to oxidize organic acids, and Hydrogenispora is an acetogenic bacterium that can ferment carbohydrates such as glucose, maltose, and fructose into acetic acid, ethanol, and H2 [34]. Norank_f__norank_o__MBA03 increased (14–29%), and Hydrogenispora decreased significantly (2–5%) in the Phase II and Phase III fermentation tanks. Lentimicrobium, norank_f__norank_o__norank_c__Limnochordia, Caldicoprobacter, and Ruminiclostridium increased. Of these, Lentimicrobium was an acidogenic bacterium, and the final products of substrate fermentation were mainly acetic acid, propionic acid, formic acid, and H2 [35], and the others were hydrolyzing bacteria, degradable cellulose, and protein [36,37]. In general, bacterial communities in the Phase I fermentation tank did not differ significantly from those in the Phase II and III fermentation tanks, except that the red part of the Phase I sludge-2 was significantly different from the other two parallel parts of the Phase I sludge (Phase I sludge-1 and Phase I sludge-3) and Phase II sludge and Phase III sludge, probably due to the high sludge concentration and uneven sampling. The bacteria in the red part were hydrolytic acidifiers, which contributed to the high VFA content in the Phase I fermentation tank.
The community structure of archaea at the phylum and genus levels in the Phase I, Phase II, and Phase III biogas fermentation tanks is illustrated in Figure 9. At the phylum level, Euryarchaeota was the dominant archaeon in the Phase I fermentation tank, with relative abundances between 88.1% and 93.4%. Halobacterota was the dominant archaeon in the Phase II and Phase III biogas fermentation tanks, with relative abundances ranging from 71.1% to 75.7% and 57.9% to 66.5%, respectively.
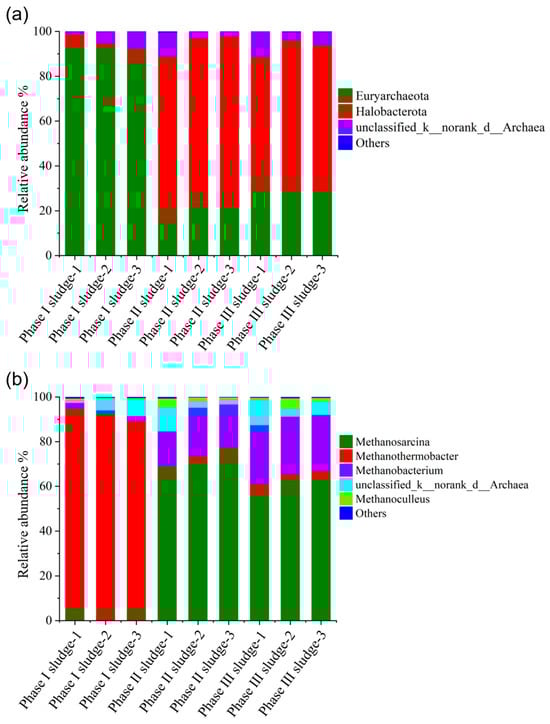
Figure 9.
Distribution of archaeal communities in the Phase I, Phase II, and Phase III fermentation tanks. Phylum level (a) and genus level (b).
At the genus level, Methanothermobacter was the dominant methanogenic archaea in the Phase I fermentation tank, with relative abundances ranging from 85.7% to 90.8%. Methanosarcina and Methanobacterium were the dominant methane-producing archaea in the Phase II and Phase III biogas fermentation tanks. In the Phase II and Phase III biogas fermentation tanks, the relative abundance of Methanosarcina ranged from 67.1% to 70.9% and 56.9% to 63.0%, and that of Methanobacterium ranged from 15.6% to 26.4% and 25.2% to 26.4%, respectively. Methanothermobacter and Methanobacterium are hydrogenophilic methanogens, and Methanosarcina is a methanogen with both acetic acid and hydrogen metabolism, indicating that methane in the Phase I fermentation tank is mainly generated through the hydrogenotrophic methanogenic pathway dominated by Methanothermobacter, and through acid cleavage and a hydrogenophilic approach, these two pathways run in parallel in the Phase II and Phase III fermentation tanks. This difference in methanogenic pathways may be due to the effect of operating conditions on the community structure of methanogens. The cell lysate wastewater and RW that entered the Phase I fermentation tank were a class of easily degradable substances with high ammonia nitrogen (11.75 and 14.32 g/L, respectively), which were susceptible to problems such as ammonia inhibition and acid accumulation. It is generally accepted that more than 70% of methane in biogas is obtained by acetic acid cleavage in the normal biogas fermentation process. However, if the biogas fermentation system is adversely disturbed, such as through ammonia stress and acid accumulation, the hydrogenophilic methanogenic pathway dominates, and the relative abundance of hydrogenophilic methanogens increases significantly [38,39,40], resulting in changes in the methanogenic pathway. In addition, hydrogenotrophic methanogens are more sensitive than acetic acid lysis methanogens and susceptible to external conditions. In addition, high-temperature biogas fermentation is not as stable as mesophilic digestion, so when the feeding changes, hydrogenotrophic methanogen activity is inhibited, ultimately resulting in reduced methane production.
To further quantify the statistical significance of community structure differences across operational phases, PERMANOVA analysis was conducted (Figure S2). The results demonstrated that both bacterial (R2 = 0.59778, p = 0.005) and archaeal communities (R2 = 0.94471, p = 0.01) exhibited significant variation attributable to engineering phases (p < 0.05), confirming that the clustering patterns observed in PCoA plots (i.e., phase-specific sample aggregation) represented statistically significant groupings rather than random variations.
Specifically, Phase I (following pharmaceutical wastewater introduction) showed significant separation from Phases II and III in microbial composition, whereas no marked differences were detected between Phases II and III. This confirms that pharmaceutical wastewater input exerted a substantial impact on microbial community structure in the biogas engineering system.
4. Conclusions
The laboratory scale exploration of the anaerobic digestion characteristics of RW and cell lysate wastewater in steroid production demonstrated that the fermentation cycles of RW and FW were 8 days and 29 days, respectively. Their biogas production rates were 248 mL/gVS and 758 mL/gVS, respectively, both higher than that of CS, which was 191 mL/gVS. Compared to traditional biomass feedstocks such as corn straw (CS), the superior performance of steroid wastewater may be attributed to its inherent characteristics. The cell wall wastewater, derived from later-stage processing, contains trace methanol and Escherichia coli cell wall components (lipids and peptidoglycan). Lipids demonstrate excellent biogas potential, with studies reporting methane yields up to 860 mL/g for edible oils [14]. Conversely, the recalcitrance of lignin impedes organic matter conversion efficiency.
However, the large-scale biogas engineering operation results showed that adding a large amount of steroidal pharmaceutical wastewater at once would cause an acid impact and inhibition to the system. After the system was stabilized by stopping the feed reactor, the VFAs/TA was below 1.5 and VFAs remained at 12,000 mg/L.
Microbial population analysis of each reactor indicated that under the environmental pressure of steroidal pharmaceutical wastewater, the main difference in the microbial community between the Phase I reactor and the Phase II and Phase III reactors was in the archaeal community structure. The methanogenic pathway in the Phase I reactor under environmental stress shifted to the hydrogenotrophic methanogenic pathway with Thermobacter as the dominant genus.
Furthermore, a more in-depth study will be conducted on the fate and destination of steroidal compounds. This will provide more comprehensive insights into the behavior of these compounds within the system and their potential impacts on the overall process.
This study did not conduct detailed investigations on the quantification of steroidal compounds or their degradation pathways during anaerobic digestion, which will be addressed in future work. Regarding acidification prevention, potential measures include controlling single-dose loading of steroid wastewater, increasing feeding frequency, or implementing preliminary hydrolysis/fermentation of steroid wastewater mixed with straw prior to anaerobic digestion. Additionally, we recommend enhanced monitoring of key parameters in the anaerobic fermentation process—including VFA concentration/composition, alkalinity, and FOS/TAC ratio—to enable early prediction and prevention of acidification-induced instability. These aspects will be further investigated in subsequent studies.
Furthermore, a more in-depth study on the fate and destination of steroidal compounds will provide more comprehensive insights into the behavior of these compounds within the system and their potential impacts on the overall process. Additionally, studies on the microbial community could help in understanding how to maintain a stable methanogenic pathway under stress conditions. It would also be beneficial to explore ways to enhance the performance of the anaerobic digestion system, for example, by investigating the potential of adding specific additives or modifying the reactor design based on the unique characteristics of steroidal pharmaceutical wastewater.
Supplementary Materials
The following supporting information can be downloaded at: https://www.mdpi.com/article/10.3390/en18215555/s1, Supplementary Materials 1: Figure S1: Rarefaction curves of bacterial and archaeal communities in Phase I, II, and III biogas engineering systems; Figure S2: Principal coordinate analysis (PCoA) of microbial communities in Phase I, II, and III biogas engineering systems; Table S1: Alpha diversity indices of microbial communities within Phase I, II, and III biogas engineering systems. Supplementary Materials 2: The raw data.
Author Contributions
Conceptualization, J.Y. and X.C.; Data curation, W.L.; Formal analysis, X.C.; Investigation, Y.Z.; Methodology, W.X.; Project administration, Y.Z.; Resources, W.X.; Supervision, J.Y.; Validation, W.L.; Visualization, Y.Z.; Writing—original draft, Y.Z.; Writing—review and editing, Y.Z. All authors have read and agreed to the published version of the manuscript.
Funding
This research was funded by Special Science and Technology Cooperation Project of Hubei Province Chinese Academy of Sciences (20180107).
Data Availability Statement
The raw data are supplied in the Supplementary Materials.
Acknowledgments
We would like to thank all the colleagues and students who participated in this project.
Conflicts of Interest
Authors Yuzhou Zhang and Wei Xiong was employed by the company Hubei Green Energy Eco-Tech Co., Ltd. The remaining authors declare that the research was conducted in the absence of any commercial or financial relationships that could be construed as a potential conflict of interest.
References
- Zhan, G.W. Research Progress of Pharmaceutical Wastewater Treatment Technology. Biol. Chem. Eng. 2021, 7, 169–171. [Google Scholar]
- Liu, M. Water pollution analysis and pollution prevention measures in environmental impact assessment of pharmaceutical industry. Environ. Dev. 2019, 31, 14–16. [Google Scholar]
- Yang, F.; Min, Y.; Liu, X.Y.; Rao, B.; Wang, K.M.; Yang, Z.W. Advances in microbial transformation and catabolic mechanism of steroid compounds. Microbiol. China 2019, 46, 2743–2762. [Google Scholar]
- Almazrouei, B.; Islayem, D.; Alskafi, F.; Catacutan, M.K.; Amna, R.; Nasrat, S.; Sizirici, B.; Yildiz, I. Steroid hormones in wastewater: Sources, treatments, environmental risks, and regulations. Emerg. Contam. 2023, 9, 100210. [Google Scholar] [CrossRef]
- Zeng, T.; Yu, M.D.; Jiang, H.; Yang, L.H.; Luo, L.L.; Song, S. Ozonation-hydrolysis acidification-anaerobic digestion-a/o process for treatment of pharmaceutical wastewater. China Water Wastewater 2017, 32, 99–101. [Google Scholar]
- Wu, Y.Y.; Chang, X.N.; Zhang, J.W. Environmental Emission Evaluation for Straw Biogas Power Generation and Bio-natural Gas Preparation Based on LCA Method. China Biogas 2020, 38, 59–65. [Google Scholar]
- Ruffino, B.; Campo, G.; Genon, G.; Lorenzi, E.; Novarino, D.; Scibilia, G.; Zanetti, M. Improvement of anaerobic digestion of sewage sludge in a wastewater treatment plant by means of mechanical and thermal pre-treatments: Performance, energy and economical assessment. Bioresour. Technol. 2015, 175, 298–308. [Google Scholar] [CrossRef]
- Miao, Y.Y.; Gao, M.; Wu, C.F.; Ren, Y.Y.; Ma, X.X.; Wang, Q.H. Methane production performance of semi-continuous alcoholization/acidification type two-phase anaerobic digestion. Trans. Chin. Soc. Agric. Eng. 2019, 35, 229–234. [Google Scholar]
- Qayyum, S.; Tahir, A.; Mian, A.H.; Zeb, S.; Siddiqui, M.F.; Rehman, B. Optimizing biogas production through anaerobic digestion: Transforming food waste and agricultural residues into renewable energy within a circular economy paradigm. Biomass Convers. Biorefin. 2024. [Google Scholar] [CrossRef]
- Azizan, N.A.Z.; Yuzir, A.; Abdullah, N. Pharmaceutical compounds in anaerobic digestion: A review on the removals and effect to the process performance. J. Environ. Chem. Eng. 2021, 9, 105926. [Google Scholar] [CrossRef]
- Tian, T.; Qiao, S.; Yu, C.; Zhou, J. Bio-electrochemically assisting low-temperature anaerobic digestion of low-organic strength wastewater. Chem. Eng. J. 2018, 335, 657–664. [Google Scholar] [CrossRef]
- Siripatana, C.; Jijai, S.; Kongjan, P. Analysis and extension of Gompertz-type and Monod-type equations for estimation of design parameters from batch anaerobic digestion experiments. AIP Conf. Proc. 2016, 1775, 030079. [Google Scholar] [CrossRef]
- Paulo, P.; Jiang, B.; Rebac, S.; Pol, L.; Lettinga, G. Thermophilic anaerobic digestion of methanol in UASB reactor. Water Sci. Technol. 2001, 44, 129–136. [Google Scholar] [CrossRef]
- Song, Y.P.; Liu, J.B.; Chen, M.X.; Zheng, J.X.; Gui, S.L.; Wei, Y.S. Analysis of restrictive factors of methane conversion based on organic composition in dry anaerobic digestion of food waste. Chin. J. Environ. Eng. 2021, 15, 1697–1707. [Google Scholar] [CrossRef]
- Yu, Q.; Liu, R.H.; Li, K.; Ma, R.J. A review of crop straw pretreatment methods for biogas production by anaerobic digestion in China. Renew. Sustain. Energy Rev. 2019, 107, 51–58. [Google Scholar] [CrossRef]
- Ma, S.S.; Wang, H.L.; Li, L.R.; Gu, X.H.; Zhu, W.B. Enhanced biomethane production from corn straw by a novel anaerobic digestion strategy with mechanochemical pretreatment. Renew. Sust. Energy Rev. 2021, 146, 111099. [Google Scholar] [CrossRef]
- Guan, R.L.; Yuan, H.R.; Yuan, S.; Yan, B.B.; Zuo, X.Y.; Chen, X.T.; Li, X. Current Development and Perspectives of Anaerobic Bioconversion of Crop Stalks to Biogas: A review. Bioresour. Technol. 2021, 349, 126615. [Google Scholar] [CrossRef] [PubMed]
- Memon, M.J.; Memon, A.R. Wheat Straw Optimization via its Efficient Pretreatment for Improved Biogas Production. Civ. Eng. J. 2020, 6, 1056–1063. [Google Scholar] [CrossRef]
- Zhu, X.P.; Yellezuome, D.; Liu, R.H.; Wang, Z.Z.; Liu, X. Effects of co-digestion of food waste, corn straw and chicken manure in two-stage anaerobic digestion on trace element bioavailability and microbial community composition. Bioresour. Technol. 2022, 346, 126625. [Google Scholar] [CrossRef]
- Quaiyum, S.; Igarashi, K.; Narihiro, T.; Kato, S. Microbial Community Analysis of Anaerobic Enrichment Cultures Supplemented with Bacterial Peptidoglycan as the Sole Substrate. Microbes Environ. 2020, 35, 193. [Google Scholar] [CrossRef] [PubMed]
- Wang, D.; Wu, B.; Ai, P.; Xin, Y.; He, M.; Zhang, Y. Effect of Two-step Pretreatment on Enzymatic Hydrolysis and Biogas Fermentation of Anaerobically Digested Fiber from VFAs Production. Trans. Chin. Soc. Agric. Eng. 2018, 49, 322–327. [Google Scholar] [CrossRef]
- Dong, R.J.; Zhang, Z.J.; Liu, S.; Ma, Y.F.; Liu, S. Effects of hydrothermal pretreatments on the anaerobic digestion of pig manure and ecological safety of biogas slurry. Trans. Chin. Soc. Agric. Eng. 2022, 38, 193–203. [Google Scholar] [CrossRef]
- Ferrer, I.; Vázquez, F.; Font, X. Long term operation of a thermophilic anaerobic reactor: Process stability and efficiency at decreasing sludge retention time. Bioresour. Technol. 2010, 101, 2972–2980. [Google Scholar] [CrossRef]
- Hu, Y.Y.; Wu, J.; Li, H.Z.; Poncin, S.; Wang, K.J.; Zuo, J.E. Study of an enhanced dry anaerobic digestion of swine manure: Performance and microbial community property. Bioresour. Technol. 2019, 282, 353–360. [Google Scholar] [CrossRef]
- Le Hyaric, R.; Canler, J.-P.; Barillon, B.; Naquin, P.; Gourdon, R. Pilot-scale anaerobic digestion of screenings from wastewater treatment plants. Bioresour. Technol. 2010, 101, 9006–9011. [Google Scholar] [CrossRef] [PubMed]
- Deng, Y.; Ruan, W.D.; Huang, Z.; Miao, H.P.; Zhao, M.; Shi, W. High Solid-state Digestion of Rice Straw and Changes of Methanogens in Horizontal Anaerobic Reactor. Trans. Chin. Soc. Agric. Eng. 2017, 48, 272–279. [Google Scholar] [CrossRef]
- He, Q.; Li, L.; Peng, S.; Zhao, X.; Qu, L.; Wang, X.; Peng, X. Research and Design of Process Stability Detection System in Anaerobic Digestion of Food Wastes. Chin. Environ. Sci. 2017, 37, 1040–1050. [Google Scholar]
- Liu, J.; Zuo, X.; Peng, K.; He, R.; Yang, L.; Liu, R. Biogas and volatile fatty acid production during anaerobic digestion of straw, cellulose, and hemicellulose with analysis of microbial communities and functions. Appl. Biochem. Biotechnol. 2022, 194, 762–782. [Google Scholar] [CrossRef]
- Rahmani, A.M.; Gahlot, P.; Moustakas, K.; Kazmi, A.A.; Ojha, C.S.P.; Tyagi, V.K. Pretreatment methods to enhance solubilization and anaerobic biodegradability of lignocellulosic biomass (wheat straw): Progress and challenges. Fuel 2022, 319, 123726. [Google Scholar] [CrossRef]
- Xu, Z.; Yuan, H.; Li, X. Anaerobic bioconversion efficiency of rice straw in continuously stirred tank reactor systems applying longer hydraulic retention time and higher load: One-stage vs. Two-stage. Bioresour. Technol. 2021, 321, 124206. [Google Scholar] [CrossRef] [PubMed]
- Fan, C.Z.; Zhou, M.; Tang, X.; Zeng, G.M.; Xu, Q.X.; Song, B.; Gong, R.; Zhang, B.; Xiong, W.; Lu, Y.; et al. Triclosan enhances short-chain fatty acid production from sludge fermentation by elevating transcriptional activity of acidogenesis bacteria. Chem. Eng. J. 2020, 384, 123285. [Google Scholar] [CrossRef]
- Pang, H.L.; Ma, W.W.; He, J.G.; Pan, X.L.; Ma, Y.Q.; Guo, D.B.; Yan, Z.; Nan, J. Hydrolase activity and microbial community dynamic shift related to the lack in multivalent cations during cation exchange resin-enhanced anaerobic fermentation of waste activated sludge. J. Hazard. Mater. 2020, 398, 122930. [Google Scholar] [CrossRef]
- Banach, A.; Ciesielski, S.; Bacza, T.; Pieczykolan, M.; Ziembińska-Buczyńska, A. Microbial community composition and methanogens’ biodiversity during a temperature shift in a methane fermentation chamber. Environ. Technol. 2019, 40, 3252–3263. [Google Scholar] [CrossRef] [PubMed]
- Kang, Y.R.; Su, Y.; Wang, J.; Chu, Y.X.; Tian, G.M.; He, R. Effects of different pretreatment methods on biogas production and microbial community in anaerobic digestion of wheat straw. Environ. Sci. Pollut. 2021, 28, 51772–51785. [Google Scholar] [CrossRef] [PubMed]
- Zhang, F.; Zhang, W.; Qian, D.K.; Dai, K.; van Loosdrecht, M.C.M.; Zeng, R.J. Synergetic alginate conversion by a microbial consortium of hydrolytic bacteria and methanogens. Water Res. 2019, 163, 114892. [Google Scholar] [CrossRef]
- Wang, Y.Y.; Zhang, J.X.; Sun, Y.B.; Yu, J.D.; Zheng, Z.H.; Li, S.Y.; Cui, Z.; Hao, J.; Li, G. Effects of intermittent mixing mode on solid state anaerobic digestion of agricultural wastes. Chemosphere 2020, 248, 126055. [Google Scholar] [CrossRef] [PubMed]
- Adekunle, K.F.; Okolie, J.A. A review of biochemical process of anaerobic digestion. Adv. Biosci. Biotechnol. 2015, 6, 205–212. [Google Scholar] [CrossRef]
- Riya, S.; Suzuki, K.; Terada, A.; Hosomi, M.; Zhou, S.; Ruffino, B. Influence of C/N Ratio on Performance and Microbial Community Structure of Dry-Thermophilic Anaerobic Co-Digestion of Swine Manure and Rice Straw. J. Med. Bioeng. 2016, 5, 11–14. [Google Scholar] [CrossRef][Green Version]
- Kurade, M.B.; Saha, S.; Salama, E.-S.; Patil, S.M.; Govindwar, S.P.; Jeon, B.-H. Acetoclastic methanogenesis led by Methanosarcina in anaerobic co-digestion of fats, oil and grease for enhanced production of methane. Bioresour. Technol. 2019, 272, 351–359. [Google Scholar] [CrossRef]
- He, Z.W.; Liu, W.Z.; Tang, C.C.; Liang, B.; Zhou, A.J.; Chen, F.; Ren, Y.-X.; Wang, A.-J. Responses of anaerobic digestion of waste activated sludge to long-term stress of benzalkonium chlorides: Insights to extracellular polymeric substances and microbial communities. Sci. Total Environ. 2021, 796, 148957. [Google Scholar] [CrossRef]


Disclaimer/Publisher’s Note: The statements, opinions and data contained in all publications are solely those of the individual author(s) and contributor(s) and not of MDPI and/or the editor(s). MDPI and/or the editor(s) disclaim responsibility for any injury to people or property resulting from any ideas, methods, instructions or products referred to in the content. |
© 2025 by the authors. Licensee MDPI, Basel, Switzerland. This article is an open access article distributed under the terms and conditions of the Creative Commons Attribution (CC BY) license (https://creativecommons.org/licenses/by/4.0/).