Abstract
Electrification of transport is advancing, yet debate continues over whether battery electric vehicles (EVs) are a like-for-like and affordable alternative to internal-combustion engine (ICE) cars. Positioned in a rapidly evolving mainstream market, this study examines structural similarity and relative pricing of EVs versus ICE models available in Poland in 2025. Data on 373 base passenger-car models (excluding hybrids) were analyzed using two clustering methods: k-means and k-medoids. The optimal number of clusters was determined by 23 validity indices, identifying three clusters. The significance of mean price differences between EVs and non-EVs within the specified clusters was tested using a permutation test. Results indicate no statistically meaningful EV price premium within clusters: no EV price exceeded two standard deviations above its cluster mean, and no cluster consisted exclusively of EVs, which points to strong technical similarity across powertrains. Additionally, permutation tests indicated no differences within clusters, except in the cluster with the best technical parameters, where non-EV cars were more expensive, which suggests that the premium segment of the market continues to be dominated by combustion cars. These findings, which show that electric vehicles are price-comparable to non-EVs, challenge the perception that EVs are systematically more expensive and demonstrate that, within market segments defined by technical characteristics. Therefore, the evidence suggests that EVs are becoming a genuine competitive alternative to ICE cars in the Polish market.
1. Introduction
The automotive sector is both a key pillar of the global economy and a major contributor to anthropogenic greenhouse gas emissions, accounting for about 14% of the total and increasing by 2% annually since 1990 [1]. For decades, the market was dominated by internal combustion engine (ICE) vehicles, whose rapid technological development delayed the widespread adoption of alternative propulsion solutions [2]. Although certain initiatives aimed at reducing the negative environmental impact of transport emerged—such as the implementation of AdBlue technology in diesel engines, introduced in response to stricter Euro VI standards on NOx, CO, HC, and PM emissions in force since 2014 [3,4]—until recently, sustainability concerns remained largely peripheral to public and industry debates.
A turning point came with the growing pressure from international organizations and the need to implement commitments arising from global climate agreements, such as the Paris Agreement and the EU’s legislative package Fit for 55 [5,6]. In light of increasing environmental awareness and regulatory requirements, the automotive industry embarked on a process of transformation toward more sustainable production and vehicle use models. A central element of this shift has been the electrification of transport [7], seen not only as a response to environmental challenges but also as an expression of corporate responsibility and alignment with Environmental, Social, and Governance (ESG) goals [8].
Electric vehicles (EVs) have come to be regarded as a key instrument in sustainable transport policy [9], as the conversion from ICEs to EVs can accelerate the transformation of transport in a more resource-efficient manner [10]. Both environmental and reputational factors contributed to the growing popularity of EVs—a critical turning point was the Volkswagen emissions scandal, widely known as “Dieselgate”. This scandal revealed not only systemic failures in corporate ethics but also the lack of effective oversight and internal control mechanisms in one of the world’s most reputable automotive firms, revealing weaknesses in environmental scanning, strategic decision-making, reputation management, and crisis communication, while undermining trust in combustion car manufacturers [11,12]. It had a profound impact on four key dimensions: consumers, corporate image, company strategy, and government action.
The interplay of these factors accelerated the transformation of the automotive market [13]. It was only in recent years, with substantial investment co-financed by the European Union (such as the Green eMotion project, aimed at knowledge exchange, solution standardization, and facilitating EV adoption across member states, have barriers to e-mobility development begun to be systematically dismantled. In Poland, this development has been supported by the National Fund for Environmental Protection and Water Management (NFOŚiGW) and the Ministry of Climate and Environment (MKiŚ), which launched the program NaszEauto (previously known as Mój Elektryk), allocating PLN 1.6 billion from the National Recovery and Resilience Plan to subsidies for EV purchases, leasing, and long-term rentals [14]. As a result, the share of EVs in new registrations has been steadily increasing—in the EU, the number of newly registered EVs reached 185,000 in December 2024, a 1% increase compared to the same period in the previous year, raising their share in total new car sales to 18% [15]. In Poland, 1739 new EVs were registered in December 2024, marking a 47% increase compared to the previous month and a 1.9% increase relative to December 2023 [16]. This underscores the growing relevance of the Polish EV market and its potential for empirical research [17].
Despite these dynamic developments, few studies simultaneously examine both the technical characteristics and price positioning of EVs and ICE vehicles currently available on the market. Electric vehicles continue to be widely perceived as inherently less affordable than their internal combustion counterparts, and this persistent perception of high upfront costs constitutes a major barrier to adoption, reinforcing doubts about their mainstream economic viability [18,19,20]. This article challenges this assumption by identifying structural similarities between vehicles using a data-driven clustering method, and subsequently comparing their prices within technically homogeneous groups. The literature reviewed does not provide evidence of this approach being applied in the given context, which highlights a research gap that the present study seeks to address.
The aim of the study is to examine structural similarity and relative pricing of EVs versus ICE models available in Poland in 2025. The following research questions were formulated:
- To what extent can distinct clusters of passenger cars on the Polish market be identified?
- What technical characteristics define each cluster?
- Do significant price differences exist between vehicles belonging to different clusters?
The structure of the article is as follows: Section 2 provides a literature review on both the characteristics of EVs and their role in achieving sustainability goals. Section 3 presents the research methodology, including the analytical framework and dataset description. Section 4 discusses the clustering results and the comparative analysis between clusters. The paper ends with a discussion and conclusions.
2. Literature Review
EVs are widely recognized as an effective means to reduce CO2 emissions [21]. However, their emissions of NOx, N2O, SOx, and PM10 may be elevated depending on the energy mix used for electricity generation. When electricity is generated from fossil fuels, emissions can increase, whereas the use of renewable energy sources (RES) significantly improves the emission balance of EVs [22,23]. When considering only primary PM10 emissions during vehicle operation, EVs may emit up to 10% more particles than ICE vehicles [24]. This is particularly the case when they are equipped with Non-Asbestos Organic (NAO-type) brake pads. Therefore, a comprehensive life cycle assessment (LCA) is essential, as it shows that the emission reduction potential of EVs depends primarily on the energy mix and climatic conditions [21,25]. LCA analyses also indicate that EV manufacturing processes are associated with increased human toxicity potential due to intensive use of metals, chemicals, and energy [26,27].
The main challenges for EVs include limited driving range, often attributed to insufficient charging infrastructure and the relatively high mass of EVs, the limited availability of truck models, and the impact of axle loads on road surfaces [25]. Consequently, one of the prevailing trends is to maximize efficiency through weight reduction strategies [28]. Key barriers include also low consumer awareness [29] and persistent misconceptions about EVs [30]. Investments in charging infrastructure and regulatory support from governments are critical to increasing EV availability and improving transport system efficiency.
The conversion of ICE vehicles to EVs significantly improves stability and handling due to a lower center of gravity and a more favorable weight distribution. Additional enhancements, such as a wider track, stiffer stabilizers, better tires, and advanced traction control systems, can further improve on-road performance. Nevertheless, empirical evidence suggets that EVs carry a higher risk profile than ICE vehicles, as EV drivers have been found to be more frequently involved in at-fault collisions. Logistic regression analysis by McDonnell [31] confirms statistically significant differences in risk between EVs and ICEs. The resulting damages, combined with high battery costs, represent a considerable financial burden. Without support from manufacturers, governments, and infrastructure policies, the increased risk and costs may hinder EV adoption. Driving style, such as rapid acceleration or high-speed driving, also reduces EV efficiency [32].
EV charging systems can impact grid power quality, requiring coordinated charging management—a phenomenon not observed with combustion vehicles [22]. Different battery types vary in energy density, charging speed, and durability. For example, lithium-ion batteries can be charged using simple, inexpensive methods, or through advanced technologies that account for cell aging and require more complex control systems [33]. The battery’s state of charge (SoC) directly influences vehicle performance—at low charge levels, performance may decrease [32]. In the future, traditional silicon-based components are expected to be replaced by silicon carbide (SiC) systems, reducing charger weight and size [33]. Driving style significantly influences EV range—aggressive driving can reduce range by up to 30% compared to gentle driving [34]. The pace of EV reliability improvement already surpasses ICEs—each new production year reduces breakdown risk by 12%, compared to 6.7% for gasoline cars [35].
Charging costs for EVs vary depending on the location and type of charger used -home charging is cheaper than commercial solutions and charging efficiency (accounting for energy losses as heat during charging) ranges from 80% to 99%, depending on charger type. Fuel losses in ICE vehicles mainly result from evaporation and spillage, but are more difficult to estimate precisely—data suggest losses ranging from 0.004% to 3% across different U.S. states [36]. With fast charging, annual EV expenses rise, reducing cost-effectiveness [37]. Charging beyond 80% SoC significantly increases energy losses due to reduced charging efficiency compared to the recommended 20–80% range. Kostopoulos, Spyropoulos, and Kaldellis [38] found that after 1000 km of driving, EVs were found to consume, on average, 2 kWh/100 km more than indicated by onboard computer systems. The highest kilometers per hour of charging are obtained within the 20–80% range. ICE vehicles, on the other hand, require more frequent and costly maintenance, such as oil and filter changes. While they are less capital-intensive at purchase, they generate higher financial and environmental costs in the long run [23]. Despite higher upfront costs, EVs offer long-term total cost of ownership (TCO) savings [39].
Although EVs offer significant environmental benefits, they still face barriers related to battery durability, charging infrastructure availability, and high upfront costs [40]. Consumer preferences are highly sensitive to these factors. Battery warranty has been identified as a particularly influential factor, while younger consumers value incentives that reduce operating costs (e.g., purchase cost transparency) or improve convenience (e.g., time-driving convenience) [41]. Price awareness remains one of the main determinants of EV purchase intentions. Consumers often perceive EVs as expensive, even when their technical parameters are comparable to ICEs [42]. However, Liu et al. [43] found that due to lower fuel and service costs, EVs can achieve cost parity with ICEs within five years of purchase under typical usage conditions. Tu & Yang [44] argue that when consumers perceive electric vehicles as offering greater benefits or when they view their use as simpler and more convenient, they tend to exhibit a more positive attitude toward purchasing them. He et al. [45] further emphasize the role of commercial charging availability, perceived driving range, environmental awareness, and prior EV experience.
According to the IEA [46], EV markets are currently dominated by SUVs—accounting for 60% of sales in China and Europe, and an even greater share in the United States. Although SUVs require larger batteries and more raw materials, in 2022 they still helped avoid the consumption of 150,000 barrels of oil per day. In the same year, demand for lithium-ion batteries rose by 65%. EVs account for 60% of global lithium demand, 30% of cobalt demand, and 10% of nickel demand. EV and battery production is highly concentrated in China, which in 2022 accounted for 35% of exported EVs worldwide. By August 2025, the total number of electric passenger (M1) and light commercial vehicles (N1) in Poland exceeded 95,000, including more than 11,000 newly registered units [47].
3. Materials and Methods
The foundation of the study was the segmentation of passenger cars available on the Polish market, based on their technical specifications. The next step was to assess whether vehicles with different types of fuel—gasoline, diesel, gasoline with LPG installation, and electric (EV)—are assigned to distinct clusters and whether significant price differences exist between them. Hybrid vehicles—both hybrid electric vehicles (HEVs) and plug-in hybrid electric vehicles (PHEVs)—were excluded from the analysis, as their dual powertrain systems combine elements of both EVs and ICE vehicles, which could blur classification boundaries and confound the interpretation of structural similarities between fully electric and fully combustion-based models.
The selection of technical variables used for clustering is presented in Table 1. Other attributes, such as drivetrain configuration or gearbox type, were excluded due to their strong correlation with engine characteristics, which would introduce redundancy into the analysis.

Table 1.
Variables included in the clustering analysis.
The dataset reflects car catalogues available on the Polish market in the second quarter of 2025. Each observation in the dataset corresponds to a specific engine variant of a given model, as powertrain configuration constitutes a fundamental dimension of differentiation in the study. To ensure a meaningful comparison of availability and price competitiveness between EVs and ICE vehicles, only the cheapest version of each model was selected for further analysis. This approach allowed the study to focus on the basic accessibility of cars for consumers, thereby eliminating the confounding effect of optional equipment, which can significantly increase the price but does not directly affect the core technical characteristics analyzed in the study. The final dataset included 373 unique vehicles. All variables used in the analysis had full coverage in the manufacturers’ catalogues. A detailed description of the structure of individual variables is presented in Table 2.
Table 2.
Descriptive statistics of technical variables.
Particular attention should be paid to the variable Price, whose mean (EUR 61,156) and median (EUR 44,447) differ substantially, indicating strong right-skewness. This is the result of the presence of expensive luxury vehicles, which raise the average level even when only the basic equipment versions of each model are considered. This phenomenon will be discussed in more detail in the subsequent parts of the article. Price was excluded as a variable in the clustering procedure but was used for comparing the obtained groups. Therefore, in the further analysis, it was treated as a dependent variable in statistical tests to verify whether the technical clustering also differentiates price levels.
In the context of variable selection for cluster analysis, the level of variability is of particular importance. According to recommendations in the literature (see [48]), a variable should have a coefficient of variation (CV) above 0.1. In the dataset, only vehicle length (VehLen, CV = 0.070) did not meet this criterion. Nevertheless, the variable was retained due to its potential segmentation value—as even minor variations in vehicle length may correspond to distinct vehicle segments or categories. To assess the strength of relationships between variables, Pearson’s and Spearman’s correlation coefficients were applied. All analyzed characteristics were quantitative, which justifies the use of these methods. The results of the analysis are presented in Figure 1 (Pearson correlation on the left, Spearman correlation on the right).
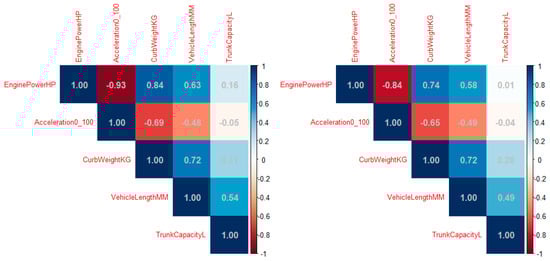
Figure 1.
Correlation map of the relationships between variables.
The analysis of Pearson’s and Spearman’s correlation coefficients indicates a high degree of consistency between the results obtained with both methods. The technical variables of vehicles are moderately or strongly correlated, which aligns with theoretical expectations and industry knowledge—higher engine power is usually associated with greater curb weight, faster acceleration, and larger vehicle dimensions. The only exception is trunk capacity, which shows no significant correlation with engine power or acceleration. This suggests that it provides distinct informational value, which may enhance group separability in the clustering analysis.
Euclidean distance was used as the metric between observations, which is the standard approach for numerical data subjected to prior standardization. This preprocessing step was necessary to ensure that all variables contributed equally to the distance calculations, regardless of their original measurement scales, and to prevent attributes with larger numerical ranges from disproportionately influencing the clustering outcome. For clustering, the k-means algorithm was selected due to its high computational efficiency, interpretability of results, and widespread application in market and marketing analyses. This method minimizes within-cluster variance and maximizes the distance between cluster centroids, enabling effective differentiation of observations.
To assess the robustness of the results, an alternative analysis was also conducted using the k-medoids algorithm. Unlike k-means, k-medoids does not rely on averages but on actual observations as cluster representatives (medoids), rendering it more robust to the influence of outliers. Comparing both approaches allows for an evaluation of whether the obtained partition is not merely the result of the specific characteristics of a single algorithm.
The optimal number of clusters was determined based on an integrated analysis of different criteria, with a minimum of three groups assumed in order to capture real differences between vehicle types. In addition, the mean silhouette coefficient was used as a measure of clustering quality, and the Adjusted Rand Index (ARI) was calculated to assess the consistency of assignments between k-means and k-medoids. a high degree of concordance would suggest the reliability and robustness of the clustering solution.
In the next stage, the distinctiveness of the clusters was examined with respect to the technical variables included in the clustering procedure. First, a classical analysis of variance (ANOVA) with post hoc tests was applied. Before conducting ANOVA, its assumptions were verified. The normality of distributions was tested using the Shapiro–Wilk test, and the homogeneity of variances was assessed with Levene’s test. When the assumptions were not satisfied, the nonparametric equivalent of ANOVA, the Kruskal–Wallis test, was used. Subsequently, effect sizes were also examined using epsilon squared (ε2) and eta squared based on the H statistic (η2) to evaluate the strength of the observed differences between clusters. For post hoc analyses of this test, Dunn’s procedure with Bonferroni correction was applied. In all statistical tests, the significance level was set at 0.05.
The final stage involved comparing clusters according to fuel type. This made it possible to assess whether a given cluster was dominated by electric, gasoline, diesel, or LPG-powered vehicles. To visualize the partition, principal component analysis (PCA) was applied, reducing the dimensionality to two components and identifying price outliers. Vehicles were classified as overpriced or underpriced if their price deviated from the cluster mean by more than two standard deviations. In the subsequent analysis, specific models belonging to these outlier groups were identified, and their fuel type was determined. The significance of mean price differences between EVs and non-EVs within the specified clusters was tested using a permutation test.
All analyses were performed using R version 4.4.2, ensuring reproducibility and transparency of the research process, using the following packages: cluster (v. 2.1.6), factoextra (v. 1.0.7), NbClust (v. 3.0.1), rstatix (v. 0.7.2), car (v. 3.1.3), mclust (v. 6.1.1), and corrplot (v. 0.95). The full research procedure is presented in Figure 2.

Figure 2.
Research procedure.
4. Results
The selection of the optimal number of clusters was carried out using a set of 23 different diagnostic methods implemented in R version 4.4.2. The application of multiple independent indicators mitigates the limitations inherent in individual criteria and allows the number of clusters to be chosen based on the majority rule. Figure 3 also presents the values of the Dindex and the second difference as additional elements supporting the decision.
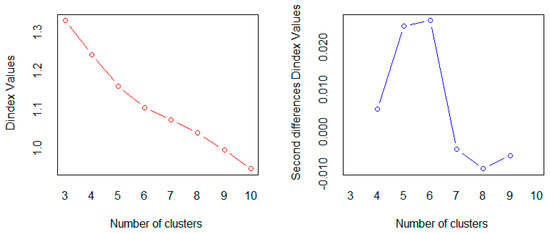
Figure 3.
Optimal number of clusters analysis.
Among all the methods applied, as many as 9 indicated that the optimal number of clusters was 3. No alternative solution was supported by more than four methods, further reinforcing the predominance of the three-cluster configuration. Therefore, the three-cluster solution was selected as optimal based on majority voting across the applied validity indices.
The results of the Dindex and second difference analyses also support this choice—after the third cluster, the decrease in Dindex values slows considerably, and the second difference approaches zero. This suggests that further increasing the number of groups fails to yield a substantial enhancement in clustering performance. At three clusters, the Dindex drops most sharply and the second difference peaks, indicating three distinct market segments.
Applying the k-means enabled the assignment of observations into the following clusters: cluster 1–140 vehicles, cluster 2–151 vehicles, and cluster 3–82 vehicles. For the alternative partition using the k-medoids method, the cluster sizes were 130, 151, and 92, respectively. The quality of classification was evaluated using the mean silhouette coefficient, which reached 0.303 for k-means and 0.291 for k-medoids, indicating moderate separation. Nevertheless, the quality of the partition was further assessed through the differentiability of clusters with respect to technical characteristics. A detailed comparison of cluster sizes and quality indicators for both algorithms is presented in Table 3.
Table 3.
Cross-tabulation of Cluster Assignments: k-means vs. k-medoids.
A comparison of the results obtained using the k-means and k-medoids methods indicates a high degree of convergence between the two approaches. The Adjusted Rand Index (ARI) reached 0.8297, confirming a strong consistency in the assignment of observations to the same clusters. Figure 4 presents the percentage distribution of fuel types within individual clusters, shown separately for each method.
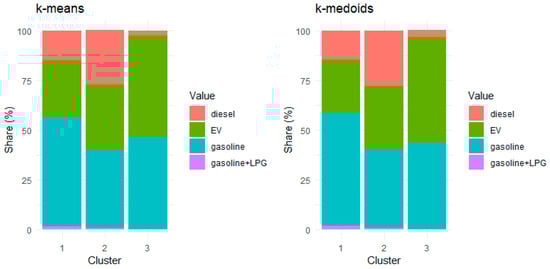
Figure 4.
Cluster characteristics by fuel type.
In both cases, the same pattern was observed—the highest share of electric vehicles (EVs) appeared in cluster 3, while the lowest was recorded in cluster 1. This reflects a high degree of consistency in cluster composition across both algorithms.
The next step involved analyzing differences between clusters with respect to the technical variables used in the grouping process. The Shapiro–Wilk test showed that only the variable CurbWgt (curb weight) followed a distribution close to normal (p-value = 0.258 for k-means, p-value = 0.142 for k-medoids), whereas all other variables did not meet this condition (p-value < 0.05). Levene’s test additionally confirmed the lack of homogeneity of variances across all variables (all p-value < 0.05). Since the key assumptions were not satisfied, the nonparametric Kruskal–Wallis test was applied for both the k-means and k-medoids solutions. In addition to significance testing, effect sizes (ε2 and η2) were also calculated to assess the strength of the observed differences. The detailed results are presented in Table 4.
Table 4.
Results of Cluster Differentiation for Included Variables.
The results of the Kruskal–Wallis tests clearly indicate that, for each of the analyzed variables, there are statistically significant differences between clusters, regardless of the clustering algorithm applied. This validates the efficacy of the clustering procedure and the internal coherence of the resulting groups. Importantly, the effect size measures demonstrate that the differences are substantial: for all variables except TrunkCap, cluster membership explains more than 52% of the variance, indicating very strong effects. The explanatory power is particularly high for EngPwr, CurbWgt, and VehLen. From the perspective of pricing, the results also suggest that the clusters differ significantly in terms of vehicle prices. To further deepen the analysis, Dunn’s post hoc tests with Bonferroni correction were performed. The results are presented in Table 5.
Table 5.
Pairwise comparisons of variables between clusters.
All analyzed technical features showed statistically significant differences between clusters, which confirms both the validity of the segmentation and the appropriateness of the variable selection. It is particularly noteworthy that the variable VehLen, which exhibited the lowest CV, also demonstrated statistically significant differences across groups. This suggests that even minor variations in vehicle length contribute meaningfully to cluster differentiation. Significant differences were also observed for the variable Price, which—although not included in the clustering process—serves as a significant discriminant across clusters. The distribution of vehicle prices across clusters is illustrated in Figure 5.
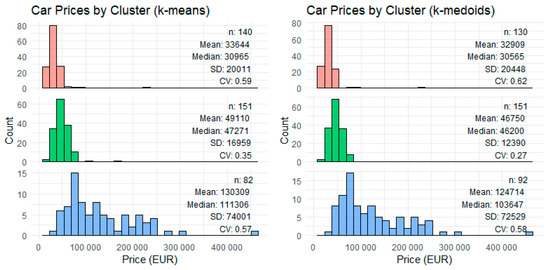
Figure 5.
Distribution of vehicle prices by cluster.
In both methods (k-means and k-medoids), a clear concentration of observations can be seen in the first two clusters. Prices exhibit an ascending pattern across clusters—cluster 1 consists of the least expensive vehicles, cluster 2 represents the mid-range segment, while cluster 3 includes the most expensive cars. The price distributions within each cluster show right-skewness, indicating the presence of individual observations with substantially higher prices than the average. This intra-cluster variation supports the use of the ±2 standard deviation threshold as a valid criterion for identifying price outliers as the criterion for identifying “overpriced” or “underpriced” vehicles is justified.
The greatest variation is observed in clusters 1 and 3. In particular, the latter shows a flattened distribution, where vehicles sharing comparable technical specifications exhibit considerable price disparities. This can be interpreted as the effect of varying levels of optional equipment or the influence of brand prestige. Figure 6 presents a two-dimensional visualization of vehicle clusters obtained through PCA. The number of features was reduced to two principal components to ensure a clear presentation of results. In addition, observations with prices deviating significantly from the average within their cluster were highlighted.
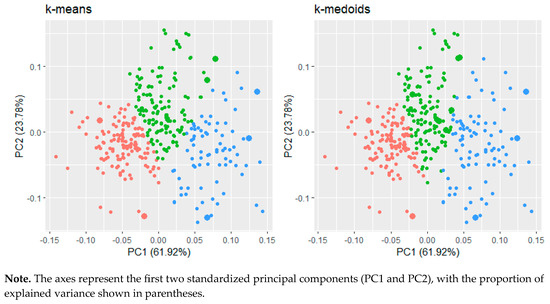
Figure 6.
Distribution of cluster assignments with identified outliers.
The first two dimensions obtained from PCA explain nearly 85% of the total variance, validating the appropriateness of dimensionality reduction for visualizing cluster separability and enabling a clear interpretation of the results. The plot also reveals a clear separability of the clusters, which further supports the quality of the segmentation obtained through clustering analysis. In the PCA maps, bolded points indicate observations whose prices deviate significantly from the cluster average. All of these cases fall into the overpriced category—no underpriced vehicles were identified. A detailed list of these models, together with their fuel type, is presented in Figure 7.
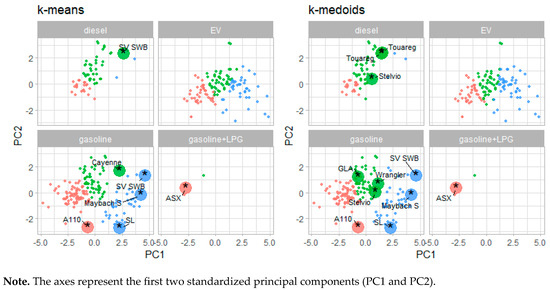
Figure 7.
Identification of outlier observations within clusters by fuel type.
The comparative analysis shows that the k-means method results in fewer outlier observations than k-medoids. Both approaches, however, identified the same vehicle models, including the Maybach S, Mitsubishi ASX, and Range Rover SV SWB—all of which belong to the luxury segment and naturally deviate in price from the rest of the market.
In neither case did EVs exceed the threshold of two standard deviations from the cluster mean price, regardless of the clustering algorithm applied. This suggests that entry-level versions of electric vehicles—despite their relatively high unit prices—feature technical characteristics similar to combustion cars, which keeps their price levels aligned with the average within a given segment. Table 6 presents the average prices of EVs and non-EVs within clusters, along with the results of the permutation test assessing the significance of these differences.
Table 6.
Comparison of EV and non-EV mean prices within clusters.
In both clustering approaches (k-means and k-medoids), the differences in mean prices between EVs and non-EVs are statistically insignificant in Clusters 1 and 2. However, in Cluster 3, which groups cars with the best technical parameters, non-EVs are decisively more expensive. This reflects the fact that the premium and thus the most expensive vehicles in the market are still predominantly combustion cars.
5. Discussion
The pursuit of sustainability in the automotive sector is intrinsically linked to the advancement of electric vehicles (EVs), which, as the present analysis demonstrates, exhibit a high degree of technical similarity to fossil-fuel cars. Nevertheless, as emphasized by Veza et al. [23] and Albrechtowicz [22], the achievement of genuine sustainability presupposes that the electricity used for charging EVs is derived from renewable rather than fossil-based energy sources. Absent such a transition, the environmental potential of EVs can only be partially realized, as lifecycle emissions associated with fossil-generated electricity may offset the benefits of no exhaust emissions during vehicle operation.
Price constitutes another important determinant, as it remains among the most influential factors shaping consumer purchasing decisions in the automotive market [44]. Although EVs are commonly perceived as more expensive than their combustion counterparts—a perception that frequently discourages adoption among average consumers [42]—the results of the cluster analysis only partially substantiate this assumption. Importantly, when focusing on segments where EVs are available (i.e., excluding luxury models with limited or no EV representation), the price differences become negligible. EV models occupy the upper segments of the price distribution, yet none exceeded the threshold of two standard deviations from the mean price within their respective clusters. When technical specifications are considered, EV prices thus appear broadly aligned with those of combustion vehicles of comparable design. This finding indicates that consumer perceptions may lag behind actual market dynamics, underscoring the importance of clearer communication of emerging cost parity by both manufacturers and policymakers.
These conclusions are consistent with findings by Kumar, Kalghatgi, and Agarwal [49] who demonstrated that electric vehicles can be economically competitive with internal combustion engine vehicles, particularly in high-usage segments. Their total cost of ownership analysis revealed that, when comparing vehicles with similar functional characteristics, EVs are not inherently more expensive, and that perceived cost disadvantages may be overstated in public discourse. Both studies highlight the need for improved consumer awareness and policy alignment to reflect the evolving economics of electric mobility.
These results may be interpreted as evidence of the progressive integration of EVs into the mainstream automotive market, particularly within entry-level segments. Such integration is consistent with broader market trends that point to a narrowing cost differential between EVs and conventional vehicles, especially in the compact and city categories [46,50]. In practical terms, this convergence suggests that EVs are no longer confined to a niche market but are increasingly positioned to compete directly across the same categories as combustion vehicles, offering consumers equivalent alternatives in terms of +performance, usability, and design—except for the luxury segment, which remains dominated by combustion vehicles.
Interestingly, despite the overall trend toward price convergence, premium models are still predominantly combustion-powered. This highlights a lingering gap in EV availability at the highest end of the market, which may reflect both technological constraints and brand positioning strategies.
It should be noted, however, that consumer decision-making is not shaped by purchase price alone. Environmental considerations—such as compliance with emission standards and overall climate impact—are acquiring increasing importance [45]. While EVs are widely promoted as environmentally superior solutions, their net ecological impact is critically contingent upon the underlying electricity mix. Only when powered predominantly by renewable energy sources can EVs be regarded as genuinely climate-neutral. In contexts where fossil fuels continue to dominate energy production, the environmental benefits of EVs may be considerably less pronounced than is often assumed [21,25,43]. This underscores the necessity of aligning transport electrification with broader energy transition strategies to maximize the environmental gains of EV adoption.
Taken together, the findings suggest that although EVs are becoming increasingly competitive with combustion vehicles in both technical and economic terms, their widespread adoption remains contingent upon supportive regulatory frameworks, expansion of charging infrastructure, and coherent environmental policies. Moreover, consumer perceptions—frequently shaped by outdated assumptions regarding both cost and ecological performance—require targeted interventions, including transparent pricing mechanisms, incentive schemes, and educational campaigns that emphasize the evolving competitiveness and environmental advantages of EVs.
6. Conclusions
The common belief that electric vehicles are uniformly more expensive than combustion models is not supported by our findings. In the mainstream of the market—entry-level and mid-range offerings—EVs are priced competitively relative to comparable combustion cars, pointing to an emerging price parity in segments most relevant for mass adoption. At the top end, the pattern differs: the highest price brackets are largely occupied by combustion models, indicating that the very expensive cars tend to be combustion-powered rather than electric. Taken together, these patterns suggest that while price remains a strong differentiator, it does not uniquely sort vehicles by drivetrain.
These insights are relevant not only for academic inquiry but also for policymakers and industry stakeholders shaping the future of sustainable mobility. For consumers, the practical implication is that EV affordability increasingly depends on model choice and specification rather than on the mere fact of being electric. To drive widespread adoption, policymakers and industry should focus on mainstream segments—expanding availability and enabling like-for-like comparisons—rather than targeting the premium tier.
The study has several limitations. It focused exclusively on baseline models, which ensured comparability but restricted the ability to capture price variation arising from optional equipment, special editions, or customized configurations. Including such variants could artificially fragment clusters, as vehicles with identical performance might differ only in interior features or trim levels—elements that enhance comfort but do not alter the core function of mobility. Moreover, the analysis was conducted on a static cross-section of the market, without accounting for changes over time, subsidy programs, operating costs, or charging infrastructure, all of which significantly affect consumer perceptions and market dynamics. While additional features expand the user experience, the essence of a vehicle remains its ability to move efficiently and reliably—a principle that guided the clustering approach.
Future research should build upon this analysis by incorporating alternative analytical techniques, such as econometric modeling and methods robust to outliers, to enhance the generalizability of findings. It would also be valuable to consider manufacturer-defined segments to better reflect market realities and consumer expectations. Equally important is situating such investigations within the broader context of evolving regulatory and environmental frameworks, including climate neutrality targets, increasingly stringent emission standards, and incentive schemes promoting the adoption of low-emission vehicles.
Author Contributions
Conceptualization, J.K. (Jakub Kubiczek) and J.K. (Julianna Koczy); methodology, J.K. (Jakub Kubiczek); software, J.K. (Jakub Kubiczek); validation, J.K. (Jakub Kubiczek); formal analysis, J.K. (Jakub Kubiczek) and J.K. (Julianna Koczy); investigation, J.K. (Jakub Kubiczek) and J.K. (Julianna Koczy); resources, J.K. (Julianna Koczy); data curation, J.K. (Julianna Koczy); writing—original draft preparation, J.K. (Jakub Kubiczek) and J.K. (Julianna Koczy); writing—review and editing, J.K. (Jakub Kubiczek) and J.K. (Julianna Koczy); visualization, J.K. (Jakub Kubiczek); supervision, J.K. (Jakub Kubiczek); project administration, J.K. (Jakub Kubiczek). All authors have read and agreed to the published version of the manuscript.
Funding
This research received no external funding.
Data Availability Statement
The data used in this study were collected from publicly available catalogs and can be fully reproduced following the procedures described in the Materials section. As the dataset will be utilized for additional ongoing analyses, it is not publicly available at this stage.
Acknowledgments
During the preparation of this manuscript, the authors used ChatGPT 5.0 for translation. The authors have reviewed and edited the output and take full responsibility for the content of this publication.
Conflicts of Interest
The authors declare no conflicts of interest.
References
- Valladares Montemayor, H.M.; Chanda, R.H. Automotive Industry’s Circularity Applications and Industry 4.0. Environ. Chall. 2023, 12, 100725. [Google Scholar] [CrossRef]
- Serrano, J.R.; Novella, R.; Piqueras, P. Why the Development of Internal Combustion Engines Is Still Necessary to Fight against Global Climate Change from the Perspective of Transportation. Appl. Sci. 2019, 9, 4597. [Google Scholar] [CrossRef]
- Reşitoğlu, İ.A.; Altinişik, K.; Keskin, A. The Pollutant Emissions from Diesel-Engine Vehicles and Exhaust Aftertreatment Systems. Clean Technol. Environ. Policy 2015, 17, 15–27. [Google Scholar] [CrossRef]
- Yuan, X.; Liu, H.; Gao, Y. Diesel Engine SCR Control: Current Development and Future Challenges. Emiss. Control Sci. Technol. 2015, 1, 121–133. [Google Scholar] [CrossRef]
- Ovaere, M.; Proost, S. Cost-Effective Reduction of Fossil Energy Use in the European Transport Sector: An Assessment of the Fit for 55 Package. Energy Policy 2022, 168, 113085. [Google Scholar] [CrossRef]
- Zhang, P.; Zhang, H.; Sun, X.; Li, P.; Zhao, M.; Xu, S.; Jiao, X.; Sun, Z.; Zhang, T. Research on Carbon Emission Standards of Automobile Industry in BRI Participating Countries. Clean. Responsible Consum. 2023, 8, 100106. [Google Scholar] [CrossRef]
- Rísquez Ramos, M.; Ruiz-Gálvez, M.E. The Transformation of the Automotive Industry toward Electrification and Its Impact on Global Value Chains: Inter-Plant Competition, Employment, and Supply Chains. Eur. Res. Manag. Bus. Econ. 2024, 30, 100242. [Google Scholar] [CrossRef]
- Jannesar Niri, A.; Poelzer, G.A.; Zhang, S.E.; Rosenkranz, J.; Pettersson, M.; Ghorbani, Y. Sustainability Challenges throughout the Electric Vehicle Battery Value Chain. Renew. Sustain. Energy Rev. 2024, 191, 114176. [Google Scholar] [CrossRef]
- Tilly, N.; Yigitcanlar, T.; Degirmenci, K.; Paz, A. How Sustainable Is Electric Vehicle Adoption? Insights from a PRISMA Review. Sustain. Cities Soc. 2024, 117, 105950. [Google Scholar] [CrossRef]
- Hoeft, F. Internal Combustion Engine to Electric Vehicle Retrofitting: Potential Customer’s Needs, Public Perception and Business Model Implications. Transp. Res. Interdiscip. Perspect. 2021, 9, 100330. [Google Scholar] [CrossRef]
- Fracarolli Nunes, M.; Lee Park, C. Caught Red-Handed: The Cost of the Volkswagen Dieselgate. J. Glob. Responsib. 2016, 7, 288–302. [Google Scholar] [CrossRef]
- Mujkic, E.; Klingner, D. Dieselgate: How Hubris and Bad Leadership Caused the Biggest Scandal in Automotive History. Public Integr. 2019, 21, 365–377. [Google Scholar] [CrossRef]
- Terwindt, M.R.; Negenborn, W.; Annema; Van Blokland, W.W.A.B. Explaining the Role of Dieselgate in the Rise of Electric Vehicles. ResearchGate 2024, preprint. [Google Scholar] [CrossRef]
- gov.pl Program “NaszEauto”. Do 40 Tys. Zł Dopłaty Do Samochodu Elektrycznego. Available online: https://www.gov.pl/web/nfosigw/program-naszeauto-do-40-tys-zl-doplaty-do-samochodu-elektrycznego (accessed on 19 August 2025).
- European Commision. November 2024 EV Registration Highlights: 25% of New Cars Had a Plug; European Commision: Brussel, Belgium, 2025.
- European Commision. Poland: 3% Decrease of BEV Registrations Compared to 2023 in 2024; European Commision: Brussel, Belgium, 2025.
- Kubiczek, J.; Hadasik, B. Segmentation of Passenger Electric Cars Market in Poland. World Electr. Veh. J. 2021, 12, 23. [Google Scholar] [CrossRef]
- Secinaro, S.; Calandra, D.; Lanzalonga, F.; Ferraris, A. Electric Vehicles’ Consumer Behaviours: Mapping the Field and Providing a Research Agenda. J. Bus. Res. 2022, 150, 399–416. [Google Scholar] [CrossRef]
- Parker, N.; Breetz, H.L.; Salon, D.; Conway, M.W.; Williams, J.; Patterson, M. Who Saves Money Buying Electric Vehicles? Heterogeneity in Total Cost of Ownership. Transp. Res. Part D Transp. Environ. 2021, 96, 102893. [Google Scholar] [CrossRef]
- Hu, X.; Zhou, R.; Wang, S.; Gao, L.; Zhu, Z. Consumers’ Value Perception and Intention to Purchase Electric Vehicles: A Benefit-Risk Analysis. Res. Transp. Bus. Manag. 2023, 49, 101004. [Google Scholar] [CrossRef]
- Farzaneh, F.; Jung, S. Lifecycle Carbon Footprint Comparison between Internal Combustion Engine versus Electric Transit Vehicle: A Case Study in the U.S. J. Clean. Prod. 2023, 390, 136111. [Google Scholar] [CrossRef]
- Albrechtowicz, P. Electric Vehicle Impact on the Environment in Terms of the Electric Energy Source—Case Study. Energy Rep. 2023, 9, 3813–3821. [Google Scholar] [CrossRef]
- Veza, I.; Asy’ari, M.Z.; Idris, M.; Epin, V.; Rizwanul Fattah, I.M.; Spraggon, M. Electric Vehicle (EV) and Driving towards Sustainability: Comparison between EV, HEV, PHEV, and ICE Vehicles to Achieve Net Zero Emissions by 2050 from EV. Alex. Eng. J. 2023, 82, 459–467. [Google Scholar] [CrossRef]
- Woo, S.-H.; Jang, H.; Lee, S.-B.; Lee, S. Comparison of Total PM Emissions Emitted from Electric and Internal Combustion Engine Vehicles: An Experimental Analysis. Sci. Total Environ. 2022, 842, 156961. [Google Scholar] [CrossRef]
- Fares, M.Y.; Albdour, A.; Lanotte, M. Evaluation of Potential Electric Vehicles Load-Induced Damage on Flexible Pavements. Transp. Res. Part D Transp. Environ. 2024, 136, 104475. [Google Scholar] [CrossRef]
- Sandrini, G.; Có, B.; Tomasoni, G.; Gadola, M.; Chindamo, D. The Environmental Performance of Traction Batteries for Electric Vehicles from a Life Cycle Perspective. Environ. Clim. Technol. 2021, 25, 700–716. [Google Scholar] [CrossRef]
- Verma, S.; Dwivedi, G.; Verma, P. Life Cycle Assessment of Electric Vehicles in Comparison to Combustion Engine Vehicles: A Review. Mater. Today Proc. 2022, 49, 217–222. [Google Scholar] [CrossRef]
- Sandrini, G.; Gadola, M.; Chindamo, D.; Candela, A.; Magri, P. Exploring the Impact of Vehicle Lightweighting in Terms of Energy Consumption: Analysis and Simulation. Energies 2023, 16, 5157. [Google Scholar] [CrossRef]
- Kęska, A.; Dziubek, M.; Michalik, D. The Economic Aspects of Vehicle Operation in the Context of Electromobility Strategies. Combust. Engines 2024, 196, 146–152. [Google Scholar] [CrossRef]
- Alanazi, F. Electric Vehicles: Benefits, Challenges, and Potential Solutions for Widespread Adaptation. Appl. Sci. 2023, 13, 6016. [Google Scholar] [CrossRef]
- McDonnell, K.; Sheehan, B.; Murphy, F.; Guillen, M. Are Electric Vehicles Riskier? A Comparative Study of Driving Behaviour and Insurance Claims for Internal Combustion Engine, Hybrid and Electric Vehicles. Accid. Anal. Prev. 2024, 207, 107761. [Google Scholar] [CrossRef] [PubMed]
- Malik, M.A.I.; Kalam, M.A.; Ikram, A.; Zeeshan, S.; Raza Zahidi, S.Q. Energy Transition towards Electric Vehicle Technology: Recent Advancements. Energy Rep. 2025, 13, 2958–2996. [Google Scholar] [CrossRef]
- Brenna, M.; Foiadelli, F.; Leone, C.; Longo, M. Electric Vehicles Charging Technology Review and Optimal Size Estimation. J. Electr. Eng. Technol. 2020, 15, 2539–2552. [Google Scholar] [CrossRef]
- Armenta-Déu, C.; Cattin, E. Real Driving Range in Electric Vehicles: Influence on Fuel Consumption and Carbon Emissions. World Electr. Veh. J. 2021, 12, 166. [Google Scholar] [CrossRef]
- Nguyen-Tien, V.; Zhang, C.; Strobl, E.; Elliott, R.J.R. The Closing Longevity Gap between Battery Electric Vehicles and Internal Combustion Vehicles in Great Britain. Nat. Energy 2025, 10, 354–364. [Google Scholar] [CrossRef]
- Anderson, P.; D’Souza, A. Real World Cost of Fueling EVs and ICE Vehicles; Anderson Economic Group: Chicago, IL, USA, 2022. [Google Scholar]
- Colombo, C.; Borghetti, F.; Longo, M.; Yaici, W.; Miraftabzadeh, S.M. Decarbonizing Transportation: A Data-Driven Examination of ICE Vehicle to EV Transition. Clean. Eng. Technol. 2024, 21, 100782. [Google Scholar] [CrossRef]
- Kostopoulos, E.D.; Spyropoulos, G.C.; Kaldellis, J.K. Real-World Study for the Optimal Charging of Electric Vehicles. Energy Rep. 2020, 6, 418–426. [Google Scholar] [CrossRef]
- Zaino, R.; Ahmed, V.; Alhammadi, A.M.; Alghoush, M. Electric Vehicle Adoption: A Comprehensive Systematic Review of Technological, Environmental, Organizational and Policy Impacts. World Electr. Veh. J. 2024, 15, 375. [Google Scholar] [CrossRef]
- Feng, R.; Hua, Z.; Yu, J.; Zhao, Z.; Dan, Y.; Zhai, H.; Shu, X. A Comparative Investigation on the Energy Flow of Pure Battery Electric Vehicle under Different Driving Conditions. Appl. Therm. Eng. 2025, 269, 126035. [Google Scholar] [CrossRef]
- Li, L.; Wang, Z.; Chen, L.; Wang, Z. Consumer Preferences for Battery Electric Vehicles: A Choice Experimental Survey in China. Transp. Res. Part D Transp. Environ. 2020, 78, 102185. [Google Scholar] [CrossRef]
- Quaglieri, L.; Mercuri, F.; Fraccascia, L. Investigating Consumer Behaviour Towards Electric Vehicles: A Systematic Literature Review. Circ. Econ. Sustain. 2025, 5, 1419–1450. [Google Scholar] [CrossRef]
- Liu, Z.; Song, J.; Kubal, J.; Susarla, N.; Knehr, K.W.; Islam, E.; Nelson, P.; Ahmed, S. Comparing Total Cost of Ownership of Battery Electric Vehicles and Internal Combustion Engine Vehicles. Energy Policy 2021, 158, 112564. [Google Scholar] [CrossRef]
- Tu, J.-C.; Yang, C. Key Factors Influencing Consumers’ Purchase of Electric Vehicles. Sustainability 2019, 11, 3863. [Google Scholar] [CrossRef]
- He, S.; Luo, S.; Sun, K.K. Factors Affecting Electric Vehicle Adoption Intention: The Impact of Objective, Perceived, and Prospective Charger Accessibility. J. Transp. Land Use 2022, 15, 779–801. [Google Scholar] [CrossRef]
- IEA Global EV Outlook 2023. 2023. Available online: https://www.iea.org/reports/global-ev-outlook-2023 (accessed on 19 August 2025).
- European Commision. European Alternative Fuels Observatory. Poland; European Commision: Brussel, Belgium, 2025.
- Statystyczna Analiza Danych z Wykorzystaniem Programu R; Walesiak, M., Gatnar, E., Eds.; Wydawnictwo Naukowe PWN: Warszawa, Poland, 2009. [Google Scholar]
- Kumar, D.; Kalghatgi, G.; Agarwal, A.K. Comparison of Economic Viability of Electric and Internal Combustion Engine Vehicles Based on Total Cost of Ownership Analysis. In Transportation Systems Technology and Integrated Management; Upadhyay, R.K., Sharma, S.K., Kumar, V., Valera, H., Eds.; Energy, Environment, and Sustainability; Springer Nature: Singapore, 2023; pp. 455–489. ISBN 978-981-99-1516-3. [Google Scholar]
- Stokes, L.C.; Breetz, H.L. Politics in the U.S. Energy Transition: Case Studies of Solar, Wind, Biofuels and Electric Vehicles Policy. Energy Policy 2018, 113, 76–86. [Google Scholar] [CrossRef]


Disclaimer/Publisher’s Note: The statements, opinions and data contained in all publications are solely those of the individual author(s) and contributor(s) and not of MDPI and/or the editor(s). MDPI and/or the editor(s) disclaim responsibility for any injury to people or property resulting from any ideas, methods, instructions or products referred to in the content. |
© 2025 by the authors. Licensee MDPI, Basel, Switzerland. This article is an open access article distributed under the terms and conditions of the Creative Commons Attribution (CC BY) license (https://creativecommons.org/licenses/by/4.0/).