Abstract
Photovoltaic (PV) inverters are key elements in modern distributed generation systems. One of the critical requirements for their reliable operation is islanding detection, as defined by IEEE 1547.1-2020 and PN-EN 62116 standards. This study investigates the performance of 28 commercially available, low-voltage, prosumer-dedicated PV inverters under unintentional islanding conditions, analyzing detection time, voltage amplitude, frequency deviations, and rate of change of frequency (ROCOF). Experimental results confirm that while most units comply with the 2 s disconnection limit, significant variability in reaction times was observed, with some units exceeding standard thresholds. Moreover, deviations in voltage and frequency indicate that in many cases, power quality standards were not maintained, potentially leading to safety and stability concerns. In the second stage of tests, a parallel operation of inverters was examined, revealing additional disturbances, such as voltage swells and beat phenomena caused by phase-locked loop (PLL) desynchronization. A simplified theoretical model confirmed the possibility of resonance and oscillatory interactions between parallel inverters during islanding. These findings highlight the need for improved coordination and control strategies for distributed generation based on inverters, particularly in microgrid applications.
1. Introduction
In many countries, photovoltaic panels are the most popular renewable energy source. This holds true for both large photovoltaic farms, microgrids, and prosumer installations. Photovoltaic panels produce direct current, so they need to be connected to AC grids or AC microgrids through power electronic inverters, which serve as DC/AC power converters.
One of the requirements for renewable energy sources is islanding detection. According to the IEEE 1547.1-2020 standard requirements [1], a renewable source should be disconnected no later than 2 s after the islanding occurs. There are many different methods for island detection [2,3,4], which can be divided into three different types:
- Passive methods [5,6,7], which involve observing selected voltage parameters such as RMS voltage and frequency and rate of change of frequency (ROCOF).
- Active methods [8,9], which involve injecting test signals into the grid.
- Communication-based methods [10,11] that rely on communication between the renewable source and the system in which it operates.
All of the islanding detection methods differ from each other in the context of their efficiency, speed, and accuracy. This kind of difference is not a problem if the given inverter operates individually as long as the time of disconnection is within standard requirements. However, this may not be the case if inverters would operate in parallel. This phenomenon will be one of the issues considered in this article.
Photovoltaic inverters are power electronic devices. The topic of power electronic-based energy system that causes disturbances in power quality is a subject of various publications. The authors in [12] discussed Harmonic Stability in Power Electronic-Based Power Systems. The article describes a very important problem of resonances caused by switching frequency, as well as resonances induced by the wideband control dynamics of converters.
A more specific phenomenon that can create power quality disturbances is unintentional islanding and the process of turning off the inverter after unintentional islanding detection. In [13], Murugesan et al. proposed a hybrid unintentional identification methodology (HUIIM) for microgrids, utilizing average absolute d-axis voltage deviation, circuit braker status, and disturbance injection. The authors aimed to create a method that would not degrade power quality during grid connection operations.
In [14], authors highlighted the importance of anti-islanding methods in preventing power quality degradation, electrical hazards, and equipment damage due to unintentional islanding.
Authors in [15] presented a study on voltage sag characterization during unintentional islanding, providing analytical models and validations through simulations and field measurements.
Choudhury and Jena in [16] introduced a hybrid detection approach that significantly reduces the non-detection zone and power quality issues, showcasing the evolving landscape of islanding detection in DC systems.
In [17], Chauhdary et al. proposed an active anti-islanding scheme using negative-sequence current injection and harmonic analysis with a deep learning classifier, developed and validated on a simulation model. Conversely, Sarhan et al. in [18] trained their PMU-ANN hybrid method on real microgrid measurements and confirmed its performance through tests based on laboratory microgrid operating conditions.
Particularly noteworthy is the problem of real-time control for unintentional islanding. Bernstein et al. in [19] proposed a method for unintentional islanding in microgrids, optimizing network performance and ensuring a smooth transition to suitable resources post-islanding.
In [20], Wang et al. discussed a control strategy to improve power quality in islanded microgrids by optimizing the output impedances of distributed generators.
In this paper, a group of 28 different, commercially available, low-voltage, prosumer-dedicated PV inverters is tested in the context of unintentional islanding. A set of tests performed according to IEEE 1547.1-2020 standards were conducted to determine the time of the islanding detection, as well as to find what the maximal deviations are of voltage amplitude, frequency, and ROCOF. Then, a similar test for parallel operation of inverters was performed. Based on these experimental results, a novel analysis of possible resonances between parallelly operating inverters while unintentional islanding was presented. Lastly, a possible solution to these disturbances concludes this paper.
2. Islanding Detection of PV Inverters
There are many types of islanding detection methods and many different control algorithms implemented in the inverters, which result in very diverse voltage and current waveforms. In this section, a description of the laboratory setup and test procedures used to determine the parameters of those waveforms are presented.
2.1. Description of the Laboratory Setup
Laboratory measurements of the unintentional islanding operation of PV inverters were carried out at the Center of Energy of AGH University of Science and Technology in Kraków. The purpose of the measurements was to test the detection time of island operation of various types of PV inverters.
The tests were carried out in terms of compliance with the standards requirements, taking into account the European standard PN-EN 62116 [21], the IEEE 1547.1-2020 standard, and the requirements of the local electricity distributor. The standards also describe the method of testing inverters according to which of the tests should be carried out for several operating points due to the generated power and the degree of unbalance of the generation with the load on the energy island.
Laboratory tests were performed on a system powered by Regenerative Grid Simulator Chroma 61815 (Chroma ATE Inc., Taoyuan City, Taiwan) with nominal frequency 15 kW. This solution made it possible to test the devices under conditions free from disturbances and distortions that occur in the real power grid. Parallel to the network simulator, an adjustable RLC load was connected which was configured according to the needed configuration. The tested inverter was connected to the Photovoltaic Panels Simulator Itech IT6000B Bi-Directional DC Power Supply (ITECH Electronic Co., Ltd., New Taipei City, Taiwan) enabling precise setting of the processed power. The diagram of the entire laboratory testing system is shown in Figure 1.
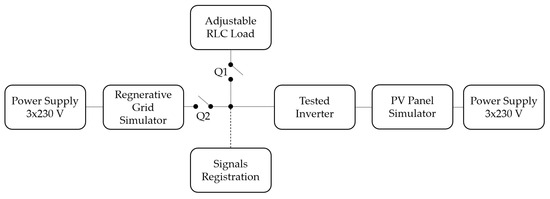
Figure 1.
Diagram of the system for islanding testing of the inverters.
Voltage measurements were performed at the inverter terminals. The National Instruments cRIO-9024 (National Instruments, Austin, TX, USA) measuring system was used for the measurements. The AD converter had a resolution of 24 bits and operated with a sampling frequency of 25 kHz. The general view of the inverters test bench is shown in Figure 2.
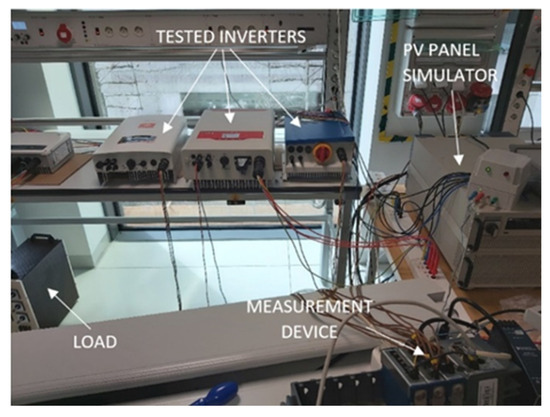
Figure 2.
Inverters test bench.
2.2. The Method of Carrying out the Measurements
The tests consisted of introducing the tested inverter with the connected load into the island operation mode with appropriate values of the generated and consumed power. For this purpose, appropriate switching sequences had to be made in the circuit shown in Figure 1. The entire procedure to enter the inverter into island operation required a sequence of the following six steps:
- (1)
- Launch of the network simulator.
- (2)
- Close the Q2 circuit breaker.
- (3)
- Turn on the photovoltaic panel simulator.
- (4)
- Close the Q1 circuit breaker.
- (5)
- Equalization of generated and load power.
- (6)
- Open the Q2 circuit breaker.
Ad 1. Before starting the generation, the RMS value and the frequency of the voltage were set for the network simulator. The simulator enables two-way energy flow, allowing the system to operate in the case of an incomplete power balance (generation of the tested inverter greater than load).
Ad 2. When the Q2 circuit breaker was connected, the test network was energized, allowing the tested inverter to start.
Ad 3. The photovoltaic panel simulator was configured, and the inverter parameters—such as rated power, rated voltage, and MPPT voltage—were entered into the simulator program. Afterwards, the power that the simulator generated at the maximum power point (MPP) was set. After starting the generation, the tested inverter performs test procedures and then starts to work, increasing the power until it reaches the maximum power point. At this operating point, the inverter feeds the power generated by the panel simulator to the power grid through the grid simulator.
Ad 4. Closing the Q1 breaker connects the RLC load to the simulated grid. After activating the load adjustable receiver, the value was set at that which the transition of the tested inverter to island mode was simulated.
Ad 5. Before switching the inverter to island operation mode, it was necessary, according to the assumptions presented in Table 1, to equalize the power given by the inverter and consumed by the regulated load. For this purpose, with a set load value, the photovoltaic panel power generated by the simulator was precisely changed so that the power of the grid simulator was equal to zero, that is, the simulator is not outputting or drawing power from the system.

Table 1.
Test conditions.
Ad 6. Before opening the Q2 switch, the measurement system was started, and then, after opening Q2, the tested inverter was operating in the island mode. After the protection against the inverter’s island operation has been triggered, the measurement system was stopped.
2.3. Test Condition According to Standards PN-EN 62116
The inverters were tested according to the procedure set out in the standard PN-EN 62116. The laboratory setup enables the tests presented in points 1–5 in Table 1. At the first point, the inverter operated at rated power. The regulated load was set at the same input power value. When the island operation was initiated, the system was fully balanced, which corresponds to the conditions when the detection of island operation is most difficult. Points 2 and 3 were implemented for a similarly balanced system, but for a power of 66% and 33%, respectively. In point 4, the value of the generated power of the inverter was 5% higher than the load power, while in point 5, it was 5% lower, so after switching to island operation, the system was unbalanced. At all points, the measurements were carried out according to the same scheme.
2.4. Parallel Operation of Inverters
Laboratory measurements of unintentional island operation of two inverters operating in parallel were carried out at the RELflex Laboratory of the AGH University of Krakow. The purpose of the measurements was to examine the island operation detection time of two inverters operating in parallel. As in Section 1, the tests were carried out in terms of compliance with the requirements of the standards.
Laboratory tests were performed on a system powered by Regenerative Grid Simulator Chroma 61815 (Chroma ATE Inc., Taoyuan City, Taiwan). Parallel to the network simulator, an RLC receiver with adjustable values of active and reactive load was connected. Two photovoltaic inverters operate in parallel and are connected to the system. One of the inverters was powered with the PV panel simulator. The second inverter was powered by real PV panels and cooperated with battery energy storage. This solution made it possible to set a constant generated power regardless of the insolation conditions. The diagram of the entire laboratory testing system is shown in Figure 3.
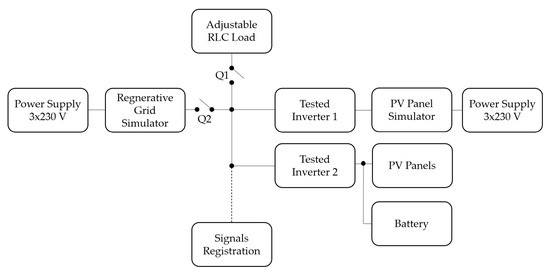
Figure 3.
Diagram of the system for islanding testing of the two parallel inverters.
Voltage recordings were made on the terminals of the inverters connected in parallel. A PC with a NI-PCI-MIO measurement card was used for the measurements. The AD converter had a resolution of 12 bits and operated with a sampling frequency of 10 kHz. The general view of the inverters test bench is shown in Figure 4.
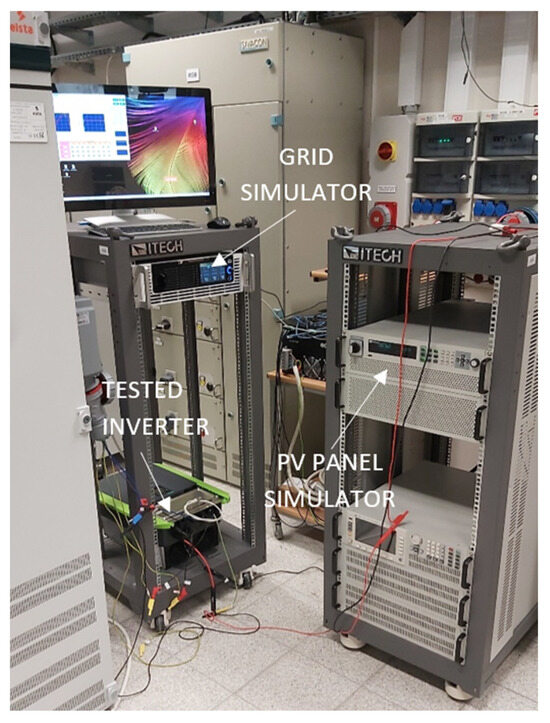
Figure 4.
Laboratory setup—general view.
2.5. The Method of Carrying out the Measurements for Parallel Operation of Inverters
Measurements were performed in a similar way to the methods presented in Section 2.2. The procedure of putting the inverters in the island operation mode required the following sequence of steps:
- (1)
- Launch of the network simulator.
- (2)
- Close the Q2 circuit breaker.
- (3)
- Turn on the photovoltaic panel simulator.
- (4)
- Switch on the inverter with battery energy storage.
- (5)
- Close the Q1 circuit breaker.
- (6)
- Equalization of generated and load power.
- (7)
- Open the Q2 circuit breaker.
The procedure for putting the system into the island mode differs only in point 4, i.e., the inverter powered by PC panels and battery energy storage required a separate start-up. At point 6 of the procedure, the power generated by both inverters was equal. The load power, in turn, was equal to the sum of the powers of both inverters.
The test conditions of the inverters were the same as in Table 1.
3. Results
Twenty-eight different photovoltaic inverters available on the commercial market were tested. Sixteen of the inverters were three-phase inverters, while the remaining twelve were single-phase inverters. The nominal power of the tested inverters ranged from 2.5 kW up to 6 kW. The parameters of the tested inverters together with their manufacturers are presented in Table 2. All of the inverters were dedicated mainly for prosumers operating in a low voltage level and their nominal voltage was 230 V. It should be noted that the inverters were loaned for testing on the condition of maintaining anonymity regarding the specific performance results of each individual device. For this reason, the order of the inverters listed in Table 1 does not correspond to their order in the subsequent tables.
Table 2.
List of inverters used in the test.
3.1. Time of Unintentional Islanding Detection for Single Inverter
To determine the time of inverters rection on unintentional islanding, voltage measurements were performed according to the methodology described in Section 2. Figure 5 presents an example of voltage waveforms before and right after islanding occurred.
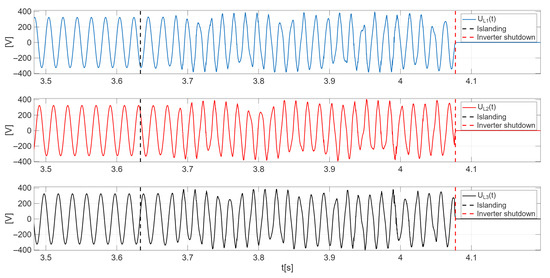
Figure 5.
Voltage waveforms of phase L1, L2, and L3 during unintentional islanding of a three-phase inverter.
After the measurement of voltage signals, voltage amplitude, frequency, and ROCOF were calculated using a synchrophasor-based estimation method. The synchrophasor-based islanding detection method was introduced in [22].
Various techniques for phasor calculation are available, each differing in terms of accuracy, sensitivity to disturbances, and response time. In this study, a fully compliant method based on flat-top Finite Impulse Response (FIR) filters [23,24] is applied. Phasor values were obtained using flat-top FIR filters [23], processing time-domain signals sampled at 25 kHz, which were subsequently resampled to a frequency of 800 Hz.
In all the subsequently presented tables, i.e., Table 3, Table 4 and Table 5, some fields remain empty for certain tested inverters. This is because, during the tests, these specific inverters unfortunately did not operate under the selected conditions. The cause might have been an improper configuration or inverter-specific protective algorithms that interpret the test scenario. Unfortunately, our access to the full set of devices was time-limited, which pre-vented us from repeating or extending the tests for those points. Nevertheless, in order to present the widest possible sample of inverters, all the measurement points that were successfully recorded are reported.
Table 3.
Time of reaction of tested inverters in ms.
Table 4.
Maximal deviation from nominal amplitude of instantaneous voltage.
Table 5.
Frequency while unintentional islanding.
Table 3 summarizes the reaction times of the tested inverters. The best results in each column were marked in green color, and the worst were marked in red. In the majority of cases, the shutdown time was shorter than 2 s. Only three units required a longer period to detect islanding and initiate disconnection. The distribution of the recorded times was relatively broad. The most pronounced spread of disconnection times appears in Test 1 and Test 3, where initial conditions were least favorable for the ROCOF- or voltage/frequency window-based detection methods, leading in some cases to delays exceeding 2 s. Conversely, Test 2 generally yielded shorter reaction times because the combination of phase angle and power mismatch produced a stronger frequency or voltage excursion immediately after islanding. Tests 4 and 5 typically resulted in intermediate behavior, although certain units (e.g., nos. 6, 10, 19, and 21) showed persistent long delays under all scenarios, pointing to built-in conservative trip settings.
These findings indicate substantial variability in the effectiveness of the islanding detection techniques employed by the tested inverters, reflecting considerable differences in the performance of the implemented algorithms.
3.2. Maximal Deviation of Parameters While Unintentional Islanding for a Single Inverter
An important aspect to be considered in the context of dynamic states during unintentional islanding of inverters is the deviation of voltage parameters. The use of different control algorithms—most often unknown to the end user—results in varying voltage waveforms. Typically, following the occurrence of islanding, the RMS voltage is either lower or higher than prior to islanding: higher if the power generated by the inverter exceeds the power demand within the spontaneously formed island, and lower in the opposite case. Table 4 presents the maximum deviations from the nominal amplitude of the instantaneous voltage. The results once again demonstrate that the control algorithms implemented in the tested inverters differ significantly. It should be emphasized that, in 27.6% of the tested cases, the measured voltage values exceeded the limits specified by power quality standards, namely ±10% of the nominal 230 V RMS, which corresponds to instantaneous voltages in the range of approximately ±293 V to ±358 V.
Voltage amplitude deviations in Table 4 likewise depended on the test point. In Test 1, maximum deviations ranged from 1 V (inverter 15) to 126 V (inverter 5), corresponding to roughly +55% of nominal voltage, with an average of about 23 V. Test 2 showed a slightly higher mean (~27 V) and very large excursions such as 138 V (inverter 5) and 130 V (inverter 27). Test 3 produced a comparable mean (~28 V) but with individual extreme cases including 140 V (inverter 5) and several missing data points (e.g., inverter 27). Test 4 contained the highest single value of the entire set—175 V (inverter 5), or about +76% of nominal—while the mean was about 30 V. Test 5 had a lower mean of roughly 21 V, with numerous low values (<5 V for inverters 7 and 24) alongside outliers such as 134 V (inverter 5). The consistent dominance of inverter 5 in upper-end values indicates a markedly different control response to rapid phase shifts.
Table 5 summarizes the frequency values and the maximum deviations from the nominal frequency observed during unintentional islanding. Test 1 frequencies spanned from 12.76 Hz (inverter 25) to 140 Hz (inverter 11), with a mean close to 48 Hz and a standard deviation around 17 Hz. Test 2 still showed broad variation, from 16.42 Hz (inverter 25) up to 83.88 Hz (inverter 26), with a mean approximately 50 Hz. Test 3 included extreme low and high values (5.82 Hz for inverter 25 and 82.73 Hz for inverter 26), with a mean near 49 Hz. Test 4 combined negative and high values—from −11.2 Hz (inverter 28) to 75 Hz (inverter 11)—with a mean of about 47 Hz. Test 5 likewise demonstrated wide scatter, with 5.98 Hz (inverter 25) at the low end and 114.21 Hz (inverter 26) at the high end, giving a mean around 46 Hz. These data indicate that under certain combinations of phase angle and power imbalance, some inverters lost their internal frequency reference completely, while others maintained a value close to the nominal 50 Hz.
3.3. Time of Unintentional Islanding for Parallelly Operating Inverters
Figure 6 presents the instantaneous voltage during the parallel operation of inverters under unintentional islanding conditions. In the pre-islanding state, both voltage amplitude and frequency remain stable. During the initial phase of islanded operation, only a slight decrease in amplitude can be observed. Toward the end of the phenomenon, however, pronounced voltage swells and dips become evident.
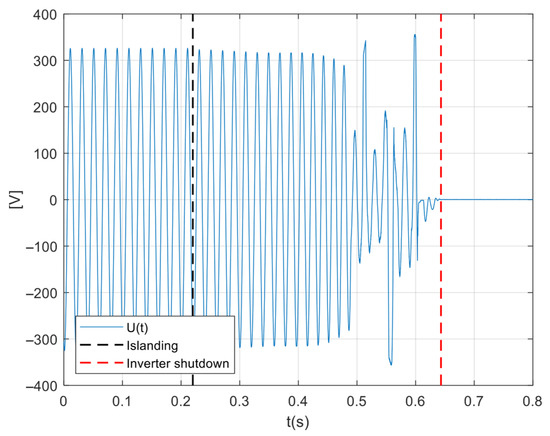
Figure 6.
Instantaneous voltage waveform for single phase during unintentional islanding with parallel operation of inverters.
Table 6 presents the reaction time and the maximum voltage deviation of the tested inverters during unintentional islanding. The tests were conducted for two inverters, first evaluated individually and then operating in parallel. The test was performed in the case of a balanced system. It was observed that the shutdown times of the inverters operating individually differed from those recorded during parallel operation. For inverter 1, the shutdown time was shorter in parallel operation, whereas for inverter 2, it was longer. The most notable finding of the tests is that, under parallel operation, a voltage swell was observed—a phenomenon that did not occur when the inverters operated individually. The presented example should be regarded as a necessary but not sufficient condition to support the thesis that wave phenomena occur in microgrids; moreover, this result has constituted a significant contribution to the subsequent discussion and theoretical considerations, which are presented in Section 4.
Table 6.
Time of reaction and maximal deviation of voltage for tested inverters.
4. Discussion on Possible Voltage Disturbances
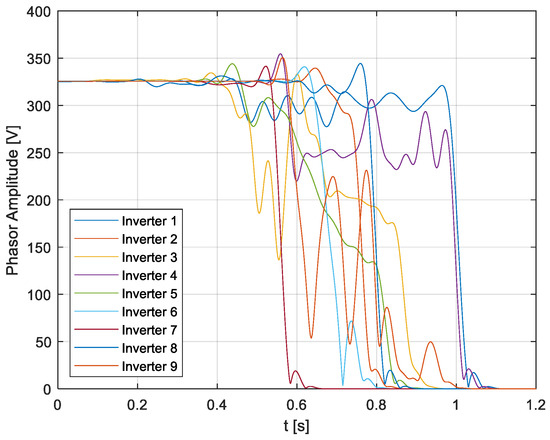
Considering the experimental results, the potential occurrence of voltage swells during the parallel operation of inverters warrants attention. For the tested batch of inverters, the recorded islanding durations were seldom shorter than one cycle of a 50 Hz signal. Inverters’ output voltages exhibited distinct transient responses, as illustrated in Figure 7. These observations support the conclusion that, particularly within microgrids—i.e., electrically isolated segments of the power system—typical wave phenomena such as resonances and signal beating are likely to emerge while in unintentional islanding operation.
Creation of a simple model that will describe the observed phenomena could be helpful to understand the significance of the problem, especially in the context of results recorded for the commercially used inverters.
4.1. Model of Two Parallel Grid-Following Inverters with Desynchronized PLLs
In order to analyze the dynamic interactions between two parallel inverters in islanded mode, a simplified Thevenin-based model is adopted. In Figure 8, a model of two parallel grid-following inverters with desynchronizes PLLs is presented.
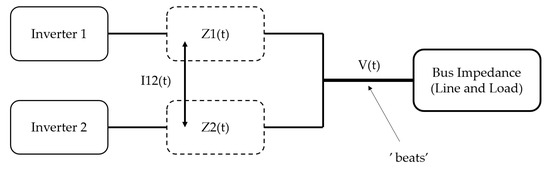
Figure 8.
Model of two parallel grid-following inverters with desynchronized PLLs.
Each inverter is modeled as an ideal voltage source behind its output impedance, which consists of the filter impedance and, if implemented, a virtual impedance term [25]. At first glance, this assumption may appear inconsistent, since grid-following inverters are typically regarded as current sources. However, once the microgrid is disconnected from the main grid, no stiff voltage reference is available. Although each grid-following inverter is designed to track the grid voltage via its PLL, in islanded conditions, such a reference does not exist. Consequently, each inverter effectively imposes its own voltage at the point of common coupling through its control loops and output filter. As a result, the overall system behaves as a set of parallel voltage sources with finite internal impedances, determined by the physical LCL filters and any additional virtual impedance introduced in the controllers. It is important to note that this interpretation of inverters as voltage sources is valid in the sense of instantaneous values, reflecting the dynamic voltage behavior resulting from the fast inner control loops and filter dynamics rather than from averaged or steady-state quantities.
The inverter voltages can be expressed as
with corresponding phasor representations:
The output impedances of the two inverters are denoted as Z1(s) and Z2(s), while the remainder of the microgrid—including distribution lines and aggregated loads—is represented by Zbus(s).
The circulating current between the two inverters is then given by
This expression highlights that the current contains components at both ω1 and ω2. As a result, low-frequency beat phenomena occur with frequency |ω1 − ω2|, leading to oscillatory power exchange between the converters [26].
The bus voltage is obtained as the weighted superposition of the contributions at the two distinct frequencies:
This model provides a clear physical interpretation: amplitude mismatches predominantly generate real circulating currents, whereas phase or frequency mismatches lead to quadrature components and beat oscillations.
4.2. Possible Voltage Swells Based on the Results from Tested Inverters
When two inverter outputs operate at slightly different frequencies, the superposition of their voltages produces a beat phenomenon. In this case, even if the root mean square (RMS) voltage remains within nominal limits, the instantaneous voltage amplitude may temporarily exceed the rated value due to constructive interference of the two sinusoidal components.
The instantaneous bus voltage can be expressed as
For the case where ω1 ≈ ω2, the expression can be rewritten as
Here, = (ω1 + ω2)/2 is the average angular frequency, while Δω = ω1 − ω2 represents the frequency mismatch. The result is a sinusoidal waveform at the average frequency whose amplitude is modulated at the difference frequency Δω. This modulation leads to low-frequency envelope oscillations, or ‘beats’, which cause the instantaneous bus voltage to swing above and below its nominal peak value.
Figure 9 presents a heatmap of the peak instantaneous voltages calculated for the frequency values listed in the Test 2 column of Table 4. Axis X consist of the first 14 inverters and Acis Y consist of the last 14 inverters. Frequency pairs were generated and applied in the calculations. A nominal RMS voltage of 230 V was assumed, with both inverters operating at an initial phase angle of φ1 = φ2 = 0°. As can be observed, the resulting instantaneous voltages exhibit significant variations across the different frequency combinations.
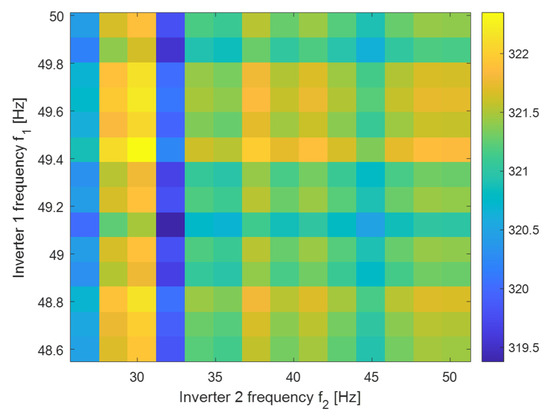
Figure 9.
Heatmap of peak instantaneous voltages based on the frequencies from Table 4.
5. Conclusions and Possible Solutions
The conducted study has demonstrated significant variability in islanding detection times and voltage–frequency stability among commercially available low-voltage, prosumer-dedicated PV inverters. All results and conclusions presented herein refer solely to prosumer inverters operating under low-voltage conditions. While most units fulfilled the requirements of IEEE 1547.1-2020, several exceeded the permitted detection time and exhibited deviations in power quality parameters. These discrepancies become even more pronounced under parallel operation, where resonance effects, transient overvoltage, and beat phenomena caused by PLL desynchronization were observed. Such behavior highlights potential risks to both equipment safety and grid stability, particularly in microgrid environments.
Future research should therefore focus on improving the coordination of parallel inverter operation through standardized control strategies and enhanced PLL synchronization. Adaptive methods, such as virtual impedance and hybrid detection schemes, offer promising solutions to mitigate circulating currents and reduce non-detection zones. Moreover, the development of advanced simulation models and integration with smart grid communication frameworks could support faster and more reliable anti-islanding mechanisms. Ultimately, harmonizing inverter operation standards and control approaches will be crucial to ensuring the secure and stable integration of photovoltaic systems into modern power networks.
Author Contributions
Methodology, S.B. and T.L.; Software, S.B.; Validation, S.B.; Formal analysis, S.B. and T.L.; Investigation, S.B., T.L. and A.W.; Resources, S.B.; Data curation, S.B. and T.L.; Writing—original draft, S.B., T.L. and A.W.; Writing—review & editing, S.B. and A.W.; Visualization, S.B.; Supervision, A.W.; Project administration, S.B.; Funding acquisition, S.B. All authors have read and agreed to the published version of the manuscript.
Funding
Research project partly supported by program “Excellence initiative—research university” for AGH University of Science and Technology.
Data Availability Statement
The original contributions presented in this study are included in the article. Further inquiries can be directed to the corresponding author.
Conflicts of Interest
The authors declare no conflict of interest.
Abbreviations
The following abbreviations are used in this manuscript:
| ROCOF | Rate of Change of Frequency |
| AC | Alternating Current |
| DC | Direct Current |
| RMS | Real Mean Square |
| PV | Photovoltaic |
| FIR | Finite Impulse Response |
| PLL | Phase-Locked Loop |
References
- IEEE 1547.1-2020; IEEE Standard Conformance Test. In Procedures for Equipment Interconnecting Distributed Energy Resources with Electric Power Systems and Associated Interfaces. IEEE: Piscataway, NJ, USA, 2020.
- Abu Sarhan, M. An Extensive Review and Analysis of Islanding Detection Techniques in DG Systems Connected to Power Grids. Energies 2023, 16, 3678. [Google Scholar] [CrossRef]
- Abo-Khalil, A.G.; Abdalla, M.; Bansal, R.C.; Mbungu, N.T. A Critical Assessment of Islanding Detection Methods of Solar Photovoltaic Systems. Case Stud. Therm. Eng. 2023, 52, 103335. [Google Scholar] [CrossRef]
- Alobaid, M.; Abo-Khalil, A.G. A Comprehensive Review and Assessment of Islanding Detection Techniques for PV Systems. Int. J. Thermofluids 2023, 18, 100364. [Google Scholar] [CrossRef]
- Lerch, T.; Barczentewicz, S. Islanding Detection of Wind Power Plant with Doubly Fed Induction Generator. In Proceedings of the 2018 International Symposium on Electrical Machines (SME), Andrychów, Poland, 10–13 June 2018. [Google Scholar]
- Raza, S.; Arof, H.; Mokhlis, H.; Mohamad, H.; Illias, H.A. Passive Islanding Detection Technique for Synchronous Generators Based on Performance Ranking of Different Passive Parameters. IET Gener. Transm. Distrib. 2017, 11, 4175–4183. [Google Scholar] [CrossRef]
- Reddy, S.V.R.; Premila, T.R.; Reddy, C.R.; Alharbi, M.A.; Alamri, B. Passive Island Detection Method Based on Sequence Impedance Component and Load-Shedding Implementation. Energies 2023, 16, 5880. [Google Scholar] [CrossRef]
- Murugesan, S.; Venkatakirthiga, M. Active Unintentional Islanding Detection Method for Multiple PMSG Based DGs. IEEE Trans. Ind. Appl. 2020, 56, 3919–3931. [Google Scholar] [CrossRef]
- Sivadas, D.; Vasudevan, K. An Active Islanding Detection Strategy with Zero Non Detection Zone for Operation in Single and Multiple Inverter Mode Using GPS Synchronized Pattern. IEEE Trans. Ind. Electron. 2020, 67, 6570–6580. [Google Scholar] [CrossRef]
- Ropp, M.; Aaker, E.; Haigh, K.; Sabbah, J. Using Power Line Carrier Communication to Prevent Islanding. In Proceedings of the IEEE Photovoltaic Specialists Conference, Anchorage, AK, USA, 15–22 September 2000; pp. 1158–1161. [Google Scholar]
- Katyara, S.; Hashmani, A.; Chowdhary, B.S.; Musavi, H.B.; Aleem, A.; Chachar, F.A.; Shah, M.A. Wireless Networks for Voltage Stability Analysis and Anti-Islanding Protection of Smart Grid System. Wirel. Pers. Commun. 2021, 116, 1361–1378. [Google Scholar] [CrossRef]
- Wang, X.; Blaabjerg, F. Harmonic Stability in Power Electronic-Based Power Systems: Concept, Modeling, and Analysis. IEEE Trans. Smart Grid 2019, 10, 2858–2870. [Google Scholar] [CrossRef]
- Murugesan, S. A Hybrid Unintentional Islanding Identification Methodology for IIDGs. In Proceedings of the 2022 IEEE International Conference on Power Electronics, Drives and Energy Systems (PEDES), Jaipur, India, 14–17 December 2022; pp. 1–5. [Google Scholar]
- Resende, Ê.C.; Simões, M.G.; Freitas, L.C.G. Anti-Islanding Techniques for Integration of Inverter-Based Distributed Energy Resources to the Electric Power System. IEEE Access 2024, 12, 17195–17230. [Google Scholar] [CrossRef]
- Serrano-Fontova, A.; Casals Torrens, P.; Bosch, R. Power Quality Disturbances Assessment during Unintentional Islanding Scenarios: A Contribution to Voltage Sag Studies. Energies 2019, 12, 3198. [Google Scholar] [CrossRef]
- Choudhury, B.K.; Jena, P. Impedance Severity Index Based Hybrid Islanding Detection Approach for Zonal DC Microgrids. In Proceedings of the 2023 IEEE 3rd International Conference on Sustainable Energy and Future Electric Transportation (SEFET), Bhubaneswar, India, 9–12 August 2023; pp. 1–6. [Google Scholar]
- Chauhdary, S.T.; Khan, T.S.; Arif, S.; Ahmad, A.; Shah, M.A.; Baili, J. Microgrid Anti-Islanding Protection Scheme Based on Deep Neural Network Algorithm and Unscented Kalman Filtering. Sci. Rep. 2025, 15, 28726. [Google Scholar] [CrossRef] [PubMed]
- Sarhan, M.A.; Barczentewicz, S.; Lerch, T. Hybrid Islanding Detection Method Using PMU-ANN Approach for Inverter-Based Distributed Generation Systems. IET Renew. Power Gener. 2024, 18 (Suppl. S1), 4453–4464. [Google Scholar] [CrossRef]
- Bernstein, A.; Le Boudec, J.-Y.; Reyes-Chamorro, L.; Paolone, M. Real-Time Control of Microgrids with Explicit Power Set-Points: Unintentional Islanding. In Proceedings of the 2015 IEEE Eindhoven PowerTech, Eindhoven, The Netherlands, 29 June–2 July 2015; pp. 1–6. [Google Scholar]
- Wang, Y.; Tang, J.; Si, J.; Xiao, X.; Zhou, P.; Zhao, J. Power Quality Enhancement in Islanded Microgrids via Closed-Loop Adaptive Virtual Impedance Control. Prot. Control Mod. Power Syst. 2023, 8, 10. [Google Scholar] [CrossRef]
- PN-EN 62116:2014; Utility-Interconnected Photovoltaic Inverters—Test Procedure of Islanding Prevention Measures. Polish Committee for Standardization: Warsaw, Poland, 2014.
- Barczentewicz, S.; Lerch, T.; Bień, A.; Duda, K. Laboratory Evaluation of a Phasor-Based Islanding Detection Method. Energies 2021, 14, 1953. [Google Scholar] [CrossRef]
- Duda, K.; Zieliński, T.P.; Barczentewicz, S. Perfectly Flat-Top and Equiripple Flat-Top Cosine Windows. IEEE Trans. Instrum. Meas. 2016, 65, 1853–1864. [Google Scholar] [CrossRef]
- Duda, K.; Zieliński, T.P. FIR Filters Compliant with the IEEE Standard for M Class PMU. Metrol. Meas. Syst. 2016, 23, 63–74. [Google Scholar] [CrossRef]
- Wu, H.; Wang, X. Design-Oriented Transient Stability Analysis of PLL-Synchronized Voltage-Source Converters. IEEE Trans. Power Electron. 2020, 35, 3573–3589. [Google Scholar] [CrossRef]
- Gurugubelli, V.; Ghosh, A.; Panda, A.K. Parallel Inverter Control Using Different Conventional Control Methods and an Improved Virtual Oscillator Control Method in a Standalone Microgrid. Prot. Control Mod. Power Syst. 2022, 7, 29. [Google Scholar] [CrossRef]


Disclaimer/Publisher’s Note: The statements, opinions and data contained in all publications are solely those of the individual author(s) and contributor(s) and not of MDPI and/or the editor(s). MDPI and/or the editor(s) disclaim responsibility for any injury to people or property resulting from any ideas, methods, instructions or products referred to in the content. |
© 2025 by the authors. Licensee MDPI, Basel, Switzerland. This article is an open access article distributed under the terms and conditions of the Creative Commons Attribution (CC BY) license (https://creativecommons.org/licenses/by/4.0/).