Abstract
Carbon emission trading and green certificate trading mechanisms constitute the cornerstone of low-carbon transitions in integrated energy systems (IESs). However, independent operation of these mechanisms creates coordination barriers that limit their synergistic emission reduction and economic potential. To address this problem, this paper propose a novel low-carbon cooperative operation model based on a green certificate and carbon emission trading mechanism. First, to maximize the environmental value benefits of the system, a dual-market linkage mechanism is constructed, which is mediated by the carbon reduction attributes of green certificates. Second, a multi-operator cooperative alliance is established based on cooperative game theory, and the Shapley value method is employed to rationally allocate cooperative surplus, thereby enhancing the multi-energy complementarity of the IES. Case analysis indicates that under this strategy, the system’s carbon emissions intensity decreased by 30%, while the alliance’s overall operating revenue increased by 22.6%, achieving low-carbon economic operation of IES.
1. Introduction
In recent years, alongside the sustained expansion of the global economy, energy consumption demand has shown a significant growth trend [1]. Within the power generation sector, fossil fuels serve as the core pillar of the current energy system, and the greenhouse gases emitted from their combustion have become a primary driver of global climate change [2]. China’s 2020 announcement of the ‘Dual Carbon’ goals has intensified the urgency for the power sector to adopt low-carbon technologies and pursue green transformation [3]. The transformation of energy consumption patterns constitutes a critical pathway for achieving energy conservation and emission reduction [4]. Integrated energy systems that emphasize the coordinated operation of multiple energy subsystems to enhance overall efficiency have thus garnered extensive scholarly attention [5]. Overreliance on fossil fuels constitutes the primary barrier to achieving energy conservation and emission reduction targets. This necessitates a deep decarbonization transition via substitution of high-carbon fuels with renewable energy sources [6]. However, elevated penetration of wind and solar installations intensifies power volatility, leading to high curtailment rates [7]. Therefore, integrating carbon capture (CCS) with power-to-gas (P2G) technologies to establish bidirectional electricity-to-gas conversion hubs is essential. This approach enables coordinated intermittency mitigation, thereby enhancing system operational stability [8]. References [9,10] indicated that by integrating the source-side coupling mechanism of CCS-P2G as a key coupling unit within the system, its conversion efficiency significantly impacts the system economics under scenarios involving high penetration of renewable energy.
Market-based mechanisms represent a significant institutional innovation for carbon emission reduction and renewable energy integration. Carbon emissions trading (CET) commoditizes environmental rights, constraining actual carbon emissions through quota allocation and the resulting carbon price [11,12]. Analogously, green certificate trading (GCT) aims to strengthen the market position of renewable energy generators by providing economic incentives and bridging the electricity market with renewable energy policies [13]. References [14,15] established multi-objective optimization models integrating carbon and green certificate trading markets. These models demonstrate that the market mechanisms synergistically enhance renewable energy accommodation rates and reduce carbon emissions, thus providing innovative strategic pathways for low-carbon transition of power systems.
However, the aforementioned studies primarily focused on the independent operation of two market mechanisms, failing to adequately consider the synergistic transmission mechanisms between the two markets and their coupled effects on the critical influence of system optimization pathways [16]. With the progressive refinement of carbon emission trading and green certificate trading mechanisms, the synergistic interactions between these two markets have garnered significant scholarly attention [17]. Reference [18] proposed a carbon-green certificate joint trading market framework that incorporates a combinatorial double auction mechanism, achieving dual improvements in economic cost reduction and renewable energy accommodation capacity. Reference [19] proposed an optimization model for the cooperative operation of multiple microgrids that considers the synergistic mechanism between green certificates and carbon trading. Based on Nash bargaining theory and the ADMM algorithm, it significantly reduces carbon emissions while enhancing the system’s economic efficiency. Reference [20] developed a carbon and green certificate bidirectional interaction mechanism that incorporates dynamic complementarity into market design, driving energy transition through economic incentives.
However, in actual market operations, complex stakeholder interest conflicts may undermine participation motivation. Without effective coordination, these conflicts could diminish or even negate the mechanism’s incentive effects. For multi-stakeholder interest conflicts and strategic decision dilemmas, game theory provides a theoretical underpinning by revealing system-wide optimal operational paradigms through equilibrium analysis, thereby coordinating interest disputes and optimizing resource allocation [21]. Reference [22] established a cooperative game model within a multi-regional IES collaborative optimization framework, guiding low-carbon dispatch through dynamic carbon pricing signals to achieve dual enhancement in economic efficiency and environmental sustainability. References [23,24,25,26] examined the impact of coalition strategies among stakeholders on the effectiveness of participating in the CET and GCT markets under different game frameworks, as well as the potential for low-carbon economic operations in IES under various game strategies. However, the aforementioned literature primarily focuses on economic and information interactions between the market level and multi-level energy systems. The unit models constructed for electricity, gas, and heat within IES are relatively simplistic, making it difficult to reflect the energy coupling relationships and energy flows among various entities within the system. Consequently, the exploration of IES carbon reduction potential remains insufficiently in-depth.
Against this backdrop, this paper proposes a novel low-carbon cooperative operation model based on a green certificate and carbon emission trading mechanism. Section 1 introduces the IES operational framework, followed by an analysis of CET and GCT mechanisms and their synergistic linkage in Section 2. Section 3 formulates a cooperative game-theoretic model for IES; this model is formulated in a linear program and solved as a mixed-integer linear programming (MILP) problem. Finally, case studies validate the proposed method’s effectiveness in enhancing system economics and carbon reduction.
The main innovations or contributions of this paper are as follows:
(1) Constructing a cooperative game-based optimization dispatch model for electricity-gas-heat coupled IES and solving for optimal dispatch schemes by balancing dual objectives: maximizing alliance-wide benefits while imposing rational constraints on individual entities.
(2) This paper aims to quantitatively evaluate the driving effects of the green certificate and carbon joint trading market mechanism on the low-carbon performance and economic efficiency of IES. It compares and analyzes the mechanism’s differentiated impacts on operational costs, environmental benefits, carbon emission intensity, and renewable energy absorption rates, revealing the positive role of market synergy in enhancing system net benefits and carbon reduction.
(3) Demonstrating the positive guiding role of cooperative alliances in decision-making and analyzing alliance-wide operational costs and marginal benefits using the Shapley value method to achieve maximized system economic efficiency and environmental benefits.
2. Operational Framework of IES
The integrated energy system established in this study encompasses three energy forms: electricity, gas, and heat. Based on the heterogeneity of energy forms and generation technologies, the system is structured into three entities: carbon capture power plant (CCPP), gas-fired thermal power plant (GTPP), and renewable energy supplier (RES), as illustrated in Figure 1. The RES comprises wind turbine (WT), photovoltaic (PV) power, and electrical energy storage (EES) devices, which are primarily responsible for supplying electricity within the system. The GTPP integrates the combined heat and power (CHP), gas boilers (GBs), and power-to-gas equipment [8]. It primarily meets system heat and gas demands while participating in electricity load regulation. Natural gas produced by P2G equipment is prioritized for on-site supply, with surplus gas injected into the gas grid. The CCPP primarily meets electricity demand while utilizing carbon capture equipment to capture carbon dioxide emissions from both itself and the GTPP. The captured CO2 serves as feedstock for the P2G process, replacing externally procured raw materials and thereby reducing carbon allowance costs. This coupled model integrates material and energy cycles, lowering system operating costs while achieving lifecycle carbon emissions reductions.
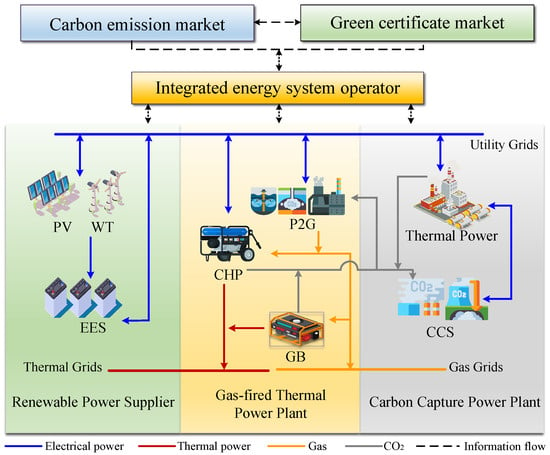
Figure 1.
Integrated energy system framework.
The communication aspects of this study encompass the market layer and IES operators. The market layer includes the CET and GCT mechanisms, broadcasting key price signals (such as carbon allowance and green certificate prices) to IES operators. Operators then establish bidirectional communication with three parties, transmitting price signals and dispatch instructions while receiving real-time operational status and forecast data. This integrated information flow enables centralized optimization of unit dispatch and trading strategies, ensuring real-time system balance, minimizing operational costs, and advancing low-carbon objectives.
In real-world scenarios, the entities within the described system typically operate independently. In contrast, the IES proposed in this paper promotes the establishment of a cooperative alliance among the three parties. Each entity accepts centralized dispatch, fulfilling renewable energy consumption obligations and adhering to carbon emission quota constraints while meeting system load demands. Resources and benefits are allocated according to the alliance’s specific distribution principles to generate.
3. Modeling of IES Participation in Market Transactions
3.1. Green Certificate Trading Mechanism
Green certificates can serve as a market-based mechanism to replace traditional renewable energy subsidy policies, thereby promoting the development of renewable energy. In this study, the primary participant in green certificate trading is renewable energy suppliers, and the number of green certificates must comply with the renewable energy consumption allowance accountability assessment mandated by superior regulatory authorities.
To accurately calculate the total green certificate demand of the IES over its entire life-cycle, this study determines the current quota target electricity volume based on historical quota fulfillment performance. The calculation model for the required number of green certificates is shown in Formula (1), which systematically expresses the determination method for the quota target electricity volume and its key influencing factors.
where is the quota indicator for the number of green certificates the system is required to hold, is the green certificate quota coefficient, and is the renewable energy quota electricity demand. The first equation in (1) defines the number of green certificates the system must hold. is the renewable energy quota coefficient, is the historical green certificate assessment completion impact coefficient, is the total system electricity demand during the dispatch period, and the second equation in (1) calculates the quota electricity demand, with its core being the multiplication of the system’s total electricity demand by the base quota coefficient, followed by adjustments based on historical fulfillment rates. The third equation in (1) quantifies the impact of historical quota fulfillment on the current target. is the historical green certificate assessment completion impact weight; and denote the system historical renewable energy quota completion coefficient and completion average, respectively; and is the unit dispatch period.
According to the existing green certificate assessment system, this paper incorporates the impact of renewable energy output forecast accuracy on green certificate allocation. Green certificates are correspondingly increased or decreased as incentives or penalties to better align with reality. The actual number of green certificates obtained can be written as follows:
where is the power prediction impact parameter, is the actual power generation of the i type of renewable energy unit, where N = 2; is the weight assigned to power prediction influence, is the accuracy of the previous period’s power prediction, and is the benchmark value for prediction accuracy. Equation (2) establishes a quantitative relationship between prediction accuracy and economic incentives.
Combining (1) with (2), the actual volume of GCT by IES is expressed by
and when is positive, it indicates that the assessed performance has exceeded the evaluation standard, and the surplus portion may be sold on the GCT to generate revenue. In contrast, when is negative, it signifies that the compliance entity has not yet met the required standard and must purchase additional green certificates from the market to meet the obligations of the renewable portfolio standard (RPS).
3.2. Carbon Emission Trading Mechanism
In China’s current carbon emission trading system, the allocation of free carbon emission allowances is predominantly conducted through the benchmarking approach, which considers both the installed capacity and carbon emission proportions of regulated entities. Given that renewable energy units exhibit significantly lower carbon emission intensity, the analytical focus of this research model is specifically directed toward the carbon accounting of conventional fossil-fueled generation units. The system’s carbon allowances and actual carbon emissions can be written as follows:
where and denote the system’s allocated carbon quota and actual carbon emissions, respectively; and denote the carbon quota coefficients for CCPP and GCTP, respectively; is the equivalent electrical output power of the CCPP; is the actual electrical output power of the GTPP; and the first equation in (4) defines the total carbon emission allowances allocated by the system over the time period T. The second equation in (4) represents the actual carbon emissions from the two power plants within the system. is the actual carbon emissions from GTPP; is the actual carbon emissions from CCPP; and denote the actual carbon emissions from the CHP unit and GB in GTPP, respectively; denotes the actual carbon emissions from the thermal power unit in CCPP; and is the carbon emissions captured by CCS. The third and fourth equations in (4) decompose the sources of carbon emissions within their respective power plants.
According to (4), the carbon emission allowance participating in the CET can be expressed as
when the value of is positive, it indicates that the regulated entity has failed to meet its compliance target during the settlement period, with actual carbon emissions exceeding the allocated allowance; thus, it must purchase additional carbon emission rights to cover the deficit. Conversely, when is negative, it signifies that the entity possesses a surplus of carbon allowances, which may be sold on the carbon market to generate revenue from emission reductions.
3.3. Joint Trading Mechanism of Carbon Emission and Green Certificate
The integrated energy system simultaneously participates in the green certificate and carbon joint trading market. To avoid double counting of environmental attributes and clarify the ownership of green benefits, when a renewable energy generation entity fulfills its carbon quota compliance obligation, the corresponding environmental attributes of the green certificates must be deducted. In this scenario, the power generation entity does not directly participate in the carbon market; instead, it engages in carbon trading indirectly by purchasing green certificates. The synergistic interaction between the two markets is evaluated by analyzing factors such as their respective demand levels and transaction prices. The specific interaction mechanism is illustrated in Figure 2.
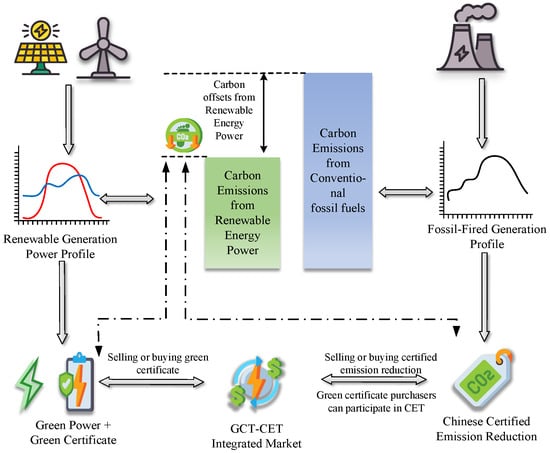
Figure 2.
Schematic diagram of the interaction principle of carbon trading and green certificate trading.
This mechanism outlines an integrated market framework combining green power, green certificates, and carbon trading. Its core process involves renewable energy and fossil fuel power generation data being reported separately to respective market platforms and renewable energy generating green certificates based on its output, while fossil fuel generation produces corresponding carbon emissions. Within the GCT-CET integrated market, renewable electricity can be traded bundled with green certificates. When electricity purchasers acquire this “green power + certificate” bundle, the associated carbon reduction benefits can offset their own generation-related emissions. This effectively bridges the physical energy market with the virtual credit market, achieving carbon reduction targets.
After clarifying the ownership of green rights, the carbon emission reduction benefits associated with green certificates can serve as a link to integrate both the GCT and CET markets. The calculation of the carbon emissions offset by green certificates is expressed as follows:
where is the carbon emissions reduced through green certificates, is the conversion factor between green certificates and carbon emission allowances, and is the number of green certificates participating in the conversion.
Under the influence of the green certificate and carbon joint trading mechanism, both the carbon emission rights and green certificate trading volume of IES have undergone changes. Equation (7) indicates that the adjusted quantity of carbon emission rights can be formulated as
In addition to energy exchanges, RES directly participates in GCT and indirectly participates in CET through green certificate purchasers. At this point, the system’s participation in green certificate market revenue is expressed as
where is the unit price of green certificates.
System participation in carbon trading market revenue is expressed as
where is the unit price of carbon emission rights trading. Equation (9) indicates that carbon trading revenues are the product of the carbon allowance price and the net carbon allowances calculated according to (7). This clearly establishes a direct link between carbon market outcomes and adjusted revenues under the joint trading mechanism.
4. Cooperative Game Mathematical Model of IES
4.1. Carbon Capture Power Plant Model
The CCPP consists of conventional thermal power units integrated with carbon capture equipment. Carbon capture technology consumes electrical energy to capture the CO2 generated from fossil fuel combustion at the source, thereby reducing carbon emissions. The operational model of the carbon capture power plant can be expressed as
where is the equivalent electrical output power of the CCPP, is the energy consumption for carbon capture provided by the thermal power units, is the actual grid-connected power, and the first equation in (10) defines the overall energy conversion scale of the CCPP at a given time t. The fuel energy input is ultimately converted into two components: electricity transmitted to the grid and electricity used to capture the carbon dioxide it generates. Therefore, represents the total theoretical power output of the power plant without considering the energy consumption of carbon capture. is the energy consumption of carbon capture equipment, and and denote the fixed energy consumption and operational energy consumption of carbon capture equipment, respectively. The second equation in (10) provides an in-depth characterization of the operational characteristics of carbon capture equipment itself, decomposing the total energy consumption of carbon capture into fixed energy consumption and operational energy consumption. Fixed energy consumption represents the baseline power required whenever the carbon capture equipment is operational, regardless of actual CO2 capture activity. This component remains relatively stable. In contrast, operational energy consumption is variable and directly correlates with capture volume. The greater the amount of CO2 captured, the higher this energy consumption becomes.
For detailed operational constraints of carbon capture power plants, refer to Appendix A Equation (A1).
During cooperative operation, in accordance with the alliance’s resource allocation principles, the energy consumption of CCS must be jointly supplied by thermal power units and the RES, specifically wind power and photovoltaic power, the energy consumption of CCS is expressed as
where and denote the energy consumption for carbon capture provided by WT and PV, respectively.
Carbon capture equipment captures CO2 generated within the system and transports it to new production processes for recycling, thereby reducing both storage costs and carbon purchase expenses. The captured CO2 can be expressed as follows:
where is the total amount of CO2 captured by the CCPP at time t, measured in t/h, and is the operational energy consumption per unit of CO2 processed by the carbon capture equipment, measured in MW.
At this time, the net CO2 emissions from the CCPP can be expressed as
where is the net CO2 emissions from the CCPP and is the carbon emission intensity of electricity generation at the CCPP.
4.2. Gas-Fired Thermal Power Plant Model
Compared to single-function units like thermal power units, the core equipment of GTPP consists of CHP units and GB. P2G equipment mainly handles natural gas production, serving as the primary natural gas supply source.
Due to the “heat-driven power generation” operating mode, CHP units must simultaneously respond to fluctuations in both electrical and thermal loads. This paper adopts extraction-type CHP units, which offer greater operational flexibility. The CHP model can be expressed as
where is the total power generated by the CHP unit after burning gas; is the air intake volume of the CHP unit, in m3; is the lower heating value of gas, in MJ/m3; and denote the electrical and thermal power output of the CHP unit, respectively; and and denote the electrical and thermal power conversion efficiency of the CHP unit, respectively. This equation describes the energy conversion sources within a CHP unit and how the total input chemical energy is allocated with a certain efficiency into electrical and thermal energy. For the units studied in this paper, thermal output is typically determined by the thermal load demand and is the primary target to be met. Once established, and with total input energy constrained by equipment limits, the adjustment range for electrical output becomes strictly constrained. This is the most critical operational characteristic of the CHP unit model, significantly impacting the flexibility of the entire system.
Gas boilers (GBs) serve as highly efficient thermal conversion equipment, transforming the chemical energy of natural gas into thermal energy through combustion. This process causes the working fluid (water) within the boiler’s heat transfer surfaces to absorb heat and vaporize, generating a thermodynamic steam medium. Ultimately, this steam is transported as a heat carrier to the terminal heating load system; the unit model is shown in Equation (15).
where is the thermal power generated by the GB; is the thermal efficiency of the GB; is the GB air intake volume in cubic meters; and denote the upper and lower limits of the GB thermal output capacity, respectively; and and denote the upper and lower limits of the ramp rate of the GB thermal output power, respectively.
The P2G process comprises two stages: the first stage primarily involves hydrogen production, where electrical energy is converted into hydrogen energy through water electrolysis in an electrolyzer; the second stage involves hydrogen consumption, where hydrogen is converted into methane (CH4) via the Sabatier reaction. The model of P2G can be expressed as
where is the volume of natural gas produced by the P2G equipment, is the conversion efficiency of the P2G unit, is the electrical power consumed by the P2G unit during time interval t, is the CO2 consumption of the P2G process, and is the amount of CO2 required to generate one unit of power in natural gas. This equation calculates the amount of natural gas with usable thermal value that can be produced within time interval t, encompassing both the electrolysis and methanation stages. It serves as the key coupling between the P2G model and CCS equipment. In integrated energy system optimization, it functions as a “demand signal,” indicating to CCS equipment how much CO2 it needs to supply.
The operational constraints of the GTPP units are specified in Appendix A, Equations (A2) and (A3).
Upon establishment of the cooperative alliance, in accordance with the alliance’s resource allocation principles, the energy consumption and CO2 emissions required for P2G equipment shall be supplied by RES and CCPP to reduce the costs associated with wind and solar curtailment penalties and carbon offset purchases. The consumption of P2G can be expressed as
where is the electrical power consumed by the P2G device, and denote the electrical power supplied to the P2G device by WT and PV, at time t.
During cooperative operation, the CO2 required by the P2G equipment is supplied by CCS facilities, with any remaining shortfall procured from external sources:
where is the amount of CO2 purchased from external sources and is the amount of CO2 supplied to P2G captured by CCS equipment.
4.3. Renewable Energy Supplier Model
Under the provisions of the cooperative alliance, RES primarily handles the electrical power consumption of CCPP and GTPP within the system, along with a portion of the electrical load. The related constraints are defined as follows:
where is the actual output of the RES; and denote the actual power of WT and PV, respectively; and , , and denote the actual power fed into the utility grid by the RES and supplied to the CCPP and GTPP, respectively.
The output of WT and PV power generation must satisfy power balance constraints, including forecasted power, actual output power, curtailed wind and solar power, and power allocation balance. As the primary green power sources within the renewable energy system, their output must adhere to the coordinated operation strategy within the alliance.
where and represent the predicted values of WT and PV at time t, respectively, derived from meteorological data or historical records. Actual output power and may fall below these predicted values, with the difference and indicating curtailed wind and solar power. and are the grid-connected power outputs of PV and WT, respectively. Among these, the inequalities represent output power limits and power distribution constraints, respectively, to achieve system power balance and multi-energy complementarity.
EES alleviates the mismatch between renewable energy output and load demand. This study selects lithium batteries as the electrical energy storage device, whose mathematical model is expressed in terms of state of charge. It includes the SOC dynamic model of lithium battery energy storage systems, encompassing charging and discharging processes, efficiency losses, and state constraints:
where and denote the charging and discharging efficiency of the EES at time t; is the EES loss rate; accounts for self-discharge losses; and represent the contributions of charging and discharging to SOC, respectively; and and denote the charging and discharging states of the EES at time t, respectively, and ensure that the EES can only be in one of the following states at any given time: charging, discharging, or idle. and denote the charging and discharging power of the EES at time t, respectively; and denote the minimum and maximum values of the EES charging and discharging power, respectively; and denote the minimum and maximum charge states of the EES, respectively; and , , and denote the charge states at the initial moment, time t, and the final moment within the EES charging cycle, respectively, requiring the SOC to return to its initial value at the end of the scheduling cycle to prevent deep discharge or overcharging.
4.4. Operational Constraints
The electric power balance constraint can be expressed as
Under the cooperative operation of the system, all entities must satisfy system load requirements while adhering to the operational constraints of the cooperative alliance; the related constraints can be expressed as:
The thermal power balance constraint can be expressed as
where is the electrical load within the system, is the grid-connected electricity output from the GTPP, and is the thermal load within the system.
4.5. Objective Function
To reflect the economic efficiency of the IES under the cooperative alliance, both carbon revenue and green certificate revenue are calculated for the alliance as a whole. During revenue distribution, attribution calculations and allocations are based on each member’s marginal contribution to the alliance’s overall value. The optimization function for scheduling with the objective of minimizing IES operating costs is expressed as
The specific operational cost and revenue objective function equatuina are provided in Appendix B, Equations (A4)–(A8).
5. Case Study and Results Analysis
This study constructs a model based on the integrated energy system of a certain industrial park in Inner Mongolia, China. For this model, the study employs the solver CPLEX Interactive Optimizer within the MATLAB 2020a environment to perform the optimization.
5.1. Simulation Scenario Setup
To validate the effectiveness of the proposed strategy, this study conducted analyses of energy interaction, economic performance, and carbon emission reductions under the four operational scenarios shown in Table 1.

Table 1.
Information on each scene.
The solar and wind power forecast data and real-time electricity and heat load for this system are shown in Figure 3 and Figure 4. This comparison examines the impact of different market mechanisms and operational modes on the system.
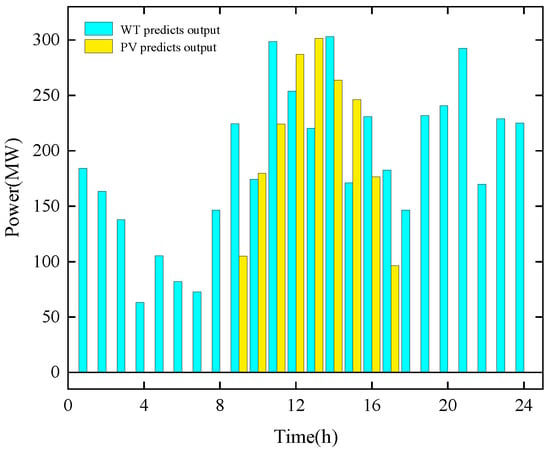
Figure 3.
Forecast output of PV and WT.
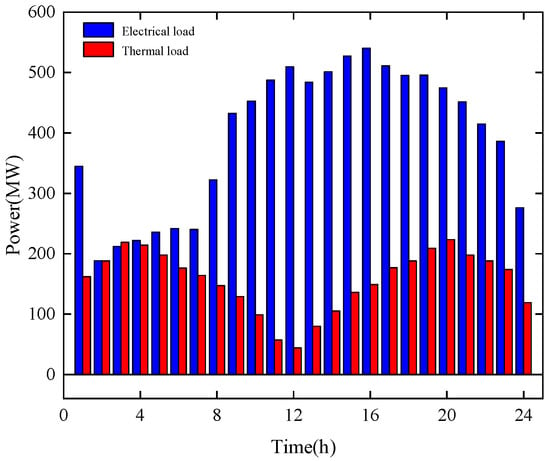
Figure 4.
Real-time electricity load and hot load of the system.
5.2. Analysis of Simulation Results
Based on the economic analysis results shown in Table 2, Table 3 and Table 4, Scenario 1—the strategy proposed in this study—achieves the highest total revenue. Compared with Scenario 2, which does not consider green certificate trading, Scenario 1 ensures balanced output between conventional thermal power units and new energy units, maximizes electricity sales revenue, and increases total revenue by USD 29,151.58 due to enhanced environmental benefits.

Table 2.
Results of each subject’s operation.

Table 3.
Comparison of profit and cost result (Part 1).

Table 4.
Comparison of profit and cost result (Part 2).
Compared with Scenario 1, Scenario 3 lacks participation in the carbon trading market, resulting in insufficient carbon emission reduction constraints on conventional thermal power units. Under these circumstances, CCS equipment lacks operational incentives, leading to a reduction in carbon sequestration costs. However, the system heavily relies on P2G units to absorb surplus electricity, causing an increase in P2G operation costs by USD 8444.72. In conclusion, the joint interaction mechanism of GCT and CET can significantly enhance the economic performance of the system and stimulate the initiative for renewable energy output.
Compared to Scenario 1, Scenario 4 shows a total revenue reduction of USD 53,613.56, representing a 30% drop. This is partly due to insufficient economic incentives for RES caused by the absence of market mechanisms. Additionally, the random and fluctuating nature of renewable energy output within the system necessitates P2G equipment to absorb surplus electricity, resulting in peak operational costs for P2G devices. In conclusion, collaborative operation significantly improves the economic performance of the system compared to independent operation. Therefore, implementing the coordinated operation of CET and GCT is an imperative choice for achieving overall system rationality. However, the current cost and benefit allocation structure is unreasonable. Since the electricity costs for P2G, CO2
purchase costs, and operational and maintenance costs are entirely borne by the GTPP, while the additional carbon benefits and reduced carbon sequestration costs generated for the system are attributed to the RES and CCPP, respectively, this results in a cost increase of USD 27,529.66 under the cooperative model compared to independent operation. This is clearly unreasonable, necessitating a rational redistribution of cooperative surplus to enhance member motivation within the alliance.
5.3. Rationality Verification in Cooperative Games
To conduct a comparative analysis of the performance of the IES under the different cooperative models studied in this paper, five comparison scenarios were established: independent operation versus three bilateral cooperative models {RES, CCPP} alliance, {RES, GTPP} alliance, and {CCPP, GTPP} alliance and one tripartite cooperative model {RES, CCPP, GTPP} alliance. The operating costs and revenues for different energy entities within the system under each scenario are presented in Table 5.

Table 5.
Comparison of profit result.
The Shapley value method allocates benefits based on each member’s marginal contribution to the coalition. Specifically, the benefit received by a member equals the average marginal benefit that higher-ranking members generate through their participation in the coalition. To resolve conflicts arising from benefit distribution among multiple players during cooperation, the equations of payoff allocation can be expressed as
where S is different alliances formed by different members, is the number of members included in the alliance, is the weighting factor for the benefits members should receive from the alliance as a whole, is the marginal contribution a member makes to their own alliance participation by joining different alliances, is the profit-sharing scheme for member, and is the alliance’s total profit. Based on the data shown in Table 2, Table 3, Table 4 and Table 5, the process for validating the rationality of the cooperative alliance is as follows:
The allocation process based on the Shapley value method is shown in Table 6, Table 7 and Table 8. The daily profit results for each participant, calculated using Equation (27), are compared in Table 9.

Table 6.
Profit distribution of RES based on the Shapley value method.

Table 7.
Profit distribution of CCPP based on the Shapley value method.

Table 8.
Profit distribution of GTPP based on the Shapley value method.

Table 9.
The distribution results of Shapley and comparison with the independent operation.
In summary, after the establishment of the cooperative alliance and the allocation of resources using the Shapley value method, the overall system revenue increased by USD 155,136.93 compared to the independent operation model, meeting the requirements of collective rationality. The profits of individual participants within the alliance also increased. Specifically, RES, CCPP, and GTPP achieved profits of USD 66,505.93, USD 26,991.28, and USD 61,639.72, respectively. The significant rise in each entity’s profits demonstrates that individual rationality is also satisfied. Therefore, this cooperative alliance is established under the dual conditions of fulfilling both collective rationality and individual rationality.
5.4. Analysis of Cooperative Mode Scheduling Results
The operational results of the IES in Scenario 1 are shown in Figure 5, Figure 6, Figure 7 and Figure 8. During the period from 01:00 to 08:00, the system’s electrical load demand was low, and renewable energy generation was relatively limited. Meanwhile, the thermal load demand remained relatively high. Due to electrical output constraints, the CHP unit reached its heating capacity limit. Therefore, the GB unit was activated to supply additional thermal energy, helping to meet the demand and alleviate supply pressure.
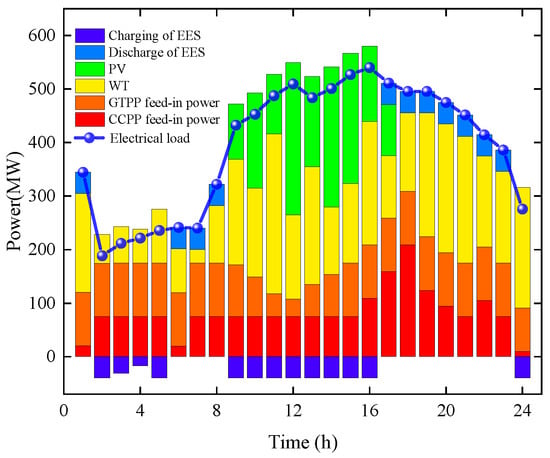
Figure 5.
Cooperation model electricity scheduling results.
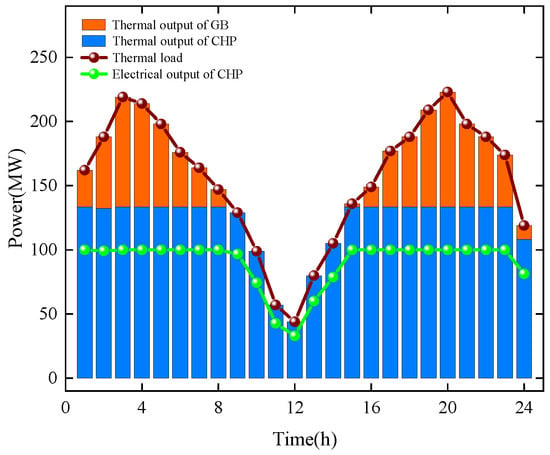
Figure 6.
Cooperation model thermal energy scheduling results.
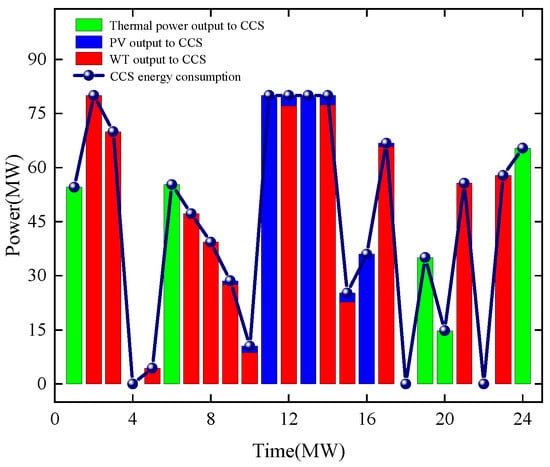
Figure 7.
Carbon capture energy consumption scheduling results.
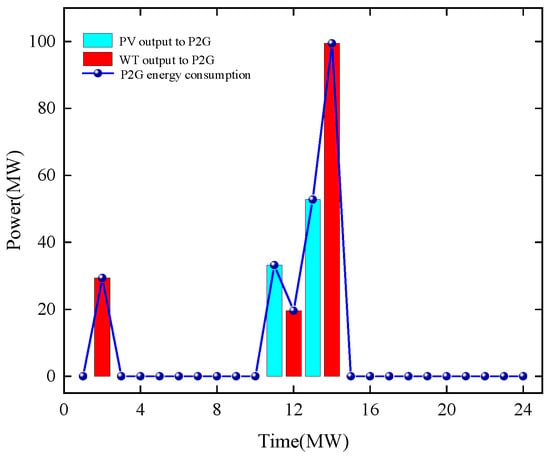
Figure 8.
Power to gas energy consumption scheduling results.
During the 08:00–12:00 period, the PV output increases. EES, CCS units, and P2G equipment, functioning as demand-side adjustable loads, begin absorbing surplus electricity to avoid wind and solar curtailment penalties. Carbon capture energy consumption peaks between 11:00 and 12:00.
During the 12:00–16:00 period, electricity demand remains consistently high. Abundant renewable energy sources take priority in meeting primary load requirements, while CCPP and GTPP capacity approaches saturation during this period. The EES struggles to fully absorb surplus electricity. CCS units and P2G equipment leverage their adjustable energy consumption characteristics to effectively mitigate the temporal mismatch between RES generation and electricity demand, achieving superior peak-shaving and valley-filling effects.
During the 16:00–20:00 period, PV generation output significantly declines. The system’s electricity demand is primarily met by increased CCPP output and WT combined. Due to the elevated CCPP output, system carbon emissions remain persistently high, requiring continuous operation of CCS equipment to meet carbon reduction targets. With insufficient surplus electricity in the system, P2G equipment was decommissioned. During this period, energy released from EES effectively alleviated supply pressure and enhanced system stability.
During the 8:00 p.m. to 12:00 a.m. period, the system’s total load demand shows a significant decline, with renewable energy output following this trend. At this time, the small surplus electricity within the system is supplied to the CCS to reduce carbon emissions.
In summary, under cooperative operation, the economic incentive and transmission mechanism based on GCT and CET effectively leverages the advantages of centralized dispatch. This enhances proactive green energy consumption at the energy exchange level, representing a viable approach to improving the operational flexibility and low-carbon performance of the IES.
5.5. IES Carbon Emissions Reduction Analysis
A comprehensive analysis of Figure 7 and Figure 9 along with Table 10 reveals that under the independent operation model of alliance members, CCS energy consumption is constrained by relying solely on CCPP output supply, consequently reducing CO2 processing capacity. Simultaneous independent operation reduces the incentive for renewable energy output, leading to increased average output levels for thermal units in CCPP and GTPP. This significantly elevates carbon emission intensity, resulting in actual system emissions exceeding carbon allowances. Consequently, carbon trading revenue is USD −13,315.19.
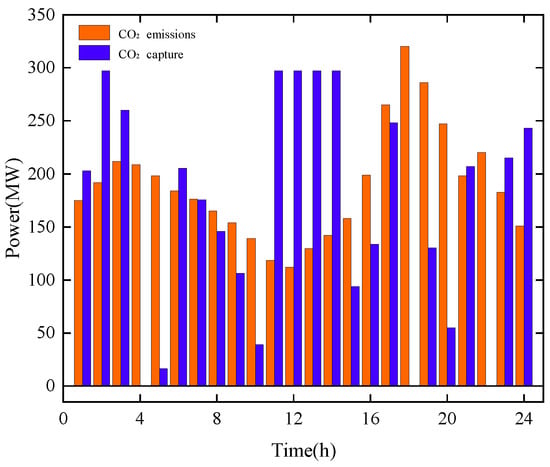
Figure 9.
The carbon reduction results of IES.

Table 10.
Results of IES cooperative alliance carbon trading.
However, under the cooperative operation model, CCS prioritizes the consumption of surplus renewable energy to reduce penalties for curtailed wind and solar power, significantly enhancing CO2 processing capacity. The capture volume increases by 3546.68 tons compared to independent operation. Additionally, RES generation incentives encourage collaborative load-sharing, directly reducing output from conventional thermal units. This minimizes system-wide carbon emissions by 1944.15 tons (30%) compared to standalone operation, turning carbon trading losses into profits and generating an additional USD 50,341.95 in revenue.
6. Conclusions
To promote the green and low-carbon transformation of the IES and increase the share of non-fossil energy in power generation, this paper establishes an IES dispatch model under a joint green certificate-carbon emission trading mechanism. Based on cooperative game theory, it adopts a three-pronged approach involving coordinated efforts from the energy supply side, energy conversion end, and market side. Through case analysis, the following conclusions are drawn:
(1) The green certificate and carbon dual-market interaction mechanism can significantly enhance the environmental value gains of IES. Under the dual effects of carbon quota constraints and green certificate economic incentives, the output of traditional thermal power units within the system is effectively curtailed, thereby increasing the level of renewable energy consumption.
(2) Under the joint green certificate and carbon emission trading mechanism, establishing a cooperative alliance is reasonably feasible. Compared to independent operation models, the proposed model leverages the multi-energy complementary characteristics of CCS facilities and P2G equipment, significantly enhancing the system’s adaptive regulation capacity to fluctuating loads and effectively achieving peak shaving and valley filling.
(3) Under the cooperative operation model, the cooperative surplus is fairly distributed based on the Shapley value method, maximizing both the alliance’s overall and individual benefits; overall operational revenue increased by 22.6%. Leveraging the efficient coordination between CCS and P2G equipment, the system achieved the most significant carbon reduction effect, with a total reduction of 30%.
Future research could focus on integrating dynamic transaction pricing mechanisms into the proposed framework. By formulating time-varying functions for green certificate and carbon allowance prices, the model can be extended to a multi-time-scale optimization structure, thereby improving its adaptability to evolving market conditions. Furthermore, establishing rigorous quantitative evidence to inform and guide policy formulation represents a promising direction for future investigation.
Author Contributions
Conceptualization, Y.Z.; formal analysis, S.D.; investigation, Q.X.; resources, S.D. and Y.Z.; validation, S.D.; writing—original draft preparation, Y.Z.; writing—review and editing, Q.X., S.D., Y.Z., Y.M., J.Y. and Y.L.; supervision, Q.X. and Y.Z.; project administration, Y.Z.; funding acquisition, Y.Z. All authors have read and agreed to the published version of the manuscript.
Funding
This work was supported by the National Natural Science Foundation of China (No. 62473391), The Outstanding Youth Science Foundation Project in Henan Province (No. 252300421065), and the Key Research Project of Universities in Henan Province (No. 25A470007, 26A470020).
Data Availability Statement
The original contributions presented in this study are included in the article. Further inquiries can be directed to the corresponding author.
Acknowledgments
The authors have reviewed and edited the output and take full responsibility for the content of this publication.
Conflicts of Interest
The authors declare no conflicts of interest.
Appendix A. CCPP and GTPP Unit Operational Constraints
The CCPP operational constraints include the constraint that every power generation unit has its minimum technical output and maximum rated output. The first equation in (A1) is the equivalent power range achievable by the entire CCPP system (generator unit + carbon capture equipment) as a single entity. The second equation in (A1) indicates that due to thermal inertia and equipment safety considerations, the power change rate of the power plant cannot be too rapid. This constraint limits the variation range of the CCPP’s total capacity between two consecutive time periods.
where and denote the upper and lower limits of the equivalent output, and denote the upper and lower limits of the ramping power for CCPP, and and denote the upper and lower limits of the ramp-up capacity for carbon capture equipment, respectively.
The CHP unit’s operational constraints are as follows:
where and denote the upper and lower limits of the CHP unit’s electrical power output, respectively; and denote the upper and lower limits of the ramping power of the CHP unit’s electrical power output, respectively; and denote the upper and lower limits of the CHP unit’s thermal power output, respectively; and and denote the upper and lower limits of the CHP unit’s ramping power, respectively.
The P2G equipment operational constraints are as follows:
where and represent the minimum and maximum power consumption of the P2G device, respectively, and and denote the upper and lower limits of the P2G device’s ramp-up power, respectively.
Appendix B. Objective Functions for Each Unit
The operating cost of the CCPP is defined as follows:
where is the fuel cost for CCPP, is the fuel cost coefficient, is the carbon sequestration cost, and is the fixed price per unit of CO2 sequestered.
The cost of P2G equipment is defined as follows:
where is the fixed price for purchasing CO2 and is the operating cost coefficient of the P2G equipment.
The RES operational cost is defined as follows:
where and denote the unit maintenance costs for WT and PV, respectively.
The gas sales revenue is defined as follows:
where is the unit price of natural gas, USD/m3.
The electricity sales revenue is defined as follows:
where , and denote the electricity sales revenue from CCPP, RES, and GTPP, respectively, and is the unit electricity sales price.
References
- Li, X.; Yang, J.; Du, D.; Bu, S.; Wu, L.; Chung, C.Y.; Li, K. A review of optimal scheduling and distributed cooperative control for smart grids integrated with electric vehicles. J. Mod. Power Syst. Clean Energy 2025. Available online: https://ieeexplore.ieee.org/document/11168117 (accessed on 14 September 2025).
- Wu, C.; Wang, C.; Hou, Z.; Wang, Z. Flexible peak shaving in coal-fired power plants: A comprehensive review of current challenges, recent advances, and future perspectives. Energy 2025, 327, 136446. [Google Scholar] [CrossRef]
- Ye, J.; Shuai, Q.; Hua, Q. Dynamic programming-based low-carbon and economic scheduling of integrated energy system. Energy 2025, 322, 135568. [Google Scholar] [CrossRef]
- Wang, X.; Wang, S.; Luo, X.; Guan, X. Two-layer low-carbon optimization scheduling for hybrid ship power system considering the lifespan of energy storage system. Electr. Power Syst. Res. 2025, 249, 11206. [Google Scholar] [CrossRef]
- Du, D.; Zhu, M.; Li, X.; Fei, M.; Bu, S.; Wu, L.; Li, K. A review on cybersecurity analysis, attack detection, and attack defense methods in cyber-physical power systems. J. Mod. Power Syst. Clean Energy 2023, 11, 727–743. [Google Scholar] [CrossRef]
- Wang, X.; Zhu, H.; Luo, X.; Chang, S.; Guan, X. A novel optimal dispatch strategy for hybrid energy ship power system based on the improved NSGA-II algorithm. Electr. Power Syst. Res. 2024, 242, 110385. [Google Scholar] [CrossRef]
- Zhao, J.; Srivastava, A.; Guo, Y.; Ćetenović, D.; Lin, Y.; Levi, V.; Yin, G.; Huang, M.; Zhang, T.; Li, Z.; et al. State Estimation for Integrated Energy Systems: Motivations, Advances, and Future Work. IEEE Trans. Power Syst. 2024, 40, 3057–3073. [Google Scholar] [CrossRef]
- Zhang, L.; Liu, T.; Xu, C.; Zhang, J.; Gao, Y.; Li, X.C.; Wang, H.; Li, X.; Mir, M. A risk-averse cooperative framework for neighboring energy hubs under joint carbon, heat and electricity trading market with P2G and renewables. Renew. Energy 2025, 250, 123241. [Google Scholar] [CrossRef]
- Liu, F.; Duan, J.; Wu, C.; Tian, Q. Risk-averse distributed optimization for integrated electricity-gas systems considering uncertainties of Wind-PV and power-to-gas. Renew. Energy 2024, 227, 120358. [Google Scholar] [CrossRef]
- Cui, Y.; Xu, Y.; Huang, T.; Wang, Y.; Cheng, D.; Zhao, Y. Low-carbon economic dispatch of integrated energy systems that incorporate CCPP-P2G and PDR considering dynamic carbon trading price. J. Clean. Prod. 2023, 423, 138812. [Google Scholar] [CrossRef]
- Wu, Z.; Yang, C.; Zheng, R. An analytical model for enterprise energy behaviors considering carbon trading based on evolutionary game. J. Clean. Prod. 2024, 434, 139840. [Google Scholar] [CrossRef]
- Wu, J.; Zhao, Y.; Fan, S.; Zhao, Z.; Zuo, S.; Wang, J. Study on the diffusion of China Certified Emission Reduction scheme under carbon trading mechanism: Based on the tripartite evolutionary game model. Energy 2025, 322, 135643. [Google Scholar] [CrossRef]
- Kanta, M.; Dimitriadis, C.N.; Tsimopoulos, E.G.; Georgiadis, M.C. Optimal investment and bidding strategies for wind power in electricity and green certificates markets. Comput. Chem. Eng. 2025, 199, 109139. [Google Scholar] [CrossRef]
- Liu, Y.; Wang, Y.; Yang, Y.; Zhang, K.; Sun, Y.; Hou, C.; Dongye, Z.; Chen, J. GCT–CET Integrated Flexible Load Control Method for IES. Energies 2025, 18, 3667. [Google Scholar] [CrossRef]
- Guo, X.; Wang, L.; Ren, D. Optimal Scheduling Model for Virtual Power Plant Combining Carbon Trading and Green Certificate Trading. Energy 2025, 318, 134750. [Google Scholar] [CrossRef]
- Chang, X.; Wu, Z.; Wang, J.; Zhang, X.; Zhou, M.; Yu, T.; Wang, Y. The coupling effect of carbon emission trading and tradable green certificates under electricity marketization in China. Renew. Sustain. Energy Rev. 2025, 187, 113750. [Google Scholar] [CrossRef]
- Li, J.; Hu, Y.; Chi, Y.; Liu, D.; Yang, S.; Gao, Z.; Chen, Y. Analysis on the synergy between markets of electricity, carbon, and tradable green certificates in China. Energy 2024, 302, 131808. [Google Scholar] [CrossRef]
- Liu, D.; Luo, Z.; Qin, J.; Wang, H.; Wang, G.; Li, Z.; Zhao, W.; Shen, X. Low-carbon dispatch of multi-district integrated energy systems considering carbon emission trading and green certificate trading. Renew. Energy 2023, 218, 119312. [Google Scholar] [CrossRef]
- Xu, X.; Xia, J.; Hong, C.; Sun, P.; Xi, P.; Li, J. Optimization of Cooperative Operation of Multiple Microgrids Considering Green Certificates and Carbon Trading. Energies 2025, 18, 4083. [Google Scholar] [CrossRef]
- Li, X.; Deng, J.; Liu, J. Energy–carbon–green certificates management strategy for integrated energy system using carbon–green certificates double-direction interaction. Renew. Energy 2025, 238, 121937. [Google Scholar] [CrossRef]
- Zhu, L.; Wu, X.; Wang, Z.; Li, Y.; Song, L.; Yang, Y. A Study on the Environmental and Economic Benefits of Flexible Resources in Green Power Trading Markets Based on Cooperative Game Theory: A Case Study of China. Energies 2025, 18, 4490. [Google Scholar] [CrossRef]
- Liu, C.; Wang, C.; Yao, W.; Liu, C. Distributed Low-carbon Economic Dispatching for Multiple Park-level Integrated Energy Systems Based on Improved Shapley Value. IEEE Trans. Ind. Appl. 2024, 60, 6. [Google Scholar]
- Bian, Y.; Xie, L.; Ma, L.; Zhang, H. A novel two-stage energy sharing method for data center cluster considering ‘Carbon-Green Certificate’coupling mechanism. Energy 2024, 313, 133991. [Google Scholar]
- Zhang, Y.; Wu, Q.; Ren, H.; Li, Q.; Zhou, W. Optimal operation of multi-microgrid systems considering multi-level energy-certificate-carbon coupling trading. Renew. Energy 2024, 227, 120505. [Google Scholar] [CrossRef]
- Li, R.; Zhou, J.; Qiu, Z.; Li, H.; Li, J.; Wu, J.; Wu, K. Bi-level optimization of hybrid energy conversion system based on a multi-distinct low-carbon microgrid. Renew. Energy 2025, 239, 122095. [Google Scholar]
- Zhao, F.; Du, L.; Chu, S. Optimized Operation Strategy for Multi-Regional Integrated Energy Systems Based on a Bilevel Stackelberg Game Framework. Energies 2025, 18, 4746. [Google Scholar] [CrossRef]
Disclaimer/Publisher’s Note: The statements, opinions and data contained in all publications are solely those of the individual author(s) and contributor(s) and not of MDPI and/or the editor(s). MDPI and/or the editor(s) disclaim responsibility for any injury to people or property resulting from any ideas, methods, instructions or products referred to in the content. |
© 2025 by the authors. Licensee MDPI, Basel, Switzerland. This article is an open access article distributed under the terms and conditions of the Creative Commons Attribution (CC BY) license (https://creativecommons.org/licenses/by/4.0/).