Article

A Matrix-Based Analytical Approach for Reliability Assessment of Mesh Distribution Networks

by
Shuitian Li
1,
Lixiang Lin
1,
Ya Chen
1,
Chang Xu
1,
Chenxi Zhang
1,
Yuanliang Zhang
1,
Fengzhang Luo
2,* and
Jiacheng Fo
2,*
1
Guangzhou Power Supply Bureau of Guangdong Power Grid Co., Ltd., Guangzhou 510600, China
2
Key Laboratory of Smart Grid of Ministry of Education, Tianjin University, Tianjin 300072, China
*
Authors to whom correspondence should be addressed.
Energies 2025, 18(20), 5508; https://doi.org/10.3390/en18205508 (registering DOI)
Submission received: 23 August 2025 / Revised: 8 September 2025 / Accepted: 15 October 2025 / Published: 18 October 2025

Abstract

To address the limitations of conventional reliability assessment methods in handling mesh distribution networks with flexible operation characteristics and complex topologies, namely their poor adaptability and low computational efficiency, this paper proposes a matrix-based analytical approach for reliability assessment of mesh distribution networks. First, a network configuration centered on the soft open points (SOP) is established. Through multi-feeder interconnection and flexible power flow control, a topology capable of fast fault transfer and service restoration is formed. Second, based on the restoration modes of load nodes under fault scenarios, three types of fault incidence matrices (FIM) are proposed. By means of matrix algebra, explicit analytical expressions are derived for the relationships among equipment failure probability, duration, impact range, and reliability indices. This overcomes the drawbacks of iterative search in conventional reliability assessments, significantly improving efficiency while ensuring accuracy. Finally, a modified 44 bus Taiwan test system is used for reliability assessment to verify the effectiveness of the proposed method. The results demonstrate that the proposed matrix-based analytical reliability assessment method enables explicit analytical calculation of both system-level and load-level reliability indices in mesh distribution networks, providing effective support for planning and operational optimization to enhance reliability.

1. Introduction

With the integration of flexible control devices such as distributed generation (DG) and soft open points (SOP), distribution networks are rapidly evolving from traditional radial structures into mesh active distribution networks (ADN) with multi-feeder interconnection and flexible power flow control [1]. This emerging network architecture significantly enhances the capability of distribution systems for fast fault transfer and service restoration under fault scenarios, thereby improving supply reliability [2]. However, conventional reliability assessment methods show poor adaptability, low computational efficiency, and limited modeling capability when dealing with mesh ADN characterized by complex structures, diverse operating conditions, and flexible control modes. Therefore, it is imperative to develop efficient reliability assessment approaches tailored for mesh distribution networks.
At present, extensive studies on the reliability assessment of distribution networks have been conducted both domestically and internationally, with the applied methods mainly classified into simulation-based and analytical approaches. Among them, simulation-based methods, represented by Monte Carlo simulation (MCS), simulate equipment states and system operating conditions, record fault events, analyze their impact on system and customer outages, and finally accumulate the results to calculate system reliability indices [3,4,5]. For example, refs. [6,7] adopt MCS to compute reliability indices of load nodes and then aggregate them to obtain system reliability indices. In [8], MCS is used to analyze the impact of energy storage system (ESS) capacity allocation on reliability indices. In [9], sequential Monte Carlo (SMC) simulation is employed, based on network characteristics and component reliability models, to assess the reliability of islanded microgrids. However, although the principle of simulation-based methods is straightforward, there is a trade off between accuracy and computational time: higher accuracy requires longer computation. Moreover, simulation-based methods cannot explicitly relate component failure parameters to reliability indices through analytical expressions. Since the analysis of each fault is independent, it is difficult to derive explicit formulas for reliability indices.
At present, analytical methods for reliability assessment are relatively mature and are mostly based on Failure Modes and Effects Analysis (FMEA). These methods enumerate all possible component failure events, evaluate their impact on loads, construct a system-level failure mode set, and ultimately calculate reliability indices for individual load nodes and the overall system [10]. However, as the scale of distribution networks increases, performing failure consequence analysis for each component becomes increasingly cumbersome. To address this issue, many researchers have proposed more efficient reliability assessment approaches. For example, refs. [11,12] introduced network equivalence methods, which simplify the reliability analysis of main feeders by representing branched feeders as equivalent series elements. This enables analytical expressions that relate component reliability parameters along a supply path to node-level indices. Ref. [13] adopts a fault-originated network search approach to determine the fault impact range and calculate reliability indices. However, as it is based on network search rather than algebraic modeling, it does not provide closed-form analytical expressions. Ref. [14] applies the minimal cut set method to calculate reliability indices in meshed distribution networks with DG. Refs. [15,16,17] use the minimal path method to evaluate the reliability of ADN by identifying supply paths between loads and DG. However, determining the impact of faults on non-minimal-path components remains challenging, and these approaches generally only support analytical index calculation for a single load node. Ref. [18] proposes a fast network search-based method to identify the minimal path of load nodes, improving the computational efficiency of reliability assessment. Nevertheless, as the system scale increases, both the identification of minimal paths and the equivalent treatment of faults on non-minimal-path components become less efficient. Moreover, this method is limited to analytical reliability evaluation of a single feeder in passive radial distribution networks.
In summary, both mainstream simulation-based and analytical methods still face two critical limitations when assessing mesh ADN with flexible power flow control capabilities: (1) network modeling largely remains at the level of radial or simple ring structures, which makes it difficult to accurately represent multi-feeder interconnection and fault transfer paths dominated by SOP; and (2) the algebraic mapping between reliability indices and reliability parameters such as equipment failure rates and repair times has not been effectively established. As a result, the calculation of reliability indices still relies on extensive scenario enumeration and state traversal, making it difficult to balance efficiency and accuracy.
To overcome these limitations, this paper proposes a matrix-based analytical method for reliability assessment of mesh distribution networks. The main contributions are as follows:
(1)
A network configuration and operation control strategy centered on SOP is established. This configuration enables flexible power flow control among multiple feeders and rapid fault transfer, providing a structural foundation for reliability modeling and analysis of mesh ADN.
(2)
A fault incidence matrix (FIM)-based analytical calculation method is proposed, utilizing spatial topology. By classifying the restoration states of load nodes under different branch fault scenarios, three types of FIMs are constructed. Through algebraic computation between the FIMs and reliability parameters, explicit analytical expressions of reliability indices are derived for mesh distribution networks. This approach eliminates the redundant fault impact range traversal required by existing reliability assessment algorithms and significantly improves computational efficiency.
The remainder of this paper is organized as follows. Section 2 introduces the core features and structural advantages of mesh distribution networks. Section 3 establishes typical component models of mesh distribution networks. Section 4 presents the proposed FIM-based analytical method for reliability index calculation. In Section 5, the effectiveness of the proposed method is validated using a modified 44 bus Taiwan mesh distribution system. Finally, Section 6 concludes the paper.

2. Characteristics and Structural Advantages of Mesh Distribution Networks

2.1. Network Configuration of Mesh Distribution Networks

The future distribution system will integrate elements such as DG and demand response, resulting in increasingly complex and variable operational scheduling. Consequently, more flexible and interconnected network structures will be required. Building on the concept of honeycomb distribution networks and further extending it, a mesh distribution network is proposed, which is based on mesh topology and enables flexible closed-loop operation of the entire system. As shown in Figure 1, the mesh distribution network employs the SOP as the core networking device, and its topology exhibits a mesh structure. Four feeders (F1–F4) can be flexibly regulated through the SOP, effectively overcoming the limitations of insufficient regulation range in closed-loop feeder connections and the inability of ring interconnections to achieve system wide sequential power flow control. The mesh topology provides multidirectional and continuous regulation of branch power flows, thereby offering enhanced power flow controllability.

2.2. Control and Protection Strategies of Mesh Distribution Networks

Under normal operating conditions, the mesh distribution network adopts a flexible closed-loop operating mode. The SOP controls power transfer within the distribution network by operating each port under either active reactive power (PQ) control mode or DC voltage reactive power (VdcQ) control mode, thereby enabling power exchange among interconnected feeders. In the event of a fault, the highly flexible and controllable SOP, in coordination with protection devices, ensure effective fault isolation. This coordination is critical for rapid fault isolation and service restoration in distribution networks.
When an asymmetric fault occurs on a feeder, the input current of the SOP becomes unbalanced. The SOP is immediately blocked to suppress the asymmetric current and achieve electrical isolation among interconnected feeders, preventing the expansion of outage areas. Subsequently, the protection devices in the mesh distribution network extract the negative sequence component of the current injected by the SOP after fault blocking. By constructing appropriate positive–negative sequence combined fault criteria and leveraging information exchange among devices, the system achieves accurate fault detection and isolation.
The switching of SOP control modes must be coordinated with the operating sequence of protection devices. After protection operation, the fault is isolated, the SOP is unblocked, and the faulted area switches to the voltage frequency (V/f) control mode. In this mode, the SOP provides voltage and frequency support for the outage area, ensuring uninterrupted supply in the healthy areas while restoring voltage support to the fault affected area.

2.3. Core Features of Mesh Distribution Networks

2.3.1. Support for Dynamic Power Flow Regulation Among Multiple Feeders

As a future-oriented energy interaction platform, distribution networks must support real-time bidirectional energy exchange among feeders. However, in traditional distribution networks, feeders typically rely on the upper-level grid or a limited number of tie lines, resulting in a single energy transmission path and restricting energy sharing across the entire network. In contrast, mesh topologies provide more diverse energy transmission path options, so power flow regulation is no longer constrained by feeder geographical layout. This enhances controllability at the system level and facilitates large-scale flexible energy interaction among feeders.

2.3.2. Adaptive Local Energy Balancing with Source-Load-Storage Coordination

With the growing penetration of DG, the structural flexibility of conventional distribution networks is insufficient to meet the operational requirements of high DG integration. Leveraging its structural advantages, a mesh distribution network enables dynamic self-balancing among DG units, energy storage systems, and loads within each mesh. Furthermore, resources inside the mesh can interact with microgrids, forming a cooperative and mutually supportive regional operation mechanism. In the case of power imbalances or local faults, the system can flexibly select support paths, with the upper-level grid providing compensation to restore local balance.

2.3.3. High Scalability for Flexible Planning and Iterative Upgrading

Traditional distribution networks face high technical and economic barriers during capacity expansion or structural modification, often requiring complete redesign. By contrast, the mesh structure, built on a modular basis, enables feeders to be interconnected via SOP, thereby supporting more flexible planning, construction, and upgrading of distribution networks. In practice, the size and number of meshes can be flexibly adjusted according to regional development needs, equivalent to an orderly expansion of basic units. This simplifies engineering complexity and enhances system adaptability to varying load demands and resource allocations.

3. Typical Component Modeling of Mesh Distribution Networks

3.1. Soft Open Point Model

As an emerging type of intelligent distribution equipment, the SOP possesses powerful power regulation capabilities. Its deployment enhances the real-time controllability of the distribution network, eliminates safety risks associated with mechanical switching operations, and significantly improves the system’s flexibility and controllability [15].
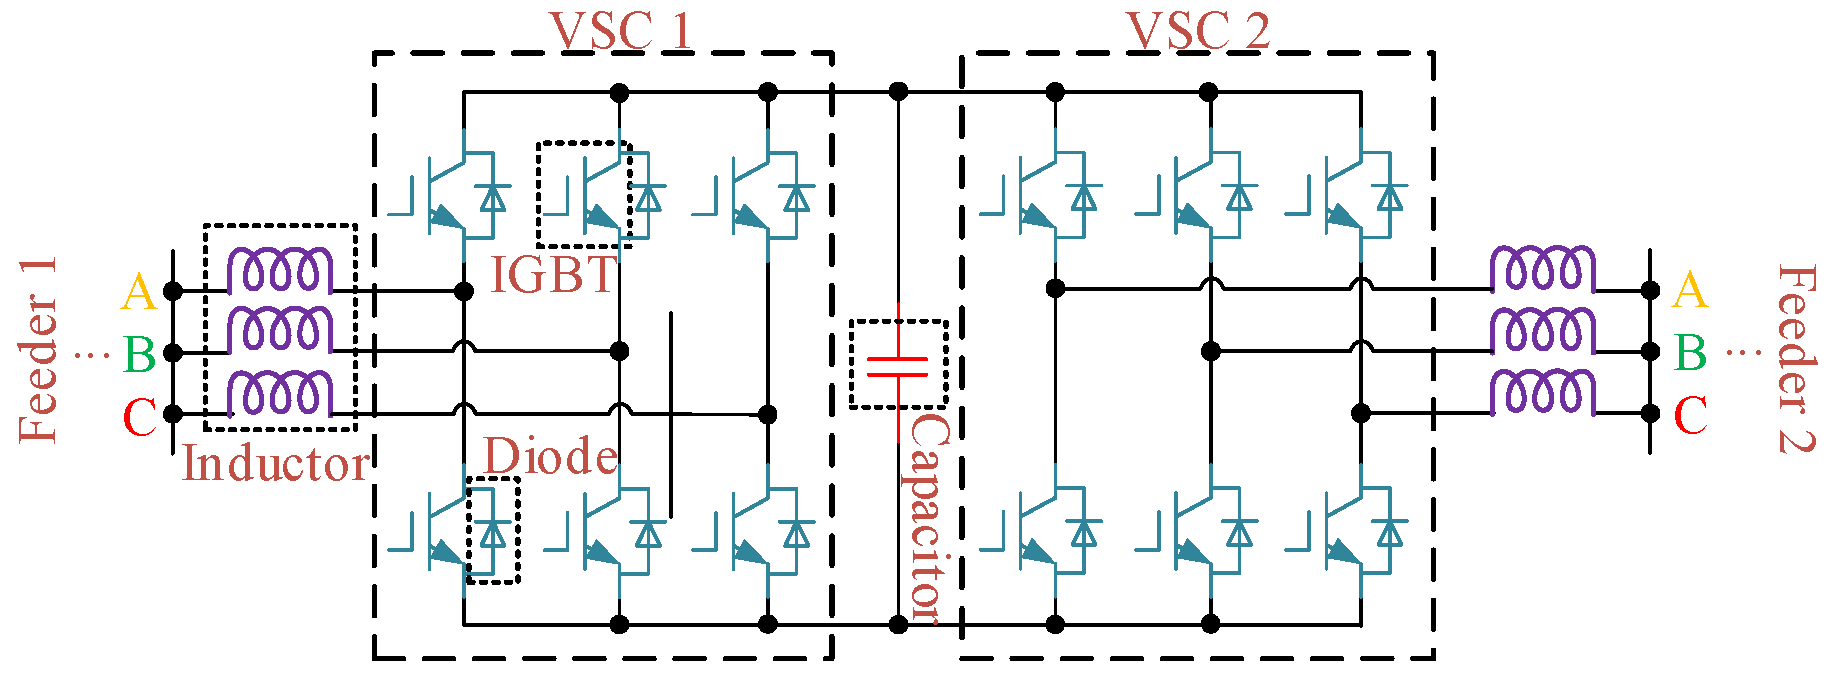
The SOP primarily relies on fully controllable power electronic devices to achieve its functionality. This section illustrates the SOP using a back-to-back voltage source converter (VSC) configuration as an example. As shown in Figure 2, the back-to-back voltage source converter SOP consists of two converters connected via a DC capacitor. Owing to the presence of a DC isolation stage, the SOP functions as an electrically open node within the distribution network.
Assuming the two terminals of the SOP are connected to nodes i and j in the distribution network, the corresponding operational constraints are defined as follows:
P i , t SOP + P j , t SOP = 0
P i , t SOP 2 + Q i , t SOP 2 S i j SOP P j , t SOP 2 + Q j , t SOP 2 S i j SOP
where P i , t SOP and Q i , t SOP denote the active and reactive power of the SOP port connected to node i at time t, respectively. S i j SOP represents the capacity of the SOP.
Since the SOP is composed of fully controllable power electronic devices, its response time is extremely short, which distinguishes it significantly from traditional distribution systems that rely on sectioning and tie switches for “closed-loop design but open-loop operation”. The fault restoration process in SOP-integrated distribution systems differs notably from conventional methods and proceeds as follows:
When a fault occurs in the distribution system, the SOP—due to its extremely fast response—reacts before traditional protection devices. It transitions from normal operation to a locked state, and the VSC on the faulted side is shut down, thereby interrupting the short-circuit current path. The relay protection devices in the distribution system operate to locate and isolate the fault, resulting in partial load outages. The VSC on the faulted side of the SOP switches to voltage control mode to provide voltage support for the disconnected AC loads, thereby enabling service restoration. Meanwhile, the VSC on the other side switches to DC voltage control mode to maintain DC bus voltage stability.

3.2. Wind Turbine Output Model

Nonparametric kernel density estimation is a statistical method used to estimate an unknown probability density function without assuming any prior distribution of the original data. Since wind speed is influenced by multiple variable factors such as geography, time, and climate, it is more appropriate to describe its probability distribution using kernel density estimation. Therefore, in this paper, nonparametric kernel density estimation is employed to characterize the stochastic uncertainty of wind speed v:
f ^ h ( ν ) = 1 n i = 1 n K h ( ν ν i ) = 1 n h i = 1 n K ν ν i h
where K(⋅) denotes the kernel function, h > 0 is the smoothing parameter, and vi (i = 1, 2, …, n) are n independent and identically distributed samples from distribution F.
The output power model of a wind turbine (WT) is analyzed as follows. A WT first converts wind energy into mechanical energy via blade rotation, which drives the generator to produce electricity. Over long-term operation, if transient characteristics are neglected, the active power output of a WT is strongly correlated with wind speed. The actual active power output depends on the cut-in speed, cut-out speed, and rated speed, and can be expressed as:
P W T ( t ) = 0 , v ( t ) < v c i or v ( t ) > v c o P r v ( t ) v c i v r v c i , v c i v ( t ) < v r P r , v r v ( t ) v c o
where PWT(t) is the actual active power output of the WT, Pr(t) is the rated active power, v(t) is the wind speed at time t, vr is the rated wind speed, vci is the cut-in wind speed, and vco is the cut-out wind speed.

3.3. Photovoltaic Output Model

The Beta distribution is a probability distribution of a single random variable, and its probability density function is adopted to describe the stochastic uncertainty of solar irradiance. The Beta probability density function can be expressed as:
f ( h ) = Γ ( α + β ) Γ ( α ) Γ ( β ) h t h r α 1 1 h t h r β 1
where α and β are the shape parameters of the Beta distribution, ht is the actual solar irradiance, and hr is the rated solar irradiance.
The actual output power of a Photovoltaic (PV) cell depends on the solar irradiance and its rated output power under standard test conditions. The mathematical model can be expressed as:
P PV ( t ) = P r , pv h t h r , h t h r P r , pv , h t > h r
where Ppv denotes the actual output power of the PV cell, and Prated represents the rated active power of the PV cell under standard test conditions.

4. Analytical Calculation Method for Reliability Indices of Mesh Distribution Networks Based on FIMs

In the reliability assessment of distribution networks, reliability indices serve as the primary measures to directly reflect the reliability level of the network. The complexity of mesh distribution network structures, combined with the diversity of new distribution equipment, significantly increases the difficulty of calculating these indices. Based on the SOP-based load restoration approach for mesh distribution networks, this section proposes an analytical method for calculating reliability indices of mesh distribution networks, which includes the reliability indices of individual load nodes as well as those of the entire system.

4.1. Generation Method of Fault Incidence Matrix

Based on the load restoration approach of active distribution networks using SOP, considering that not all power outage nodes can be restored due to different fault locations, the restoration conditions of each node under different branch fault scenarios are determined using SOP-based restoration. The FIM has a number of rows equal to the number of branches in the system, with row indices corresponding to branch numbers; the number of columns corresponds to the number of nodes excluding the source node, with column indices representing node numbers. This matrix reflects the impact of each branch fault on each load node and provides a basis for analytical calculation of reliability indices.
For the outage area formed after a distribution network fault, SOPs are used to restore loads, and the restoration state of load nodes within the outage area is categorized into the following three types:
(1)
Load nodes that cannot be immediately restored by SOP and can only be restored after fault repair on the faulted branch. Their outage duration depends on the fault repair time.
(2)
Load nodes that are immediately restored by the main power source after fault isolation. Their outage duration depends on the time required for isolating the faulted line using switches.
(3)
Load nodes that are restored via SOP after fault isolation. Their outage duration depends on the time for fault isolation and the switching time of the SOP to the Vf mode for load restoration.
As the impact of faults on the outage scope and outage duration of load nodes varies, the fault incidence matrix consists of three matrices: A, B, and C, corresponding to the three load restoration states mentioned above. The specific generation method is as follows:
(1)
Fault incidence matrix A
A l k = 1 , k Ψ l , A 0 , k Ψ l , A
where Ψl,A represents the set of nodes that cannot be immediately restored via the SOP after a fault occurs on branch l.
(2)
Fault incidence matrix B
B l k = 1 , k Ψ l , B 0 , k Ψ l , B
where Ψl,B represents the set of nodes that are restored by the main power source after a fault occurs on branch l.
(3)
Fault incidence matrix C
C l k = 1 , k Ψ l , C 0 , k Ψ l , C
where Ψl,C represents the set of nodes that are restored via the SOP after a fault occurs on branch l.
Based on an analysis of the fundamental principles of distribution system reliability assessment, it can be concluded that the type of impact a component fault has on load nodes primarily depends on whether the fault occurs along the power supply path, the configuration of switches (including sectionalizing switches and circuit breakers), and whether effective SOP-based supply restoration is available downstream of the fault location.
(1)
When the faulty branch lies upstream of a node’s power supply path, the impact type depends on whether an alternative supply path is available after the fault. If there is no sectionalizing switch between the faulted branch and the affected node, and the node cannot be effectively isolated from the fault area, its power supply will be completely interrupted and can only be restored after the fault is repaired; this is categorized as a type-a impact. If a sectionalizing switch is installed between the faulted branch and the node, and an SOP is deployed downstream of the node’s branch, the SOP can quickly restore the power supply after fault isolation, and the node is classified as experiencing a type-c impact.
(2)
When the faulted branch is not on the original power supply path of the node, the impact type is determined by both the isolation conditions and the availability of supply paths. If there is no sectionalizing switch isolating the node from the faulted branch, the node loses its ability to recover power supply and is categorized as a type-a impact. If a sectionalizing switch exists to isolate the node from the faulted branch and the node has a direct path to be restored from the main power source, then the node can be quickly resupplied after isolation, corresponding to a type-b impact.
Based on the above analysis, this section constructs the A, B, and C matrices using a 7-node distribution system as an example. The results are shown in Figure 3.

4.2. Node Reliability Index Calculation Method

The node-level reliability indices include the average interruption frequency, average interruption duration, and expected energy not supplied. Based on the obtained fault incidence matrices, the reliability indices for each load node can be calculated.
(1)
Average interruption frequency
The average interruption frequency of each node represents the expected number of outages per year and is calculated as follows:
λ n = λ b × ( A + B + C )
where λn is the vector of annual outage frequencies for all nodes, λb is the vector of annual failure rates for each branch, and A, B, C are the fault incidence matrices.
(2)
Average interruption duration
The average interruption duration of each node represents the total outage time over a year and is calculated as follows:
T n = λ b t b × A + λ b t sw × B + λ b t sw + t op × C
where Tn is the vector of annual outage durations for all nodes, tb is the vector of branch repair times, tsw is the vector of switch operation times for fault isolation, top is the vector of SOP switching times for load restoration, and ∘ represents element-wise multiplication (Hadamard product).
(3)
Expected energy not supplied
The expected energy not supplied of each node represents the expected amount of unsupplied energy due to outages and reflects both outage duration and power demand. It is calculated as follows:
L n = T n ° P load
where Ln is the vector of expected energy not supplied for each node, Tn is the annual outage duration vector, Pload is the active power demand vector, and ∘ denotes the Hadamard product.

4.3. System Reliability Index Calculation Method

This paper takes system average interruption frequency index (SAIFI), system average interruption duration index (SAIDI), and expected energy not supplied (EENS) as examples. The analytical equations for system reliability indexes are given as follows:
SAIFI   = λ n × N T M
SAIDI   = μ n × N T M
EENS   = μ n × L T
where NT represents a column vector in which the number of users at each load node is arranged in ascending order by index, and M denotes the total number of users in the distribution network.

4.4. Reliability Analysis Method for Mesh Distribution Networks with Soft Open Points

The reliability analysis method for active distribution networks with SOP can be summarized in the following steps:
(1)
Input the parameters of the distribution network and DG, the access location and capacity of the SOP, the average number of faults per branch, operation time of components, and other initial values;
(2)
Solve the load restoration model of the active distribution network based on SOP to obtain the load restoration status of each load node under different branch fault scenarios, including: restored only after faulted branch repair, immediately restored by the main power source, and restored via SOP;
(3)
Based on the load restoration status of each load node, classify the outage nodes and generate the fault incidence matrix;
(4)
Based on the FIMs, calculate the reliability indices of each load node using the reliability index calculation method for active distribution networks, and further calculate the system-level reliability indices;
(5)
Based on the calculated reliability indices, evaluate the power supply reliability of the meshed distribution networks.

5. Case Study

5.1. Algorithm Correctness Verification and Comparison of Computational Efficiency

To validate the effectiveness of the proposed method, the IEEE RBTS bus 6 system is employed as a benchmark case, and its topology is illustrated in Figure 4. Both the sectionalizing switches and tie switches are assumed to have an operation time of 1.0 h. The component failure parameters are adopted from [10]. The reliability indices obtained for the IEEE RBTS bus 6 system using the proposed approach are compared with the corresponding results reported in [10], as presented in Table 1 and Table 2.
When compared with the results reported in [10], the reliability indices obtained by the proposed method show good consistency, aside from minor discrepancies caused by statistical accuracy.
In terms of computational efficiency, the performance of the proposed method is evaluated against that of the approach in [19], with the comparison results summarized in Table 3.
Although the method in [19] reduces redundant search operations, it still requires independent calculations for each feeder when assessing the fault impact of components. In contrast, the proposed method constructs a system-wide FIM and employs matrix algebra to evaluate, in a unified computation, the influence of all component failures on loads across the entire network. This not only guarantees accuracy but also achieves a significant reduction in computation time. Furthermore, the larger the network scale, the more evident the efficiency advantage of the proposed method becomes.

5.2. Reliability Evaluation

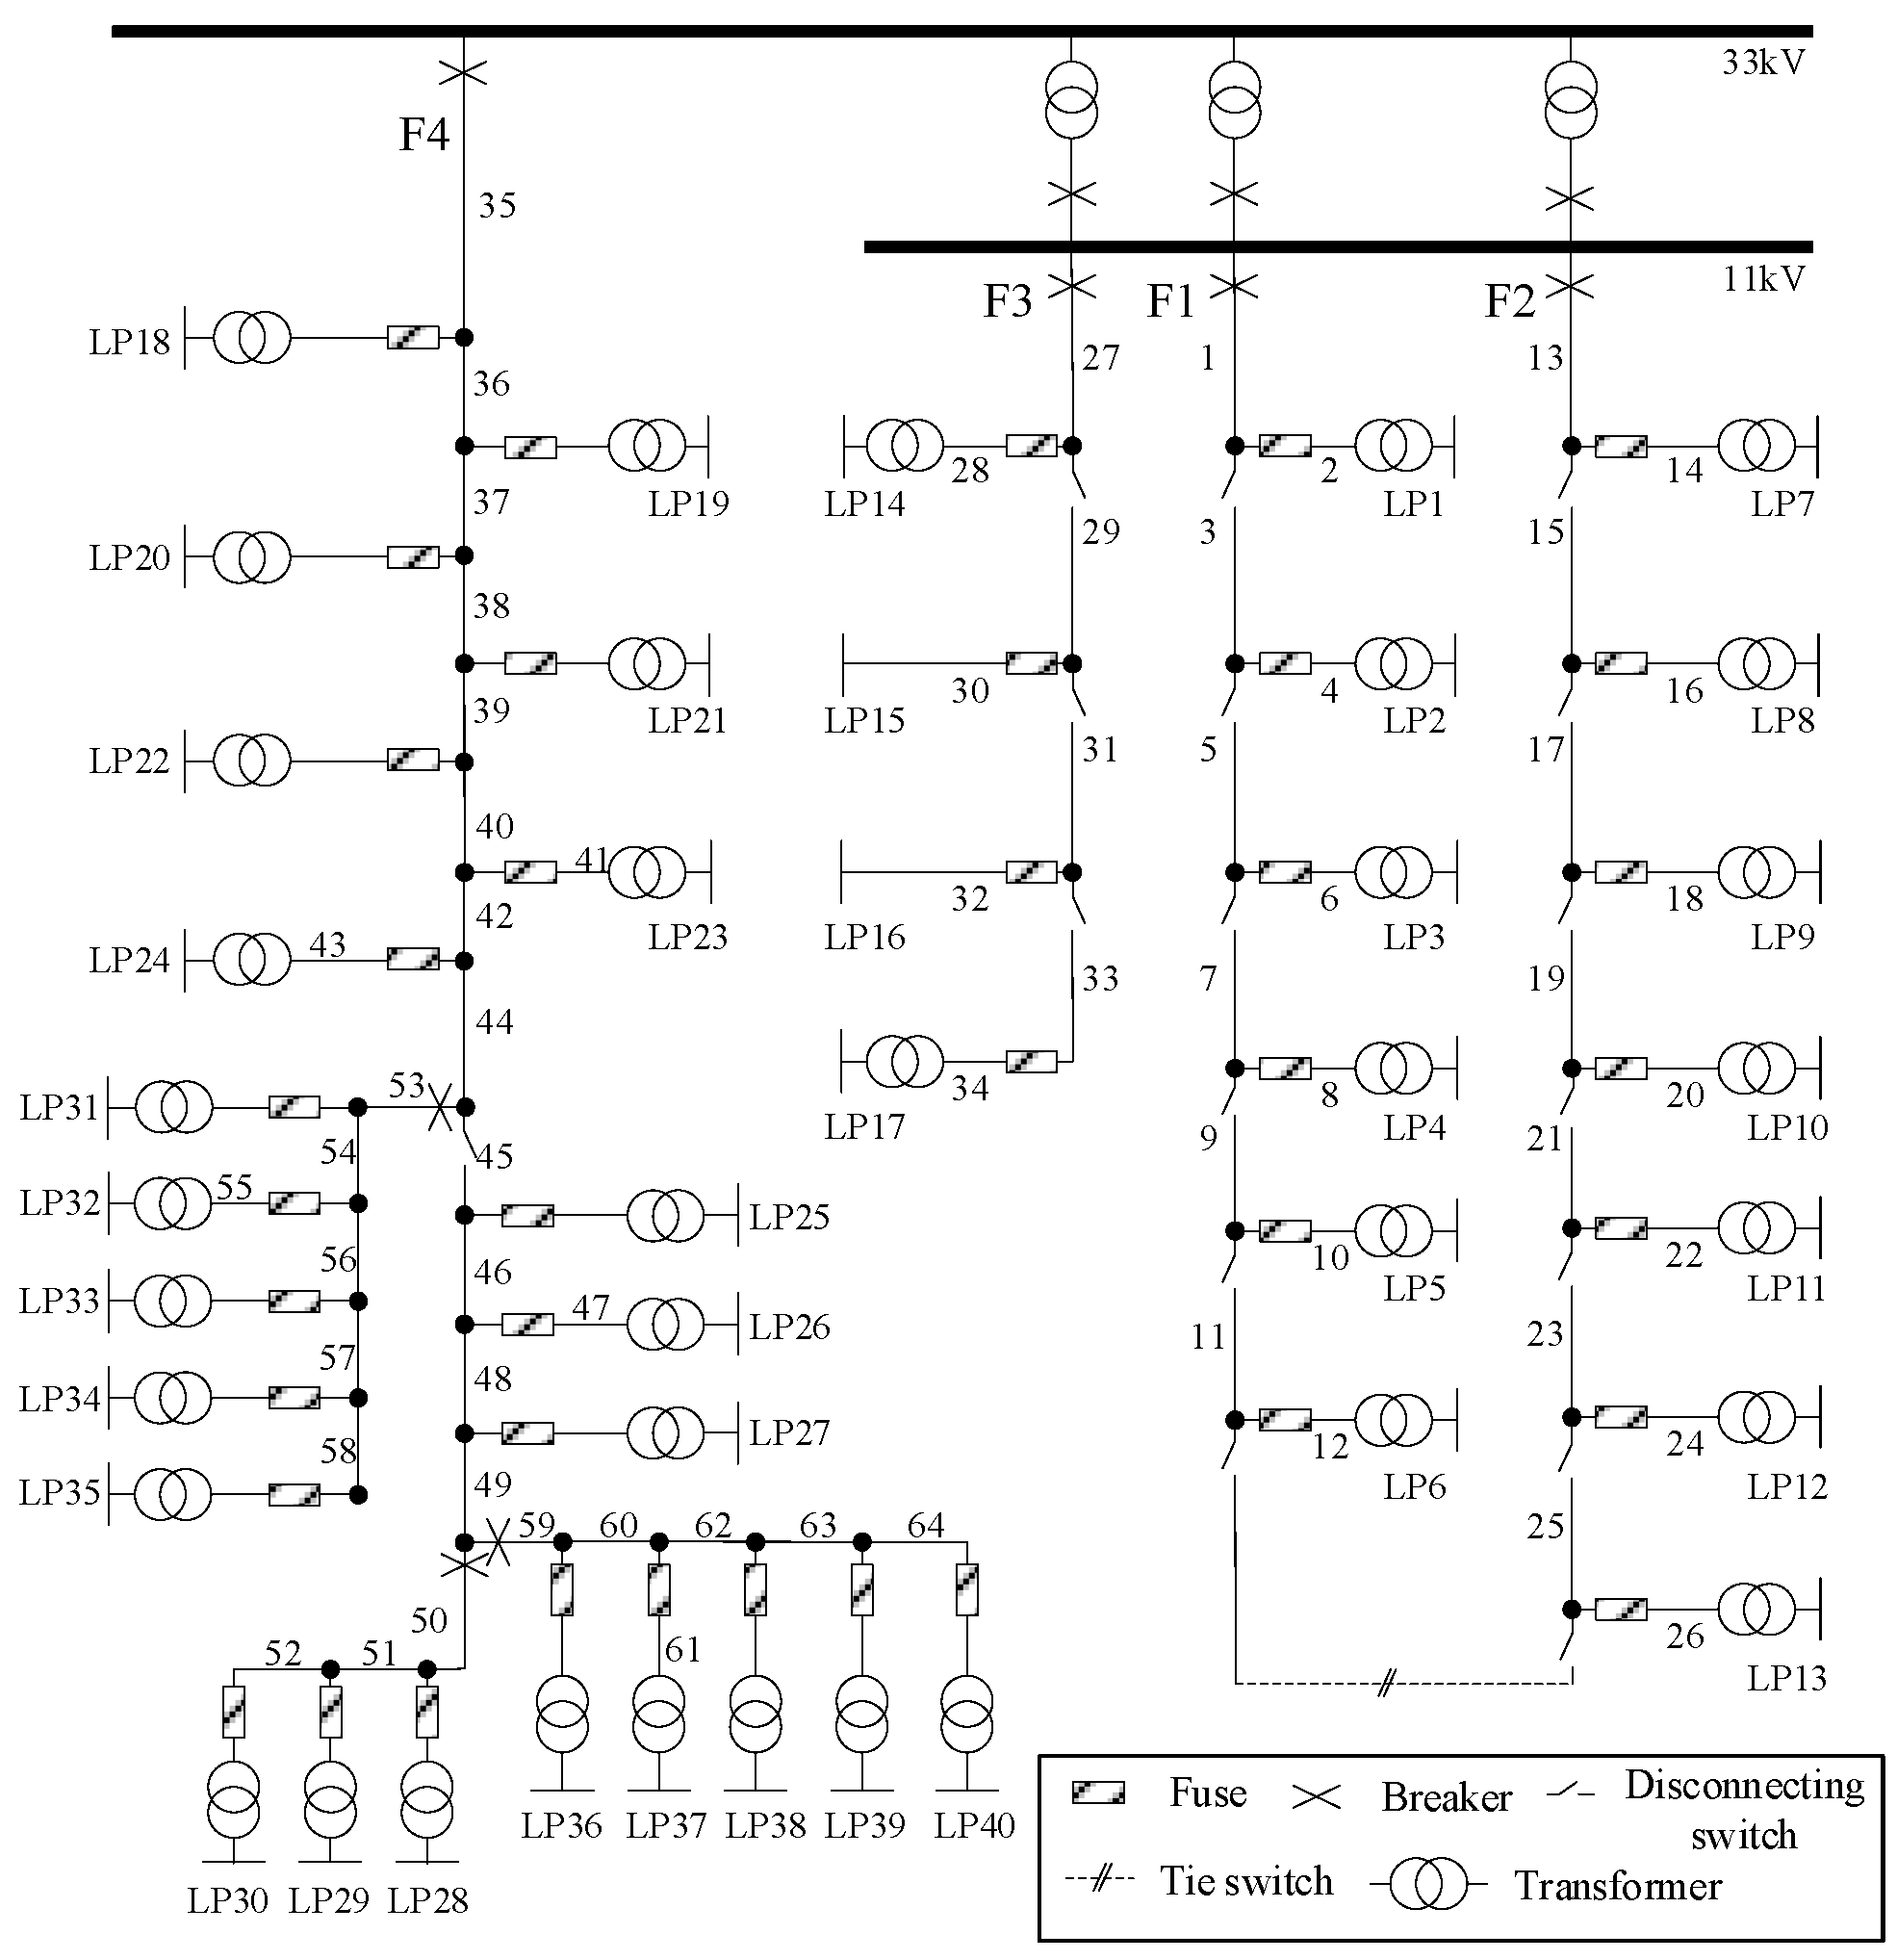
In this section, a reliability assessment is conducted using a modified 44 bus Taiwan test system. The structure of the modified 44 bus system is shown in Figure 5. Circuit breakers are installed at the substation busbar outlets, and sectionalizing switches are installed at both ends of each branch. The operation time of sectionalizing switches is set to 0.5 h, the operation time of tie switches is set to 0.5 h, and the operation time of SOP is set to 0.05 h. The branch failure rates and repair times, as well as the load demand and number of loads at each node, can be found in [20].
To quantitatively analyze the impact of tie switches, DG (WT, PV), and SOP on the reliability of distribution systems, three comparative cases are designed:
Case 1: No tie switches are installed; the entire network operates in a radial configuration without DG or SOP integration.
Case 2: Tie switches are installed between feeders, but no DG or SOP integration is considered.
Case 3: SOPs replace conventional tie switches, and both DG and SOP integration are considered.
The detailed differences in resource configurations for each scenario are provided in Table 4, where “ד denotes that the corresponding device is not considered and “√“ denotes that the device is considered.
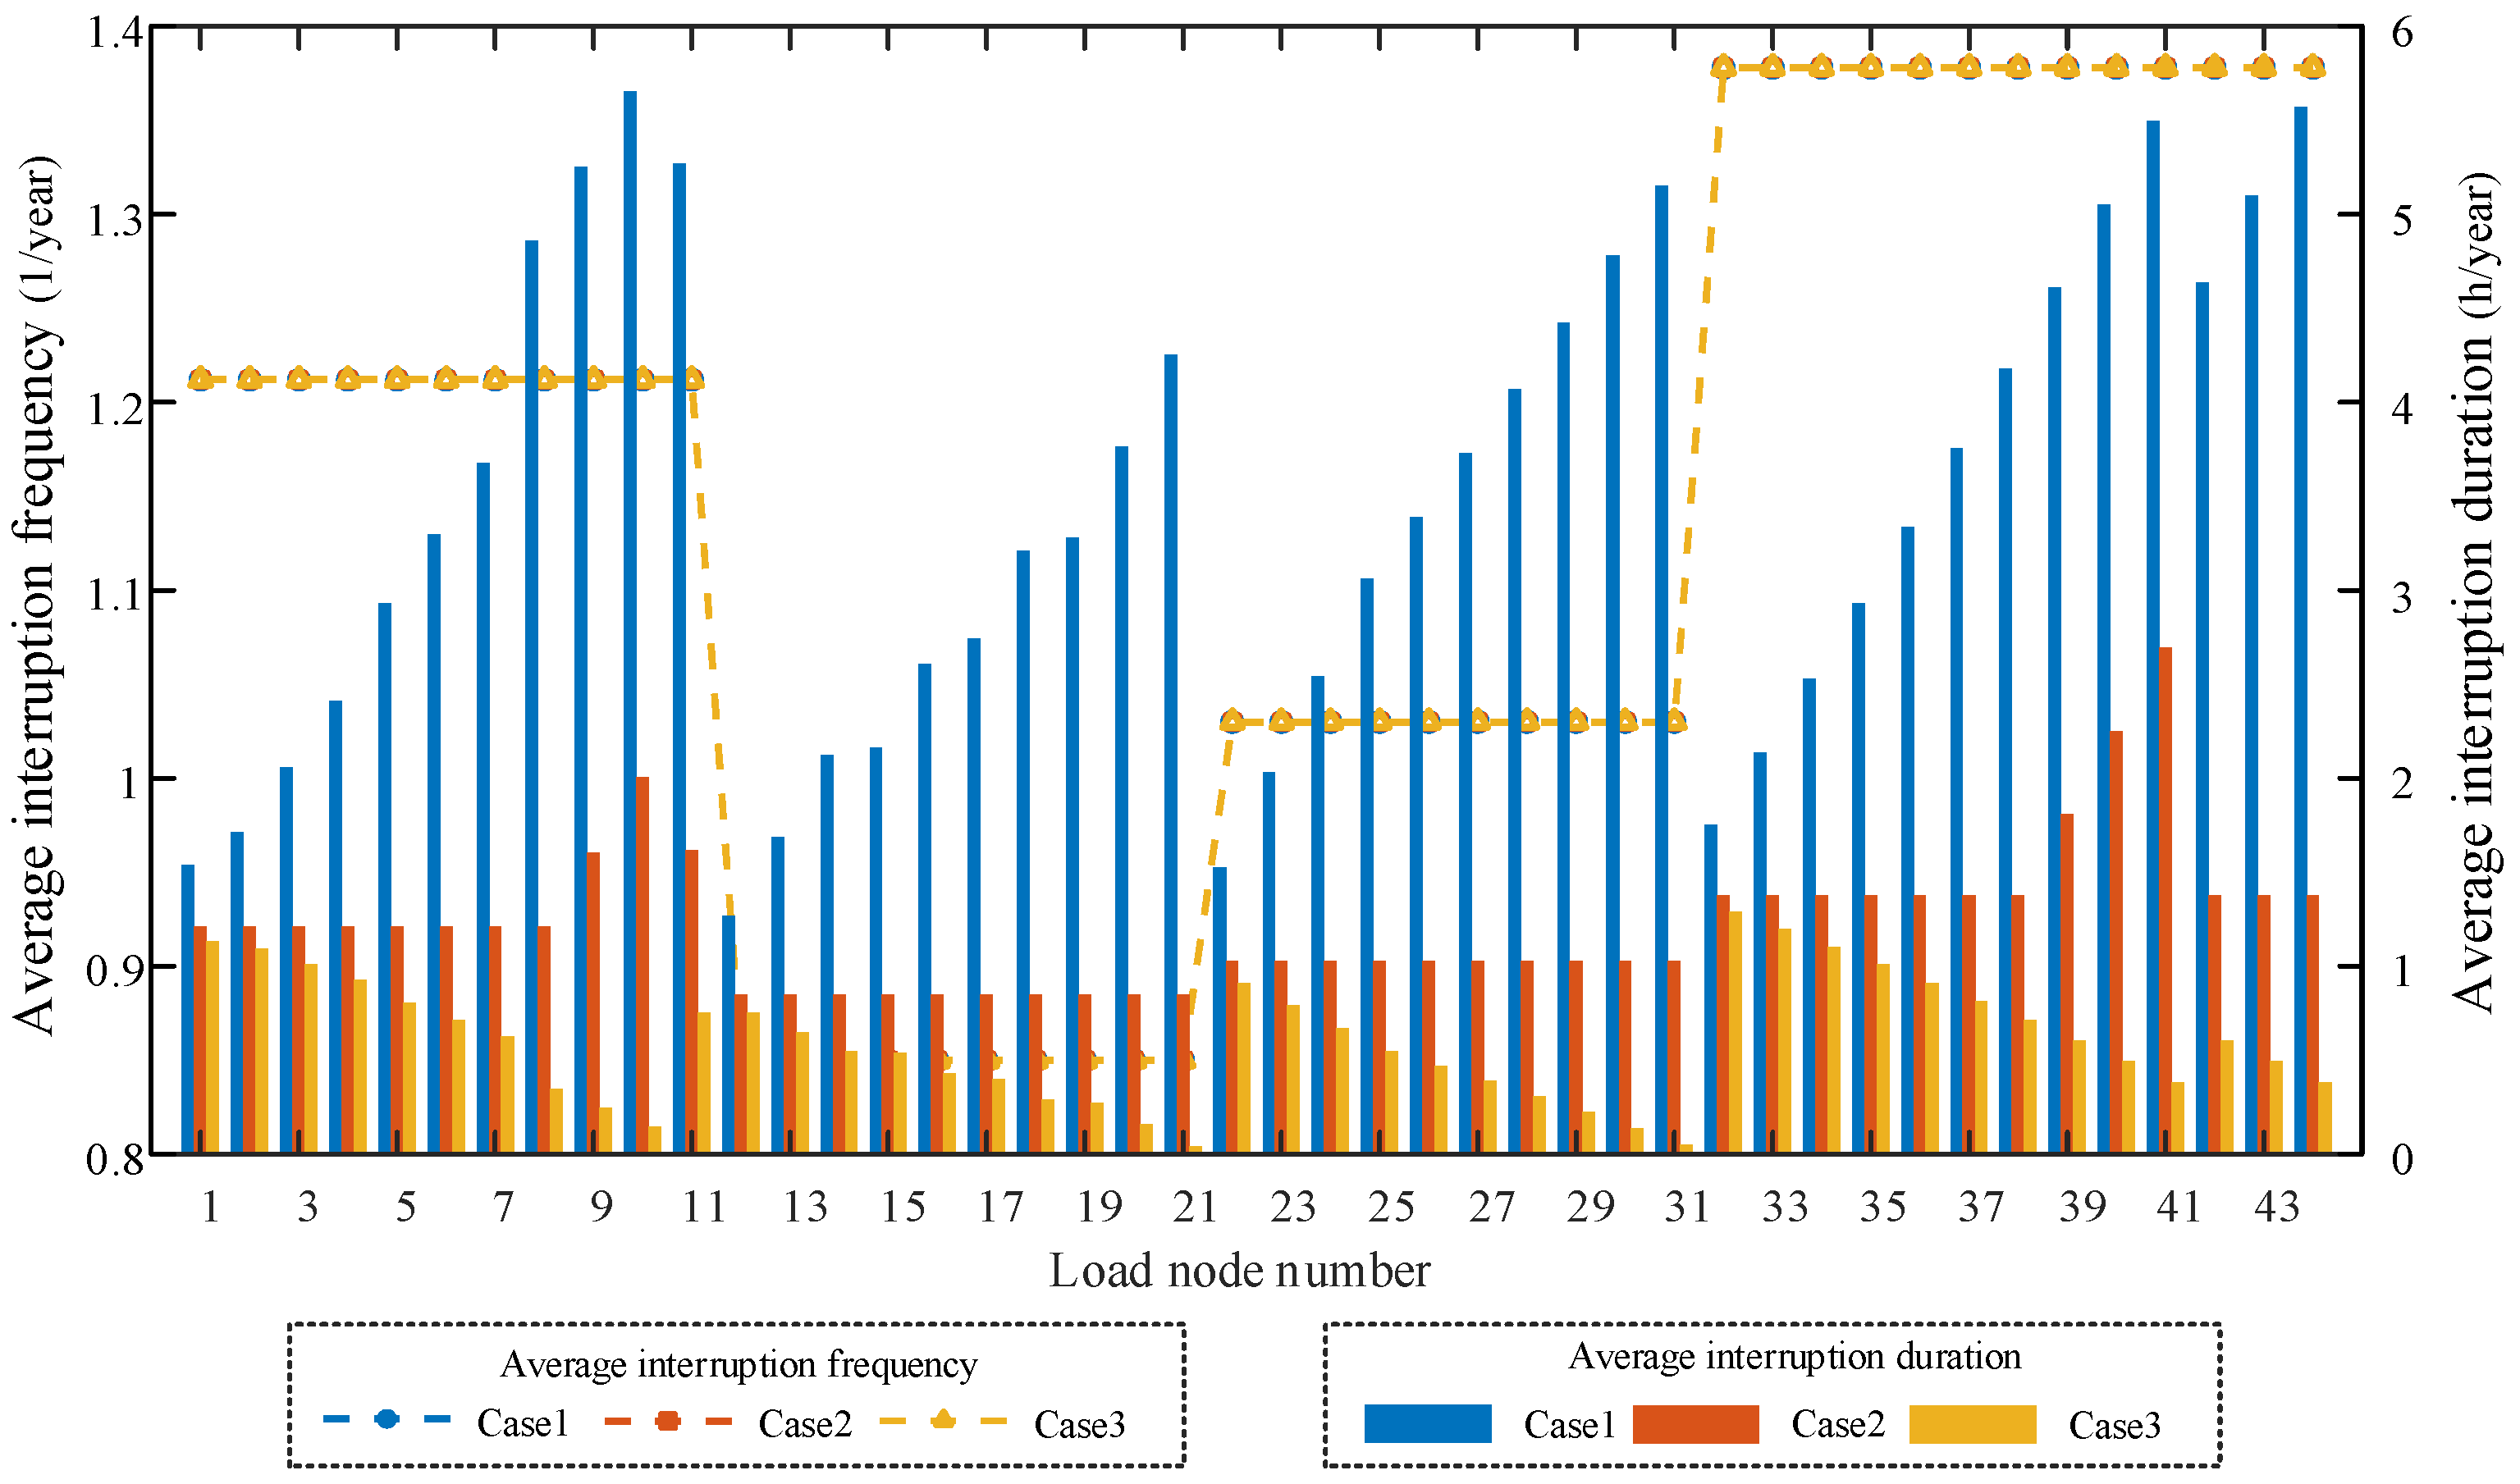
The system reliability indices under each case are presented in Table 5, while the average interruption frequency and average interruption duration of each load node are illustrated in Figure 6.
As shown in Figure 6, the outage frequency of load nodes within each feeder is identical across the three comparative cases. This is because, according to (10), the outage frequency of a load node is determined solely by the failure rate of its associated branch and the corresponding fault impact range. Whenever a fault occurs on a feeder branch, the circuit breaker at the feeder outlet trips immediately, causing all nodes within the feeder to experience an instantaneous outage. Therefore, with the configurations of circuit breakers and sectionalizing switches unchanged, the integration of tie switches, DG, or SOP does not affect outage frequency but only influences outage duration and excepted energy not supplied.
As shown in Table 5, with the introduction of tie switches in case 2, certain fault conditions allow rapid power transfer. In this case, supply restoration for some load nodes changes from “waiting for branch repair” to “waiting for tie switch operation”. Consequently, the SAIDI decreases significantly, by approximately 64.2% compared with case 1 (from 3.4443 h/year to 1.2332 h/year), while the EENS is also reduced.
Furthermore, in case 3, the integration of DG and SOP further enhances reliability. Compared with case 2, the SAIDI decreases by about 49.3% (from 1.2332 h/year to 0.6257 h/year), and the EENS is reduced by more than 51% (from 14.3298 MWh/year to 7.0129 MWh/year). Specifically, by replacing conventional tie switches with SOP, flexible and multi-terminal power transfer strategies can be achieved. This enables some nodes to be restored directly by SOP-based fast power transfer. As a result, the outage duration is further reduced from the “tie switch operation time” to the much shorter “SOP operation time”.
In addition, the integration of DG significantly enhances system fault tolerance. When a fault causes part of the network to disconnect from the main supply, DG with islanding capability can directly supply local loads. In such cases, the outage duration is reduced from the “branch repair time” to the shorter “islanding formation time”, thereby greatly improving system reliability.

6. Conclusions

This paper proposes an analytical reliability assessment method for mesh distribution networks with flexible operation characteristics and complex topologies. The main conclusions are as follows:
(1)
By constructing three types of FIMs, explicit analytical expressions for both system-level and node-level reliability indices are achieved. Case studies based on the IEEE RBTS Bus-6 system and the modified 44-bus Taiwan system verify the effectiveness of the proposed method.
(2)
The proposed method avoids fault scenario enumeration and iterative computation required in conventional reliability assessment methods, thereby significantly improving computational efficiency while maintaining accuracy. Its advantages are particularly evident in large-scale networks.
Future work will focus on addressing these limitations. Specifically, the framework will be extended to incorporate dynamic failure rates and repair times under extreme weather conditions and consider multiple coupled faults for resilience evaluation. Typical scenario clustering methods will be introduced to model DG stochasticity, and a multi-objective optimization framework will be developed to achieve coordinated planning of SOP and DG deployment strategies.

Author Contributions

Conceptualization, S.L. and L.L.; methodology, Y.C. and C.X.; software, C.Z. and Y.Z.; validation, F.L. and J.F.; formal analysis, C.Z. and Y.Z.; investigation, F.L. and J.F.; resources, F.L. and J.F.; data curation, Y.Z.; writing—original draft preparation, F.L. and J.F.; writing—review and editing, F.L. All authors have read and agreed to the published version of the manuscript.

Funding

This research was funded by Guangzhou Power Supply Bureau of Guangdong Power Grid Co., Ltd. (No. GDKJXM20231086(030100KC23100020)).

Data Availability Statement

The original contributions presented in this study are included in the article. Further inquiries can be directed to the corresponding authors.

Conflicts of Interest

Authors Shuitian Li, Lixiang Lin, Ya Chen, Chang Xu, Chenxi Zhang, and Yuanliang Zhang were employed by Guangzhou Power Supply Bureau of Guangdong Power Grid Co., Ltd. Author Fengzhang Luo and Jiacheng Fo were employed by Guangzhou Power Electrical Technology Co., Ltd. The remaining authors declare that the research was conducted in the absence of any commercial or financial relationships that could be construed as a potential conflict of interest.

References

  1. Li, P.; Ji, J.; Ji, H.R.; Song, G.Y.; Zhao, J.L.; Wang, C.S. Multi-stage expansion planning of energy storage integrated soft open points considering tie-line reconstruction. Prot. Control Mod. Power Syst. 2022, 7, 45. [Google Scholar] [CrossRef]
  2. Hu, D.; Sun, L.; Ding, M. Integrated Planning of an active distribution network and DG integration in clusters considering a novel formulation for reliability assessment. CSEE J. Power Energy Syst. 2023, 9, 561–576. [Google Scholar]
  3. Guo, J.; Liu, W.X.; Syed, F.R.; Zhang, J.H. Reliability assessment of a cyber physical microgrid system in island mode. CSEE J. Power Energy Syst. 2019, 5, 46–55. [Google Scholar] [CrossRef]
  4. Wangdee, W.; Billinton, R. Reliability assessment of bulk electric systems containing large wind farms. Int. J. Electr. Power Energy Syst. 2007, 29, 759–766. [Google Scholar] [CrossRef]
  5. Billinton, R.; Wang, P. Teaching distribution system reliability evaluation using Monte Carlo simulation. IEEE Trans. Power Syst. 1999, 14, 397–403. [Google Scholar] [CrossRef]
  6. Li, G.F.; Bie, Z.H.; Xie, H.P.; Lin, Y.L. Customer satisfaction based reliability evaluation of active distribution networks. Appl. Energy 2016, 162, 1571–1578. [Google Scholar] [CrossRef]
  7. Brown, R.E.; Gupta, S.; Christie, R.D.; Venkata, S.S.; Fletcher, R. Distribution system reliability assessment: Momentary interruptions and storms. IEEE Trans. Power Deliv. 1997, 12, 1569–1575. [Google Scholar] [CrossRef]
  8. Atwa, Y.M.; El-Saadany, E.F. Reliability evaluation for distribution system with renewable distributed generation during islanded mode of operation. IEEE Trans. Power Syst. 2009, 24, 572–581. [Google Scholar] [CrossRef]
  9. Bie, Z.H.; Zhang, P.; Li, G.F.; Hua, B.W.; Meehan, M.; Wang, X.F. Reliability Evaluation of Active Distribution Systems Including Microgrids. IEEE Trans. Power Syst. 2012, 27, 2342–2350. [Google Scholar] [CrossRef]
  10. Billinton, R.; Jonnavithula, S. A test system for teaching overall power system reliability assessment. IEEE Trans. Power Syst. 1996, 11, 1670–1676. [Google Scholar] [CrossRef]
  11. Billinton, R.; Wang, P. Reliability-network-equivalent approach to distribution-system-reliability evaluation. IEE Proc. Gener. Transm. Distrib. 1998, 145, 149–153. [Google Scholar] [CrossRef]
  12. Jia, H.P.; Ding, Y.; Song, Y.H.; Singh, C.N.; Li, M.Z. Operating Reliability Evaluation of Power Systems Considering Flexible Reserve Provider in Demand Side. IEEE Trans. Smart Grid 2019, 10, 3452–3464. [Google Scholar] [CrossRef]
  13. Li, W.X.; Wang, P.; Li, Z.M.; Liu, Y.C. Reliability evaluation of complex radial distribution systems considering restoration sequence and network constraints. IEEE Trans. Power Deliv. 2004, 19, 753–758. [Google Scholar] [CrossRef]
  14. Al-Muhaini, M.; Heydt, G.T. A novel method for evaluating future power distribution system reliability. IEEE Trans. Power Syst. 2013, 28, 3018–3027. [Google Scholar] [CrossRef]
  15. Lin, Y.-K. System Reliability Evaluation for a Multistate Supply Chain Network With Failure Nodes Using Minimal Paths. IEEE Trans. Reliab. 2009, 58, 34–40. [Google Scholar] [CrossRef]
  16. Chen, J.; Yu, T.; Xu, Y.; Cheng, X. Analytic method for power supply reliability assessment of electricity-gas coupled energy system. Autom. Electr. Power Syst. 2018, 42, 59–66. [Google Scholar]
  17. Liu, H.J.; Huang, J.G. Reliability Evaluation for Complex Distribution System Based on the Simplified Zone Model and the Minimal Path. In Proceedings of the 2011 Asia-Pacific Power and Energy Engineering Conference, Wuhan, China, 25–28 May 2011; pp. 1–4. [Google Scholar]
  18. Xie, K.; Zhou, J.; Billinton, R. Reliability evaluation algorithm for complex medium voltage electrical distribution networks based on the shortest path. IEE Proc. Gener. Transm. Distrib. 2004, 150, 686–690. [Google Scholar] [CrossRef]
  19. Wang, C.S.; Zhang, T.Y.; Luo, F.Z.; Li, P.; Yao, L.Z. Fault Incidence Matrix Based Reliability Evaluation Method for Complex Distribution System. IEEE Trans. Power Syst. 2018, 33, 6736–6745. [Google Scholar] [CrossRef]
  20. Chiou, J.P.; Chang, C.F.; Su, C.T. Variable scaling hybrid differential evolution for solving network reconfiguration of distribution systems. IEEE Trans. Power Syst. 2005, 20, 668–674. [Google Scholar] [CrossRef]
Figure 1. Structure of a mesh distribution networks (AC: Alternating Current; DC: Direct Current).
Energies 18 05508 g001
Figure 2. Structure of the soft open points.
Energies 18 05508 g002
Figure 3. FIM-A, B, C of 7-node distribution system.
Energies 18 05508 g003
Figure 4. Diagram of the IEEE RBTS bus 6 system.
Energies 18 05508 g004
Figure 5. Diagram of the modified 44 bus Taiwan test system.
Energies 18 05508 g005
Figure 6. Average interruption frequency and average interruption duration of load nodes.
Energies 18 05508 g006
Table 1. Comparison of the system reliability indexes.
Reliability IndicesReference [10]This Paper
SAIFI (1/year)1.00671.006649
SAIDI (h/year)6.6696.668781
ASAI0.999240.999238
EENS (MWh/year)72.8172.815310
Table 2. Comparison of Reliability Indexes of the Load Nodes.
Load
Number
Reference [10]This Paper
SAIFI
(1/Year)
SAIDI
(h/Year)
SAIFI
(1/Year)
SAIDI
(h/Year)
10.33033.670.33033.666
40.33033.670.33033.666
80.37253.760.37253.761
120.35953.700.35953.696
160.24051.010.24051.008
181.67258.401.67258.402
231.71158.601.71158.597
261.711511.481.711511.483
322.589012.982.589012.984
372.559515.722.559515.724
402.511015.482.511015.480
Table 3. Comparison of computational efficiency.
85-Node137-Node417-Node1080-Node
Reference [19]0.0610.1451.0038.862
This paper0.0100.0190.0920.591
Table 4. Comparison of differences between the three cases.
Tie SwitchDGSOP
Case 1×××
Case 2××
Case 3
Table 5. Reliability indexes for each case.
SAIFI (1/Year)SAIDI (h/Year)EENS (MWh/Year)
Case 11.13743.444337.2208
Case 21.13741.233214.3298
Case 31.13740.62577.0129
Disclaimer/Publisher’s Note: The statements, opinions and data contained in all publications are solely those of the individual author(s) and contributor(s) and not of MDPI and/or the editor(s). MDPI and/or the editor(s) disclaim responsibility for any injury to people or property resulting from any ideas, methods, instructions or products referred to in the content.