Abstract
The transition to sustainable electricity grids, particularly in countries with high renewable potential, such as Brazil, requires integrated assessments of hybrid and single-source configurations. This study analyzed the technical and economic feasibility of hybrid plants and isolated wind and solar systems in the Brazilian Northeast, focusing on Macaíba (RN) and Casa Nova (BA), regions characterized by high resource availability. The work addresses a gap in the literature by integrating detailed technical modeling and financial analysis of hybrid configurations, considering both local and operational constraints. Hourly simulations were performed using the HyDesign software (v1.1.0), with optimization based on the ratio between net present value (NPV) and invested capital (CAPEX), covering seven different scenarios by location, including hybrid combinations and systems with solar trackers. The results indicated that systems with solar tracking achieved superior economic performance. In Macaíba, the optimal configuration was the hybrid scenario with trackers, which increased the NPV/CAPEX by 27.69% compared to the relevant baseline. In Casa Nova, the best solution was the pure solar plant with trackers, which increased the NPV/CAPEX by 50.0% compared to fixed solar. Hybridization showed moderate gains in scenarios without tracking. It is concluded that while solar trackers are highly beneficial, the optimal plant configuration (pure solar or hybrid) is site-specific and depends on the local renewable resource profile. Notably, battery storage was not economically justified under the evaluated cost assumptions. The study contributes to the planning of renewable projects in contexts of high source complementarity.
1. Introduction
The climate crisis has had an increasingly severe impact on the planet, driven mainly by Greenhouse Gas (GHG) emissions. This scenario has led to heightened risks, including droughts, biodiversity loss, threats to food security, extreme heatwaves, and coastal flooding [1]. In this global context, Brazil stands out as a unique case among the Group of Twenty (G20) nations, with approximately 90.3% of its electricity matrix derived from renewable sources, supported by a diversified portfolio of hydroelectric, biomass, wind, and solar energy [2]. In contrast, the average renewable energy share across G20 countries remains significantly lower, ranging between 30% and 40% [3]. However, the growing share of intermittent renewable sources, such as wind and solar, poses challenges to grid stability and energy security due to their inherent variability [4]. Without proper integration strategies, these fluctuations can lead to supply–demand mismatches, increasing reliance on backup fossil-based generation [5].
In this context, robust planning methods under uncertainty are essential to ensure the reliability of hybrid systems. Recent studies have proposed approaches to optimize interconnection with the electrical grid, including microgrid architectures, by explicitly modeling the dynamic efficiency of bidirectional converters and the variability of solar generation. These advances aim to improve both operational performance and overall reliability [6,7,8]. For instance, Liang et al. developed a tri-level robust model based on data-correlated uncertainty sets, achieving significant reductions in interconnection costs and enhanced resilience compared to conventional methods [9].
To further address this challenge, hybrid power plants—which combine complementary energy sources (e.g., solar–wind or solar–hydro)—have emerged as a scalable solution [10]. By strategically integrating sources with complementary generation profiles and, where possible, partially dispatchable technologies, such systems mitigate the effects of intermittency and enhance grid reliability. This complementarity reduces the likelihood of simultaneous generation shortfalls, thereby improving energy security [11]. Moreover, hybrid facilities can be deployed in diverse contexts, ranging from remote areas, such as islands and desert communities, to urban environments, including residential, industrial, and commercial applications [12].
Different studies have demonstrated the technical, economic, and environmental feasibility of these systems. For instance, Ref. [13] shows through a case study in India that repowering existing wind farms with photovoltaic panels resulted in a discounted payback period of 6–8 years and a positive Net Present Value (NPV) of $9.48 million. Similar findings were reported by Rehman et al. [14], with Levelized Cost of Energy (LCOE) values ranging from US$0.03 to US$1.655/kWh across various hybrid configurations. From a financial perspective, grid-connected hybrid systems typically show lower levelized costs (both LCOE and Net Present Cost (NPC)) compared to isolated systems. While renewable-only systems require higher initial capital, their long-term economic competitiveness has been consistently demonstrated [12,15,16]. Furthermore, energy storage integration—although increasing upfront costs—has proven financially viable in specific contexts, particularly in off-grid locations or under favorable policy incentives [17].
In addition to economic viability, numerous studies have highlighted the significant reduction in GHG emissions that these systems can achieve. A notable example is the study by Liu et al. [18], which reports that, in certain cities, the integration of renewable sources compensated for more than the local emissions baseline. Despite these advantages, hybrid systems still face significant challenges. The high initial costs remain a barrier to widespread adoption, and the intermittency of renewable sources requires effective storage solutions and backup systems. In addition, Das et al. [19] highlight the lack of adequate infrastructure as another limiting factor to integrate these systems into the electricity grid. These challenges, although substantial, do not outweigh the vast potential of hybrid solutions, especially in countries like Brazil, where adoption is still in an incipient stage. Accordingly, the following section surveys optimization approaches applied to hybrid power plants, with a focus on their techno-economic evaluation, thereby establishing the basis for the objectives of this work.
1.1. Literature Review
To better address these technical, economic, and operational barriers, optimization tools are fundamental for evaluating and designing hybrid power plants. In this context, several studies employ specialized software to assess performance, sizing, and economic feasibility. For instance, Borba et al. [20] utilize HOMER Pro to simulate and optimize an off-grid hybrid renewable energy system that combines photovoltaic, wind, and Battery Energy Storage System (BESS). HOMER Pro is a widely recognized tool for analyzing microgrids and hybrid systems, capable of evaluating their technical and economic viability under various configurations. Its optimization framework minimizes key metrics such as the LCOE and NPC, while sensitivity analyses assess the impact of varying equipment costs and climatic conditions. Results from such studies demonstrate that while battery storage integration increases LCOE, the software helps identify balanced configurations that maximize renewable generation while maintaining economic feasibility.
The study by Hoarca et al. [21] also utilizes the iHOGA software, which employs genetic algorithms to optimize both the system configuration and the control strategy, in addition to HOMER. This evolutionary computation method allows iHOGA to explore a more expansive solution space, resulting in more efficient designs. The software’s single-objective optimization function primarily targets financial metrics (NPC and LCOE), but can incorporate secondary objectives such as carbon dioxide emissions when configured for multi-criteria analysis.
Another work that used software to analyze hybrid power plants was Muñoz et al. [22], which examined the impact of temporal complementarity between wind and solar sources on the optimal design of hybrid renewable energy systems. The researchers developed a mathematical model using GNU Octave, alongside tools such as HOMER, MOHERS, and iHOGA. Their model employed a fixed-seed genetic algorithm to ensure reproducibility and facilitate scenario comparisons. The objective function aimed to minimize the NPC while satisfying a reliability constraint defined by the Loss of Power Supply Probability. The results confirmed that high temporal complementarity can significantly reduce the NPC, particularly under strict reliability requirements.
Building on these approaches, recent studies have adopted HyDesign—an open-source platform designed explicitly for the techno-economic optimization of hybrid renewable energy plants. Unlike generic software, HyDesign integrates native capabilities for joint wind–solar storage sizing, leveraging advanced Gaussian Process algorithms to handle high-dimensional parameter spaces efficiently [23]. Its open-source nature facilitates transparency and customization, particularly for research applications requiring reproducibility or region-specific adaptations [24].
Importantly, the goal of optimization tools is not limited to choosing energy sources or sizing storage systems; they also enable a detailed exploration of technological configurations that can enhance system performance and economic returns. The use of solar trackers in photovoltaic panels, for example, has proven to be a significant technical and financial advantage. Two recent publications, Refs. [25,26], highlight notable improvements in photovoltaic system performance achieved through the use of solar trackers. Both studies report substantial energy efficiency gains with tracking technologies, particularly in dual-axis configurations, which can exceed 30% compared to fixed systems. These findings demonstrate how optimization analyses can capture trade-offs between higher capital costs and gains in energy production, supporting more rational investment decisions [27].
Recent reviews emphasize rapid advances in renewable integration and Artificial Intelligence (AI)-based optimization for hybrid power plants and hybrid renewable energy systems (HRESs). Bade et al. synthesize the state of co-located utility-scale wind–solar plants, covering sizing, optimization, energy management, and control strategies, and outlining open challenges for large-scale deployment [28]. Complementary surveys expand the methodological panorama: Thirunavukkarasu et al. consolidate contemporary optimization approaches for HRES, situating AI-based methods within techno-economic objectives and constraints, while noting research gaps relevant to grid-connected systems [29].
Bamisile et al. review integration with storage, detailing optimization formulations when ESS is coupled to wind–solar hybrids and clarifying typical objectives, constraints, and evaluation metrics [30]. Broader reviews of solar–wind hybrid systems highlight the implementation challenges and opportunities that drive the need for advanced optimization and data-driven operation strategies [31]. Finally, Ukoba et al. discuss the interface of AI and renewable energy systems, documenting how learning-based optimization and decision-support tools are being adopted to improve planning and operational performance, providing the wider context in which our case study is situated [32].
Although hybridization of renewable systems has been widely discussed in the international literature, comprehensive studies tailored to the Brazilian context remain limited. Existing works often address resource assessments or simplified technical analyses but generally fail to incorporate integrated evaluations that combine detailed modeling of complementary resources, operational synergies from hybridization, and their interactions with financial performance. Furthermore, there is a lack of studies that adequately consider the influence of battery storage on reducing curtailment and improving project profitability under realistic technical and economic constraints. This gap highlights the need for context-specific research that integrates technological, financial, and environmental dimensions to support the strategic role of hybrid systems in Brazil’s energy transition.
1.2. Research Contributions
Based on the contextualization in the introduction and the discussions in the literature review, it can be observed that studies on hybrid renewable energy systems in Brazil remain relatively limited when compared to the international state of the art. Although previous work has contributed valuable assessments of renewable resources and preliminary techno-economic analyses, comprehensive evaluations that integrate operational synergies, optimization strategies, and the role of storage under realistic technical and economic conditions are still scarce. In this sense, further research is required to explore these systems from a more integrated and context-specific perspective, considering both methodological approaches and regional specificities.
Motivated by this perspective, the objective of the present study is to conduct a techno-economic assessment of hybrid wind–solar power plants in the Brazilian Northeast, employing the HyDesign platform to optimize system configurations. The Northeast was selected given its combination of some of the country’s highest solar irradiation levels and wind resources, which together create favorable conditions for complementary generation and enhanced system performance. Studies indicate that large areas of the Northeast present average wind speeds above 6.0 m/s, particularly in coastal and semi-arid zones [33,34]. At the same time, solar irradiation exceeds 5 across most of the region [35,36]. These quantitative indicators reinforce the rationale for prioritizing the Northeast in hybrid wind–solar deployment strategies.
Accordingly, the main contributions of this work are as follows:
- Quantify the benefits of hybridization compared to single-source systems, with emphasis on increases in annual energy production and reductions in curtailment;
- Examine the economic implications of hybrid configurations through indicators such as LCOE, NPV, and capital efficiency;
- Identify optimal sizing strategies for installed capacity, taking into account site-specific restrictions such as grid connection limits;
- Evaluate the influence of battery storage on both technical performance and financial viability;
- Provide recommendations supported by quantitative evidence to inform strategies for Brazil’s renewable expansion, aiming at more efficient use of resources and improved project feasibility.
By advancing these contributions, this study seeks to enrich the methodological treatment of hybrid renewable systems in emerging markets and to generate evidence that supports their role in strengthening both the reliability and the economic competitiveness of Brazil’s energy transition.
This paper is organized as follows: Section 2 presents the methodology adopted, including HyDesign modeling, optimization criteria, and technical and economic parameters considered; Section 3 presents the results obtained; Section 4 discusses the financial and energy implications; and Section 5 summarizes the conclusions and recommendations of the study.
2. Materials and Methods
This research employed a methodological approach structured into six sequential steps to assess the techno-economic viability of hybrid wind–photovoltaic systems, considering the insertion of storage. The methodology integrates the collection and processing of hourly climatic data, the definition of techno-economic parameters, the configuration of the computational environment in the HyDesign software, the optimization modeling, the construction of simulation scenarios, and finally the integrated analysis of the technical and economic feasibility of the proposed systems, as illustrated in Figure 1. Each of these steps is detailed in the following subsections.
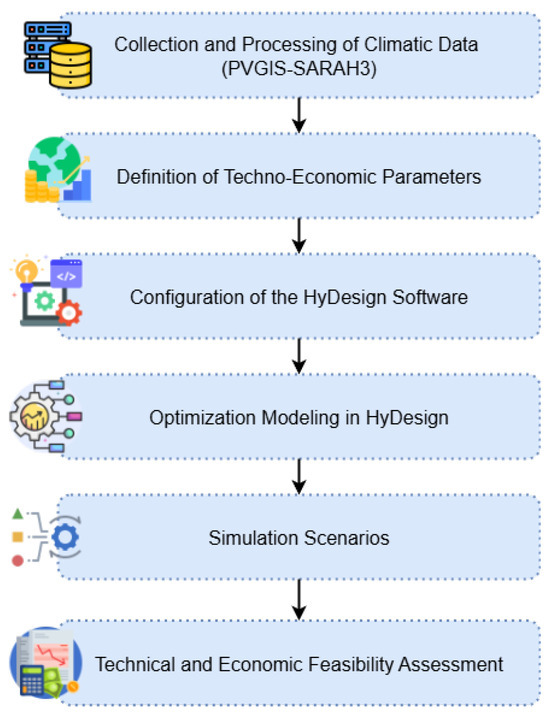
Figure 1.
Methodological flowchart of the study. It describes the study’s sequential methodological approach, integrating everything from climate data collection and parameter definition to modeling, scenario simulation, and final assessment of technical and economic feasibility.
2.1. Collection and Processing of Climatic Data
The first step of the methodology involves collecting and processing the data to be used to model the proposed hybrid system. For this purpose, essential climatic variables for energy simulation must be considered, such as global horizontal irradiance (direct, diffuse, and reflected components), time series of wind speed at 10 m above ground, and air temperature at 2 m.
These variables can be acquired through various climate databases. The selection of the most appropriate database must be based on established technical criteria to ensure the quality and representativeness of the data used in the modeling. The main criteria to be considered are as follows:
- Availability and completeness of necessary variables, ensuring that all essential parameters are present in a format compatible with the modeling;
- Temporal resolution, preferably hourly data, to enable a more detailed simulation sensitive to intra-daily variations;
- Spatial resolution, important for capturing microclimatic variations, especially relevant in regions with rugged terrain or climatic heterogeneity;
- Geographical coverage of the database, which should adequately cover the study area, allowing analyses consistent with the local reality;
- Reliability of the source, evaluated based on the scientific recognition of the database in the literature and its track record of use in energy studies.
Based on these criteria, different climatic datasets were analyzed, including Photovoltaic Geographical Information System-Surface Solar Radiation Data Set Heliosat 3 (PVGIS-SARAH3), Instituto Nacional de Meteorologia (INMET), Solar and Wind Energy Resource Assessment (SWERA), and ECMWF Reanalysis 5th Generation (ERA5).
Among these options, the PVGIS-SARAH3 dataset was selected for this study. Its adoption is justified by offering hourly temporal resolution and spatial resolution of , equivalent to a grid of approximately 5.5 km, in addition to providing broad coverage over South America [37]. These characteristics make the dataset particularly suitable for the proposed energy simulation, allowing for greater precision in capturing local variations in climatic parameters and ensuring higher fidelity to the regional context of the case study.
To obtain representative data, a Typical Meteorological Year (TMY) file was used, comprising 8760 hourly records that statistically reproduce the long-term average climate of a specific location. TMY datasets are constructed from multi-year historical measurements (typically 10 years or more) by selecting months that best reflect long-term averages [38]. The use of TMY files is a well-established practice in renewable energy and building performance simulations, as documented in the NREL TMY3 User’s Manual [39], ASHRAE guidelines for climatic data [40], and the ISO 15927-4 standard for constructing reference years [41]. This approach provides a statistically representative dataset that enables consistent performance comparisons across scenarios while substantially reducing computational burden relative to multi-year simulations. Although TMY data do not account for interannual variability or extreme events, they are technically appropriate for comparative techno-economic assessments under average long-term conditions.
After collecting the climatic variables, the data are processed to ensure the quality of the input information for the modeling. The selected dataset provides wind speed only at a 10 m height; therefore, it was necessary to adjust the wind profiles using Hellmann’s Power Law (Equation (1)), as described in [42]. The measurement units of the remaining parameters were also converted adequately to the units required by the simulation software.
where = wind speed at the desired height z (m); = wind speed at the reference height (m); = roughness coefficient, with adopted for daytime conditions in open terrain.
2.2. Definition of Techno-Economic Parameters
The definition and formalization of techno-economic parameters constitute a critical foundation for ensuring the internal consistency and analytical robustness of the hybrid system modeling process. These parameters encompass both technical specifications—such as nominal generation capacities, operational efficiencies, degradation rates, and technical constraints—and economic factors, including Capital Expenditure (CAPEX),Operational Expenditure (OPEX), equipment lifespans, and financial discount rates.
The input data was collected from recognized and up-to-date sources, including sectoral databases (e.g., International Renewable Energy Agency (IRENA), International Energy Agency (IEA), Empresa de Pesquisa Energética (EPE)), manufacturer technical reports, and scientific literature benchmarks. Monetary values were updated to the analysis year using the appropriate inflation indices and converted to euros (EUR) based on historical exchange rate series to accurately reflect purchasing power within the project context. The main economic parameters were formally represented as follows:
- Capital Expenditure (CAPEX):where is the unit cost of technology i (EUR per MW or MWh) and is the installed capacity or size of component i.
- Operational Expenditure (OPEX):where represents the specific annual operational cost for technology i.
- Levelized Cost of Energy (LCOE):where is the annual energy generated at year t, T is the project lifetime (years), and d is the discount rate.
- Net Present Value (NPV):where represents the revenue from electricity sales at year t.
All collected parameters underwent a consistency validation process, which included verification against reference ranges and the detection of potential outliers. In cases of data uncertainty or absence, technical interpolation or literature-based substitution was applied following standardized methodological criteria.
Furthermore, a parametric sensitivity analysis was conducted to assess the influence of each parameter on key performance indicators, including LCOE, NPV, and renewable energy share. This analysis guided the definition of the feasible search domains for the optimization algorithm, ensuring that only realistic and sector-consistent parameter ranges were considered.
Finally, the structured dataset was integrated into the computational framework of the HyDesign software, forming the reference basis for all simulations and optimizations. This procedure ensured that the obtained solutions maintained technical feasibility, economic plausibility, and methodological coherence within the established modeling framework.
2.3. Description and Configuration of the HyDesign Software
The simulation of hybrid renewable systems in this study was conducted using the HyDesign software, an open-source computational platform designed explicitly for the techno-economic sizing and optimization of hybrid renewable energy systems [23]. HyDesign integrates resource assessment, generation modeling, system sizing, optimization algorithms, and financial analysis within a single environment, enabling comprehensive evaluations of hybrid systems under real-world climatic conditions [24].
The platform operates on hourly time series data of solar irradiance, wind speed, and air temperature, which are pre-processed to ensure spatial and temporal consistency with the studied regions. The technological modeling incorporates key parameters of photovoltaic and wind technologies, such as turbine hub height, specific power, installation density, PV module tilt and azimuth angles, the inverter Direct Current-to-Alternating Current (DC/AC) ratio, and operational efficiencies. These configurations allow for the adjustment of system characteristics according to site-specific and technological constraints [23].
In addition to technical modeling, HyDesign integrates detailed financial analysis by incorporating CAPEX, OPEX, financing structures, and project lifetime assumptions. The tool applies fixed or user-defined parameters for the discount rate, inflation, and electricity sales price, providing flexible frameworks for techno-economic evaluations [23].
Optimization within HyDesign is performed through algorithms based on Gaussian Processes (Kriging) combined with the Efficient Global Optimization (EGO) framework [43,44]. This approach enables an efficient exploration of complex, non-linear solution spaces while minimizing computational costs, making it suitable for problems involving both continuous and discrete variables. Although capable of supporting multi-objective formulations, this study employed HyDesign to optimize single-objective functions by maximizing the relationship between NPV and CAPEX [45].
2.4. Optimization Modeling in HyDesign
The optimization framework was applied to design a grid-connected Hybrid Renewable Energy Systems (HRES) integrating wind power, Photovoltaic (PV) generation, and a BESS. This model leverages the complementary operational characteristics of each technology. The primary objective of the optimization process is to determine the optimal system configuration that maximizes economic performance while adhering to technical, spatial, and operational constraints [23].
The optimization process is formulated as a hierarchical model structured into two interdependent layers: an outer sizing layer and an inner operational simulation layer. In the outer layer, the optimization seeks to identify the optimal combination of system design variables—such as installed capacities, layout parameters, and operational setpoints—by solving a computationally intensive, nonlinear, mixed-variable optimization problem [46].
To efficiently navigate the high-dimensional search space and mitigate the prohibitive computational cost of exhaustive simulations, the parallel algorithm EGO is employed. This algorithm utilizes surrogate models, also known as metamodels, to approximate the response surface of the objective function using a reduced number of detailed simulations. The surrogate-assisted optimization approach is particularly advantageous for problems characterized by nonlinearities, mixed discrete-continuous variables, conflicting objectives (e.g., cost versus reliability), and substantial computational burdens per evaluation [23].
The inner layer comprises a high-resolution, techno-economic simulation of the candidate system’s behavior over its operational lifetime. This layer evaluates hourly dispatch strategies, battery cycling behavior, curtailment events, and the degradation of system components. The resulting operational metrics—such as energy yield, curtailment rates, storage utilization, and levelized costs—feed back into the outer layer to guide the optimization process. By explicitly modeling hourly energy flows and operational constraints, the framework ensures that the proposed designs are both economically viable and technically feasible under realistic operating conditions. This two-tiered approach enables the simultaneous exploration of design and operational spaces, providing a robust framework for optimizing complex hybrid renewable energy systems within realistic planning contexts [23].
2.4.1. Estimating Solar and Wind Power Generation in HyDesign
To estimate wind generation, HyDesign relies on hourly wind speed time series provided by the user at multiple measurement heights. These data are interpolated using the power law to calculate the wind speed at the exact hub height of the turbines. The conversion to electrical power is then performed through a surrogate modeling approach that integrates two fundamental components: (i) a generic turbine power curve, parameterized by the specific power of the machine, and (ii) a wake loss model that accounts for the number of turbines, their spatial configuration, and specific power. The resulting plant-level power curve is obtained by combining these two components.
For solar generation, the model employs the PVlib library to process irradiance and temperature time series provided by the user. It computes the irradiance incident on the modules, converts it into DC (Direct Current) output using a detailed physical model of the photovoltaic array, and subsequently transforms it into AC (Alternating Current) output by considering the AC/DC (Alternating Current/Direct Current) ratio and inverter efficiency. Panel orientation and system characteristics are included as project-defined input parameters.
2.4.2. Objective Function
The optimization problem was formulated to maximize the economic return of the hybrid system using the ratio between the NPV and the initial capital investment (CAPEX) as an objective function. This approach prioritizes identifying configurations that provide the highest relative economic benefit throughout the project’s life, which is particularly relevant for planning hybrid power plants aimed at attracting private investment and achieving profitability. Alternatively, LCOE may be employed in complementary analyses when the goal is to evaluate the generation cost per unit of energy produced. While LCOE is commonly adopted in power system planning and policy discussions, it may not fully capture the financial attractiveness of hybrid plants, which benefit from diversified revenue streams and operational synergies. Therefore, NPV/CAPEX is adopted here as the primary metric of economic performance, while LCOE serves as an auxiliary indicator when appropriate [20]. The formal representation of the objective function is given by:
where x denotes the vector of decision variables representing the techno-economic design of the hybrid system:
The decision vector x comprises the main design variables of the hybrid system: (clearance height of the rotor tip, m); (wind turbine specific power, MW m−2); (rated power of each wind turbine, MW); (number of wind turbines); (wind installation density, MW km−2); (installed PV capacity, MW); (tilt angle of PV modules, degrees); (azimuth angle of PV modules, degrees); (DC/AC ratio of the PV inverters); (battery nominal power, MW); (battery energy storage, in hours at nominal power); and (penalty factor for battery power fluctuations).
For wind modeling, HyDesign employs a parametric approach, where turbine power curves are generated from fundamental variables (specific power, hub height, and rotor diameter) using precomputed lookup tables [24]. This physics-based method captures system-level effects (wake losses, degradation) without requiring manufacturer-specific data, unlike the data-driven approach used for the PV module, which utilizes SAM/NREL parameters for the Canadian Solar CS5P-220M panels and ABB inverters [47].
2.4.3. Constraints
The main operational constraints of the system include the battery’s charging and discharging limits, compactly represented by:
Additionally, the hybrid power plant’s output is subject to the technical constraint imposed by the grid connection limit, formulated as:
where denotes the battery power at time t (MW); the wind generation (MW); the PV generation (MW); the curtailed power (MW); the total hybrid output (MW); and G the maximum grid injection capacity (MW).
By employing this formulation, the optimization process enables a structured exploration of the techno-economic trade-offs involved in hybrid power plant design, supporting investment-oriented decision-making in renewable energy planning. The grid connection capacity G was modeled as a fixed parameter, defined based on reference values from similar plants in the region. This choice ensures comparability and consistency across the scenarios analyzed.
2.5. Simulation Scenarios Configuration
In alignment with the computational structure of the HyDesign platform, seven main simulation scenarios were established to evaluate the potential benefits of hybridization, as shown in Table 1.

Table 1.
Configuration of scenarios.
As summarized in Table 1, seven distinct scenarios were defined to represent the main technological alternatives for wind–solar systems. These include single-source wind or solar plants, solar plants with tracking, hybrid wind–solar plants with and without tracking, and capacity-constrained cases. This framework provides a comprehensive basis for the comparative analysis developed in the following sections.
The wind-only Scenario (1) considered electricity generation exclusively from wind resources, using site-specific wind speed data adjusted to the turbine hub height. The modeling incorporated technical constraints such as maximum installation density (MW km−2) and available land area. Wind turbine specifications, including rotor diameter and specific power, were defined according to standardized reference values to ensure comparability across scenarios.
The PV-only Scenarios (2) and (3) relied on Global Horizontal Irradiance (GHI), which was converted to the plane of the PV modules using location-specific tilt and azimuth angles. Scenario (2) assumed a fixed-tilt configuration, while Scenario (3) introduced single-axis tracking. Conversion efficiency parameters followed standardized values, and secondary losses (e.g., shading, soiling, or long-term degradation) were not explicitly modeled, allowing the analysis to isolate the structural impacts of hybridization and tracking.
In hybrid Scenarios (4) and (5), wind and solar were combined in variable proportions to explore the temporal complementarity between their generation profiles, with and without tracking. Scenarios (6) and (7) reflected capacity-constrained conditions, where solar or wind capacity was fixed at half of the maximum interconnection limit. These constrained cases simulate situations in which an additional technology complements an existing plant, while the total installed capacity remains within the grid’s restrictions.
Across all scenarios, multiple combinations of installed capacities were simulated within the local technical limits, including grid interconnection capacity and technology-specific power density thresholds. The model also assumed shared use of infrastructure such as substations and transmission lines, reflecting realistic opportunities for cost reduction and efficiency gains in hybrid projects.
Battery storage was incorporated as a decision variable in every scenario. The optimization algorithm can autonomously determine whether to include storage and, if so, the optimal power and energy capacity within predefined limits. This allowed the evaluation of storage in three dimensions: operational flexibility (smoothing intermittency and adapting to demand), increased local use of renewable energy, and its impact on the economic performance of the system.
It is essential to highlight that, although this configuration provides a structured basis for comparative analysis, certain simplifications were necessary to align with the study’s scope. TMY data were used to estimate long-term generation, which does not capture interannual climatic variability. Likewise, the economic analysis assumed constant electricity prices and did not account for market dynamics or policy incentives, such as subsidies, that could impact financial feasibility in practice.
Despite these simplifications, the framework adopted enables a systematic and controlled evaluation of hybridization effects. By applying consistent premises across all scenarios, the methodology isolates the key drivers of techno-economic performance, offering a robust reference for future studies on hybrid renewable systems.
2.6. Technical and Economic Feasibility Assessment
The final stage of the methodology involved an integrated assessment of both the technical and economic feasibility of the simulated scenarios. This step aimed to quantify the comparative advantages of hybrid versus single-source configurations while evaluating the role of battery storage systems in improving operational flexibility and financial return.
From a technical standpoint, key performance indicators were calculated, including total annual generation disaggregated by source, curtailment ratio, and hourly generation variability profiles derived from HyDesign’s operational outputs.
On the economic side, financial indicators were employed to evaluate the feasibility of each scenario, with particular emphasis on LCOE, NPV, and Internal Rate of Return (IRR), all formally defined in Section 2. Additionally, the NPV-to-CAPEX ratio was used as a dimensionless metric of capital efficiency. This comparative framework enabled the evaluation of relative performance without relying on absolute energy market prices, thereby mitigating uncertainties related to long-term price forecasts.
2.6.1. Technical Performance Indicator
- Annual Energy Production (AEP) [GWh]:where is the instantaneous generation of technology i (wind, PV, hybrid) at time t [MW].
To evaluate the contribution to system stability through hybridization, the Coefficient of Variation (CV) was employed. This statistical measure quantifies the relative dispersion of data concerning the mean. It is defined as [48]:
where is the standard deviation (absolute measure of dispersion) and is the mean of the data.
A reduction in CV values over time or between configurations directly indicates improved system stability, as it reflects a decrease in relative variability in performance metrics. In this work, CV was calculated for each scenario throughout the year, using data from the hourly generation. This annual calculation enables a consolidated comparison of variability between the hybrid system and the individual sources. However, it is essential to emphasize that adding a second renewable source does not automatically guarantee reduced variability: the effect depends on the temporal complementarity between the sources. If the two sources exhibit a high positive correlation (e.g., both peak around noon), the hybrid system might even show higher variability on some days. Conversely, suppose that the sources are negatively correlated or complementary in time (e.g., wind peaks at night and solar during the day). In that case, the resulting hybrid profile tends to be smoother, thus lowering CV.
2.6.2. Economic Assessment
The economic viability was assessed assuming a constant nominal electricity price of 33.75 EUR/MWh and a project lifetime of 25 years, under the climatic conditions provided by the TMY datasets described in Section 2. Although the use of TMY data entails inherent uncertainties, it remains consistent with standard practice in renewable energy modeling. By jointly considering technical performance and financial feasibility, the analysis establishes a robust basis for identifying optimal hybridization strategies adapted to the study region.
Electricity price dynamics, such as tariffs or market volatility, were deliberately held constant, so that the results reflect comparative performance under a uniform price assumption. Exploring sensitivity to electricity price variability would require modeling time-varying or stochastic price trajectories, which lie beyond the deterministic framework adopted in this study.
3. Simulations and Results
This section presents the execution of the simulations, the application of the methodology to the selected locations, and the analysis of the results obtained. The objective is to evaluate the technical and economic performance of different hybrid system configurations, comparing exclusively wind, exclusively photovoltaic, and integrated hybrid scenarios, with and without storage.
3.1. Execution of the Simulations
The computer simulations were performed in the HyDesign software environment, based on the systematic insertion of the climate and techno-economic data defined in the parameterization steps. Hourly series of solar irradiance, wind speed, and air temperature were used, along with technical parameters such as hub height, power density, DC/AC ratio, module inclination, and component lifespan.
The economic parameters, such as CAPEX, OPEX, discount rate, and investment horizon, were implemented directly in the software. HyDesign was configured to automatically test different combinations of installed power for solar and wind sources, with and without the presence of batteries, optimizing the scenarios based on the NPV/CAPEX ratio. The simulations yielded technically feasible scenarios, providing detailed outputs on generation by source, hourly behavior, curtailment, storage utilization, and associated economic metrics.
3.2. Application to the Case Study
The proposed methodology was applied to two Brazilian locations with recognized renewable potential and complementarity between solar and wind resources: Macaíba, RN, and Casa Nova, BA, as seen in the Figure 2.
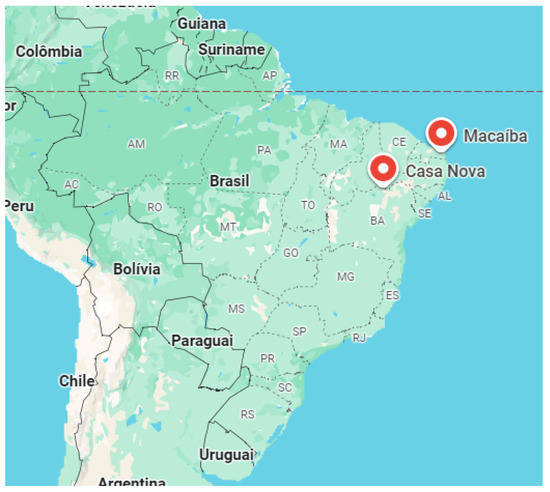
Figure 2.
Geographical location of places. Map of Brazil highlighting the locations of Macaíba, in the state of Rio Grande do Norte, and Casa Nova, in the state of Bahia, both in the Northeast region.
Hourly climate data were obtained from the PVGIS-SARAH3 database, adopting the TMY format as a reference for characterizing local atmospheric conditions. This approach allows a statistically robust representation of the climate regime over a typical year. The average global horizontal irradiances were 255.17 W/m2 in Macaíba and 240.84 W/m2 in Casa Nova. The average wind speeds at 100 m were 6.52 m/s and 5.84 m/s, respectively. Figure 3 and Figure 4 show the hourly average GHI and the wind speed at 100 m, respectively.
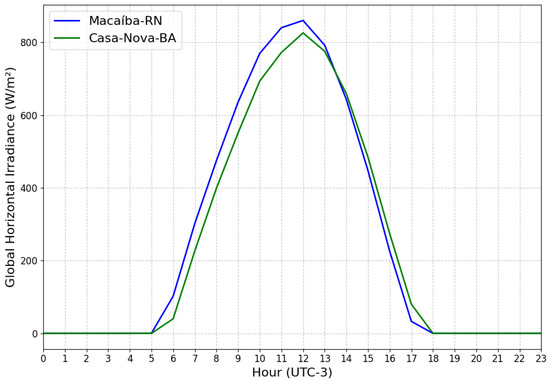
Figure 3.
Global horizontal irradiance hourly profile. The curve illustrates the characteristic variation in solar radiation, with low values in the early morning and late afternoon, reaching a maximum peak close to solar noon.
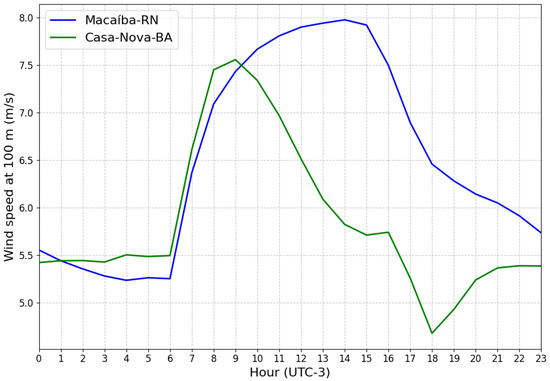
Figure 4.
Wind speed at 100 m hourly profile. The curve demonstrates the typical variability of wind speed in daily cycles, showing characteristic fluctuations that may include daytime or nighttime peaks depending on local phenomena.
For the economic aspects, updated CAPEX and OPEX were adopted based on data from EPE and IRENA, which are considered international references in energy feasibility studies. The values were converted to euros (EUR) using an average exchange rate of 0.1569 EUR/BRL (6.37 BRL/EUR), based on the daily quotes of the Central Bank of Brazil in May 2025 [49]. All values were subjected to consistency control procedures to ensure compatibility with the real conditions of the Brazilian market and with the requirements of the HyDesign software. The costs of the components used in the simulations are presented in Table 2. At the same time, the complementary financial parameters, such as the discount rate (WACC), project lifespan, and taxation, are described in Table 3.
Table 2.
Costs of energy components. Source: [50,51,52].
Table 3.
Economic parameters adopted.
The technical configuration of the simulated systems was based on typical values from the engineering of renewable energy projects. Some parameters were defined based on consolidated practices, such as specific power (250 W/m2). Other parameters were treated as design variables within pre-established ranges, allowing system optimization. For example, the number of turbines varied from 0 to 10 units, the solar power from 0 to 100 MW, and the inclination of the photovoltaic modules from 5∘ to 25∘, depending on the local latitude. These definitions are systematized in Table 4, which presents the fixed parameters and the variation ranges used in the simulations.
Table 4.
Technical parameters of the project used in the simulations.
The technical and economic premises presented in Table 2, Table 3 and Table 4 were applied consistently to each configuration defined in Table 1. In practice, the parameters provide the common inputs to all seven scenarios, while the structural differences among scenarios (as set out in Table 1) determine how those inputs are combined in the simulations. This integration ensures methodological coherence and strict comparability across scenarios and locations.
For comparative analysis between scenarios, a fixed electricity price of 33.75 EUR/MWh was adopted, used exclusively for calculating economic indicators (such as NPV and LCOE). Although this approach does not reflect the absolute economic viability of the projects, it enables a relative comparison between locations and configurations, highlighting the benefits provided by hybridization and variations in sizing.
3.3. Proposed Scenarios Results Analysis
The following section presents a comprehensive evaluation of the proposed renewable energy scenarios for Macaíba and Casa Nova, focusing on their technical and economic viability. Key performance indicators, including IRR, LCOE, NPV, AEP, and curtailment, are analyzed across single-source and hybrid configurations. The highest performing scenario for each location is highlighted in green, facilitating a direct comparison of the results. The results are disaggregated by location to address site-specific dynamics, with detailed discussions provided for Macaíba and Casa Nova in their respective subsections.
3.3.1. Analysis for Macaíba
Table 5 and Table 6 summarize the results for Macaíba, comparing single-source (wind or solar) and hybrid (wind–solar) scenarios.
Table 5.
Single source scenario results for Macaíba.
Table 6.
Hybrid scenarios results for Macaíba.
The results demonstrate that the use of solar trackers brings significant benefits in all economic and operational indicators. Comparing the fixed solar (Scenario (2)) and solar with tracking (Scenario (3)) scenarios, there is a 56.9% increase in the NPV/CAPEX ratio, from 0.51 to 0.80, accompanied by a 15.26% reduction in LCOE (from 30.80 EUR/MWh to 26.10 EUR/MWh). Additionally, annual energy production (AEP) increased by 21.23%. These results suggest that investing in solar tracking systems is highly advantageous for the Macaíba region, offering greater energy efficiency and a higher financial return.
Regarding hybridization without solar trackers, the results reveal essential nuances. Firstly, comparing the pure wind scenario (Scenario (1)) to the fixed wind–solar hybrid (Scenario (4)) shows a moderate improvement, with a 1.56% increase in NPV/CAPEX; however, a slight rise in LCOE. However, when comparing the pure fixed solar scenario (Scenario (2)) to the corresponding hybrid (Scenario (4)), the gains are better (27.45% in NPV/CAPEX), but there is an increase in curtailment. This suggests that hybridizing existing wind plants may not be as effective as hybridizing existing fixed solar plants. While adding wind to existing solar farms is beneficial, the reverse can lead to operational challenges, such as oversizing of the wind turbines.
When hybridization with solar trackers was considered, there was a significant reduction in the wind share (from 100 MW to 10 MW), while solar capacity increased substantially (from 23 MW to 96 MW). This configuration led to a 27.69% increase in the NPV/CAPEX ratio and a 7.89% reduction in LCOE, along with a marked decrease in curtailment—from 117.80 GWh (29.9% of potential generation) to 38.79 GWh (12.6%), i.e., a reduction of 67.07% in absolute terms. The apparent oversizing of installed capacity relative to the 100 MW grid connection limit explains the higher curtailment levels observed. Within this modeling framework, hybridization with trackers proved beneficial for Macaíba, providing significant economic and technical improvements under the evaluated assumptions.
Finally, scenarios with wind or solar capacity limited to 50 MW (Scenario (6), limited wind power, and Scenario (7), limited solar power) were analyzed to simulate situations in which the grid connection is already partially occupied by wind or solar plants. While Scenario (6) (hybrid with limited wind) exhibits 20.59 GWh more curtailment than pure solar (Scenario (2)), it demonstrates superior overall performance through three key metrics: a 19.60% increase in NPV/CAPEX ratio confirms better capital efficiency, a reduced LCOE indicates enhanced cost competitiveness, and greater total energy generation validates improved resource utilization. The introduction of tracking in Scenario (7) led to an 18.03% increase in NPV/CAPEX compared to Scenario (6), accompanied by higher energy production but also increased curtailment.
Thus, it is clear that for Macaíba, the hybridization considering panels with solar trackers yielded the best economic result (Scenario (5)). Scenario (3) also stands out, highlighting the advantage of using trackers, which is an advantage over Scenario (5) in that it does not present curtailment. Furthermore, for fixed solar or pure wind plants, hybridization can bring benefits, as noted in Scenario (4). Limiting the wind share in the hybridization ensures a more balanced distribution of sources, in addition to reducing curtailment (Scenario (6)). Finally, the use of trackers with limited solar energy guaranteed a greater economic return but also greater curtailment (Scenario (7)).
3.3.2. Analysis for Casa Nova
Casa Nova’s results, presented in Table 7 and Table 8, reveal distinct trends driven by the region’s wind and solar potential.
Table 7.
Single source scenario results for Casa Nova.
Table 8.
Hybrid scenario results for Casa Nova.
The results in Casa Nova follow a similar trend to that observed in Macaíba regarding the benefits of solar trackers, but with some essential particularities. When comparing the fixed solar scenarios (Scenario (2)) and solar with tracking (Scenario 3), there is a significant gain of 50.0% in the NPV/CAPEX ratio, jumping from 0.56 to 0.84, accompanied by a 17.2% increase in annual energy production (AEP). These figures confirm that, as in Macaíba, investment in solar tracking systems is highly advantageous for Casa Nova, providing a better financial return and greater energy efficiency.
Regarding hybridization without solar trackers, significant results were observed. The comparison between the pure wind scenario (Scenario (1)) and the fixed wind–solar hybrid (Scenario (4)) shows a 22.0% increase in NPV/CAPEX and a 5.7% reduction in LCOE. When comparing the fixed solar scenario (Scenario (2)) to the hybrid scenario (Scenario (4)), a slightly more modest increase of 8.9% in NPV/CAPEX and a 3.0% decrease in LCOE are observed, indicating that hybridization was beneficial compared to both single-source scenarios. Scenario (5) (hybrid with solar tracking) presents precisely the same results as Scenario (3) (pure solar with tracking), demonstrating the system’s preference for single-source generation configurations when tracking is implemented.
Finally, when examining the scenarios with solar capacity limited to 50 MW, we note that the hybridization of an existing wind farm with the addition of fixed solar (Scenario (6)) is advantageous, with a 12.0% increase in NPV/CAPEX compared to the pure wind scenario (Scenario (1)). And the introduction of tracking in this configuration (Scenario (7)) yields significant improvements: a 14.3% increase in NPV/CAPEX compared to Scenario (6), along with reduced LCOE and a substantial 71.5% decrease in curtailment. These results demonstrate a far more efficient system configuration when solar tracking is implemented.
Regarding the use of storage systems, the results in both cities were the same, as the software did not include batteries in any of the simulations performed. This suggests that, within the parameters considered and the specific characteristics of these locations, the incorporation of storage systems did not prove to be economically viable, possibly because the additional costs did not offset the benefits in terms of curtailment reduction or increased revenue.
In summary, hybridization in Casa Nova proved advantageous compared to single-source scenarios when trackers were not considered, a finding similar to those in Macaíba. However, unlike in Macaíba, the results suggest that hybridizing an existing wind farm by adding solar is more beneficial than the opposite approach, delivering greater economic returns and operational efficiency. Meanwhile, the use of solar trackers in Casa Nova appeared to reduce the relative benefit of hybridization under the evaluated assumptions, since optimized solar generation alone achieved similar performance to the hybrid alternatives.
4. Discussion
The discussion is organized into two parts. Section 4.1 examines the techno-economic results, focusing on site-specific drivers, the role of solar tracking, and the conditions under which hybridization is beneficial. Section 4.2 addresses gains in stability and variability reduction, including the implications of curtailment and the non-selection of storage.
4.1. Interpretation of Techno-Economic Results
The simulation results confirm that the optimal configuration of hybrid power plants is highly dependent on local resource availability, as no single arrangement proved superior across the two study sites. While the adoption of solar tracking systems consistently enhanced the performance of photovoltaic generation, the interaction between tracking technology and wind integration produced contrasting outcomes in Macaíba and Casa Nova.
In Macaíba, the best-performing configuration was the hybrid plant with a predominantly solar base equipped with tracking and a reduced share of wind capacity (Scenario (5)). This arrangement achieved the highest NPV/CAPEX ratio (0.83), the lowest LCOE (25.69 EUR/MWh), and reduced curtailment by 67% compared to the equivalent hybrid configuration without tracking. Taken together, these results suggest that the greatest economic and technical benefits arise when solar tracking is combined with a limited contribution of wind power, underscoring the complementarity of the resources at this site.
In Casa Nova, by contrast, the optimal solution corresponded to the solar-only configuration with tracking (Scenarios (3) and (5)). The hybrid alternative with trackers offered no additional benefit relative to the pure solar case, as both achieved identical economic and technical indicators (NPV/CAPEX of 0.84 and LCOE of 27.92 EUR/MWh). In this location, the solar resource alone, when exploited with tracking, was sufficient to ensure maximum efficiency, meaning that additional wind capacity did not improve performance.
When systems without tracking are considered, however, hybridization proved advantageous in both locations, albeit through different mechanisms. In Casa Nova, adding fixed solar capacity to an existing wind plant increased the NPV/CAPEX ratio by 22.0% compared to wind alone, whereas in Macaíba, combining wind with fixed solar led to a 27.5% improvement relative to the standalone fixed solar case. These results demonstrate that hybridization can be a valuable strategy in the absence of tracking, but the balance between resources remains strongly site-specific.
All simulated scenarios were economically feasible: NPVs remained positive, IRRs exceeded the Weighted Average Cost of Capital (WACC) of 8%, and LCOEs values ranged between 25.7 and 33.5 EUR/MWh. Even configurations constrained by grid capacity (e.g., 50 MW wind or solar) produced balanced results, although they exhibited higher curtailment. This outcome underscores the importance of accounting for grid restrictions in planning processes and emphasizes the value of optimization frameworks that explicitly incorporate such constraints.
Overall, the findings highlight that the choice between pure solar, pure wind, and hybrid plants depends not only on local complementarities between resources but also on the economic trade-offs introduced by advanced technologies. Solar trackers consistently increased competitiveness; however, their interaction with wind capacity could generate synergies, as in Macaíba, or prove unnecessary, as in Casa Nova. This underlines the need for site-specific assessments rather than generalized conclusions about the superiority of hybridization.
Although the study focused on two municipalities in Northeast Brazil, the results are consistent with international benchmarks. The LCOEs values obtained (25.7–33.5 EUR/MWh) lie within the range reported for hybrid projects worldwide (25–156 EUR/MWh) [3,14,56]. Building on this alignment with international evidence, the main contribution of this work lies in adapting and applying the HyDesign optimization platform to the Brazilian context, explicitly integrating technical and financial modeling under operational constraints. By addressing the scarcity of integrated assessments tailored to Brazil, the study advances the understanding of hybrid system performance under local conditions and provides evidence to guide future planning decisions.
An additional limitation concerns the relatively high curtailment observed in some hybrid scenarios, particularly the Macaíba Scenario (4). This behavior is intrinsic to the HyDesign optimization framework, which does not account for operational strategies (e.g., demand-side management, flexible dispatch rules) or grid reinforcement measures that could mitigate such effects. In practice, curtailment can be alleviated through grid flexibility, advanced operational controls, or market mechanisms that facilitate the integration of variable renewable energy sources. While these strategies were beyond the scope of this study, acknowledging their potential is important for interpreting the results. Future research should therefore incorporate curtailment mitigation approaches in sensitivity analyses to provide a more realistic assessment of the economic potential of hybrid power plants.
4.2. Gains in System Stability and Variability Reduction
As discussed in the methodology, the CV was employed to assess the relative variability of hourly annual generation, providing a normalized measure that facilitates comparison across scenarios with different magnitudes of output. The results for Macaíba indicate that the hybrid scenario without trackers (Scenario (4)) led to a substantial reduction in CV compared to the single-source cases, with the most pronounced improvement (45.9%) observed when moving from fixed solar to the hybrid configuration. This evidences the strong complementarity between solar and wind in this site, where temporal offsets between resource profiles help smooth fluctuations in output.
In Casa Nova, by contrast, the reduction in variability was more modest (15.9%), though still relevant. The more negligible effect reflects the dominance of solar generation in this location and the lower degree of complementarity with wind resources. However, the results confirm that hybridization can provide measurable gains in stability, particularly in regions where resource profiles are partially desynchronized.
It should be emphasized that adding another variable source does not automatically lead to lower variability. The effectiveness depends on the correlation structure of the resources and on design choices such as capacity ratios. In cases of poor complementarity or oversized installations, hybridization may even increase fluctuations. This reinforces the importance of site-specific assessments when evaluating stability benefits.
Regarding storage, the optimization did not select batteries in any scenario, as the potential reduction in curtailment or variability did not offset the additional cost. While storage could, in theory, reduce the CV to near zero, under the cost and policy assumptions adopted in this study, it was not considered viable. This outcome highlights that, although batteries remain a key long-term strategy for variability management, hybridization of wind and solar already delivers significant stability gains in favorable contexts.
5. Conclusions
This study evaluated the technical and economic feasibility of wind, solar, and hybrid power plants in two municipalities of Northeast Brazil, comparing configurations with and without solar tracking. Using the HyDesign optimization platform, seven scenarios were simulated for each site, integrating hourly climate data, techno-economic parameters, and investment indicators. The methodological framework, based on maximizing the NPV/CAPEX ratio, provided a systematic approach to identifying site-specific optimal configurations under consistent premises.
The results underscored the decisive role of solar tracking systems, which consistently enhanced the competitiveness of photovoltaic generation. In Macaíba, the most favorable configuration combined a large tracked solar base with a reduced share of wind capacity, achieving the highest NPV/CAPEX ratio and the lowest LCOE. In Casa Nova, by contrast, the solar-only configuration with tracking achieved equivalent performance to the hybrid alternative, demonstrating that local resource complementarity defines whether hybridization adds value. Hybrid systems without trackers proved beneficial in both sites, confirming that complementarities are especially relevant when solar efficiency is not maximized. In all scenarios, positive NPVs and internal rates of return above the 8% WACC confirmed the economic feasibility of the projects.
Despite these favorable outcomes, it is important to recognize the methodological premises adopted in this work, which are aligned with common practices in techno-economic assessments of renewable systems. The use of TMY datasets, for instance, enabled the representation of typical long-term climatic conditions and facilitated comparability between sites. However, it does not fully capture interannual variability or extreme events. Similarly, electricity prices were modeled as constant throughout the project horizon, ensuring internal consistency across scenarios, even though such values are typically subject to fluctuations, tariff revisions, and policy incentives in practice.
Battery storage was also incorporated as a decision variable, with capacity allowed to vary within the modeled range (0–10 MW and 0–10 h). Under the cost assumptions considered, the optimization consistently selected no storage, indicating that small-scale battery integration was not economically justified in the analyzed scenarios. This outcome reflects the current economic context rather than a structural limitation of the technology. On a larger scale, or under alternative cost and policy conditions, its role could become more relevant. Parameters for system efficiencies and losses were likewise standardized, a procedure that ensures transparency and replicability, although it does not address factors such as degradation, soiling, or operational variability in detail.
Finally, the modeling considered shared infrastructure, which is consistent with the planning of many hybrid projects, but real-world applications may encounter additional transmission or substation constraints. The HyDesign platform was also applied with a single-objective optimization (NPV/CAPEX), which provided clarity in financial prioritization. At the same time, future studies may benefit from multi-objective approaches that explicitly integrate environmental and social dimensions.
These simplifications delineate the scope of the present analysis but also point to promising directions for future research. Expanding the modeling to incorporate dynamic electricity prices, explicit curtailment mitigation strategies, demand-side management, grid reinforcement, and sensitivity analyses with different scales of battery storage would provide a more comprehensive assessment. Moreover, adopting multi-objective formulations could integrate environmental, financial, and operational perspectives, thus aligning optimization outcomes more closely with real-world planning needs.
In summary, the contribution of this work lies in delivering an integrated, context-specific assessment of hybrid power plants in Brazil, explicitly linking technical modeling with financial performance under operational constraints. By tailoring the methodology to local conditions and clarifying its premises, the study advances the understanding of renewable hybridization in emerging markets. It also provides a foundation for more refined analyses that may incorporate market, regulatory, and technological dynamics, thereby supporting Brazil’s energy transition with evidence-based guidance.
Author Contributions
Conceptualization, I.B.R., W.N.S. and L.F.N.L.; Methodology, I.B.R., W.N.S. and L.F.N.L.; Software, I.B.R.; Validation, I.B.R., T.S.A. and B.Z.D.M.; Formal analysis, I.B.R.; Investigation, I.B.R., T.S.A. and B.Z.D.M.; Data curation, I.B.R., W.N.S. and G.G.T.V.; Writing—original draft preparation, I.B.R. and W.N.S.; Writing—review and editing, L.F.N.L. and W.N.S.; Supervision, L.F.N.L. and W.N.S. All authors have read and agreed to the published version of the manuscript.
Funding
This research was funded by the Coordination for the Improvement of Higher Education Personnel (CAPES), the Research Centre for Greenhouse Gas Innovation (RCGI), and TotalEnergies. The APC was funded by the Institute of Energy and Environment at the University of São Paulo (IEE-USP).
Data Availability Statement
The data presented in this study are available on request from the corresponding author.
Acknowledgments
The authors gratefully acknowledge the institutional support of the Institute of Energy and Environment at the University of São Paulo (IEE-USP), along with research grants from the Brazilian National Council for Scientific and Technological Development (CNPq) and the Coordination for the Improvement of Higher Education Personnel (CAPES). We gratefully acknowledge the support of the RCGI—Research Centre for Greenhouse Gas Innovation (23.1.8493.1.9), hosted by the University of São Paulo (USP), sponsored by FAPESP—São Paulo Research Foundation (2020/15230-5), and sponsored by TotalEnergies, and the strategic importance of the support given by ANP (Brazil’s National Oil, Natural Gas and Biofuels Agency) through the R&DI levy regulation.
Conflicts of Interest
The authors declare no conflicts of interest. The funders had no role in the design of the study, in the collection, analysis, or interpretation of data, in the writing of the manuscript, or in the decision to publish the results.
Abbreviations
The following abbreviations are used in this manuscript:
| AC | Alternating Current |
| AEP | Annual Energy Production |
| AI | Artificial Intelligence |
| BESS | Battery Energy Storage System |
| CAPES | Coordenação de Aperfeiçoamento de Pessoal de Nível Superior |
| CAPEX | Capital Expenditure |
| CF | Capacity Factor |
| CV | Coefficient of Variation |
| DC | Direct Current |
| DG | Distributed Generation |
| DTU | Technical University of Denmark |
| ECMWF | European Centre for Medium-Range Weather Forecasts |
| EPE | Empresa de Pesquisa Energética |
| ERA5 | ECMWF Reanalysis 5th Generation |
| ESS | Energy Storage System |
| GA | Genetic Algorithm |
| GHG | Greenhouse Gas |
| G20 | Group of Twenty |
| GHI | Global Horizontal Irradiance |
| GP | Gaussian Process |
| HOMER Pro | Hybrid Optimization of Multiple Energy Resources (Pro) |
| HRES | Hybrid Renewable Energy System(s) |
| HyDesign | Open-source platform for hybrid plant optimization |
| IEA | International Energy Agency |
| INMET | Instituto Nacional de Meteorologia |
| INPE | Instituto Nacional de Pesquisas Espaciais |
| IoT | Internet of Things |
| IRENA | International Renewable Energy Agency |
| IRR | Internal Rate of Return |
| LCOE | Levelized Cost of Energy |
| MME | Ministério de Minas e Energia |
| NPC | Net Present Cost |
| NPV | Net Present Value |
| OPEX | Operational Expenditure |
| PV | Photovoltaic |
| PVGIS | Photovoltaic Geographical Information System |
| SARAH | Surface Solar Radiation Data Set – Heliosat |
| SWERA | Solar and Wind Energy Resource Assessment |
| TMY | Typical Meteorological Year |
| WACC | Weighted Average Cost of Capital |
References
- IPCC. SYNTHESIS REPORT OF THE IPCC SIXTH ASSESSMENT REPORT (AR6) Summary for Policymakers. 2021. Available online: https://www.ipcc.ch/report/ar6/syr/downloads/report/IPCC_AR6_SYR_SPM.pdf (accessed on 1 September 2025).
- Operador Nacional do Sistema Elétrico (ONS). O Sistema em Números. 2024. Available online: https://www.ons.org.br/paginas/sobre-o-sin/o-sistema-em-numeros (accessed on 1 September 2025).
- IRENA. World Energy Transitions Outlook 2024. 2024. Available online: https://www.irena.org/-/media/Files/IRENA/Agency/Publication/2024/Nov/IRENA_World_energy_transitions_outlook_2024.pdf (accessed on 27 January 2025).
- Badwawi, R.A.; Abusara, M.; Mallick, T. A review of hybrid solar PV and wind energy system. Smart Sci. 2015, 3, 127–138. [Google Scholar] [CrossRef]
- Kumari, N.; Tran, B.; Sharma, A.; Alahakoon, D. A Comprehensive Review on Stability Analysis of Hybrid Energy System. Sensors 2025, 25, 2974. [Google Scholar] [CrossRef]
- Khosravi, N.; Çelik, D.; Bevrani, H.; Echalih, S. Microgrid stability: A comprehensive review of challenges, trends, and emerging solutions. Int. J. Electr. Power Energy Syst. 2025, 170, 110829. [Google Scholar] [CrossRef]
- Khan, A.; Bressel, M.; Davigny, A.; Abbes, D.; Ould Bouamama, B. Comprehensive Review of Hybrid Energy Systems: Challenges, Applications, and Optimization Strategies. Energies 2025, 18, 2612. [Google Scholar] [CrossRef]
- Pourbehzadi, M.; Niknam, T.; Aghaei, J.; Mokryani, G.; Shafie-khah, M.; Catalão, J.P. Optimal operation of hybrid AC/DC microgrids under uncertainty of renewable energy resources: A comprehensive review. Int. J. Electr. Power Energy Syst. 2019, 109, 139–159. [Google Scholar] [CrossRef]
- Liang, Z.; Chung, C.; Wang, Q.; Chen, H.; Yang, H.; Wu, C. Fortifying Renewable-Dominant Hybrid Microgrids: A Bi-Directional Converter Based Interconnection Planning Approach. Engineering 2025, 51, 130–143. [Google Scholar] [CrossRef]
- Anvari, S.; Medina, A.; Merchán, R.P.; Hernández, A.C. Sustainable solar/biomass/energy storage hybridization for enhanced renewable energy integration in multi-generation systems: A comprehensive review. Renew. Sustain. Energy Rev. 2025, 223, 115997. [Google Scholar] [CrossRef]
- Nwagu, C.N.; Ujah, C.O.; Kallon, D.V.; Aigbodion, V.S. Integrating solar and wind energy into the electricity grid for improved power accessibility. Unconv. Resour. 2025, 5, 100129. [Google Scholar] [CrossRef]
- Ammari, C.; Belatrache, D.; Touhami, B.; Makhloufi, S. Sizing, optimization, control and energy management of hybrid renewable energy system—A review. Energy Built Environ. 2022, 3, 399–411. [Google Scholar] [CrossRef]
- Bindu, A.A.; Thampatty, K.C.S. Optimal design and techno-socio-economic analysis of grid-connected hybrid renewable system. IEEE Access 2024, 12, 3208–3221. [Google Scholar] [CrossRef]
- Rehman, S. Hybrid power systems—Sizes, efficiencies, and economics. Energy Explor. Exploit. 2021, 39, 3–43. [Google Scholar] [CrossRef]
- Zhang, S.; Yang, W.; Li, X.; Zhao, Z.; Wang, R.; Li, Y. Economic evaluation of Wind–PV–Pumped storage hybrid system considering carbon emissions. Energy Rep. 2022, 8, 1249–1258. [Google Scholar] [CrossRef]
- Pamuk, N. Techno-economic feasibility analysis of grid configuration sizing for hybrid renewable energy system in Turkey using different optimization techniques. Ain Shams Eng. J. 2024, 15, 102474. [Google Scholar] [CrossRef]
- Mojumder, M.F.H.; Islam, T.; Chowdhury, P.; Hasan, M.; Takia, N.A.; Chowdhury, N.U.R.; Farrok, O. Techno-economic and environmental analysis of hybrid energy systems for remote areas: A sustainable case study in Bangladesh. Energy Convers. Manag. X 2024, 23, 100664. [Google Scholar] [CrossRef]
- Liu, G.; Zeng, J.; Wu, Y.; Liao, S. Multi-criteria techno-economic analysis of solar photovoltaic/wind hybrid power systems under temperate continental climate. IET Renew. Power Gener. 2022, 16, 3058–3070. [Google Scholar] [CrossRef]
- Das, B.K.; Alotaibi, M.A.; Das, P.; Islam, M.; Das, S.K.; Hossain, M.A. Feasibility and techno-economic analysis of stand-alone and grid-connected PV/Wind/Diesel/Batt hybrid energy system: A case study. Energy Strategy Rev. 2021, 37, 100673. [Google Scholar] [CrossRef]
- Borba, A.T.A.; Simons, L.J.M.; de Melo, T.R.; Santos, A.A.B. Techno-Economic Assessment of a Hybrid Renewable Energy System for a County in the State of Bahia. Energies 2024, 17, 572. [Google Scholar] [CrossRef]
- Hoarcă, I.C.; Bizon, N.; Şorlei, I.S.; Thounthong, P. Sizing Design for a Hybrid Renewable Power System Using HOMER and iHOGA Simulators. Energies 2023, 16, 1926. [Google Scholar] [CrossRef]
- Munoz-Pincheira, J.L.; Salazar, L.; Sanhueza, F.; LÜER-Villagra, A. Optimizing the design of stand-alone hybrid renewable energy systems with storage using genetic algorithms: Analysis of the impact of temporal complementarity of wind and solar sources. Energy Convers. Manag. 2025, 341, 120016. [Google Scholar] [CrossRef]
- Leon, J.P.M.; Habbou, H.; Friis-MØller, M.; Gupta, M.; Zhu, R.; Das, K. HyDesign: A tool for sizing optimization of grid-connected hybrid power plants including wind, solar photovoltaic, and lithium-ion batteries. Wind. Energy Sci. 2024, 9, 759–776. [Google Scholar] [CrossRef]
- Das, K.; Murcia Leon, J.P.; Habbou, H.; Assaad, C.; Pérez-Rúa, J.A.; Zhu, R.; Sørensen, P.E. Hydesign: A tool for design and operation of renewable hybrid renewable plants. In Proceedings of the 21st Wind & Solar Integration Workshop (WIW 2022), The Hague, The Netherlands, 12–14 October 2022; Volume 2022, pp. 85–91. [Google Scholar] [CrossRef]
- Essa, M.E.S.M.; Hassan, A.A.; El-Kholy, E.E.; Ahmed, M.M.R. Innovations and advancements in solar tracker systems: A comprehensive review. J. Mechatronics Electr. Power Veh. Technol. 2025, 16, 1–14. [Google Scholar] [CrossRef]
- Kumba, K.; Upender, P.; Buduma, P.; Sarkar, M.; Simon, S.P.; Gundu, V. Solar tracking systems: Advancements, challenges, and future directions: A review. Energy Rep. 2024, 12, 3566–3583. [Google Scholar] [CrossRef]
- Bennagi, A.; AlHousrya, O.; Cotfas, D.T.; Cotfas, P.A. Comprehensive study of the artificial intelligence applied in renewable energy. Energy Strategy Rev. 2024, 54, 101446. [Google Scholar] [CrossRef]
- Bade, S.O.; Meenakshisundaram, A.; Tomomewo, O.S. Current Status, Sizing Methodologies, Optimization Techniques, and Energy Management and Control Strategies for Co-Located Utility-Scale Wind–Solar-Based Hybrid Power Plants: A Review. Eng 2024, 5, 677–719. [Google Scholar] [CrossRef]
- Thirunavukkarasu, M.; Sawle, Y.; Lala, H. A comprehensive review on optimization of hybrid renewable energy systems using various optimization techniques. Renew. Sustain. Energy Rev. 2023, 176, 113192. [Google Scholar] [CrossRef]
- Bamisile, O.; Cai, D.; Adun, H.; Dagbasi, M.; Ukwuoma, C.C.; Huang, Q.; Johnson, N.; Bamisile, O. Towards renewables development: Review of optimization techniques for energy storage and hybrid renewable energy systems. Heliyon 2024, 10, e37482. [Google Scholar] [CrossRef] [PubMed]
- Hassan, Q.; Algburi, S.; Sameen, A.Z.; Salman, H.M.; Jaszczur, M. A review of hybrid renewable energy systems: Solar and wind-powered solutions: Challenges, opportunities, and policy implications. Results Eng. 2023, 20, 101621. [Google Scholar] [CrossRef]
- Ukoba, K.; Olatunji, K.O.; Adeoye, E.; Jen, T.C.; Madyira, D.M. Optimizing renewable energy systems through artificial intelligence: Review and future prospects. Energy Environ. 2024, 35, 3833–3879. [Google Scholar] [CrossRef]
- Amarante, O.C.C.d.; Brower, M.; Zack, J. Atlas do Potencial Eólico Brasileiro; MME/ELETROBRÁS/CEPEL: Rio de Janeiro, Brazil, 2001. [Google Scholar]
- Perini de Souza, N.B.; Cardoso dos Santos, J.V.; Sperandio Nascimento, E.G.; Bandeira Santos, A.A.; Moreira, D.M. Long-range correlations of the wind speed in a northeast region of Brazil. Energy 2022, 243, 122742. [Google Scholar] [CrossRef]
- Martins, F.R.; Pereira, E.B.; Abreu, S.L.d.; Colle, S. Brazilian Atlas for Solar Energy Resource: SWERA Results. In Proceedings of the ISES World Congress 2007, Beijing, China, 18–21 September 2007; Springer: Berlin/Heidelberg, Germany, 2008; Volume I–V, pp. 2651–2655. [Google Scholar] [CrossRef]
- Jean, W.; Brasil Junior, A.C. Solar model for Rural Communities: Analysis of Impact of a Grid-Connected Photovoltaic System in the Brazilian semi-arid region. J. Sustain. Dev. Energy Water Environ. Syst. 2022, 10, 1–14. [Google Scholar] [CrossRef]
- EUMETSAT. Surface Radiation Data Set-Heliosat (SARAH)—Edition 3. 2025. Available online: https://navigator.eumetsat.int/product/EO:EUM:DAT:0863 (accessed on 2 July 2025).
- European Commission, J.R.C. PVGIS: Photovoltaic Geographical Information System. 2025. Available online: https://re.jrc.ec.europa.eu/pvg_tools/en/ (accessed on 6 June 2025).
- Wilcox, S.; Marion, W. Users Manual for TMY3 Data Sets; Technical Report NREL/TP-581-43156; National Renewable Energy Laboratory: Golden, CO, USA, 2008. [Google Scholar]
- ASHRAE Technical Committee 4.2. What Are Weather Years for Energy Simulations and How Do They Differ from Other Types of Weather or Climate Data? 2025. Available online: https://tpc.ashrae.org/CustomPages?idx=3130fbc3-c1f6-4970-81af-66dc14346912 (accessed on 21 August 2025).
- Kim, S.; Zirkelbach, D.; Künzel, H.M.; Lee, J.H.; Choi, J. Development of test reference year using ISO 15927-4 and the influence of climatic parameters on building energy performance. Build. Environ. 2017, 114, 374–386. [Google Scholar] [CrossRef]
- Bauelos-Ruedas, F.; Angeles-Camacho, C.; Rios-Marcuello, S. Methodologies used in the extrapolation of wind speed data at different heights and its impact in the wind energy resource assessment in a region. In Wind Farm—Technical Regulations, Potential Estimation and Siting Assessment; InTech: Rijeka, Croatia, 2011. [Google Scholar]
- Jeong, S.; Obayashi, S. Efficient global optimization (EGO) for multi-objective problems and data mining. In Proceedings of the 2005 IEEE Congress on Evolutionary Computation, Scotland, UK, 2–5 September 2005; Volume 3, pp. 2138–2145. [Google Scholar] [CrossRef]
- Chung, S.Y.; Venkatramanan, S.; Elzaine, H.E.; Selvam, S.; Prasanna, M.V. Chapter 4—Supplement of Missing Data in Groundwater-Level Variations of Peak Type Using Geostatistical Methods. In GIS and Geostatistical Techniques for Groundwater Science; Venkatramanan, S., Prasanna, M.V., Chung, S.Y., Eds.; Elsevier: Amsterdam, The Netherlands, 2019; pp. 33–41. [Google Scholar] [CrossRef]
- Zhu, R. Optimal Energy Management of Hybrid Power Plants in Electricity Markets. Ph.D. Thesis, Technical University of Denmark, Kongens Lyngby, Denmark, 2023. [Google Scholar] [CrossRef]
- Saves, P.; Hallé-Hannan, E.; Bussemaker, J.; Diouane, Y.; Bartoli, N. Hierarchical Modeling and Architecture Optimization: Review and Unified Framework. arXiv 2025, arXiv:2506.22621. [Google Scholar] [CrossRef]
- Canadian Solar Inc. Canadian Solar CS5P-220M Photovoltaic Module Specifications. PVFree CEC Module Database. 2009. Available online: https://pvfree.azurewebsites.net/cec_modules/1733/ (accessed on 1 September 2025).
- Everitt, B.; Skrondal, A. The Cambridge Dictionary of Statistics, 4th ed.; Cambridge University Press: Cambridge, UK, 2010. [Google Scholar]
- Banco Central do Brasil. Conversor de Moedas. 2025. Available online: https://www.bcb.gov.br/conversao (accessed on 2 July 2025).
- Empresa de Pesquisa Energética (EPE). Caderno de Preços de Geração; Technical Report; EPE: Rio de Janeiro, Brazil, 2021. Available online: https://www.epe.gov.br/sites-pt/publicacoes-dados-abertos/publicacoes/PublishingImages/pt/publicacoes-dados-abertos/publicacoes/caderno-de-precos-da-geracao/CadernodePre%C3%A7osdeGera%C3%A7%C3%A3o_r0.pdf (accessed on 27 March 2025).
- Feldman, D.; Ramasamy, V.; Fu, R.; Ramdas, A.; Desai, J.; Margolis, R. U.S. Solar Photovoltaic System and Energy Storage Cost Benchmark: Q1 2020; Technical Report; U.S. Department of Energy: Golden, CO, USA, 2024. [Google Scholar]
- Feldman, D.; Ramasamy, V.; Fu, R.; Ramdas, A.; Desai, J.; Margolis, R. U.S. Solar Photovoltaic System and Energy Storage Cost Benchmark: Q1 2020; Technical Report NREL/TP-6A20-77324; National Renewable Energy Laboratory (NREL): Golden, CO, USA, 2021; Contract No. DE-AC36-08GO28308. [Google Scholar]
- Attia, A.M.; Al Hanbali, A.; Saleh, H.H.; Alsawafy, O.G.; Ghaithan, A.M.; Mohammed, A. A multi-objective optimization model for sizing decisions of a grid-connected photovoltaic system. Energy 2021, 229, 120730. [Google Scholar] [CrossRef]
- TRADING ECONOMICS. Brazil Corporate Tax Rate. 2025. Available online: https://pt.tradingeconomics.com/brazil/corporate-tax-rate (accessed on 27 January 2025).
- MME. Caderno de Custos: Geração e Transmissão—PDE 2034; Technical Report; Ministério de Minas e Energia: Brasília, Brazil, 2025. Available online: https://www.gov.br/mme/pt-br/assuntos/secretarias/sntep/publicacoes/plano-decenal-de-expansao-de-energia/pde-2034/cadernos/caderno-de-custos-geracao-e-transmissao_pde2034-1.pdf/view (accessed on 27 January 2025).
- Silinto, B.F.; van der Laag Yamu, C.; Zuidema, C.; Faaij, A.P. Hybrid renewable energy systems for rural electrification in developing countries: A review on energy system models and spatial explicit modelling tools. Renew. Sustain. Energy Rev. 2025, 207, 114916. [Google Scholar] [CrossRef]
Disclaimer/Publisher’s Note: The statements, opinions and data contained in all publications are solely those of the individual author(s) and contributor(s) and not of MDPI and/or the editor(s). MDPI and/or the editor(s) disclaim responsibility for any injury to people or property resulting from any ideas, methods, instructions or products referred to in the content. |
© 2025 by the authors. Licensee MDPI, Basel, Switzerland. This article is an open access article distributed under the terms and conditions of the Creative Commons Attribution (CC BY) license (https://creativecommons.org/licenses/by/4.0/).