Abstract
Insulation degradation in photovoltaic (PV) cables can cause electrical faults and fire hazards, thereby compromising system reliability and safety. Early detection of precursor signals is crucial for preventive maintenance. However, conventional diagnostic techniques are limited to static assessments and fail to capture early-stage electrical anomalies in real-time. This study investigates the time-series behavior of voltage, current, and temperature in PV cables under thermal stress conditions. Experiments were conducted using TFR-CV cables installed in a vertically stacked and tight-contact configuration. A gas torch was applied for localized heating to induce insulation degradation. A grid-connected testbed with six series-connected PV modules was constructed. Each module was instrumented with PV-M sensors, temperature sensors, and an infrared camera. Data were acquired at 1 Hz intervals. Results showed that cable surface temperature exceeded 280 °C during degradation. The output voltage exhibited transient surges of up to +13.3% and drops of −68%, while the output current decreased by over 20%, particularly in the PV-M3 module. These anomalies, such as thermal imbalance, voltage spikes/dips, and current drops, were closely associated with critical degradation points and are interpreted as precursor signals. This work confirms the feasibility of identifying fire-related precursors through real-time monitoring of PV cable electrical characteristics. The observed correlation between electrical responses and thermal expansion behaviors suggests a strong link to the stages of insulation degradation. Future work will focus on quantifying the relationship between degradation and electrical behavior under controlled environmental conditions.
1. Introduction
1.1. Research Background and Rationale
The accelerated global deployment of renewable energy systems, particularly photovoltaic (PV) generation, has led to a substantial increase in the utilization of direct current (DC)-based distribution networks and energy storage systems (ESS) [1,2,3,4]. This expansion inherently elevates the operational dependence on PV cables, thereby underscoring their reliability and fire safety as critical factors for stable grid integration. Accordingly, elucidating the mechanisms of insulation degradation and identifying its electrical precursors constitutes an essential prerequisite for advancing preventive maintenance and enhancing system resilience. The adoption of applications utilizing direct current power sources such as PV, energy storage systems (ESS), and DC distribution networks is increasing steadily [5,6]. With the continued expansion of the deployment of distributed energy resources, ensuring efficient power flow management and maintaining system stability have emerged as key priorities. Consequently, the necessity of establishing a fully integrated power grid is becoming increasingly evident [7,8,9]. The stable operation of an integrated power grid requires the implementation of various technical measures including power quality management, power flow control, generation and demand supply planning, and protection and grid interconnection technologies, as well as data management and operational control systems [10,11]. Ensuring the reliability and safety of PV systems (which function as a fundamental component of distributed energy resources) is critical for effectively operating these grid functions [12]. In particular, PV cables are exposed to various thermal and environmental stressors that accelerate the insulation degradation. This, in turn, increases the risk of reduced system performance, electrical malfunctions, and fire hazards [13,14,15]. Electrical fires originating in DC systems have been reported. These cannot be explained adequately by conventional insulation degradation diagnostic methods and fault detection technologies developed primarily for alternating current (AC) systems [16]. According to data from the National Fire Information System of the National Fire Agency spanning the past five years (2020–2025), electrical fires constituted a significant proportion of the total 49,787 fire incidents reported. Specifically, insulation deterioration causing short circuits was identified as the primary cause. It accounted for 9668 cases, i.e., 19.42% of the total. It ranked second only to unidentified short circuits (31.58%). Moreover, many other causes of short circuits, such as tracking (13.04%) and mechanical damage or crushing (4.2%), are similarly linked strongly to the deterioration of insulation integrity. Furthermore, of the 85,643 fire incidents involving operating equipment, electric arcs (short circuits) represented the leading cause. These comprised 54.15% of the cases. This highlights insulation deterioration as a direct factor contributing to the ignition of electrical fires [17]. The thermal deterioration of cable insulation leads to various electrical anomalies, including abrupt increases in leakage current, nonlinear variations in impedance, and reduced arc formation thresholds. These are evidenced by the irregularities in voltage and current signal characteristics [18,19,20]. These signals are captured predominantly through continuous voltage and current monitoring and are widely acknowledged as precursors or early indicators of impending fire risks [21,22].
The majority of existing diagnostic methods for electrical equipment emphasize parameters such as partial discharge (PD), insulation resistance (IR), dielectric dissipation factor (tan δ), and cumulative leakage current. These approaches are primarily static in character, providing assessments under conditions where variables are fixed at a specific point in time, and are typically employed for evaluating the aging condition of high-voltage equipment [23]. In contrast, actual fire incidents occur within a considerably shorter duration and are precipitated by the accelerated deterioration of insulation integrity resulting from thermal stress [24]. Owing to the recent expansion of electrical installation capacity, cable trays are increasingly being constructed in laminated vertical and horizontal configurations [25]. When the electrical equipment above is situated in an environment with limited heat dissipation, heat tends to accumulate within the cable insulation [26,27]. This scenario increases the risk of insulation degradation, electrical failures, and potential fire ignition [25]. In these environments, insulation deterioration causes an increase in leakage current and a decrease in impedance and, thereby, the generation of abnormal electrical signals accompanied by distortion of various harmonics [28]. Thus, it is feasible to prevent electrical fire incidents by anticipating and addressing these variations proactively [29]. However, experimental data to enable a quantitative analysis of the temporal variations in these precursor signals are insufficient [30]. This limitation hinders the development of effective warning systems capable of early detection or prediction of fire hazards.
A clear mechanistic explanation is that cable degradation is primarily driven by thermal stress and further accelerated by external and structural factors such as insufficient heat dissipation in cable trays, sheath damage, load fluctuations, and material aging. These mechanisms intensify insulation deterioration, leading to abnormal electrical signals and an increased risk of fire.
1.2. Research Trends
Studies worldwide on insulation degradation have focused predominantly on examining the thermal deterioration properties of thermosetting polymer insulators such as PVC, XLPE, and EPR [31]. With the progression of insulation degradation, studies have reported a deterioration of dielectric properties attributed to decreased volume resistivity [32,33], alterations in electric capacitance, and the dissociation of polar groups. Furthermore, a few studies experimentally investigated the corresponding variations in leakage current and impedance [34]. In particular, to determine the root cause of electrical fires, ongoing research focuses on analyzing the timing and waveform variations in the initial fault current. It considers the arc initiation moment and its associated characteristics as key diagnostic indicators [35]. However, the majority of existing studies have primarily examined the static properties observed before and after the occurrence of degradation [36,37]. The body of research focused on analyzing the gradual evolution of subtle electrical signals during the initial phases of insulation degradation is still insufficient [38]. Comprehensive research data are necessary to understand the precursor signals of insulation deterioration in relation to diverse factors such as the actual system load variations, cable characteristics (including core count and insulation type), outer sheath damage, environmental temperature, and installation settings [39,40,41,42]. Furthermore, it is crucial to obtain dynamic research observations that involve real-time measurement and analysis of the time-series characteristics of voltage and current. This would enable a quantitative understanding of the progression of insulation degradation.
1.3. Research Purpose and Scope
Among the multiple environmental factors affecting the analysis of precursor signals for cable insulation degradation, this research specifically aims to investigate the alterations in electrical properties caused by thermal stress. For this purpose, this study conducts time-series measurements and analyses of voltage, current, and temperature variations over time under controlled conditions that subject the cable insulation to thermal stress. Specifically, this study identifies the critical point at which electrical properties undergo rapid variations during the progression of insulation degradation and characterizes the electrical signatures associated with the onset of the deterioration.
2. Experimental Design
This study conducted experiments using total flame retardant–cross-linked vinyl (TFR-CV) series cables. These are commonly employed in solar power installations. Additionally, under conditions promoting heat accumulation, real-time measurements were obtained to capture the dynamic variations in voltage, current, and temperature as the insulation material underwent degradation. The purpose of this study was to identify early indications forewarning potential fire hazards by examining the electrical precursor characteristics associated with insulation degradation, both prior to and following the occurrence of a short-circuit incident.
2.1. Setup
The experiment was set up to investigate the variations in electrical characteristics caused by insulation degradation in solar cables. Table 1 shows the specifications of the photovoltaic module. It utilized a test bed configured with the key components illustrated in Figure 1. The experimental setup consisted of a TFR-CV cable and six photovoltaic modules having an open-circuit voltage of approximately 53 V each. Additional components included a mounting structure for vertical cable installation, DC circuit breaker and gG-type fuse (a general-purpose fuse for cable and line protection in accordance with IEC 60269 [43]) for overcurrent protection, PV-M instrumentation module for real-time data acquisition, torch to induce insulation degradation, thermal imaging camera for temperature monitoring, and contact temperature sensor. To accurately replicate actual field conditions, the experimental setup employed a vertical stacking arrangement for the installation of the solar TFR-CV cable. The arrangement was similar to typical configurations used in practice. Accordingly, the cables were arranged with zero spacing between these. Each cable consists of a stranded conductor, in conjunction with both inner and outer insulation layers. The cable is composed of seven copper conductor strands with a total diameter of 1 mm. It features outer and inner insulation layers with thicknesses of approximately 1 mm and 0.5 mm, respectively. Thus, the distance between the conductors of the two cables is estimated to be approximately 3 mm. Additional components such as cable ties and insulating supports were used to limit the cable movement during the experiment. This improved safety and the data reliability.

Table 1.
Specifications of the Q.PEAK DUO XL-G9.3 KC1 460 module under STC conditions.
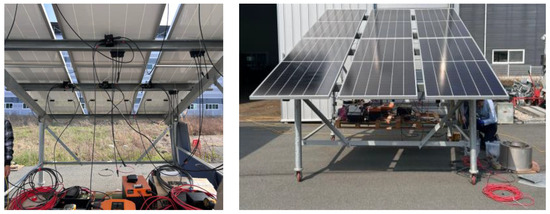
Figure 1.
Experimental test bed configuration.
2.2. Circuit Diagram
Figure 2 illustrates the experimental circuit setup. PV modules are linked in series. Meanwhile, the PV-M unit is connected in both series and parallel configurations across each module to facilitate real-time monitoring of voltage, current, and temperature. The positive (+) and negative (−) terminals of the circuit are connected to the inverter’s input ports. A fire simulation area was created between the PV modules and inverter. Herein, circuit breakers were placed at the zone’s input and output points to protect the system components. To more accurately validate electrical anomaly signals and fire precursor characteristics caused by insulation degradation in solar cables, this experiment was conducted using a test bed modeled on a grid-connected PV system. The approach was aimed at simulating a scenario that is more severe and adverse than typical pre-fire conditions. This was achieved by replicating an energy supply environment similar to that of a real system, where disconnecting power is more challenging than in standard load circuits. An important characteristic of these test beds is their capability to continuously apply DC voltage. This enables prolonged maintenance of electrical arcs. Therefore, to mitigate the risk of unintended incidents outside the experimental focus, circuit breakers and fuses were placed at both ends of the segment subjected to thermal stress.
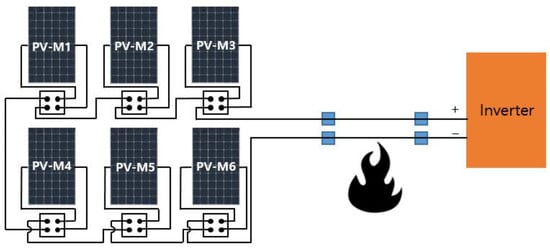
Figure 2.
Experimental circuit diagram.
2.3. Method and Progress
In this study, the TFR-CV cable was fastened with a cable tie and exposed locally to sustained heating using a portable gas torch to induce thermal stress and accelerate insulation deterioration. This method was designed to replicate the thermal deterioration that may develop in high-temperature external environments or confined spaces with limited ventilation. In this experiment, the required data were collected through two primary means. The first pertains to temperature measurements. A thermal imaging camera was positioned to capture the real-time temperature fluctuations at the heating location. It was complemented by a temperature sensor that recorded the temperature of the cable under localized thermal stress. The second category of data collected consisted of electrical parameters (voltage and current). The PV-M measurement module was utilized to record the voltage and current for each PV module. The PV-M is a compact electronic measurement device rated at approximately 5 V and 200–300 mA. It enables the monitoring of the electrical flow in individual PV modules without interfering with their normal operation.
Circuit breakers and fuses were installed to safeguard the inverter and modules. This ensured safety throughout the experiment. The circuit breaker was rated for DC with a voltage of approximately 690 V, current rating of approximately 10 A, and breaking capacity of approximately 10 kA. The fuse used was a gG-type (general protection) with dimensions of 10.3 × 38 mm.
Figure 3 categorizes the cable’s heat accumulation process into six distinct steps. Step 1 represents the steady state in which no external heat source is applied to the cable. During this step, the cable surface maintains a standard temperature, and the PV modules produce typical voltage and current levels. Step 2 represents the initial phase of heat application to the cable. The first indications of insulation variations begin to appear in this phase. Step 3 represents the early phase of heat accumulation. The outer insulation layer begins to degrade during this phase, thereby exposing the inner insulation layer, making it visible to the naked eye. Step 4 represents the mid-phase of heat accumulation. It is characterized by the degradation of the inner insulation layer, which results in a visible exposure of the bare conductor. Step 5 signifies the advanced phase of heat accumulation. Both outer and inner insulation layers deteriorate in this phase, and thermal expansion of the exposed conductor is observed. Step 6 represents the full combustion phase. Herein, the insulation is consumed entirely by fire. No further variations occur following the thermal expansion of the exposed conductor.
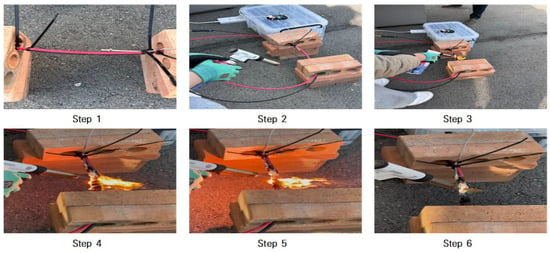
Figure 3.
Thermal accumulation stages of cable.
3. Experimental Results and Analysis
The experiment involved continuous monitoring and collection of data throughout the pre-experiment, active, and post-experiment periods. The results of the experiment are displayed using time steps to aid the comprehension of the data shown in the graphs. According to the experimental timeline, the experiment commenced at Time Step 60,765 (corresponding to 16:47:59) and concluded at Time Step 63,504 (corresponding to 16:58:29). Thus, the total duration of the experiment from start to finish was determined to be 10 min and 30 s. In this study, voltage, current, and temperature data from PV modules and cables were collected via communication at a frequency of 1 Hz. This is described in Equations (1) and (2).
To clearly illustrate the general trend of the acquired data and support the analysis process, the B-Spline interpolation technique was utilized. This is indicated in Equation (3).
denotes the signal obtained through interpolation, represents the control point coefficient used in the interpolation process, and corresponds to the pth-order B-Spline basis function. is one less than the total number of control points. The interpolation parameter was determined based on the condition specified in Equation (4).
Table 2 summarizes the time step and elapsed time under steady and abnormal conditions.

Table 2.
Time step and elapsed time under steady and abnormal conditions.
3.1. Temperature Variation Data of PV Module
Figure 4 displays the temperature graph recorded by a temperature sensor attached to the six PV modules.
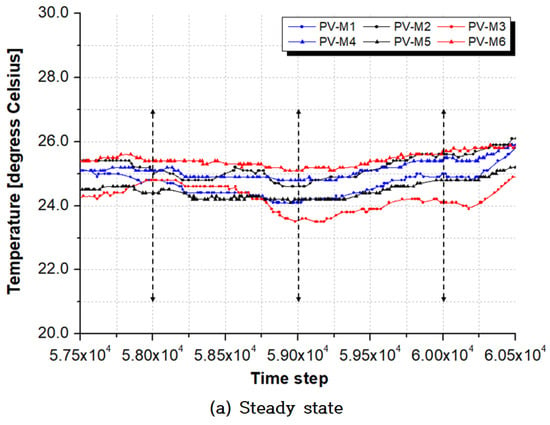
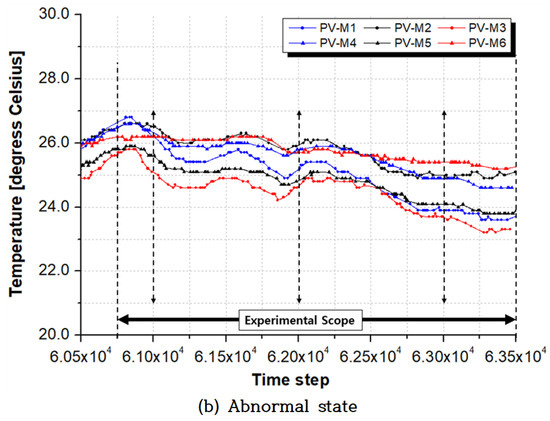
Figure 4.
Temperature variations in PV modules under normal and abnormal operating conditions (PV-M1~PV-M6).
Figure 4a presents the voltage and current graph under steady-state conditions. The temperature of each PV module was observed to remain consistently within the range of 24–25 °C for 10 min and 43 s. The reference point data corresponding to Figure 4a are presented in Table 3. The temperature was analyzed across three distinct sections. The reference time step values were set at 58,000, 59,000, and 60,000 for the three sections.

Table 3.
Temperature variation data per PV module (Steady state).
Figure 4b shows the voltage and current graph under abnormal conditions. It reflects the state of thermal stress accumulation induced by the thermal loading experiment on the TFR-CV cable. The temperatures of all the PV modules were observed to reduce steadily over time. The reference point data corresponding to Figure 4b are presented in Table 4. The reference time step values were set at 61,000, 62,000, and 63,000 for the three sections.

Table 4.
Temperature variation data per PV module (Abnormal state).
3.2. Temperature Variation Data of PV TFR-CV Cable
Figure 5 displays the thermal response curve of the cable (TRCC). It was recorded by a temperature sensor placed adjacent to the region where a localized thermal stress was introduced to the solar TFR-CV cable.
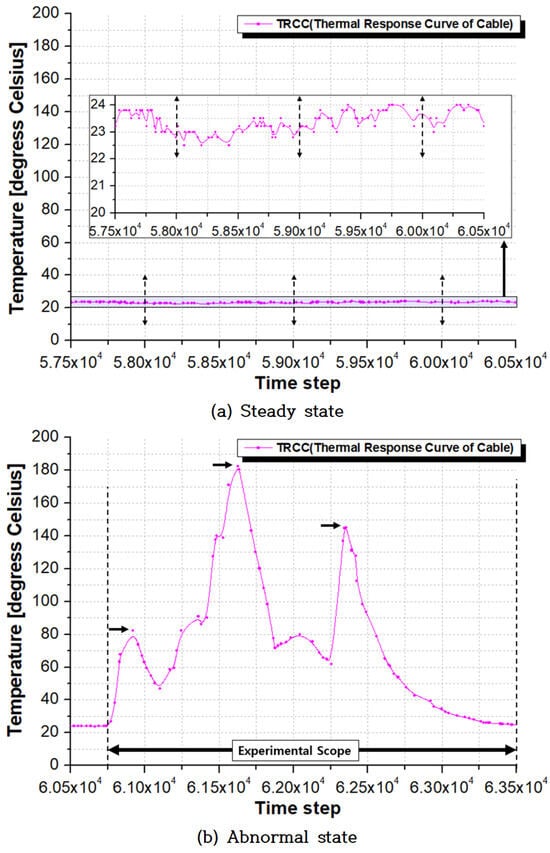
Figure 5.
Temperature evolution of the HAA during transition from normal to abnormal operating conditions.
Figure 5a presents the temperature graph under steady-state conditions. The reference point data corresponding to Figure 5a are presented in Table 5. The temperature was analyzed across three sections. The reference values for each section correspond to those used in the temperature graph of the PV module. The reference point data corresponding to Figure 5b are presented in Table 6. HAA (Heat accumulation area) refers to the heat accumulation area.

Table 5.
Temperature variation data of the TFR-CV cable positioned adjacent to the heat accumulation area (Steady state).

Table 6.
Temperature variation data of the TFR-CV cable positioned adjacent to the heat accumulation area (Abnormal state).
Figure 5b presents the temperature graph under abnormal conditions. The heat accumulation began at time step 60,765 (corresponding to 16:47:59). Subsequently, the temperature at the HAA attained peak values on three occasions. The data for each peak is summarized in Table 6. The occurrence of multiple maximum cable temperatures is attributed to the effects of the natural wind present during the outdoor experiment.
Figure 6 shows the data obtained from both thermal imaging camera and temperature sensor positioned at the point of ignition. The experimental observations captured by the thermal imaging camera enabled the visual observation of the heat distribution at areas of localized thermal accumulation. The flame temperature generated by the gas torch is estimated to have been above 100 °C. The cable’s accumulated temperature is considered to have exceeded 280 °C.
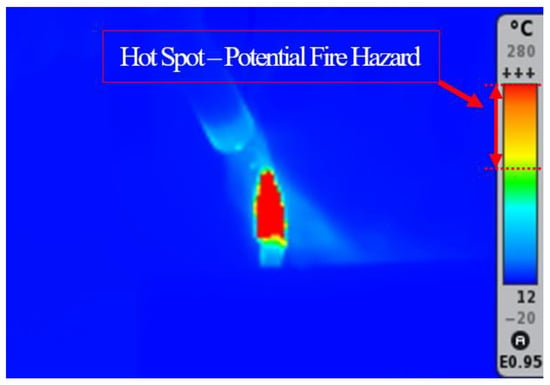
Figure 6.
Thermal distribution data obtained from the thermal imaging camera.
3.3. Voltage and Current Characteristics of PV Module Cables
Figure 7 presents a graph illustrating the voltage data from modules PV-M1–PV-M6. Figure 7a presents the graph under steady-state conditions. The solar power system was test-connected to the grid through the inverter at Time Step 59,040 (corresponding to 16:41:40). The test connection was completed at Time Step 59,670 (corresponding to 16:43:54). During the initial test run (which lasted approximately 2 min and 14 s), voltage fluctuations were observed. However, the system attained a peak output voltage of approximately 45 V. Figure 7a illustrates that the PV module’s open-circuit voltage is approximately 53 V. The peak output voltage is observed at approximately 80% of the open-circuit voltage, as expressed in Equation (5). The experiment demonstrated that the maximum output voltage attained was approximately 45 V. This equates to approximately 85% of the open-circuit voltage.
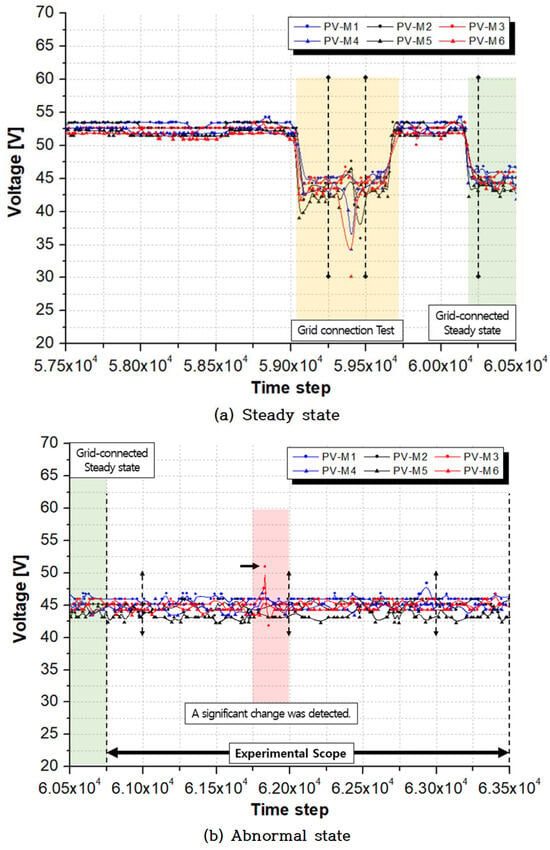
Figure 7.
Voltage characteristics of PV modules under normal and abnormal operating conditions (PV-M1~PV-M6).
In the experiment, the solar power plant was linked to the grid at 16:45:49 (time step 60,160). This generated an output voltage of approximately 45 V, which aligned with the results observed during the initial test run. To evaluate the output voltage patterns under steady state conditions, the three selected sections were analyzed. The data are summarized in Table 7. Figure 7b presents the graph under abnormal-state conditions. The heat accumulation experiment proceeded as outlined in Table 2. Voltage data were collected from the three selected sections throughout the test. The reference time steps for the sections are 61,000, 62,000, and 63,000. The corresponding data are compiled in Table 8. In addition to the reference values, a voltage surge was detected in the PV-M3 module. Consequently, the segment depicted in Figure 7b was magnified. The voltage data spanning Time Steps 61,750–61,950 are displayed and examined in Figure 8. Table 9 and Table 10 summarize the data exhibiting increases and reductions, respectively, compared with the baseline output voltage of approximately 45 V.

Table 7.
Voltage variation data per PV module (Steady state).

Table 8.
Voltage variation data per PV module (Abnormal state).
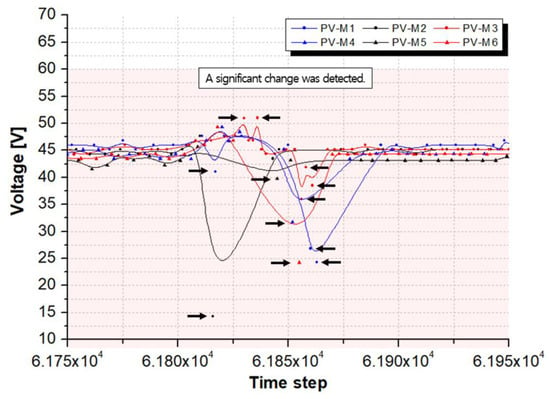
Figure 8.
Significant voltage change detected in PV modules during abnormal operation.

Table 9.
Output voltage increase point and rate per PV module (reference value: 45 V).

Table 10.
Output voltage reduction point and rate per PV module (reference value: 45 V).
Figure 9 presents a graph illustrating the current data from modules PV-M1–PV-M6. Figure 9a presents the graph under steady-state conditions. The start and end times of the grid connection via the solar power plant’s inverter correspond to those detailed earlier in the explanation of the voltage graph. The initial test operation followed the procedure outlined in the voltage graph analysis. It yielded an output current of approximately 4.5 A. In this experiment, the output current was observed to range between 4.5 and 5.0 A.
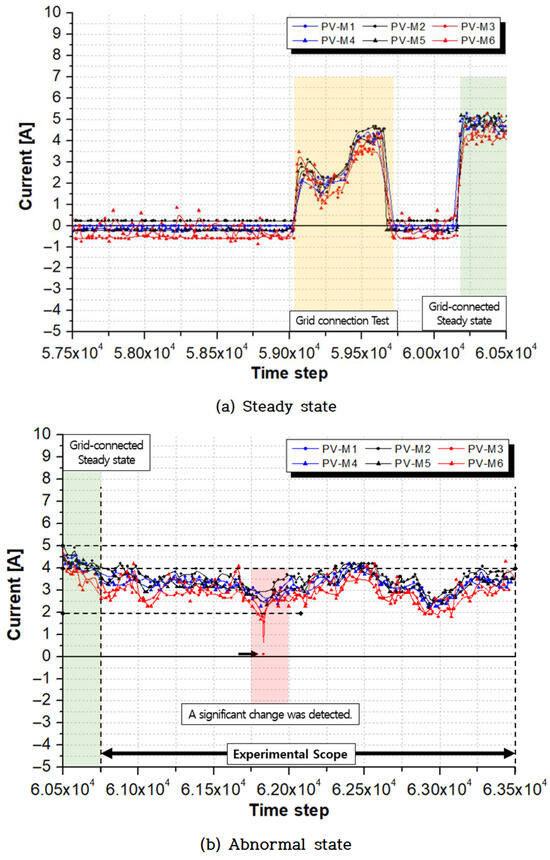
Figure 9.
Current characteristics of PV modules under normal and abnormal operating conditions (PV-M1~PV-M6).
Figure 9b presents the graph under abnormal-state conditions. The heat accumulation experiment was conducted as detailed in Table 2. It revealed that the output current decreased from 4.5 to 5.0 A to approximately 2.5–3.5 A. Significantly, the current value of PV-M3 reduced significantly within the time step range of 61,750–61,950. Therefore, the segment depicted in Figure 9b was magnified. The voltage data spanning Time Steps 61,750–61,950 are displayed and examined in Figure 10. Table 11 summarizes the data showing a significant decrease in output current within the range of 2.5–3.5 A. Only data points with a reduction rate exceeding approximately 20% were selected and compiled.
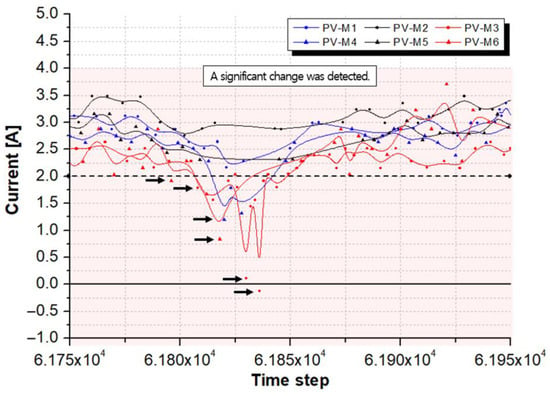
Figure 10.
Significant current change detected in PV modules during abnormal operation.

Table 11.
Output current reduction point and rate per PV module (reference value: 2.5 A).
4. Review
This study involved the real-time collection of voltage, current, and temperature data via communication devices to investigate how thermal stress influences the electrical behavior of PV cables. Using the collected data, precursor signals within abnormal condition segments that may indicate potential fire risks were identified and analyzed. The criteria for identifying fire warning indications were developed based on these observations. The specifics are summarized below.
The first is that the heat accumulation observed in the solar cables exhibited no significant correlation with the temperature variations in the PV modules. In this study, data were presented according to the reference values utilized in the graphs. To ensure the reliability of the data, it is necessary to consider all values corresponding to the steady-state sections comprehensively. The average values calculated from all data collected during the steady-state sections of each PV module are shown below.
[Avg. Voltage (Steady state)]:
PV-M1 = about 24.66 [V], PV-M2 = about 25.21 [V], PV-M3 = about 24.21 [V]
PV-M4 = about 25.13 [V], PV-M5 = about 24.48 [V], PV-M6 = about 25.43 [V]
The average values calculated from all data within the abnormal sections of each PV module are also presented below.
[Avg. Voltage (Abnormal state)]:
PV-M1 = about 25.08 [V], PV-M2 = about 25.76 [V], PV-M3 = about 24.49 [V]
PV-M4 = about 25.63 [V], PV-M5 = about 24.84 [V], PV-M6 = about 25.79 [V]
It was confirmed that the average voltage values derived from the data presented in this study and those obtained through additional review show no significant difference.
Second, the study verified that the voltage and current fluctuations aligned with the stages of cable degradation during continuous heat accumulation. Prior to the main experiment, a trial section for grid connection was conducted. This section corresponds to the time interval between time steps 59,000 and 59,750 in Figure 7a. During this interval, voltage imbalance was observed in the graph; however, such imbalance did not occur in the main experimental section. Since the objective of this study is to analyze the differences between steady-state and abnormal conditions, the temporary voltage imbalance observed in the trial section was excluded from the analysis. Accordingly, the voltage value during the steady-state section was defined as the reference point for comparison with both the trial and abnormal sections. Under abnormal conditions, the analysis focused on changes observed in the Heat Accumulation Area (HAA), with particular attention given to the voltage and current data within this region. These changes may serve as precursors to PV cable fire hazards and, therefore, should be interpreted with caution. Special attention must be paid to the rates of voltage rise and drop.
Third, throughout the degradation of the inner and outer insulation of the TFR-CV cable, fluctuations in voltage (including increases and decreases), as well as a rapid reduction in current, were observed until the point of conductor thermal expansion. To better explain these results, additional experiments are planned. These experiments aim to mathematically verify the correlation between temperature variations in the cable conductor and the resulting changes in voltage and current.
Fourth, the variations in resistance and temperature during the abnormal state are attributed to the cooling effects of the external airflow, with the associated current variations considered to be a direct result of these temperature shifts. In future research, environmental variables will be held constant to establish a more reliable and controlled experimental setting.
5. Conclusions
This study aimed to experimentally verify whether insulation degradation caused by thermal accumulation in PV cables can serve as an early warning indicator. The results confirmed the occurrence of distinct electrical anomalies. Through real-time monitoring of voltage, current, and temperature, it was observed that abrupt changes such as sudden increases or decreases in voltage and current occurred near the thermal threshold, indicating a strong interrelationship among these parameters. While a high degradation index was applied in the present experiment, future studies will investigate the behavior of voltage, current, and temperature under lower degradation index conditions. The phenomena observed in this study suggest the potential for detecting abnormal conditions in PV systems through electrical signals at an early stage. Furthermore, the results demonstrate the feasibility of developing predictive diagnostics based on the correlation between thermal expansion and electrical responses. Future research will focus on quantitatively characterizing the relationship between the severity of insulation degradation and electrical characteristics under controlled environmental conditions, to establish a mathematical model for early fault detection in PV systems.
Author Contributions
Conceptualization, S.-G.K. and S.-Y.P.; Methodology, B.-I.J. and S.-Y.P.; Software, S.-G.K. and B.-I.J.; Validation, B.-I.J. and S.-Y.P.; Formal analysis, B.-I.J., J.-H.P. and S.-Y.P.; Investigation, S.-G.K., J.-H.P., Y.-G.L. and S.-Y.P.; Resources, S.-G.K. and B.-I.J.; Data curation, J.-H.P., Y.-G.L. and S.-Y.P.; Writing—original draft, S.-G.K. and S.-Y.P.; Writing—review & editing, B.-I.J. and S.-Y.P.; Visualization, J.-H.P., Y.-G.L. and S.-Y.P.; Supervision, S.-Y.P.; Project administration, S.-Y.P.; Funding acquisition, S.-Y.P. All authors have read and agreed to the published version of the manuscript.
Funding
This study was supported by the research fund from Chosun University (2023).
Data Availability Statement
The original contributions presented in this study are included in the article. Further inquiries can be directed to the corresponding author.
Conflicts of Interest
Author Seong-Gwang Kim was employed by the company Hudius. The remaining authors declare that the research was conducted in the absence of any commercial or financial relationships that could be construed as a potential conflict of interest.
References
- Xiong, L.; Liu, X.; Liu, Y.; Zhuo, F. Modeling and stability issues of voltage-source converter-dominated power systems: A review. CSEE J. Power Energy Syst. 2022, 8, 1530–1549. [Google Scholar] [CrossRef]
- Notton, G. Management of Intermittence of Renewable Energy Production: Various Aspects of Energy Storage. In Proceedings of the 2025 19th Conference on Electrical Machines, Drives and Power Systems (ELMA), Sofia, Bulgaria, 19–21 June 2025; pp. 1–11. [Google Scholar] [CrossRef]
- Kroposki, B.; Johnson, B.; Zhang, Y.; Gevorgian, V.; Denholm, P.; Hodge, B.-M.; Hannegan, B. Achieving a 100% Renewable Grid: Operating Electric Power Systems with Extremely High Levels of Variable Renewable Energy. IEEE Power Energy Mag. 2017, 15, 61–73. [Google Scholar] [CrossRef]
- Hill, C.A.; Such, M.C.; Chen, D.; Gonzalez, J.; Grady, W.M. Battery Energy Storage for Enabling Integration of Distributed Solar Power Generation. IEEE Trans. Smart Grid 2012, 3, 850–857. [Google Scholar] [CrossRef]
- Abdelsalam, A.K.; Massoud, A.M.; Ahmed, S.; Enjeti, P.N. High-Performance Adaptive Perturb and Observe MPPT Technique for Photovoltaic-Based Microgrids. IEEE Trans. Power Electron. 2011, 26, 1010–1021. [Google Scholar] [CrossRef]
- Kanchev, H.; Lu, D.; Colas, F.; Lazarov, V.; Francois, B. Energy Management and Operational Planning of a Microgrid with a PV-Based Active Generator for Smart Grid Applications. IEEE Trans. Ind. Electron. 2011, 58, 4583–4592. [Google Scholar] [CrossRef]
- Qiao, Y.; Shen, C.; Wu, J.; Lu, Q. The Integrated Simulation Platform for Islanding Control of Large-Scale Power Systems: Theory, Implementation and Test Results. In Proceedings of the 2006 IEEE Power Engineering Society General Meeting, Montreal, QC, Canada, 18–22 June 2006; pp. 1–8. [Google Scholar] [CrossRef]
- Choi, J.; Marthi, P.; Debnath, S.; Arifujjaman, M.; Rexwinkel, N.; Khalilpour, F.; Arana, A.; Karimjee, H. Hardware-Based Advanced Electromagnetic Transient Simulation for a Large-Scale PV Plant in Real Time Digital Simulator. In Proceedings of the 2023 IEEE Energy Conversion Congress and Exposition (ECCE), Nashville, TN, USA, 29 October–2 November 2023; pp. 965–971. [Google Scholar] [CrossRef]
- Gorla, K.R.; Krishnamoorthy, V.; Ramesh, S.; Karunanithi, K. Implementation of Neural Network Controller for Grid Connected Wind–Solar PV Charging Station. In Proceedings of the 2024 2nd International Conference on Sustainable Computing and Smart Systems (ICSCSS), Coimbatore, India, 10–12 July 2024; pp. 18–24. [Google Scholar] [CrossRef]
- Antoniadou-Plytaria, K.E.; Kouveliotis-Lysikatos, I.N.; Georgilakis, P.S.; Hatziargyriou, N.D. Distributed and Decentralized Voltage Control of Smart Distribution Networks: Models, Methods, and Future Research. IEEE Trans. Smart Grid 2017, 8, 2999–3008. [Google Scholar] [CrossRef]
- Faisal, M.; Hannan, M.A.; Ker, P.J.; Hussain, A.; Mansor, M.B.; Blaabjerg, F. Review of Energy Storage System Technologies in Microgrid Applications: Issues and Challenges. IEEE Access 2018, 6, 35143–35164. [Google Scholar] [CrossRef]
- IEEE 1547-2018; IEEE Standard for Interconnection and Interoperability of Distributed Energy Resources with Associated Electric Power Systems Interfaces. IEEE: Piscataway, NJ, USA, 2018; pp. 1–138. [CrossRef]
- Agamy, M.S.; Harfman-Todorovic, M.; Elasser, A. Ground Fault and Insulation Degradation Detection and Localization in PV Plants. In Proceedings of the 2013 IEEE 39th Photovoltaic Specialists Conference (PVSC), Tampa, FL, USA, 16–21 June 2013; pp. 2840–2844. [Google Scholar] [CrossRef]
- Mustafa, E.; Afia, R.S.A.; Ádam, T.Z. Electrical Integrity Tests and Analysis of Low Voltage Photovoltaic Cable Insulation under Thermal Stress. In Proceedings of the 2019 7th International Youth Conference on Energy (IYCE), Bled, Slovenia, 3–6 July 2019; pp. 1–4. [Google Scholar] [CrossRef]
- Naskar, M.; Dharmendra, H.M.; Meena, K.P. Effect of UV Ageing on Thermo-Mechanical Properties of Ethylene-Vinyl Acetate Nanocomposite Encapsulant. In Proceedings of the 2021 IEEE International Conference on the Properties and Applications of Dielectric Materials (ICPADM), Johor Bahru, Malaysia, 12–14 July 2021; pp. 278–281. [Google Scholar] [CrossRef]
- Shahriyar, F.; Islam, M.; Chakraborty, A.; Hasan, M.; Zaman, H.U.; Siddique, A.H. Fault and System Analysis Model of Voltage Source Control Based HVDC Transmission System. In Proceedings of the 2021 12th International Conference on Computing Communication and Networking Technologies (ICCCNT), Kharagpur, India, 6–8 July 2021; pp. 1–6. [Google Scholar] [CrossRef]
- National Fire Data System (NFDS). General Statistics. Available online: https://nfds.go.kr/stat/general.do (accessed on 4 July 2025).
- Zhao, X.; Pu, L.; Ju, Z.; Ren, S.; Duan, W.; Wang, J. Partial Discharge Characteristics and Development of Typical XLPE Power Cable Insulation Defects. In Proceedings of the 2016 International Conference on Condition Monitoring and Diagnosis (CMD), Xi’an, China, 25–28 September 2016; pp. 623–626. [Google Scholar] [CrossRef]
- Zhang, W.; Li, H.; Sun, X.; Yu, X. Case Study of High-Voltage Power Cable Fault Based on High-Frequency Partial Discharge Detection. In Proceedings of the 2023 Panda Forum on Power and Energy (PandaFPE), Chengdu, China, 27–30 April 2023; pp. 1126–1131. [Google Scholar] [CrossRef]
- Jannati, M.; Vahidi, B.; Hosseinian, S.H. Incipient Faults Monitoring in Underground Medium Voltage Cables of Distribution Systems Based on a Two-Step Strategy. IEEE Trans. Power Deliv. 2019, 34, 1647–1655. [Google Scholar] [CrossRef]
- Dhar, S.; Patnaik, R.K.; Dash, P.K. Fault Detection and Location of Photovoltaic Based DC Microgrid Using Differential Protection Strategy. IEEE Trans. Smart Grid 2018, 9, 4303–4312. [Google Scholar] [CrossRef]
- Xiong, Q.; Feng, X.; Gattozzi, A.L.; Liu, X.; Zheng, L.; Zhu, L.; Ji, S.; Hebner, R.E. Series Arc Fault Detection and Localization in DC Distribution System. IEEE Trans. Instrum. Meas. 2020, 69, 122–134. [Google Scholar] [CrossRef]
- Liu, Y.; Cao, X. Insulation Performance Evaluation of HV AC/DC XLPE Cables by 0.1 Hz tan δ Test on Circumferentially Peeled Samples. IEEE Trans. Dielectr. Electr. Insul. 2017, 24, 3941–3950. [Google Scholar] [CrossRef]
- Hackam, R. Outdoor HV Composite Polymeric Insulators. IEEE Trans. Dielectr. Electr. Insul. 1999, 6, 557–585. [Google Scholar] [CrossRef]
- Tang, Z.; Gao, K.; Shan, Y.; Zhu, C.; Liu, Z.; Liu, Z. Study of the Fire Behavior of Multilayer Cables in a Mine Tunnel. Energies 2022, 15, 2059. [Google Scholar] [CrossRef]
- IEEE 1202-2023; IEEE Standard for Flame-Propagation Testing of Wire and Cable. IEEE: Piscataway, NJ, USA, 2023; pp. 1–39. [CrossRef]
- IEEE 1185-2019; IEEE Recommended Practice for Cable Installation in Generating Stations and Industrial Facilities. IEEE: Piscataway, NJ, USA, 2020; pp. 1–127. [CrossRef]
- Azouaou, R.; Rabahallah, S.; Leulmi, S. Study of the Direction of the Harmonic Injections in the Electrical Power Systems. In Proceedings of the 39th International Universities Power Engineering Conference, Bristol, UK, 6–8 September 2004; Volume 2, pp. 944–947. [Google Scholar]
- Aurpa, T.T.; Maisha Jeba, S.; Bin Monib, K.M.; Nessa Ela, M.; Ahmed, M.S.; Musfique Anwar, M. Predictive Modeling of Fire Hazard: Integrating Environmental Factors with Machine Learning. In Proceedings of the 2025 International Conference on Electrical, Computer and Communication Engineering (ECCE), Chittagong, Bangladesh, 13–15 February 2025; pp. 1–6. [Google Scholar] [CrossRef]
- Wang, R.-G.; Chuang, M.-L.; Ke, C.-Y.; Chien, Y.-F.; Ho, W.-J.; Chiang, K.-C.; Hung, Y.-C.; Tsai, C.H.; Chou, C.-C. Predicting Imminent Electrical Safety Incidents Using Smart Meter Big Data with Large Language Models. IEEE Access 2024, 12, 184940–184952. [Google Scholar] [CrossRef]
- Morsy, M.A.; Shwehdi, M.H. A Supportive Approach into Life Testing and Characterization of PVC and XLPE-Insulated Cable Materials. In Proceedings of the CEIDP ’05 2005 Annual Report Conference on Electrical Insulation and Dielectric Phenomena, Nashville, TN, USA, 16–19 October 2005; pp. 210–213. [Google Scholar] [CrossRef]
- Fernando, M.A.R.M.; Gubanski, S.M. Ageing of Silicone Rubber Insulators in Coastal and Inland Tropical Environment. IEEE Trans. Dielectr. Electr. Insul. 2010, 17, 326–333. [Google Scholar] [CrossRef]
- Ye, G.; Li, H.; Lin, F.; Tong, J.; Wu, X.; Huang, Z. Condition Assessment of XLPE Insulated Cables Based on Polarization/Depolarization Current Method. IEEE Trans. Dielectr. Electr. Insul. 2016, 23, 721–729. [Google Scholar] [CrossRef]
- Takada, T.; Fujitomi, T.; Mori, T.; Iwata, T.; Ono, T.; Miyake, H.; Tanaka, Y. New Diagnostic Method of Electrical Insulation Properties Based on Current Integration. IEEE Trans. Dielectr. Electr. Insul. 2017, 24, 2549–2558. [Google Scholar] [CrossRef]
- Wang, Z.; Balog, R.S. Arc Fault and Flash Signal Analysis in DC Distribution Systems Using Wavelet Transformation. IEEE Trans. Smart Grid 2015, 6, 1955–1963. [Google Scholar] [CrossRef]
- Bakri, N.S.; Adnan, R.; Samad, A.M.; Ruslan, F.A. A Methodology for Fire Detection Using Colour Pixel Classification. In Proceedings of the 2018 IEEE 14th International Colloquium on Signal Processing & Its Applications (CSPA), Penang, Malaysia, 9–10 March 2018; pp. 94–98. [Google Scholar] [CrossRef]
- Long-Dong, B.; Wu, Y.-K.; Pham, M.-H. Fault Identification and Diagnosis Methods for Photovoltaic System: A Review. In Proceedings of the 2021 7th International Conference on Applied System Innovation (ICASI), Chiayi, Taiwan, 24–25 September 2021; pp. 126–129. [Google Scholar] [CrossRef]
- Long, G.; Mu, H.; Li, Y.; Zhang, D.; Ding, N.; Zhang, G. Fault Identification Technology of Series Arc Based on Deep Learning Algorithm. In Proceedings of the 2020 IEEE International Conference on High Voltage Engineering and Application (ICHVE), Beijing, China, 6–10 September 2020; pp. 1–4. [Google Scholar] [CrossRef]
- Ilman, A.F.; Asfani, D.A.; Negara, I.M.Y.; Fahmi, D.; Sawitri, D.R.; Syafaruddin. Design of Low Voltage Arcing Identification Based on Wavelet Transform. In Proceedings of the 2016 International Seminar on Application for Technology of Information and Communication (ISemantic), Semarang, Indonesia, 5–6 August 2016; pp. 229–234. [Google Scholar] [CrossRef]
- Xu, N.; Yang, Y.; Jin, Y.; He, J. Identification of Series Fault Arc of Low-Voltage Power Cables in Substation Based on Wavelet Transform. In Proceedings of the 2020 IEEE 5th International Conference on Integrated Circuits and Microsystems (ICICM), Nanjing, China, 23–25 October 2020; pp. 188–192. [Google Scholar] [CrossRef]
- Agrawa, A.; Bhadra, M.; Tyagi, M.; Kumar, A.; Pandey, A.N. Camera Based Fire Alert System Using Raspberry Pi. In Proceedings of the 2022 2nd International Conference on Advance Computing and Innovative Technologies in Engineering (ICACITE), Greater Noida, India, 28–29 April 2022; pp. 1183–1187. [Google Scholar] [CrossRef]
- Wu, T.; Liu, K.; Liu, T.; Xiao, B.; Peng, Y.; Lei, X.; Su, Z.; Tang, P. Insulation Property of Wire-Plane Gap under Fire Condition: Effects of Vegetation Flame Conductivity. In Proceedings of the 2015 5th International Conference on Electric Utility Deregulation and Restructuring and Power Technologies (DRPT), Changsha, China, 26–29 November 2015; pp. 1600–1605. [Google Scholar] [CrossRef]
- IEC 60269-1:2024; Low-voltage fuses—Part 1: General Requirements. International Electrotechnical Commission: Geneva, Switzerland, 2024. Available online: https://webstore.iec.ch/en/publication/1232 (accessed on 20 September 2025).
Disclaimer/Publisher’s Note: The statements, opinions and data contained in all publications are solely those of the individual author(s) and contributor(s) and not of MDPI and/or the editor(s). MDPI and/or the editor(s) disclaim responsibility for any injury to people or property resulting from any ideas, methods, instructions or products referred to in the content. |
© 2025 by the authors. Licensee MDPI, Basel, Switzerland. This article is an open access article distributed under the terms and conditions of the Creative Commons Attribution (CC BY) license (https://creativecommons.org/licenses/by/4.0/).