Article

A Greenhouse Profitability Model: The Effect of the Energy System

by
Anna-Maria N. Dimitropoulou
*,
Eugenia N. Giannini
and
Zacharias B. Maroulis
Laboratory of Process Analysis and Design, National Technical University of Athens, 15780 Athens, Greece
*
Author to whom correspondence should be addressed.
Energies 2025, 18(17), 4748; https://doi.org/10.3390/en18174748
Submission received: 31 July 2025 / Revised: 31 August 2025 / Accepted: 2 September 2025 / Published: 6 September 2025

Abstract

This study proposes a technoeconomic model for assessing the profitability of modern greenhouses, with emphasis on hydroponic systems and the integration of combined heat and power (CHP) technology. Given the high share of energy costs in total operating expenses (~35%), the model includes both cultivation and energy subsystems and is implemented in a spreadsheet environment for ease of use. The model calculates Return on Investment (ROI) under various scenarios, considering geographical latitude, CHP capacity, cultivation settings, and energy prices. In the baseline case, the greenhouse ROI is 12%, rising to 14% when CHP is integrated, with CHP itself achieving 24%. Key findings include the identification of optimum CHP sizing (0.5–1.5 MW/ha, depending on latitude) and critical inflection points in ROI behavior associated with latitude and cultivation temperature, driven by the depletion of cooling demand and redistribution of operating modes. The analysis confirms that CHP becomes economically attractive when the Spark Ratio (the electricity price to the natural gas price) exceeds 3, offering enhanced profitability and resilience against energy price volatility. The proposed method is simple, transparent, and suitable for preliminary investment analysis and policy planning in sustainable agri-energy systems.

1. Introduction

1.1. Scope

High-technology greenhouses, particularly hydroponic systems, represent a cutting-edge investment opportunity in the primary production sector. A recent sectoral study by the Embassy of the Kingdom of the Netherlands highlights key developments in greenhouse farming in Greece, emphasizing its growing significance for agricultural production and logistics [1].
Given their capital intensity, it is essential for both prospective investors and policymakers to understand the typical profitability margins of such investments, as well as the key factors that influence them. These include, among others, the type of cultivated crop, the location of the greenhouse, its technical specifications, raw material and product prices, and—most critically—the cost of energy.
A recent study by Dimitropoulou et al. [2] quantified the thermal energy requirements of greenhouses as a function of key technical parameters (such as overall heat loss coefficient, cover transmission, and effective absorbance), cultivation conditions (particularly target temperature ranges), and local meteorological data (solar radiation and ambient temperature), which are directly influenced by site characteristics (latitude and longitude). These findings underscore the inherently high energy demand of modern greenhouses.
To address this challenge, the integration of combined heat and power (CHP) systems has been widely proposed as an effective solution [3]. By generating electricity for sale to the grid and simultaneously recovering heat to meet greenhouse thermal needs, CHP systems offer a distinct competitive advantage, often playing a decisive role in the overall profitability of greenhouse operations.
In this context, a greenhouse energy system may be viewed as comprising two distinct yet interconnected subsystems: (a) the greenhouse itself and (b) the CHP unit. These subsystems could even operate under different business entities, with the CHP unit potentially managed by an Energy Services Company (ESCo).
Considering the above, both private investors and policy planners require a comprehensive understanding of the profitability of such integrated greenhouse systems, particularly regarding the impact of the energy subsystem on overall performance.
This study aims precisely to address this need. Specifically, it investigates the influence of the energy system on greenhouse profitability and analyses the key factors affecting it. To achieve this, a robust mathematical model is developed to calculate profitability as expressed by the fundamental financial indicator—Return on Investment (ROI).
Through a sensitivity analysis using the proposed model, the study evaluates how the ROI is affected by key variables, including geographical location (latitude and longitude, affecting meteorological conditions), CHP system sizing, cultivation conditions, and energy prices.
In conclusion, the aim of this study is to develop a technoeconomic model that offers a comprehensive assessment of the profitability of modern hydroponic greenhouses, with particular emphasis on the role of the energy system through the integration of combined heat and power (CHP) technology.

1.2. Recent Literature

In recent years, research on the technoeconomic performance of modern greenhouses has expanded considerably, with many studies focusing on high-tech and hydroponic systems, as well as the integration of advanced energy solutions. Paris et al. [4] reviewed energy use in EU greenhouses and highlighted significant regional differences in energy intensity and infrastructure.
Several studies have addressed energy system integration in controlled environment agriculture. Tataraki et al. [5] developed a comprehensive framework to evaluate Combined Cooling, Heating, and Power (CCHP) systems in greenhouses under different Greek climatic zones, highlighting that ROI values can exceed 25%, with significant reductions in energy costs. Seiler et al. [6] explored energy optimization strategies for controlled environment agriculture through the integration of CHP systems with auxiliary technologies such as thermal storage, batteries, and carbon capture. Introducing CHP reduced procurement costs by 12.48%, with an additional 6.46% savings from thermal storage. Similarly, Lahlou et al. [7] compared centralized greenhouses and vertical farms in Qatar, highlighting that greenhouses had lower levelized production costs ($3.19/kg vs. $3.77/kg) and electricity costs (reduced by 71.61%), whereas vertical farms offered water saving and better urban integration potential. Compernolle et al. [8] assessed self-managed CHP systems for tomato and lettuce greenhouse cultivation, which were found to be economically viable and required 1.2 MW and 239 KW CHP systems, respectively.
Comparative analyses have also been undertaken focusing on greenhouse design, crop selection, and overall system profitability. Kurklu [9] examined various greenhouse designs (semi-closed, Venlo, and Gothic) in Turkey, finding that the economic viability depends strongly on crop type, yield, and system design. Tomatoes emerged as the most profitable option, while strawberries and roses were more volatile. Min et al. [10] evaluated cherry tomato glasshouses in China, with mean NPVs ranging from −957.8 ¥/m2 (Weifang) to 477.0 ¥/m2 (Pingliang), highlighting strong regional variation. In a study from Saudi Arabia, Hopwood et al. [11] benchmarked greenhouses of varying technology levels, finding that high-tech closed systems achieved the shortest payback period and highest productivity, mainly due to year-round cultivation supported by mechanical cooling. Similarly, Ahamed et al. [12] evaluated the economic feasibility of year-round greenhouse vegetable production in Canada. Tomato cultivation was found to be the most profitable product, with a payback period of 2.42 years. Profitability was highly influenced by product prices, which are higher in remote areas, making production economically viable.
Hydroponic systems also feature prominently in recent assessments of greenhouse profitability. Michalis et al. [13] confirmed hydroponic greenhouse profitability in Greece under typical market prices, but stressed vulnerability to energy price fluctuations. Folorunso et al. [14] reached similar conclusions in their study on hydroponic farms in Nigeria, where medium-scale operations were more resilient to fluctuations in energy and nutrient costs due to economies of scale.
However, existing studies often focus either on cultivation performance or on energy systems in isolation, with limited integration between the two subsystems. Furthermore, many require specialized simulation software, limiting accessibility for preliminary investment planning. The present work addresses these gaps by proposing a unified, spreadsheet-based technoeconomic model that jointly simulates the cultivation and CHP subsystems, allowing for transparent sensitivity analyses across geographic, technical, and economic variables.
This approach aligns with recent calls for practical decision-support tools in sustainable agriculture-energy systems [15,16], particularly in the context of rising energy price volatility and the need for climate-adaptive controlled environment agriculture.
To facilitate comparison, Table 1 synthesizes the scope, cultivation type, climate context, economic metrics, and key assumptions of the representative studies discussed above. As shown, previous works often focus either on crop-specific profitability or on energy subsystems, whereas the present model integrates both dimensions within a single, transparent framework. This comparative view highlights the contribution of the current study in terms of simplicity, integration, and applicability to preliminary investment planning.

2. Materials and Methods

To fulfill the objectives of this study, a dedicated mathematical model is developed and presented in Section 2.1. The data required for the implementation of the model are summarized in Section 2.2, based on relevant literature sources.
The proposed mathematical framework consists of several interconnected sub-models: the economic models of the greenhouse, the CHP system, and the overall integrated system; the thermal demand model of the greenhouse; the climatic data estimation model based on the geographical location; and the energy performance model of the CHP unit.

2.1. Mathematical Model

The following mathematical model calculates all the crucial technoeconomic data for the preliminary evaluation of an investment concerning hydroponic greenhouses.
The model supposes that two different processes are distinguished: (a) the greenhouse itself (gh) and (b) the supporting heat and power cogeneration system (chp).
The following model presentation starts from the main results (outputs) and proceeds towards the required technoeconomic data (inputs).
Thus, the Return on Investment ( R O I ) is selected as the crucial magnitude for investment appraisal. It is defined as the ratio of the annual Earnings Before Interest, Taxes, and Depreciation ( E B I T D ) divided by the total initial Capital Expenditures ( C a p E x ):
R O I = E B I T D C a p E x
Both E B I T D and C a p E x are coming from the two different entities: the Greenhouse (gh) and the Cogeneration (chp):
C a p E x = C a p E x g h + C a p E x c h p
E B I T D = E B I T D g h + E B I T D c h p
and are calculated based on different models, as follows:
Greenhouse Economic Model:
R O I g h = E B I T D g h C a p E x g h
Capital Expenditures C a p E x g h depends on the greenhouse size, that is, the greenhouse cultivated area A (in ha) and the greenhouse unit equipment cost C g h (in M€/ha):
C a p E x g h = C g h   A
Greenhouse Earnings Before Interest, Taxes, and Depreciation E B I T D g h is the difference between the annual greenhouse sales S a l e s g h and the greenhouse annual operating expenses O p E x g h :
E B I T D g h = S a l e s g h O p E x g h
The annual greenhouse sales S a l e s g h are analogous to the size of the annual produced product Y (in kt/y) and the product unit price c p (in €/kg):
S a l e s g h = c p   Y
The greenhouse annual operating expenses O p E x g h consist of three different kinds of expenses: the raw materials C r , the personnel C w and the energy, usually natural gas C g , g h :
O p E x g h = C r + C w + C g , g h
The raw materials expenses C r are analogous to annual production Y :
C r = c r Y
where c r is the raw material overall unit cost c r .
The personnel expenditures C w are analogous to equivalent manpower W :
C w = c w W
where the basic annual salary c w is analyzed in the next section. The required manpower W consists of two parts: a part analogous to cultivation area A and to the annual operating period C F g h , and a constant part W o for every greenhouse unit for management and administration.
W = w   A   C F g h + W o
where w is required labor manpower per cultivation area, and the greenhouse Capacity Factor C F g h is defined in some paragraphs below.
The energy expenditures C g , g h are analogous to natural gas annual consumption G g h :
C g , g h = c g   G g h
where the c g is the natural gas price.
The greenhouse natural gas annual consumption G g h is calculated by the equation:
G g h = Q h A n b
where A is the cultivated area, n b is the boiler efficiency and Q h is the specific thermal energy requirements, which is calculated below using the greenhouse thermal model.
Greenhouse Process Model:
The greenhouse annual production Y is estimated by the following equation:
Y = y   A   C F g h
where A is the cultivated area, y is the productivity, and C F g h is the greenhouse Capacity Factor. The Capacity Factor is defined as the fraction of the year the greenhouse is in operation. When the greenhouse is equipped with heating and cooling systems it is in operation all year. Instead, when no heating and cooling system is available, it is in operation during a fraction of the year. Usually, greenhouses are operated during the heating and zero energy periods and remain closed during the cooling period.
The greenhouse thermal model calculates the specific (per unit cultivated area) thermal energy requirements, that is, Q h for heating, Q c for cooling, along with the annual operating periods, that is, t h the heating period, t c the cooling period, t z the zero-energy period.
The model is presented by Dimitropoulou et al. [2], and the proposed equations are summarized as follows:
Q h = j m a x   [ U L 1   ( ( T p     Δ T p )     T j )     τ 1   α   S j ,   0 ]
Q c = j m a x   [ U L 2   ( ( T j ( T p + Δ T p ) ) + τ 2   τ 1   α   S j ,   0 ]
t h = j i f   Q h j > 0   t h e n   t h j = 1   e l s e   t h j = 0
t c = j i f   Q c j > 0   t h e n   t c j = 1   e l s e   t c j = 0
C F g h = 365 t c 365
where U L 1 and U L 2 are the greenhouse effective overall heat loss coefficients during winter and summer, respectively; τ 1 is the transmittance of the greenhouse cover; τ 2 is the transmittance of the additional shadowing cover during summer; α is the overall effective absorbance of the greenhouse; T p is the required product cultivation temperature; Δ T p is the accepted difference from the required cultivation temperature; T j is the daily average ambient temperature during the day j ; S j is the daily total solar radiation during day j .
Due to seasonal variation in the meteorological data daily calculations are used.
Meteorological Model:
The following meteorological model is proposed to calculate the daily average temperature and the daily total solar radiation versus the site geographical coordinates:
T j = T m Δ T   c o s 2 π ( j j T o ) 365
S j = S m Δ S   c o s 2 π ( j j S o ) 365
T m = 32.8 22.8 Y 50
T = 7.61 + 2.3   X 15
j T o = 21.2
S m = 3.24   Y 50 1.39
S = 2.64
j S o = 11.2 19.2   l n Y 50
where T m is the annual average ambient temperature; S m is the daily average solar radiation; Δ T is the annual ambient temperature variation; Δ S is the annual solar radiation variation; j T o is the day of the year with the lowest temperature value; j S o is the day of the year with the lowest solar radiation value; T j is the daily average ambient temperature during the day j ; S j is the daily total solar radiation during day j .
The model parameters were estimated by fitting the model to a large set of meteorological data presented by Dimitropoulou et al. [2].
Cogeneration Economic Model:
The Return on Investment R O I c h p , the Capital Expenditures C a p E x c h p and the Earnings Before Interest, Taxes, and Depreciation E B I T D c h p of the Cogeneration (chp) as a separate system are calculated from the following equations:
R O I c h p = E B I T D c h p C a p E x c h p
E B I T D c h p = S a l e s c h p O p E x c h p
C a p E x c h p = C c h p   p   A
where C c h p is the cogeneration unit equipment cost in M€/MW. The parameter p is a crucial design parameter defined as the cogeneration installation power per greenhouse area in MW/ha.
The sales of the cogeneration process refer to (a) the Electricity produced E being sold to the grid at a price C e , and (b) the recovered thermal energy, which corresponds to avoiding natural gas consumption G R at a price c g .
S a l e s c h p = C e   E + c g G R
The operating expenses refer to (a) the natural gas consumption cost C g , c h p and (b) the cogeneration maintenance cost C m .
O p E x c h p = C g , c h p + C m
C g , c h p = c g G c h p
C m = c m E
where G c h p is the natural gas consumption, E the electricity produced, c g is the unit natural gas cost, and c m is the unit maintenance cost.
Cogeneration Process Model:
The electricity produced by the cogeneration E is calculated by the equation:
E = j m i n ( Q h j n e n h , 24   p   A )
where Q h j is the daily heating requirements of the greenhouse, n e is the cogeneration electrical efficiency, and n h the cogeneration thermal efficiency.
The natural gas consumption G c h p and the avoided natural gas consumption G R are calculated by the following equations:
G c h p = E n e
G R = C F c h p   G c h p   n h n b
The cogeneration Capacity Factor C F c h p is calculated by the following equation:
C F c h p = E t y   p   A
That is, C F c h p is the fraction of the year the cogeneration is in operation, where t y = 8760   h /y.
The above-described model of 38 equations is used in this work. The model information flow diagram is summarized in Figure 1. Figure 1 also presents the most important model output data along with the required input data.
The output data consists of the appropriate data to describe the economic performance of the greenhouse and estimate its profitability. Return on Investment is selected as the crucial criterion to evaluate the greenhouse investment.
The input data in Figure 1 is discussed in the next paragraph.

2.2. Greenhouse Technoeconomic Data

The model required input data in Figure 1 is classified in groups as follows:
Location data refers to the geographical Longitude and Latitude of the site where the greenhouse is operated. If these geographical coordinates are available, the appropriate meteorological data for process design are estimated by the proposed meteorological model.
The crucial sizing magnitudes (Equipment Size) refer to the cultivation area and the cogeneration installed power. Greenhouse size depends on the area and capital available and is determined by the investor. Cogeneration size is the most important optimization factor, the design variable. It depends on the required thermal loads, which in turn depend on the cultivating conditions and the site climate.
The Greenhouse Technical Characteristics depend on the type and the quality of the greenhouse and are discussed by Dimitropoulou et al. [2].
In the same work (Dimitropoulou et al. [2]), the appropriate Cultivation Temperature Range is also discussed for various products.
Cogeneration Technical Characteristics depend on the type and technology of the cogeneration system. It is easy to select and estimate from the literature, e.g., Dimitropoulou et al. [2] and Tataraki et al. [3].
The data group named Cultivation Data refers to the required manpower structure and to the obtained productivity. The required manpower depends on the experience of the management and the labor. Greenhouse productivity depends on the product, the site, the climate, and the greenhouse operating experience.
Economic data refers to Equipment Installation Cost, Operating Cost, and Product Price. Installation cost refers to both the greenhouse and the cogeneration system. Operating costs refer to maintenance, labor, and energy costs. Energy prices for both natural gas and electricity are the most important and uncertain parameters concerning the examined profitability.
Table 2 presents the values of the model input data, defined as the base case scenario.
The location data correspond to a site in northern Greece. For the analysis, a standard large site of 10 ha is selected. The initial cogeneration size is set at 0.5 MW/ha, as it is a key design variable whose final value is determined through process optimization.
The Greenhouse Technical Characteristics are based on a typical greenhouse, as discussed by Dimitropoulou et al. [2], while the Cogeneration Technical Characteristics follow the specifications outlined by Tataraki et al. [3].
Cultivation Temperature Range, Cultivation Data, raw material cost, and product price correspond to tomatoes.
The equipment costs reflect recent price levels offered by major suppliers in recent years. Energy prices are based on the average market rates in Greece over the same period.

3. Results

In Section 3, a comprehensive investigation of greenhouse profitability is undertaken. Specifically, the influence of energy-system-related factors is analyzed in detail through the mathematical model presented in Section 2. The impact of other factors can also be explored by the reader using the spreadsheet provided in the Supplementary Material.

3.1. Base Case

Table 3 presents the economic outcomes derived from the developed mathematical model, based on the input data summarized in Table 2. The key financial metrics include sales revenues, operating costs, earnings before interest, taxes, and depreciation (EBITD), the total capital investment (CapEx), and the return on investment (ROI), which serves as the primary profitability indicator for this study.
The model’s structure allows for the distinct evaluation of the greenhouse production unit and the energy (cogeneration) system, while also providing an aggregated overview of the total system’s performance. This separation enables the quantification of the individual contribution of each subsystem to the overall economic results.
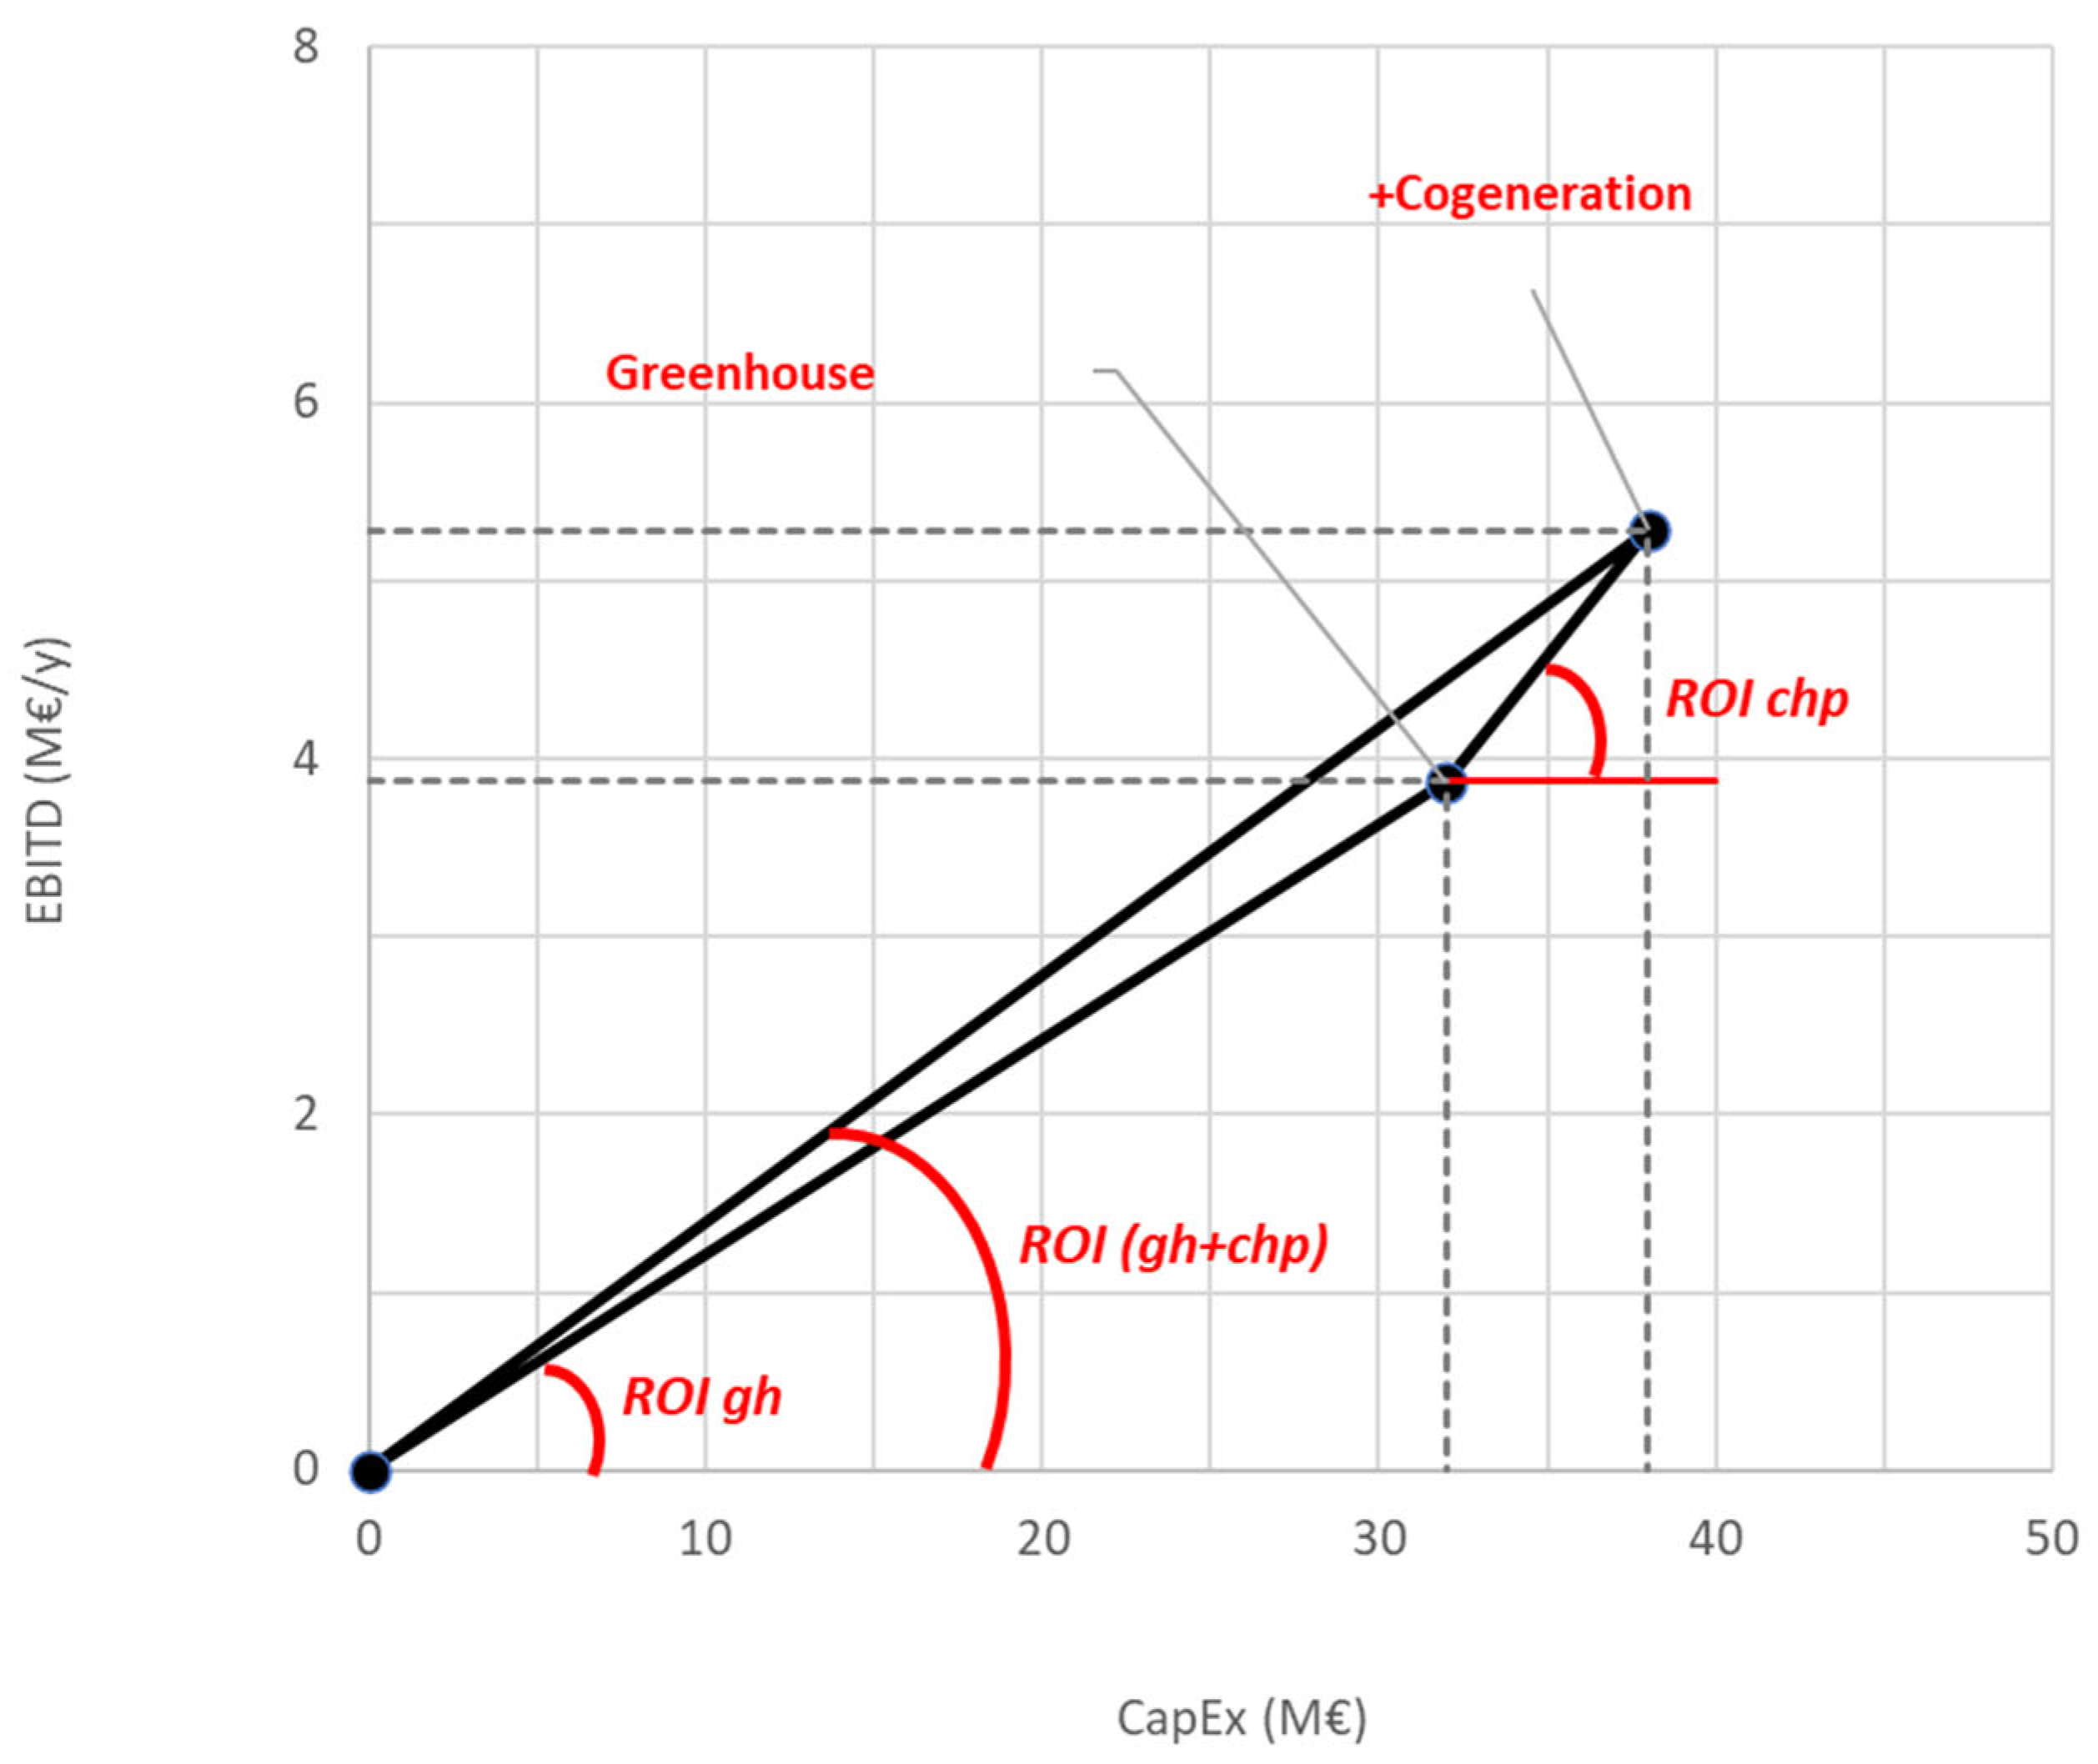
It is evident that the greenhouse, operating solely with a conventional boiler and without cogeneration, yields a relatively low ROI of approximately 12%, which corresponds to a payback period exceeding eight years. The integration of cogeneration improves the overall ROI to 14%, driven by the higher profitability of the cogeneration unit, 23.5%. However, it is important to highlight that the cogeneration system cannot operate independently. Its functionality is intrinsically linked to the presence of a heat utilization system, such as the greenhouse, to ensure efficient recovery and exploitation of the generated thermal energy. Meanwhile, the produced electricity is sold directly to the grid, contributing further to the revenue stream.
These findings are graphically illustrated in Figure 2, where investment cost (CapEx) is plotted on the horizontal axis, and EBITD on the vertical axis. The slope of each line segment visually represents the corresponding ROI. The geometrical representation effectively demonstrates both the individual and combined impacts of the two subsystems on the overall project profitability.
In the following sections, the sensitivity of these economic results to key influencing factors—particularly energy-related parameters—will be analyzed and discussed in detail.
Table 4 presents the breakdown of operational expenditures (OpEx) into labor, raw materials, and energy costs. Energy accounts for approximately 35% of the total OpEx, highlighting its significant contribution to the overall operating burden. If the earnings (EBITD) generated by the combined heat and power (CHP) unit are entirely allocated to offset energy expenses, the analysis indicates that CHP operation reduces energy costs by approximately 90%. This substantial reduction underscores the critical role of cogeneration in enhancing both the energy and economic efficiency of the greenhouse system.

3.2. Latitude Effect

The economic performance of the greenhouse is influenced by latitude, due to variations in the required thermal loads. Specifically, moving from southern to northern latitude results in increased heating requirements during winter and reduced cooling needs during summer.
The required thermal loads (for heating or cooling) of the greenhouse depend on meteorological conditions (temperature, humidity, wind speed, and solar radiation) as well as on the internal environmental conditions (temperature, humidity) required for each cultivated crop. These dependencies have been thoroughly studied by Dimitropoulou et al. [2], and the findings of that work—particularly those concerning the effect of geographical latitude—are utilized in the present study.
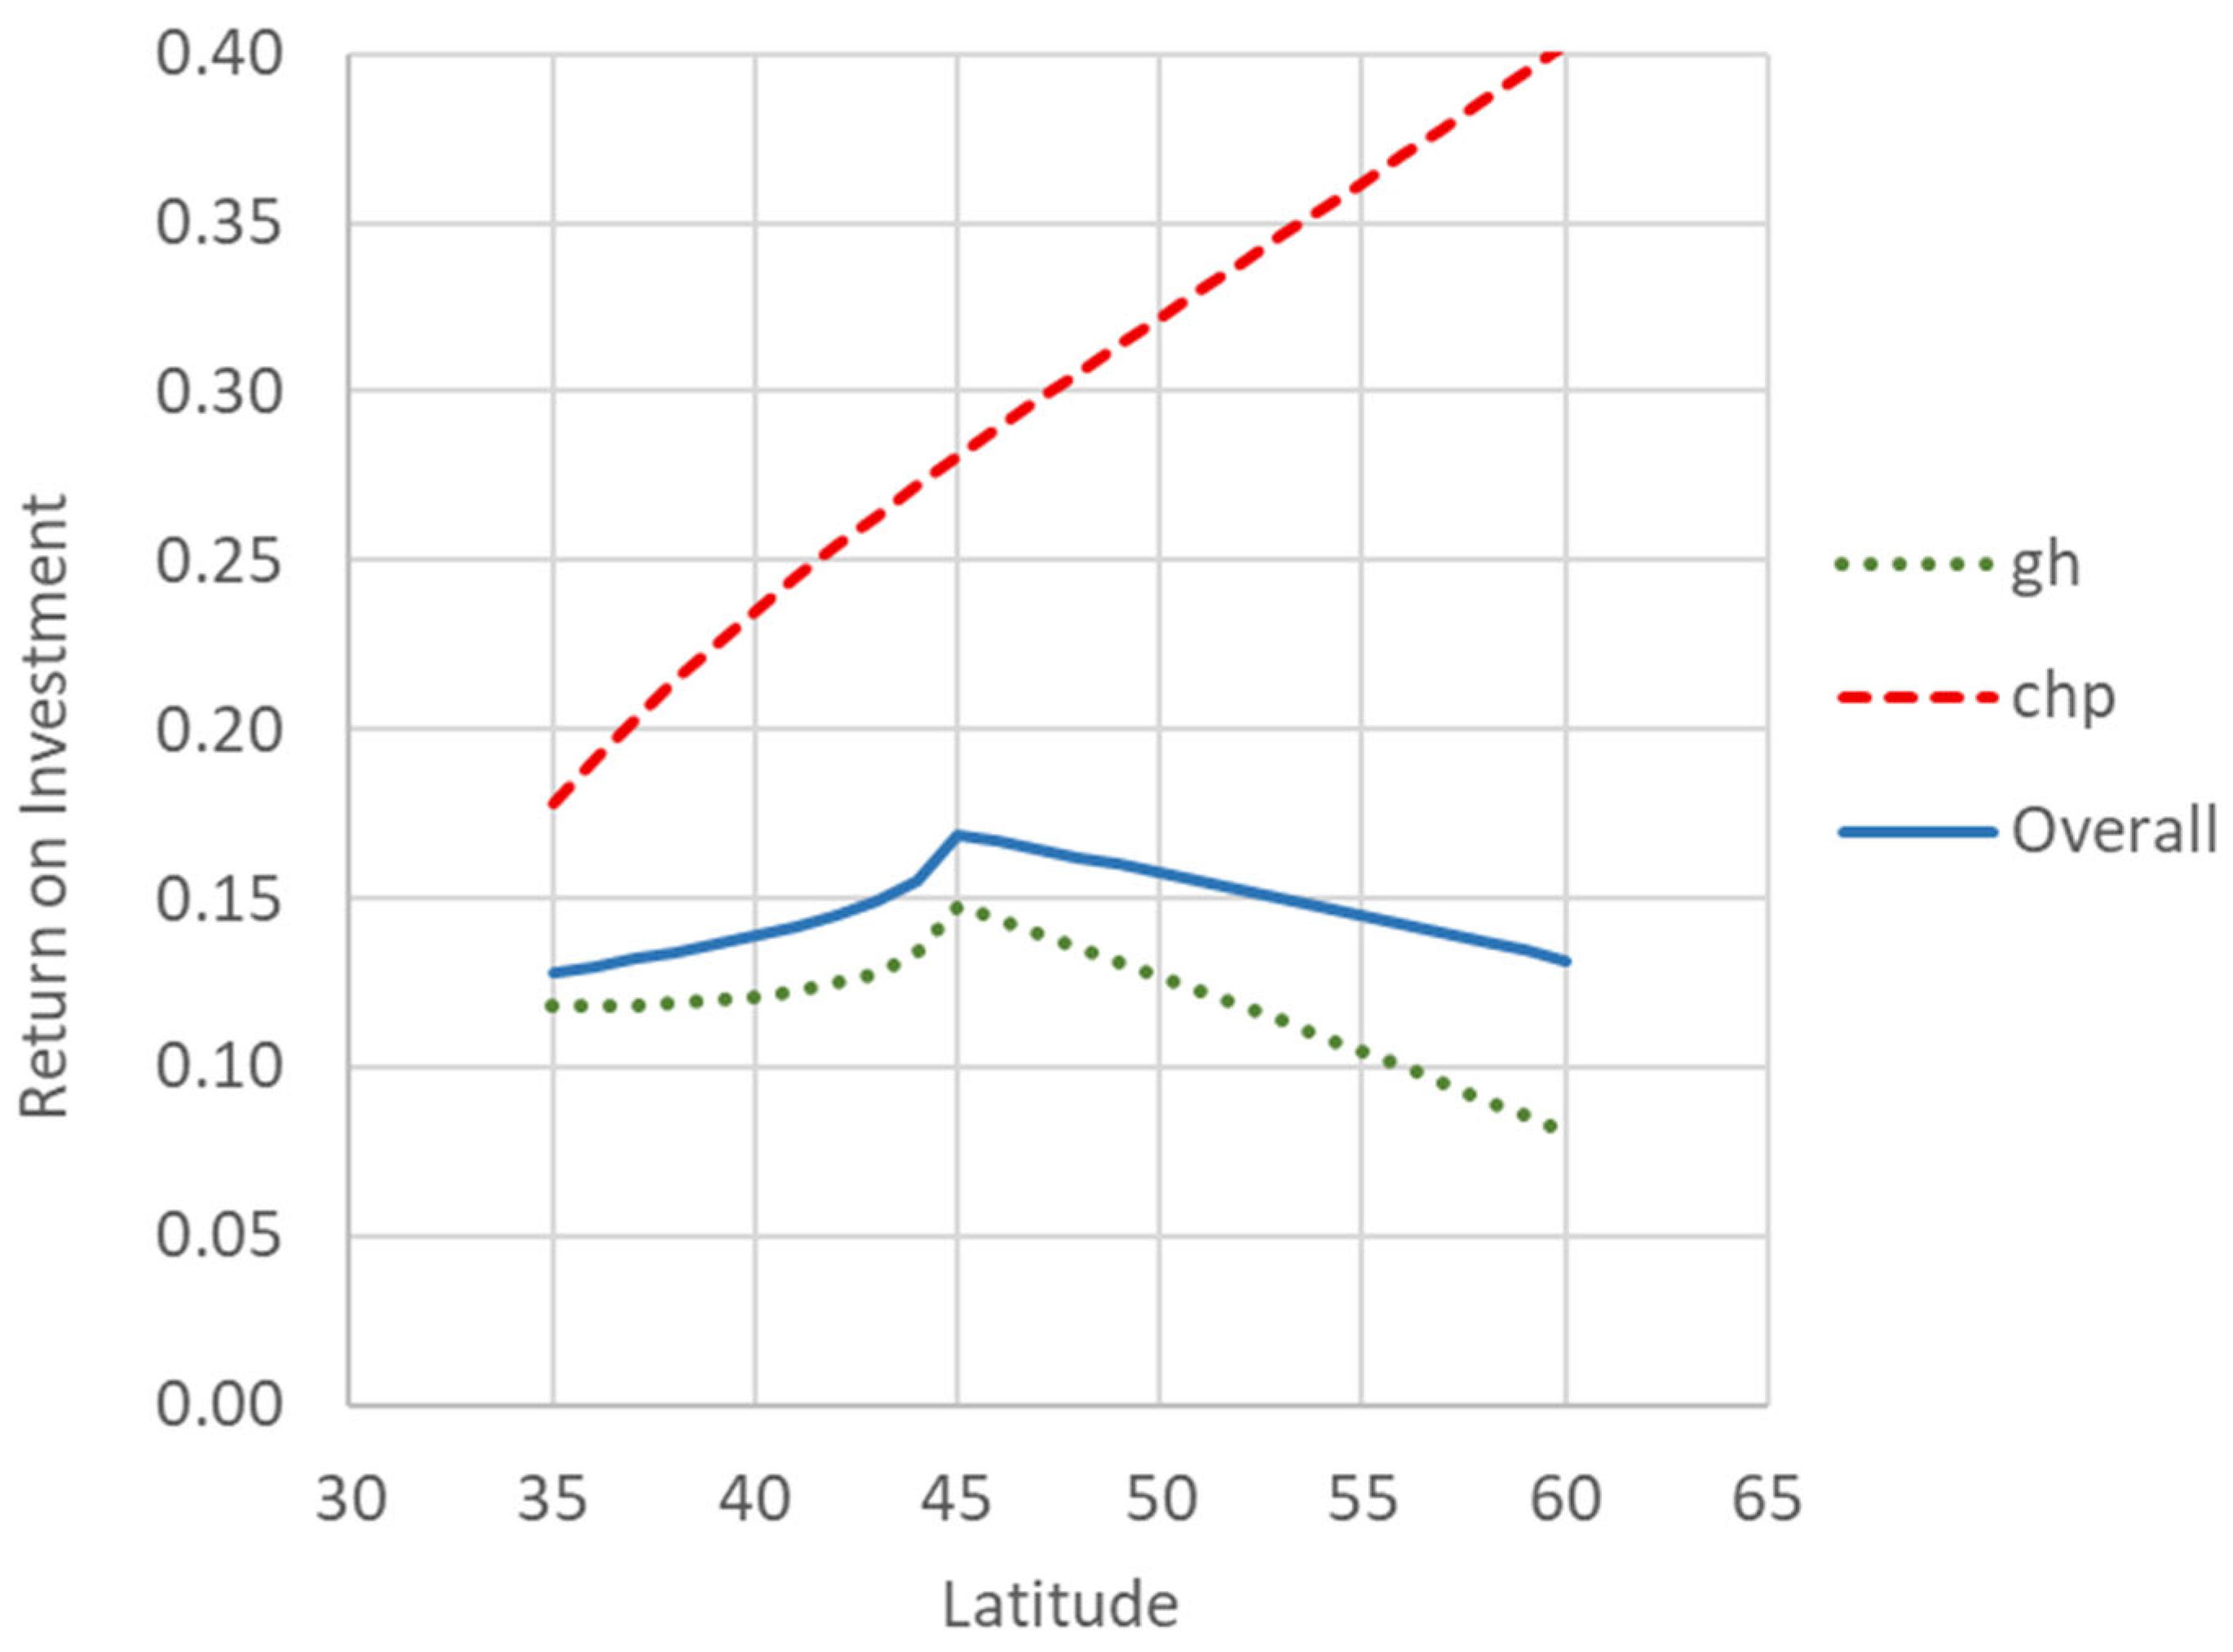
As a result, Figure 3 illustrates the Return on Investment (ROI) as a function of latitude, shown separately for the greenhouse alone (gh), the cogeneration unit (chp), and the integrated system (Overall). The figure demonstrates that the greenhouse on its own yields only modest profitability, whereas the cogeneration unit alone performs substantially better. Consequently, the integrated system consistently achieves a higher ROI than the standalone greenhouse, robustly across all latitudes, thereby confirming that cogeneration markedly enhances overall greenhouse profitability. The magnitude of this improvement, however, remains latitude-dependent.
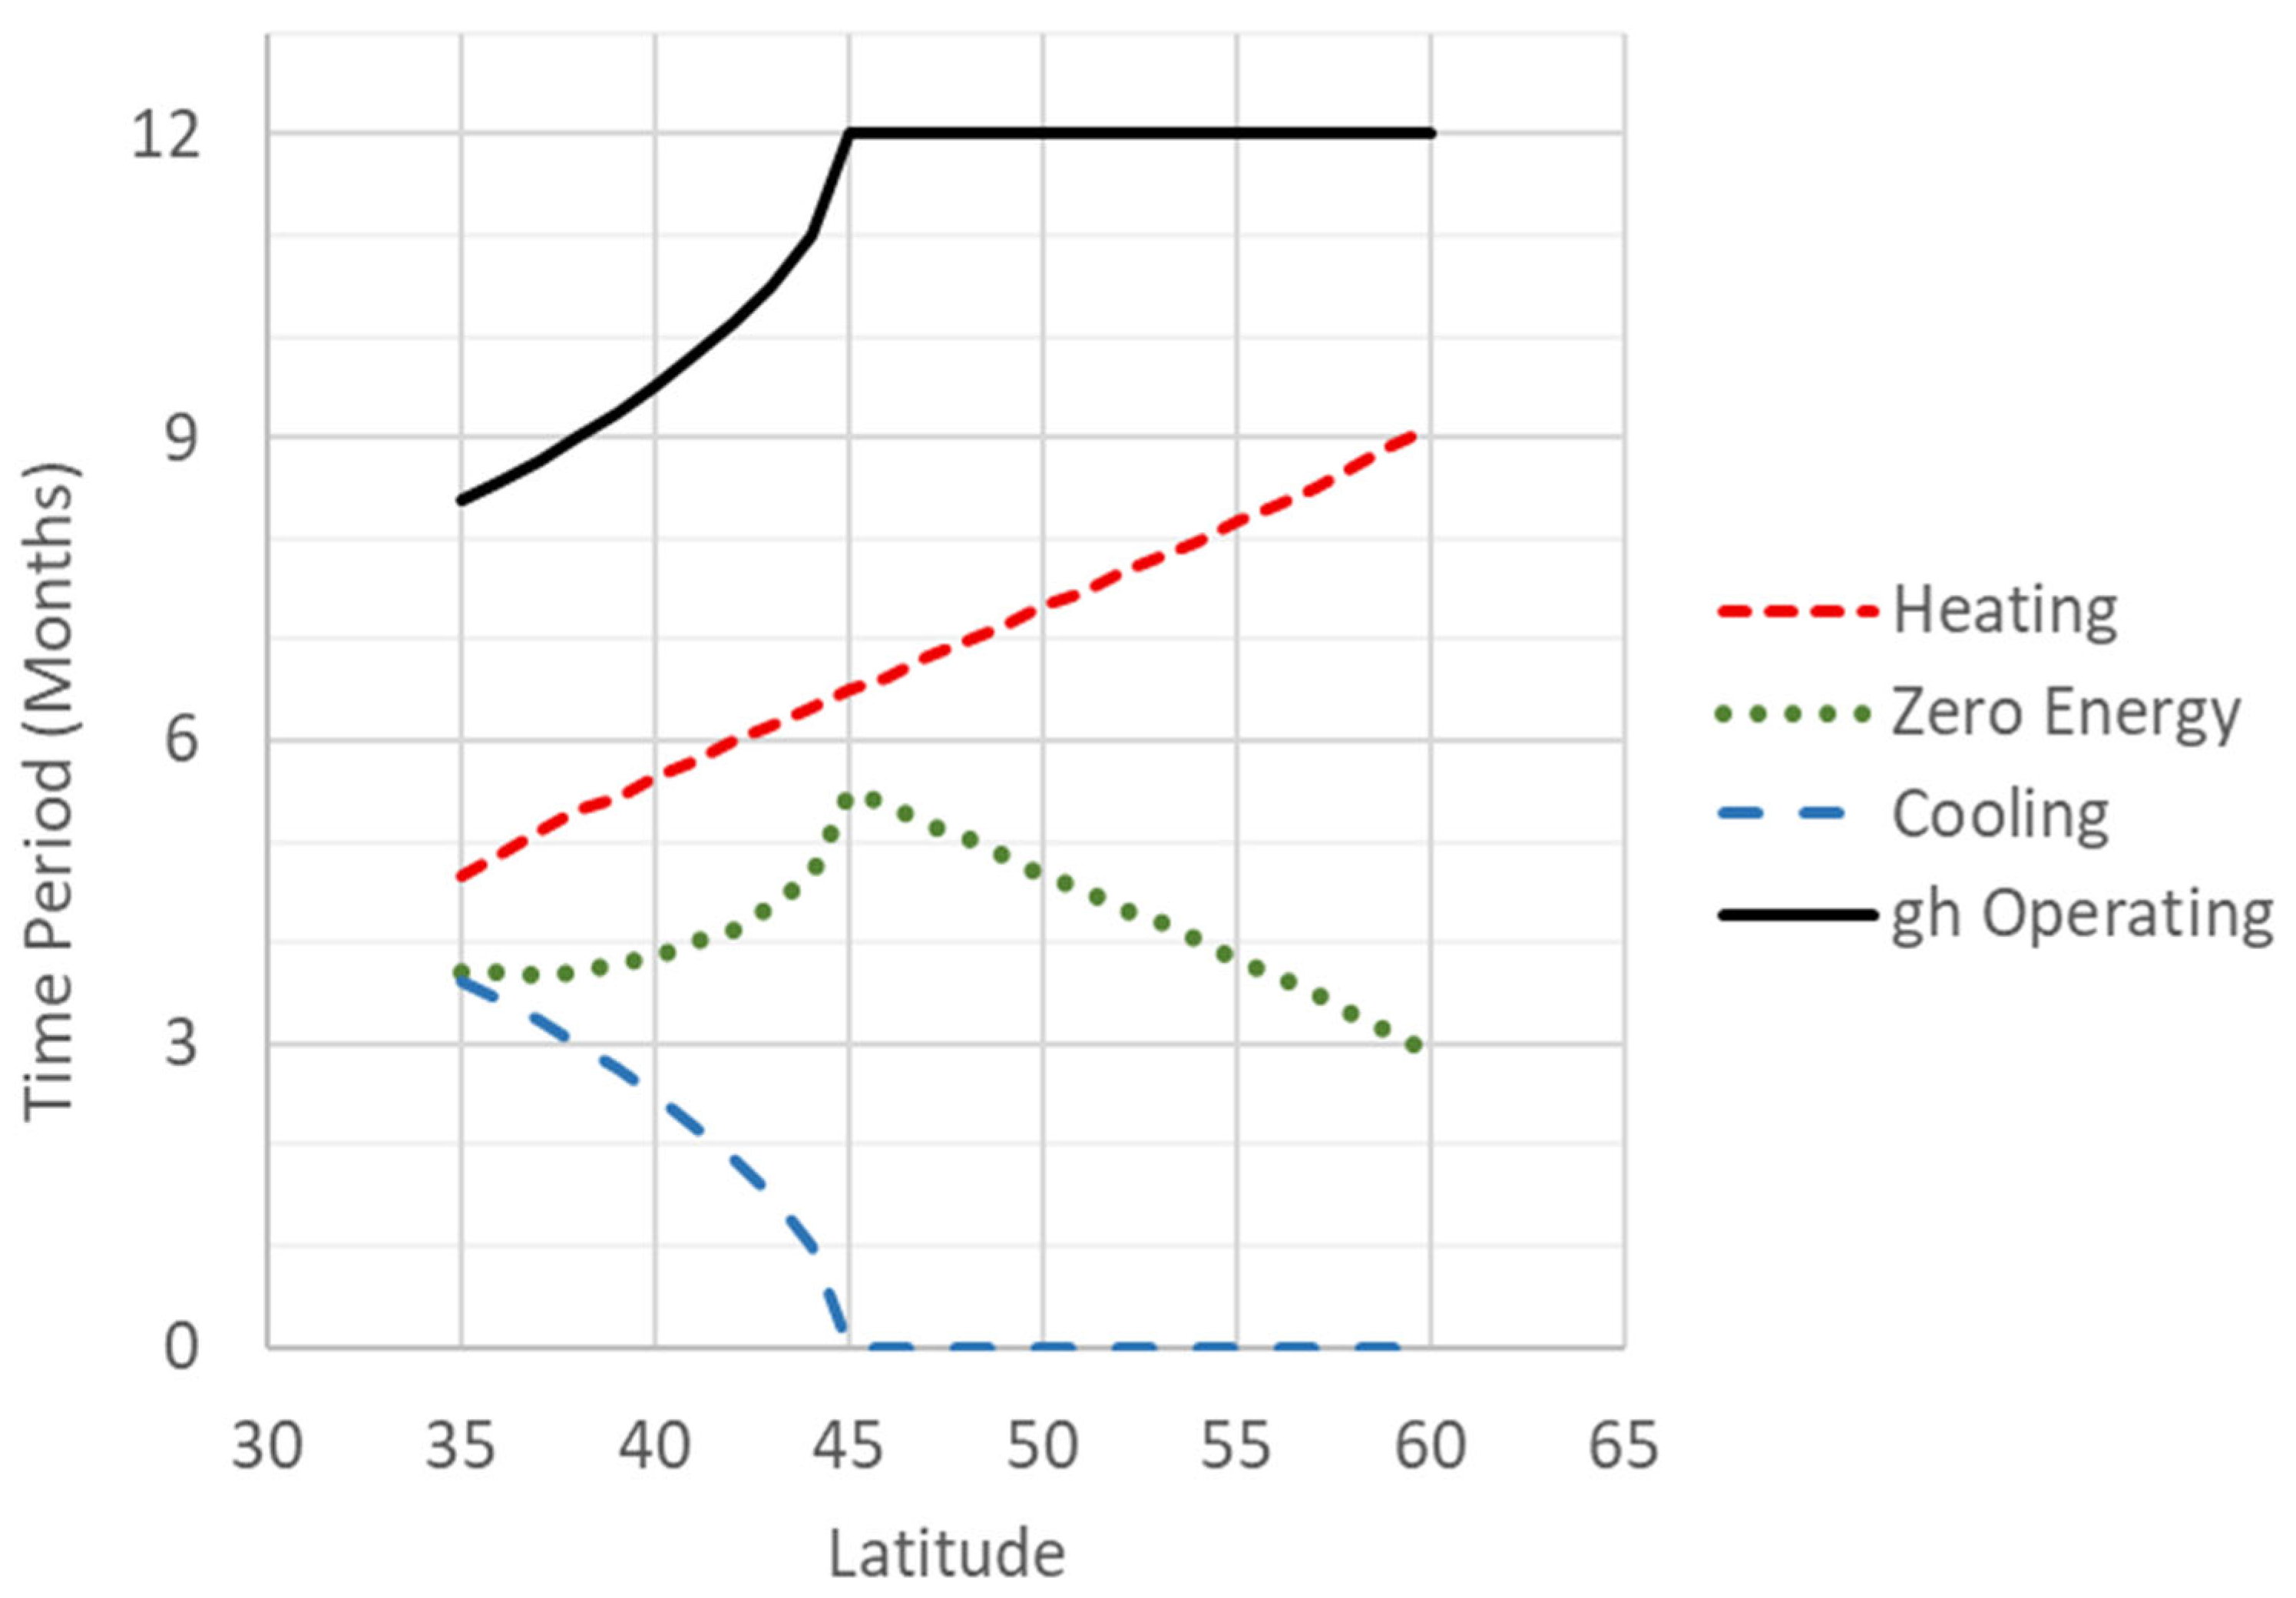
A noticeable discontinuity appears in the presented relationships at latitude 45°, which is attributed to a shift in the greenhouse operating mode. Three distinct energy operation modes are identified: the heating period, the cooling period, and the zero-energy period (neither heating nor cooling required). In practice, greenhouses rarely operate during the cooling period; thus, the effective operational periods are limited to the heating and zero-energy periods.
These modes of operation are presented in Figure 4. Moving from south to north, the duration of the greenhouse’s operational period increases, reaching year-round operation beyond a latitude of 45°. The cogeneration system follows a similar seasonal operation pattern. Above a latitude of 45°, although energy requirements increase, the cogeneration system is unable to fully meet them, leading to a decrease in overall economic performance.
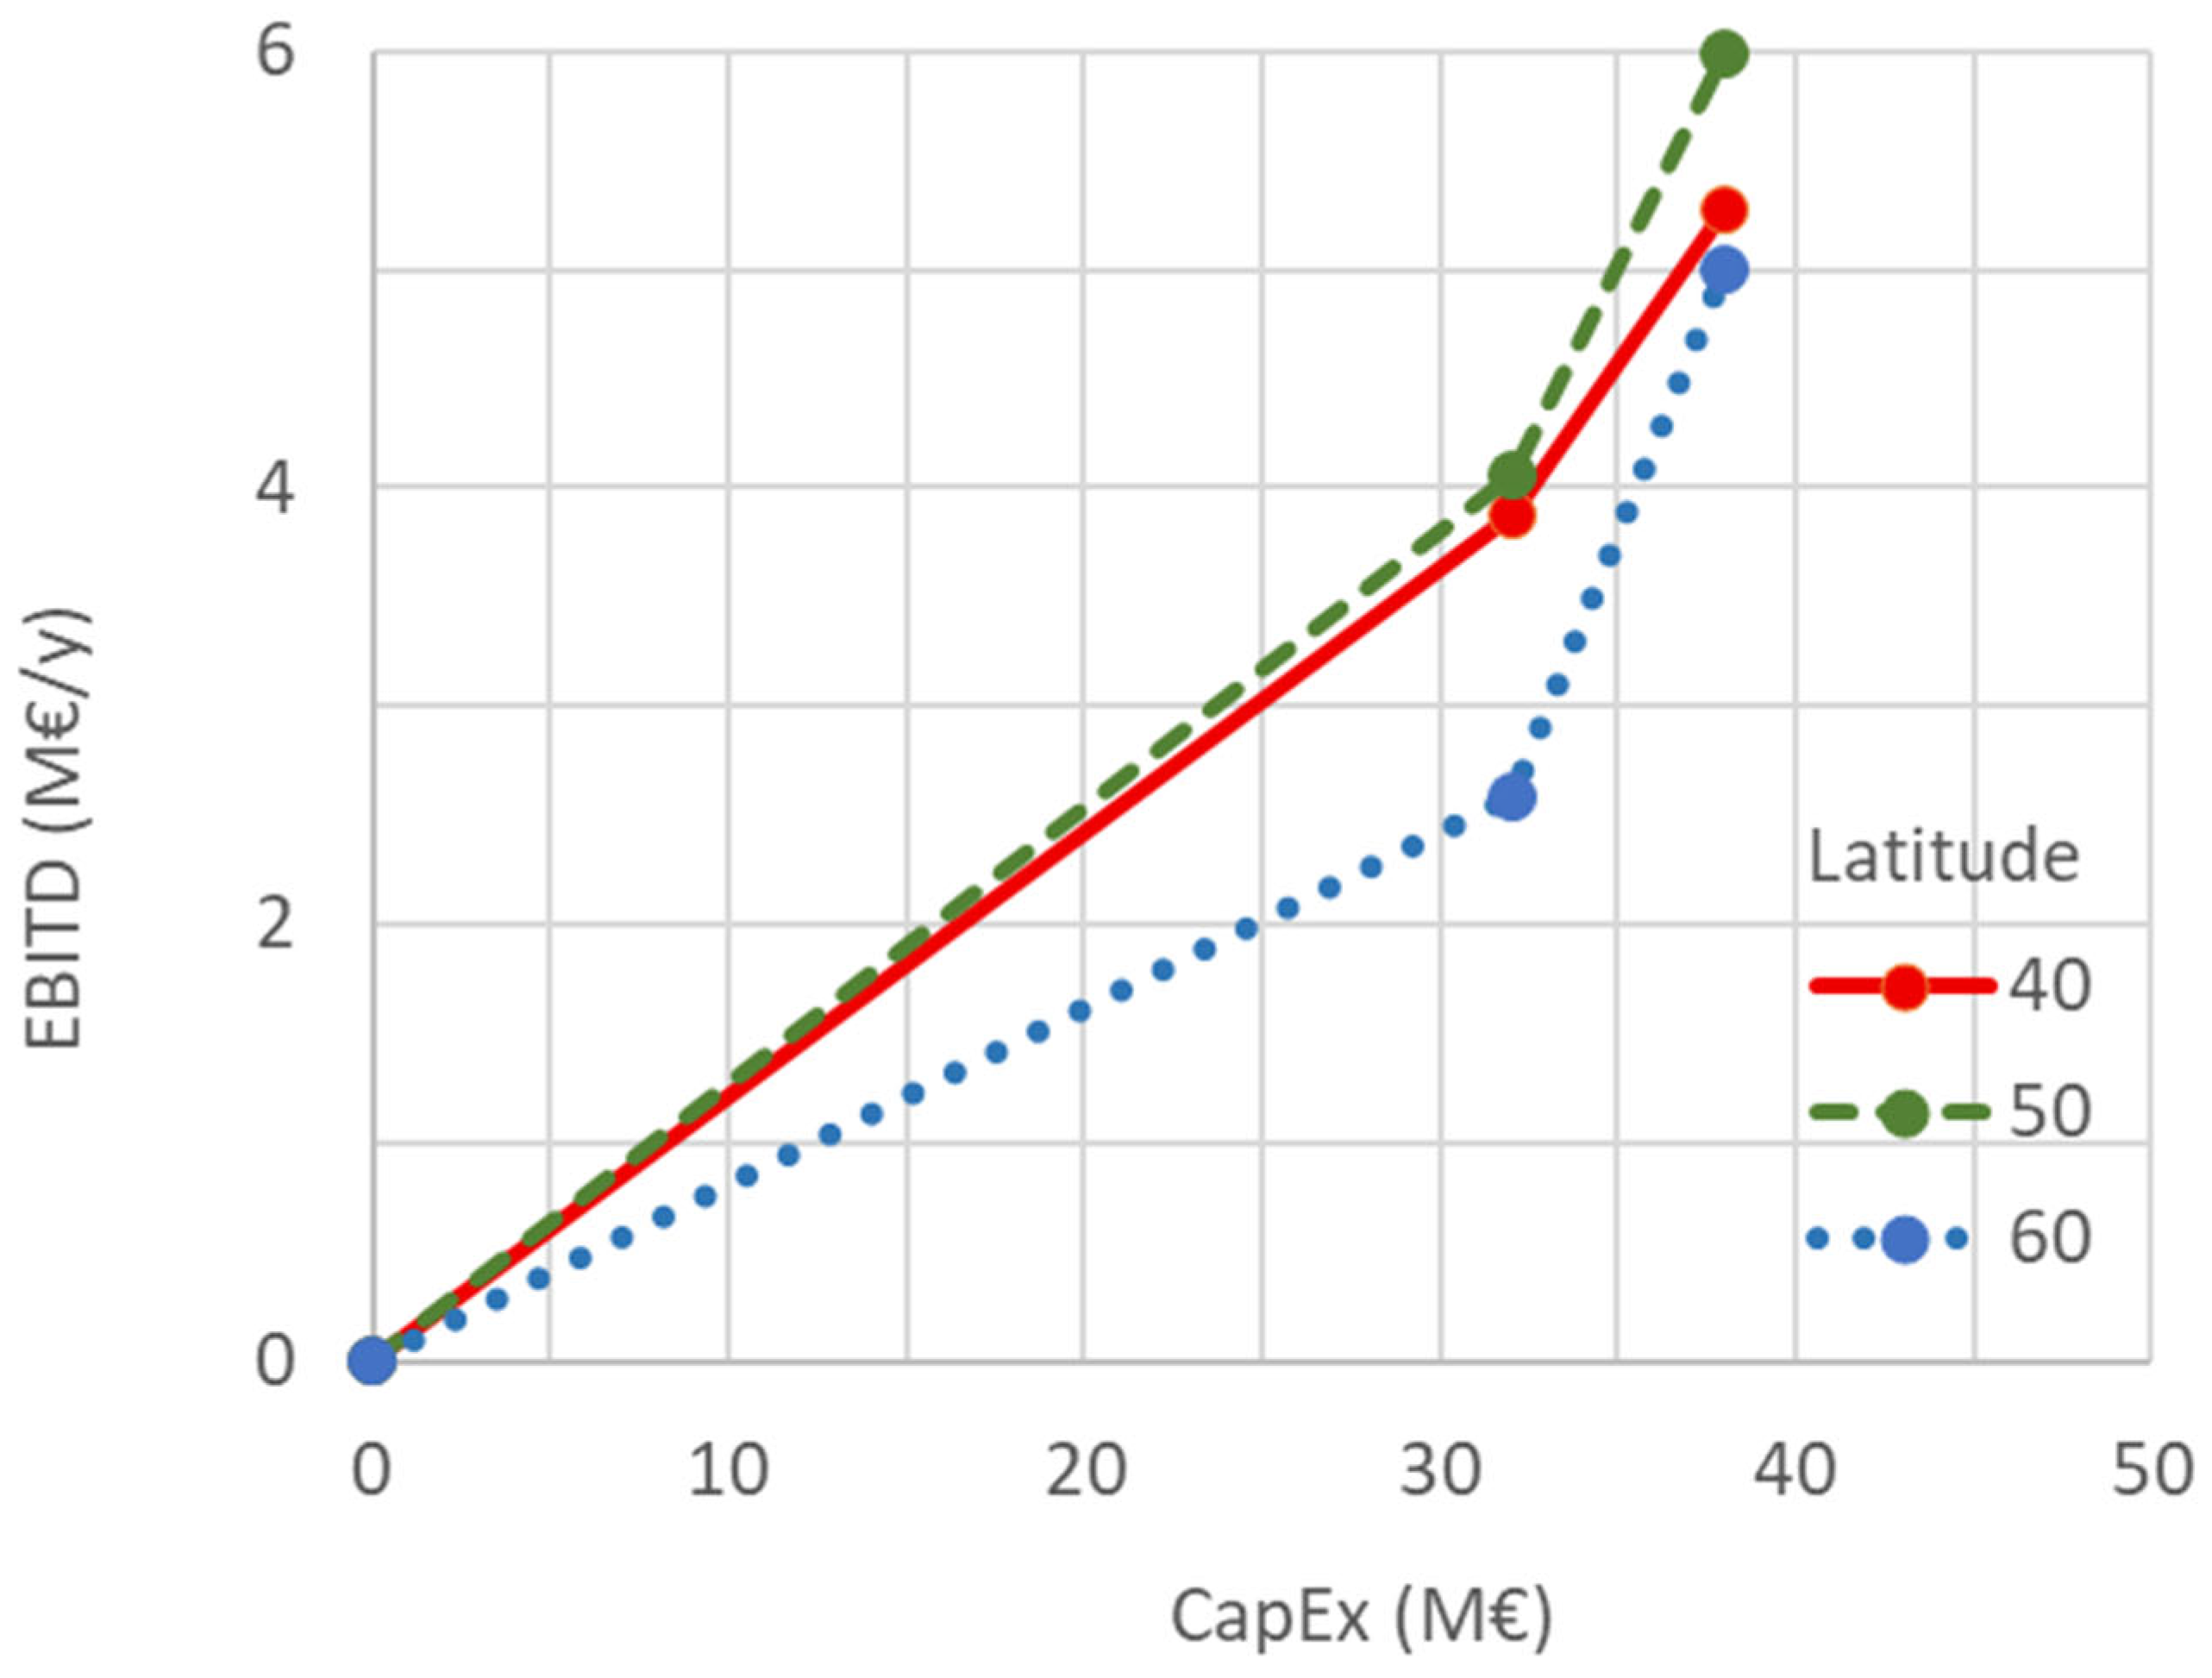
Similar conclusions are confirmed by the CapEx–EBITD diagram presented in Figure 5, further validating that the economic performance of the system declines significantly north of 45° latitude due to increased energy requirements and the substantial contribution of energy costs to the total operating expenses.

3.3. Cogeneration Size Effect

The cogeneration size, expressed in megawatts (MW) of electrical power per cultivated hectare (ha), is a key design variable and one of the most critical factors influencing the economic performance of the greenhouse. Essentially, it determines the extent to which cogeneration contributes to covering the thermal load on the one hand, and to generating electricity as an additional source of income for the greenhouse on the other.
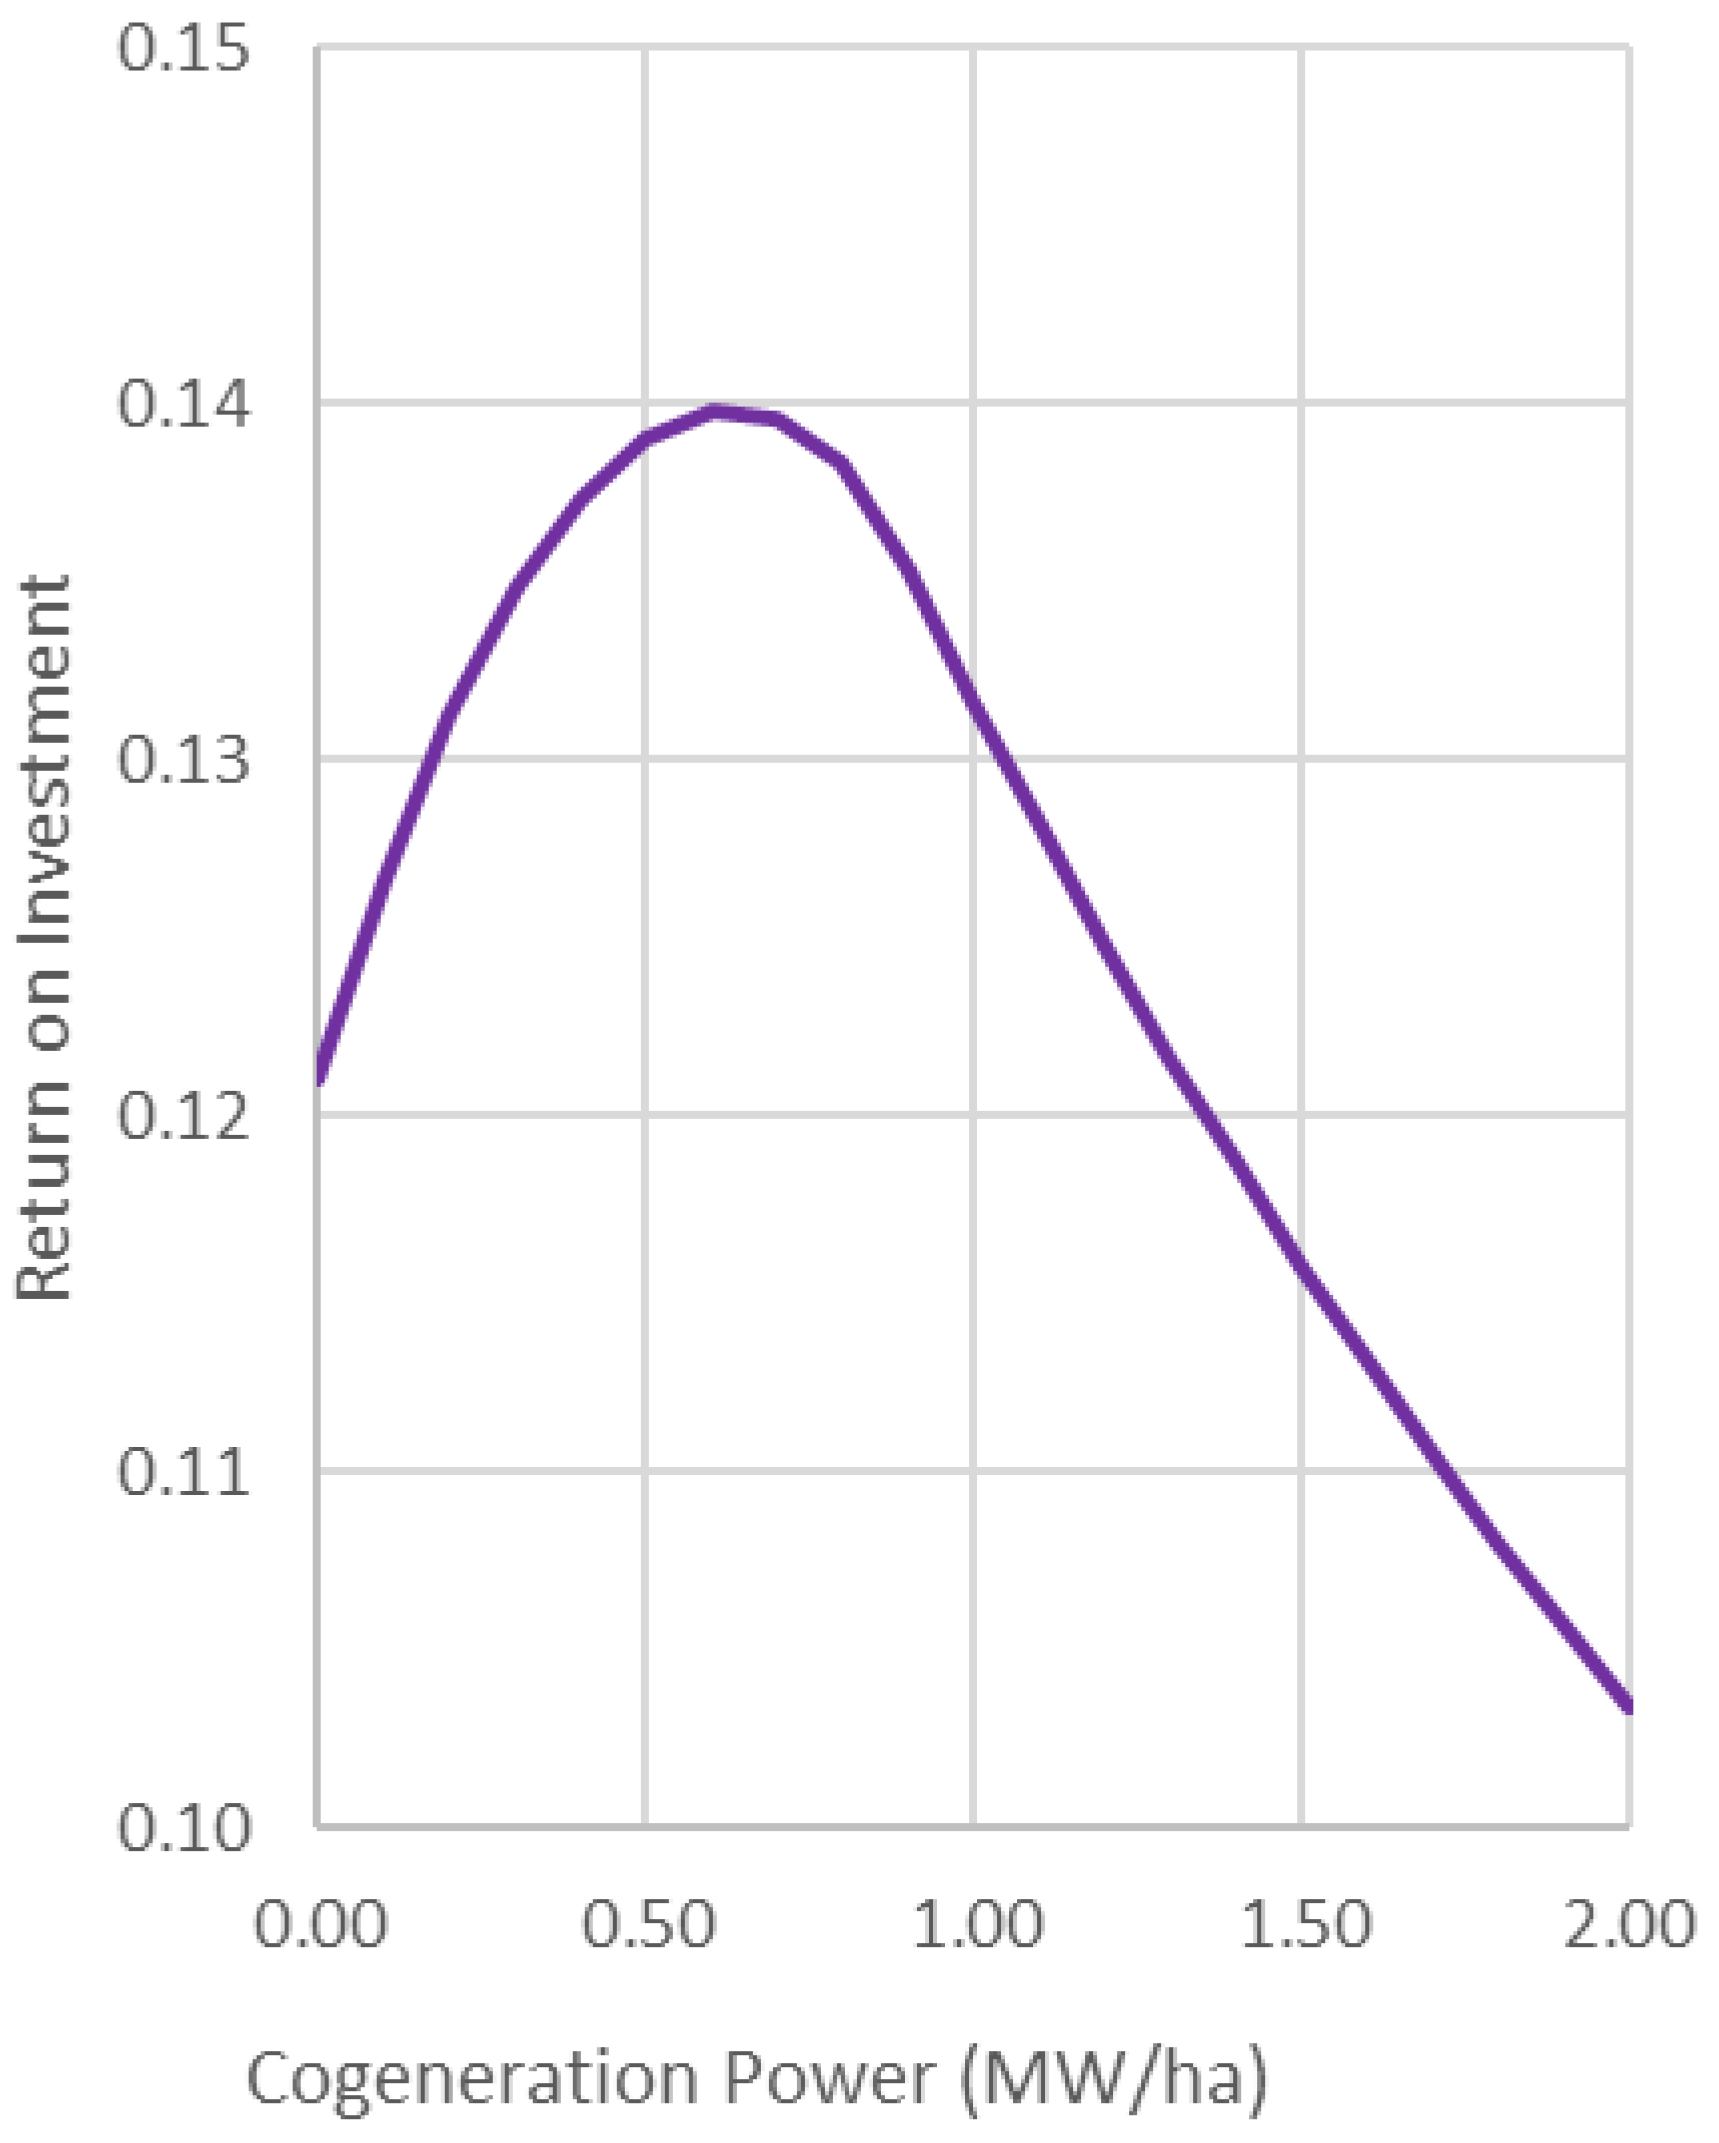
Figure 6 presents the overall economic performance of the greenhouse, in terms of ROI, as a function of cogeneration size, with all other input datasets according to the values listed in Table 2. As shown, increasing cogeneration size initially leads to improved profitability; however, beyond a certain point (the optimum), ROI begins to decline. This is because, at first, the increased size allows for a higher share of the thermal load to be covered, resulting in a positive economic effect, despite the accompanying increase in capital expenditure (CapEx).
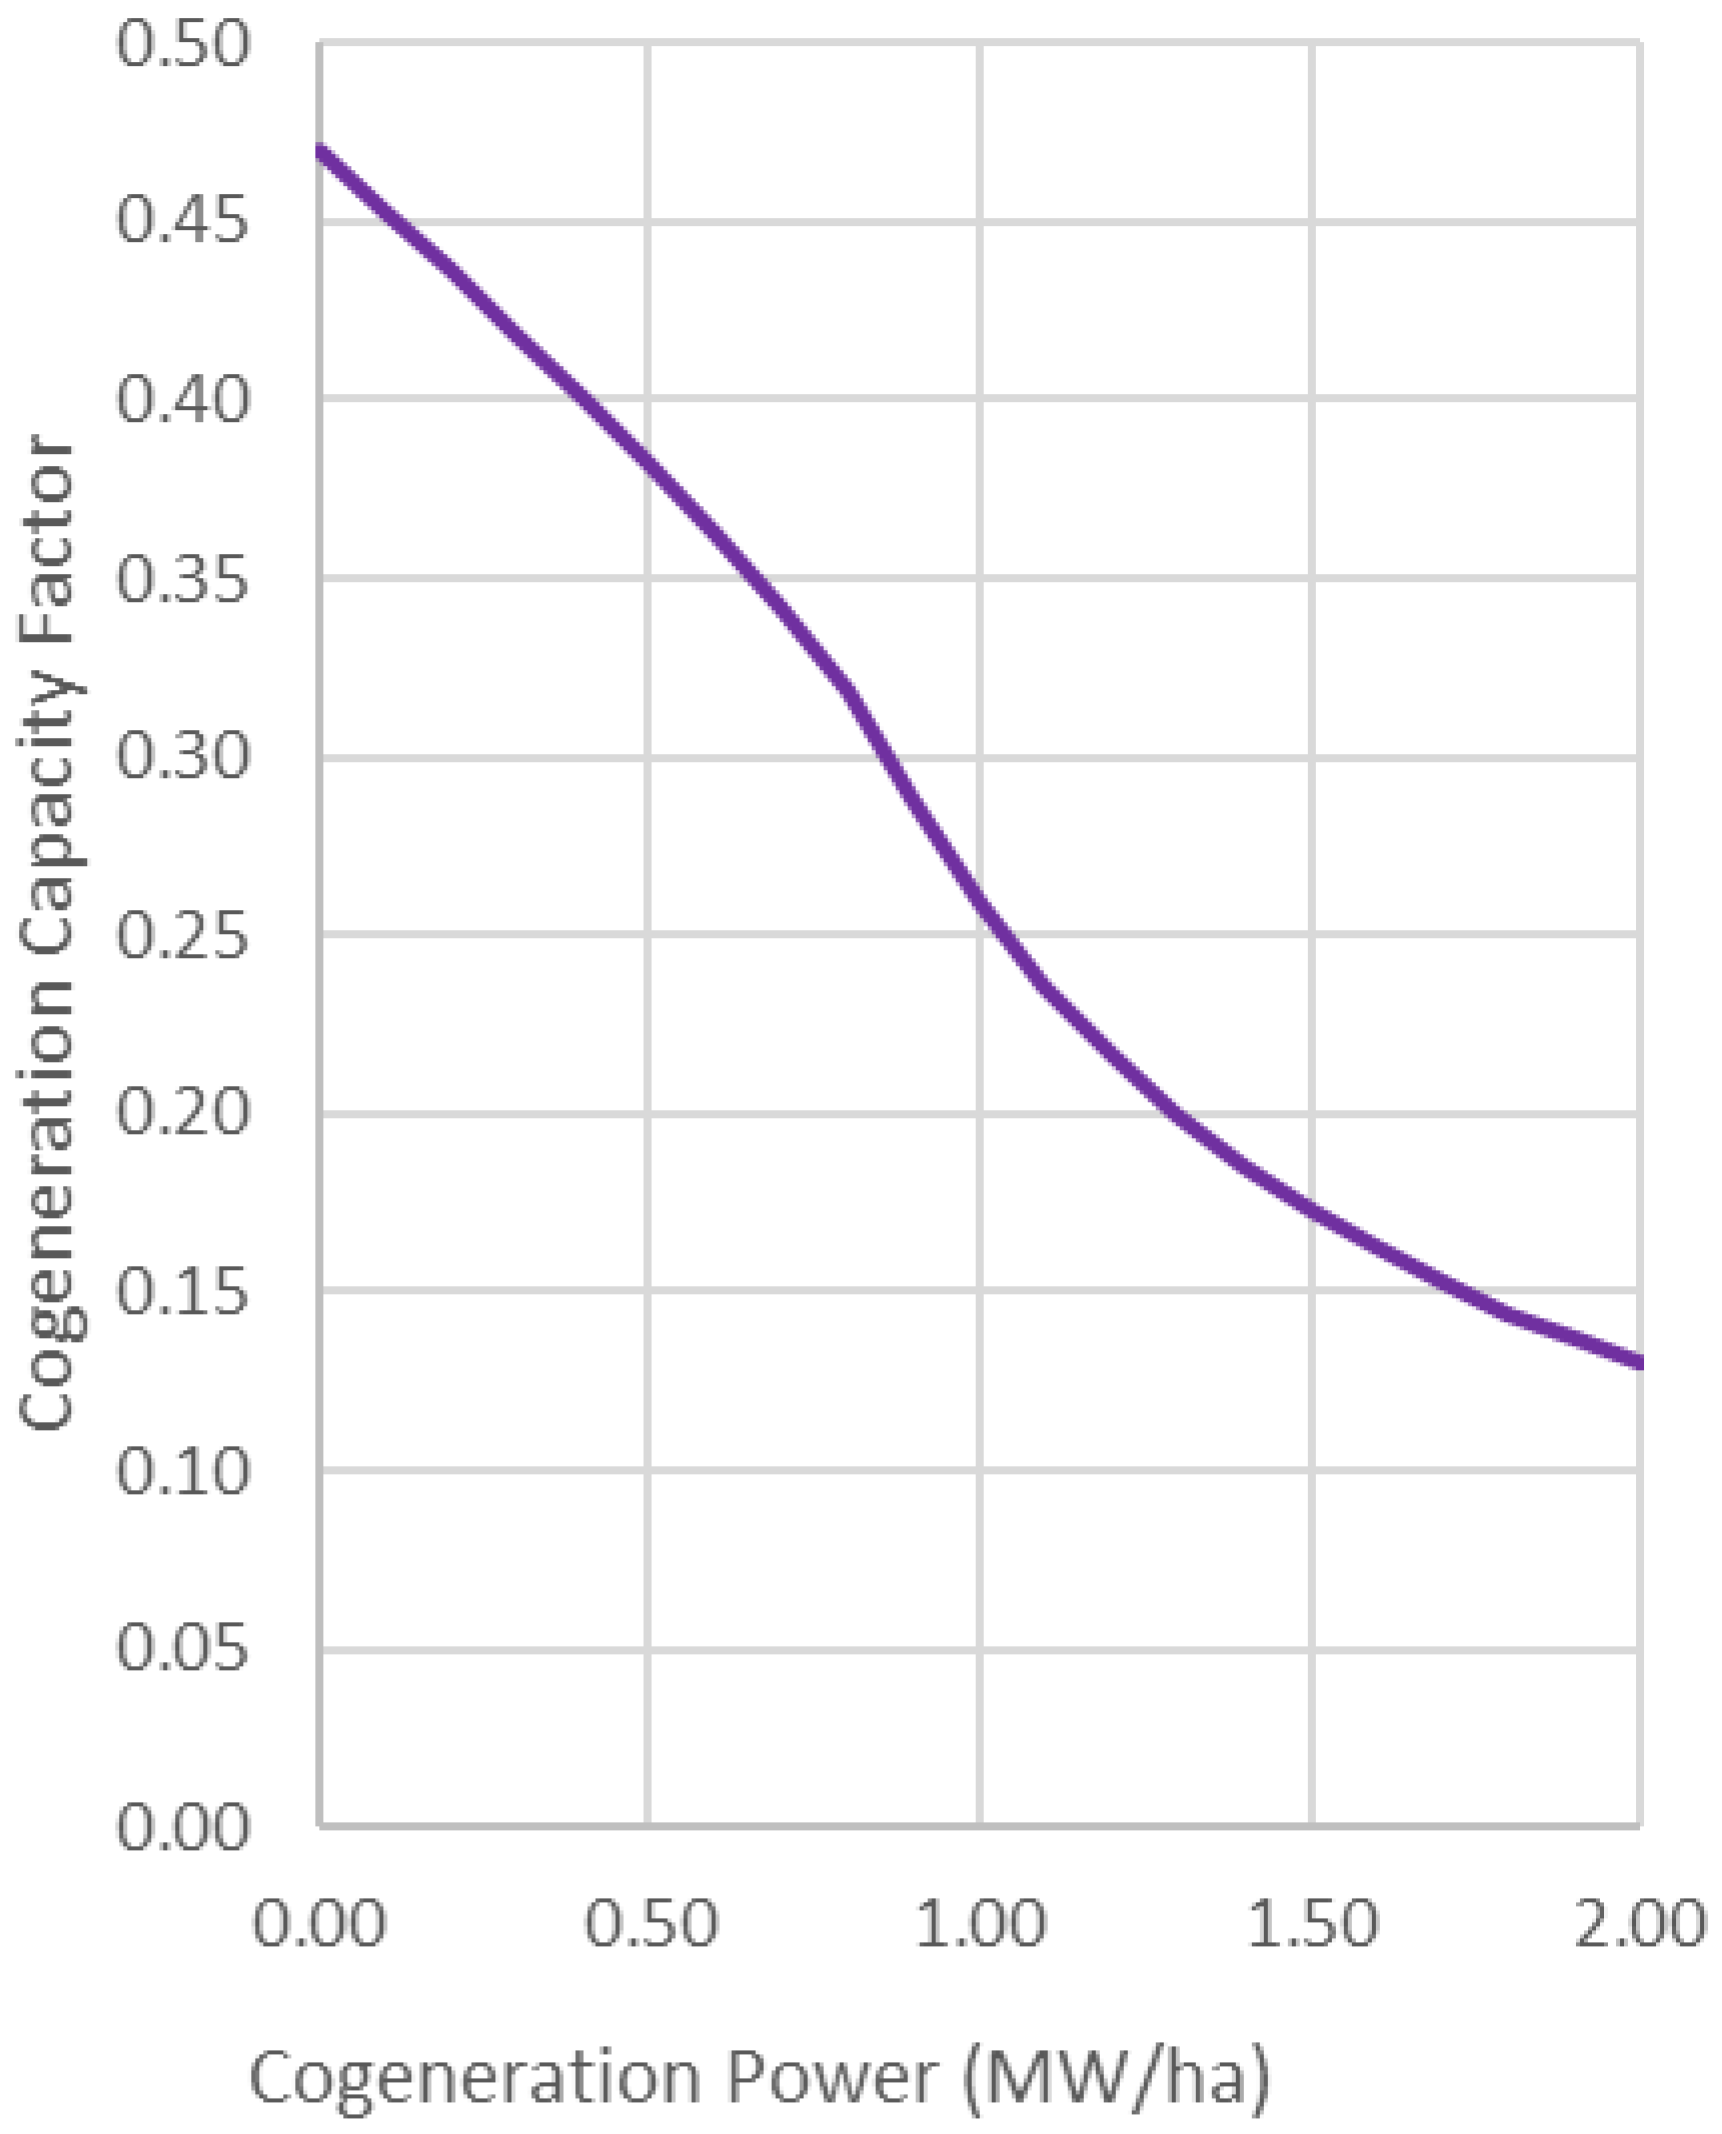
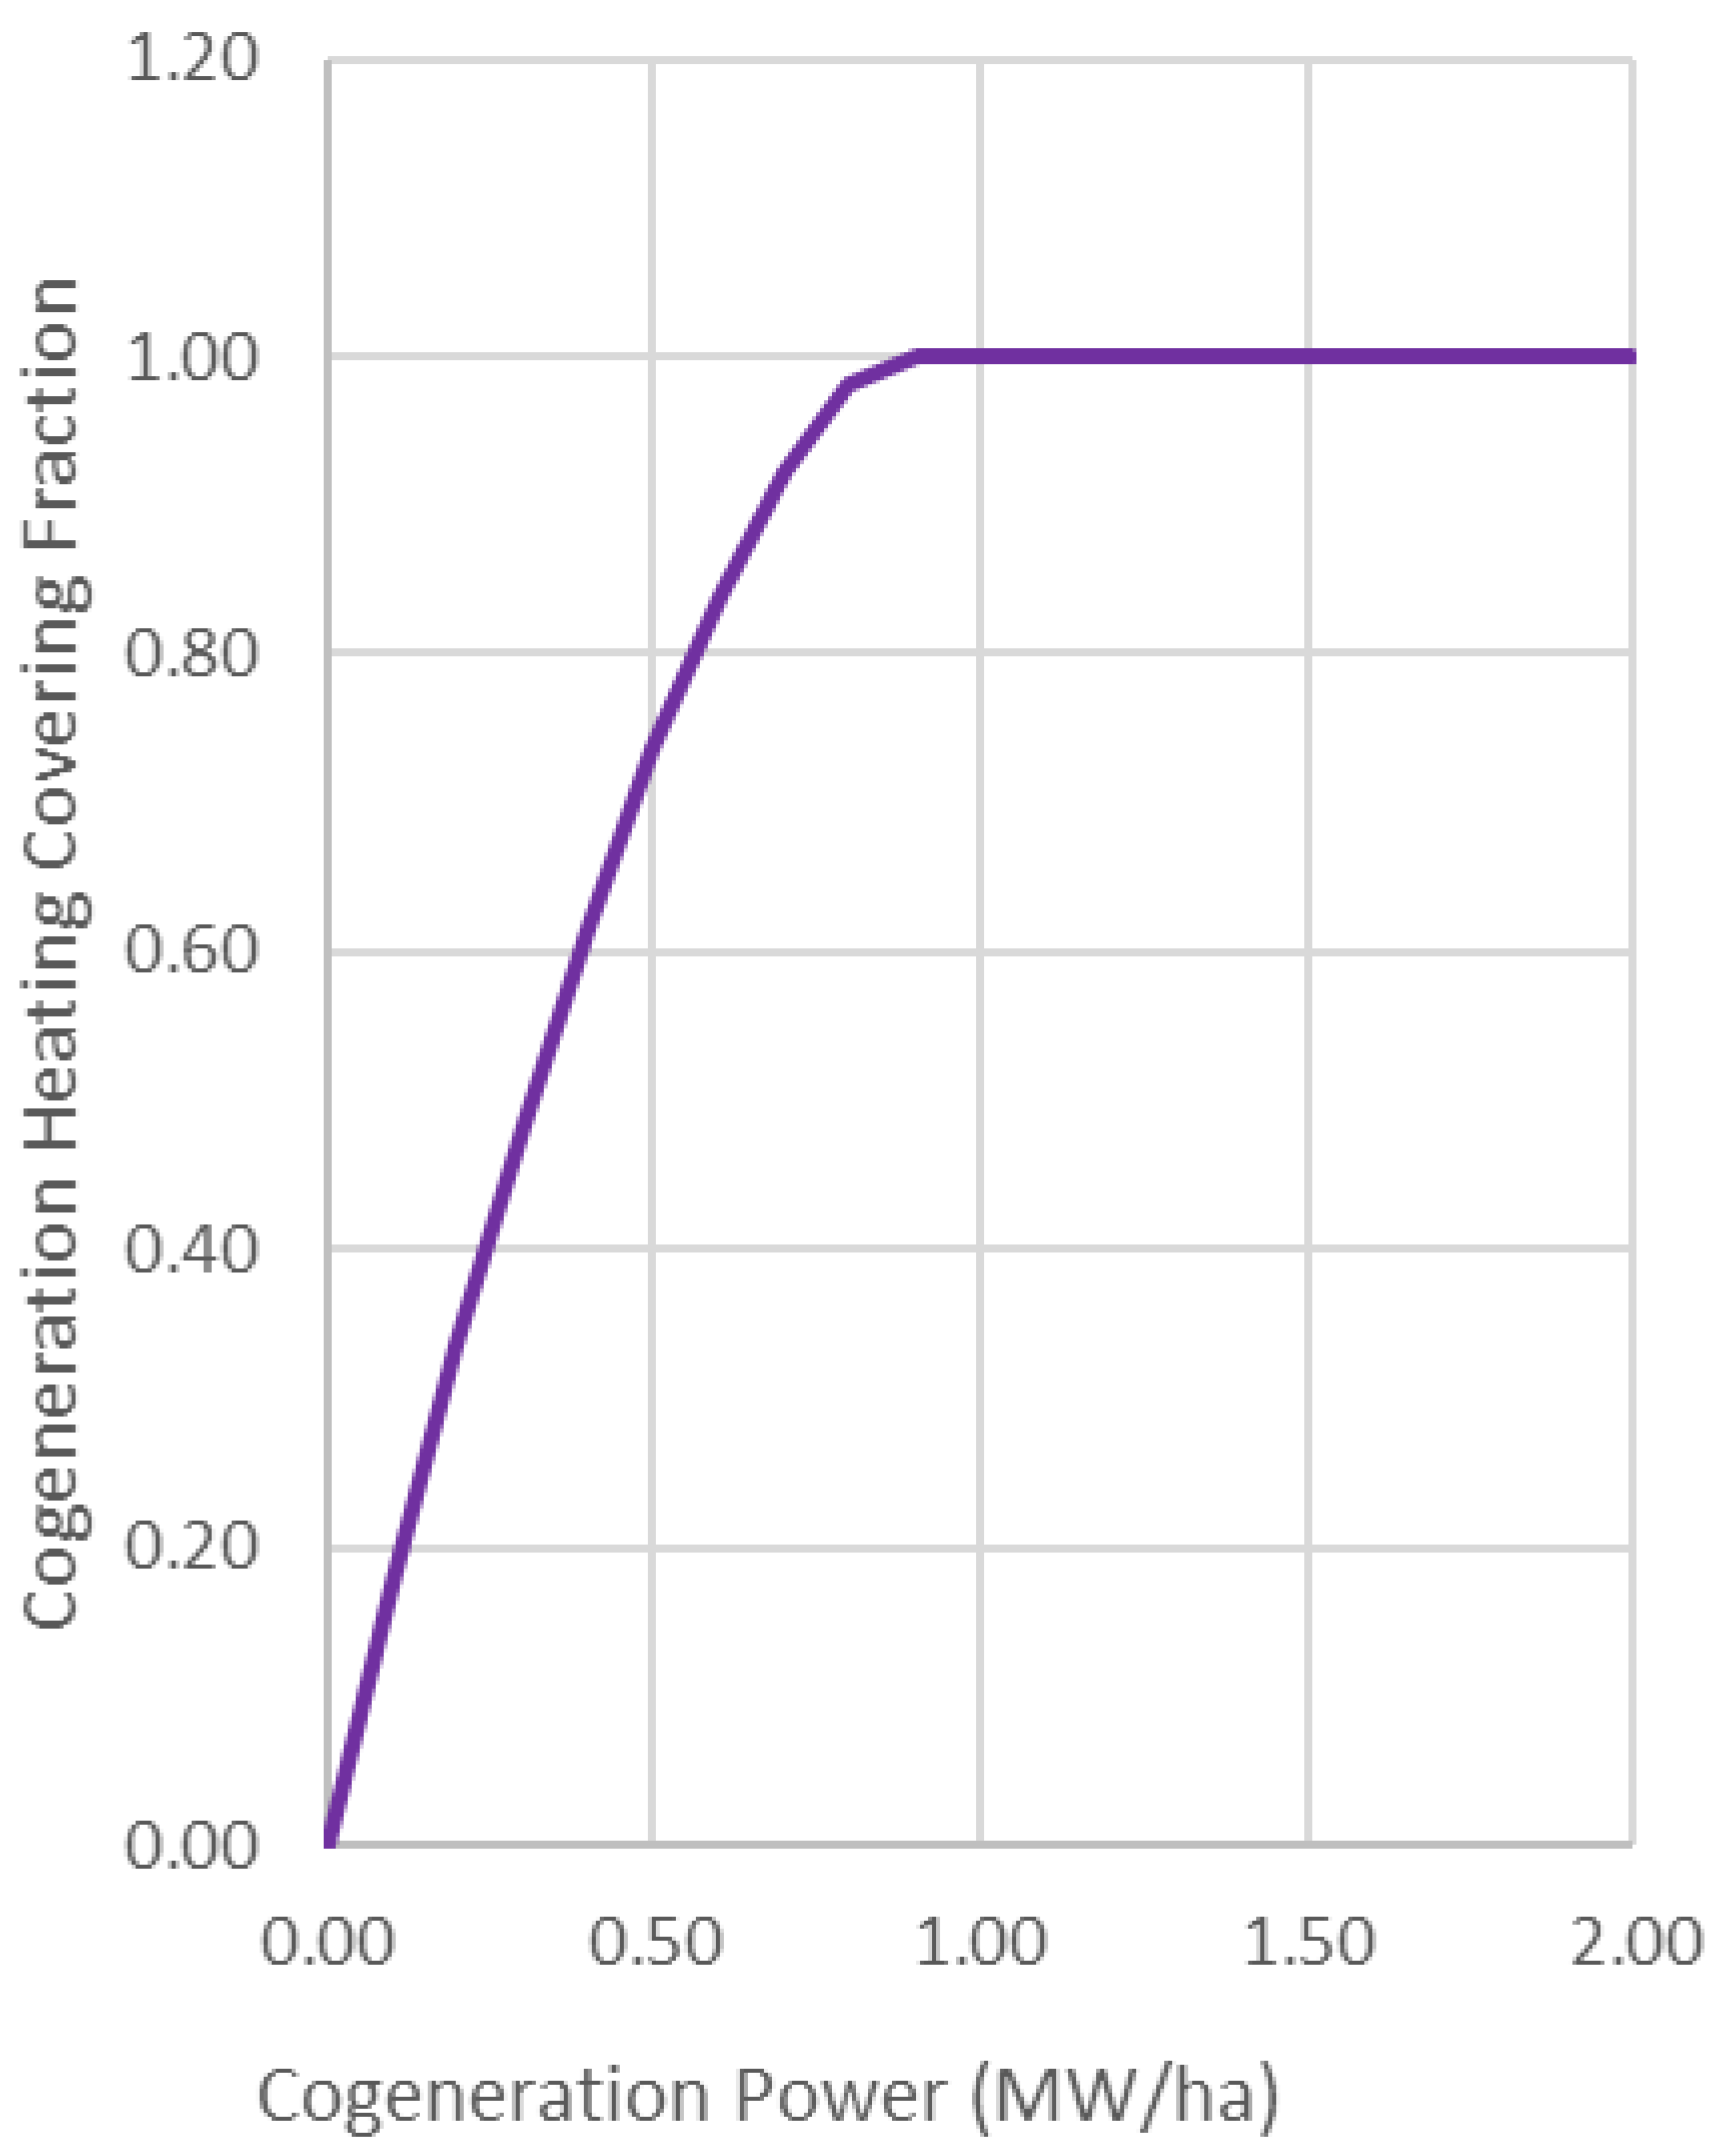
Nevertheless, as capacity continues to grow, the cogeneration unit becomes underutilized, and the negative impact of this inefficiency begins to outweigh the benefits. To clarify this behavior, Figure 7 and Figure 8 are presented. Figure 7 illustrates the Capacity Factor (i.e., the proportion of the year during which the cogeneration system is operational), while Figure 8 shows the percentage of thermal load coverage—both as functions of cogeneration capacity.
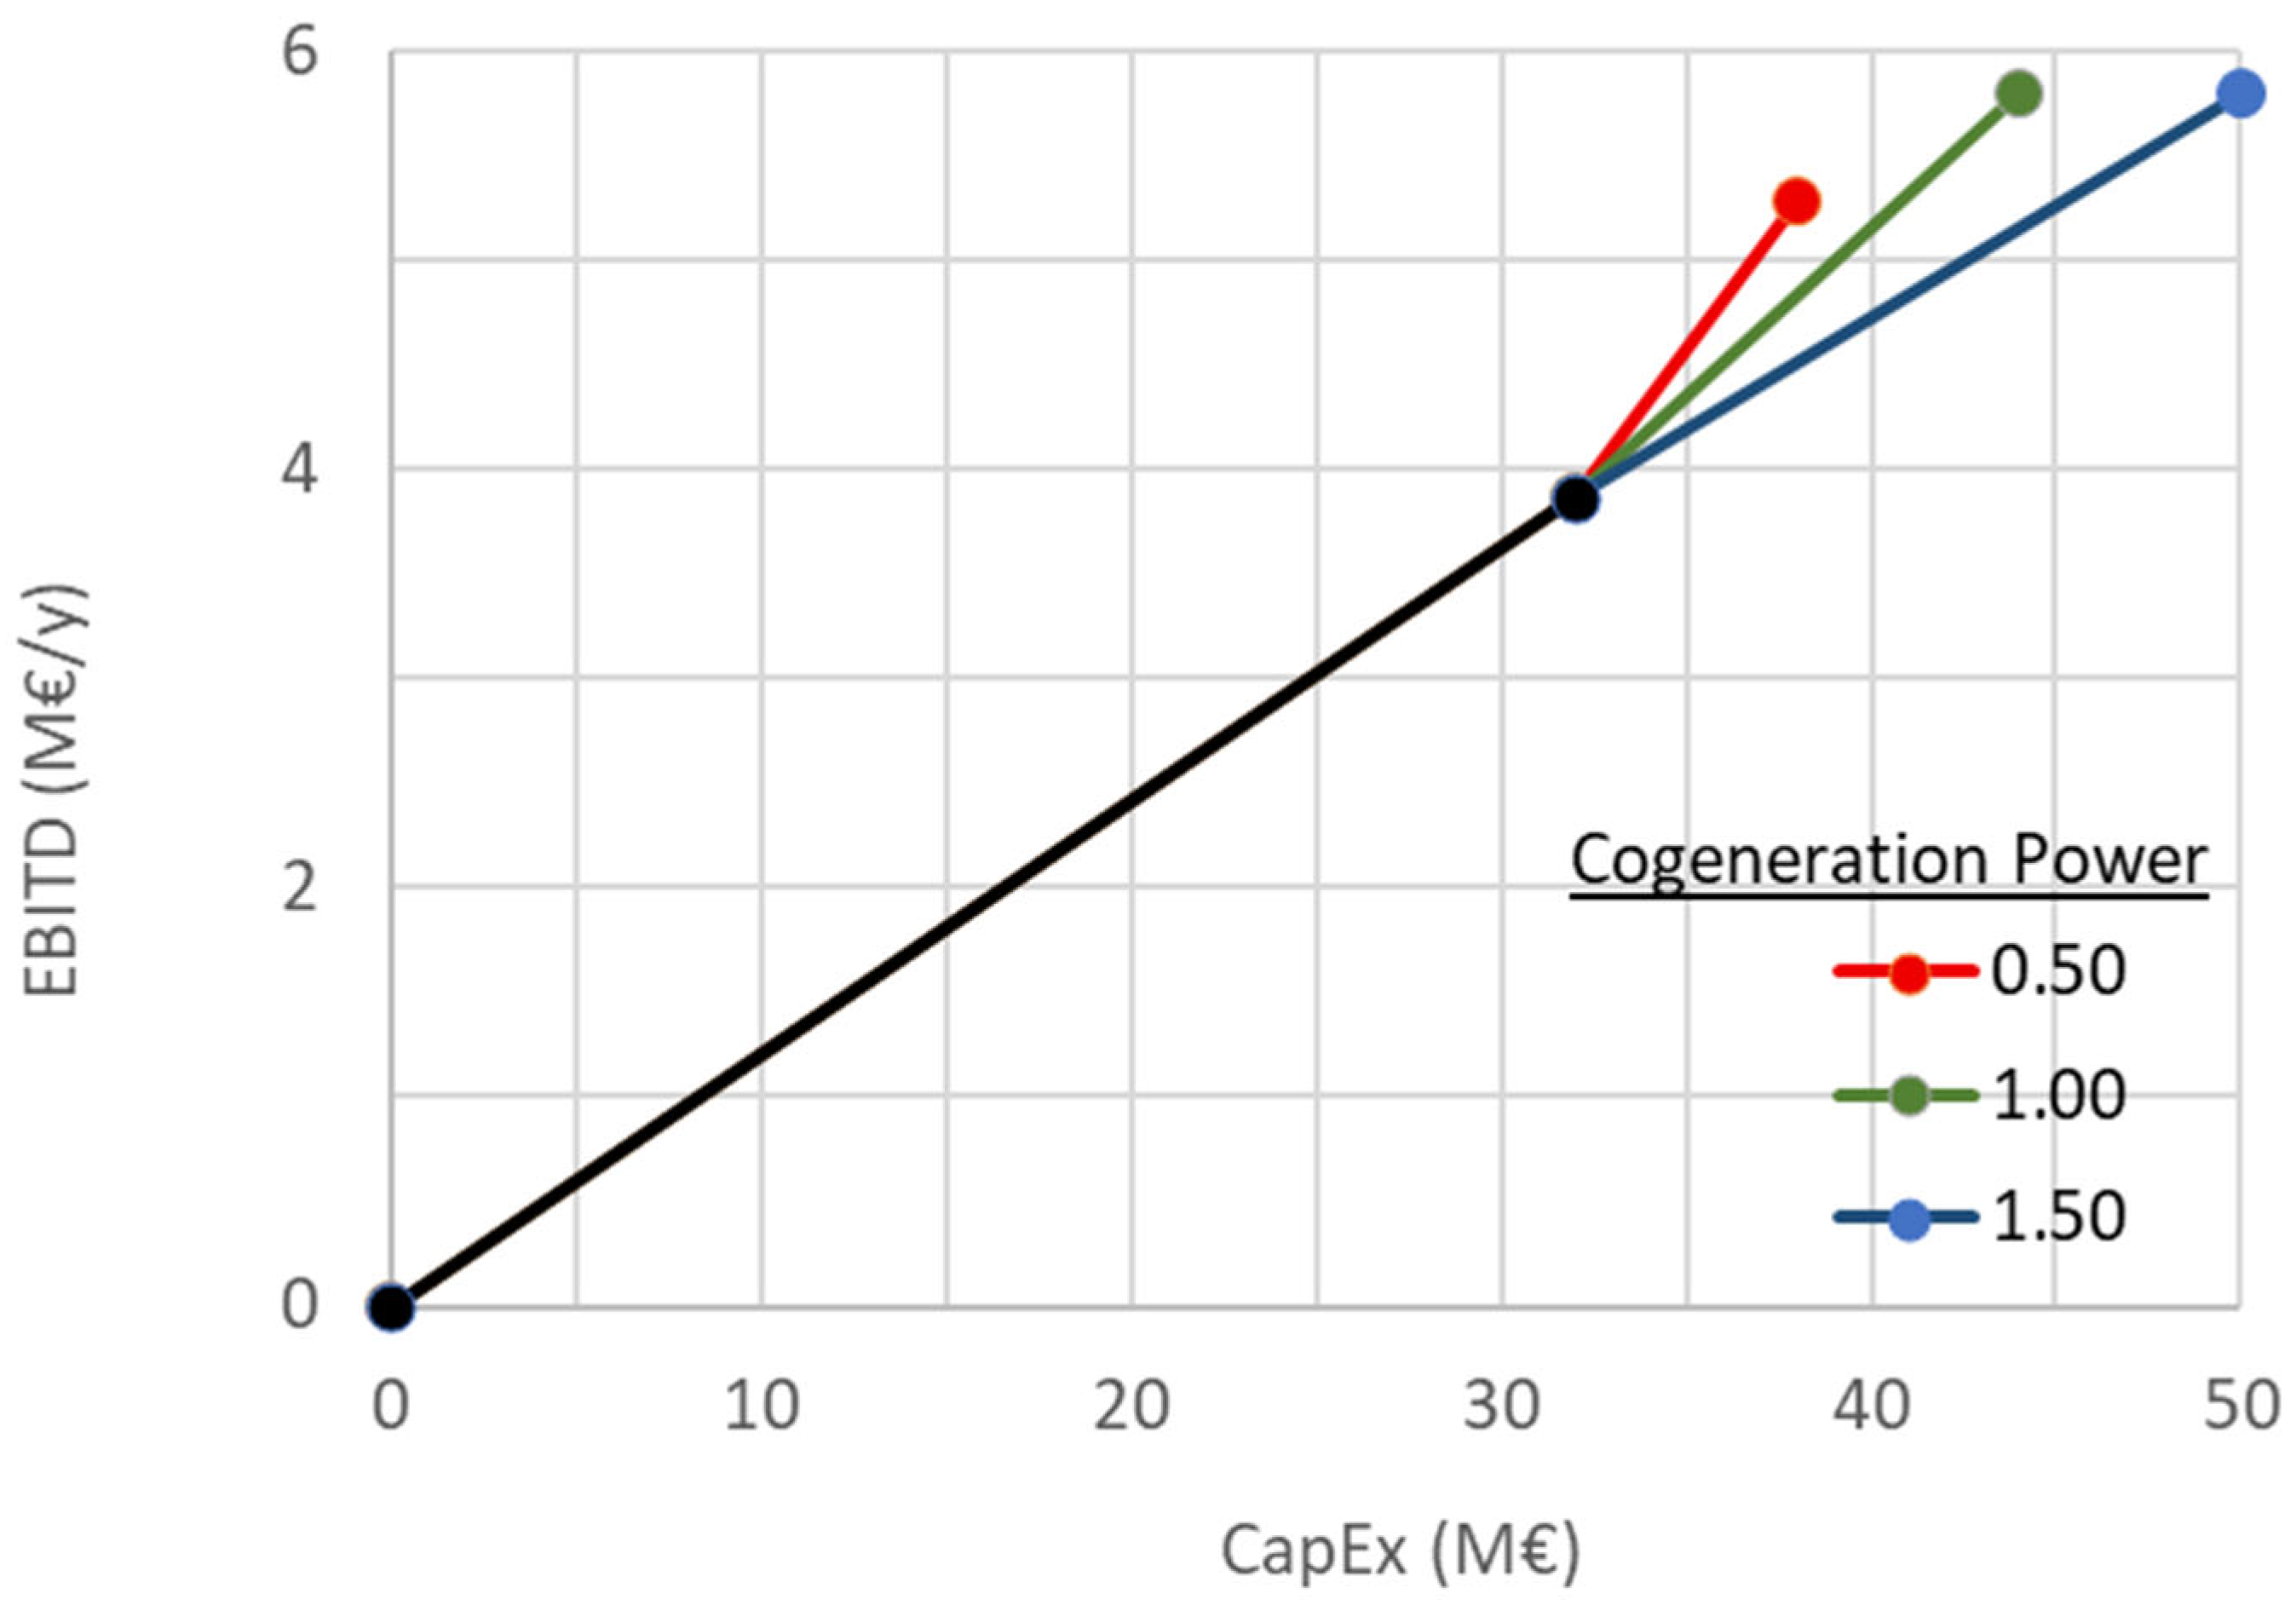
Figure 9 presents the effect of cogeneration size in a CapEx–EBITD diagram, further highlighting its impact on economic performance.
Given that thermal loads vary significantly with latitude, it is reasonable that cogeneration capacity interacts with the greenhouse system differently across locations.
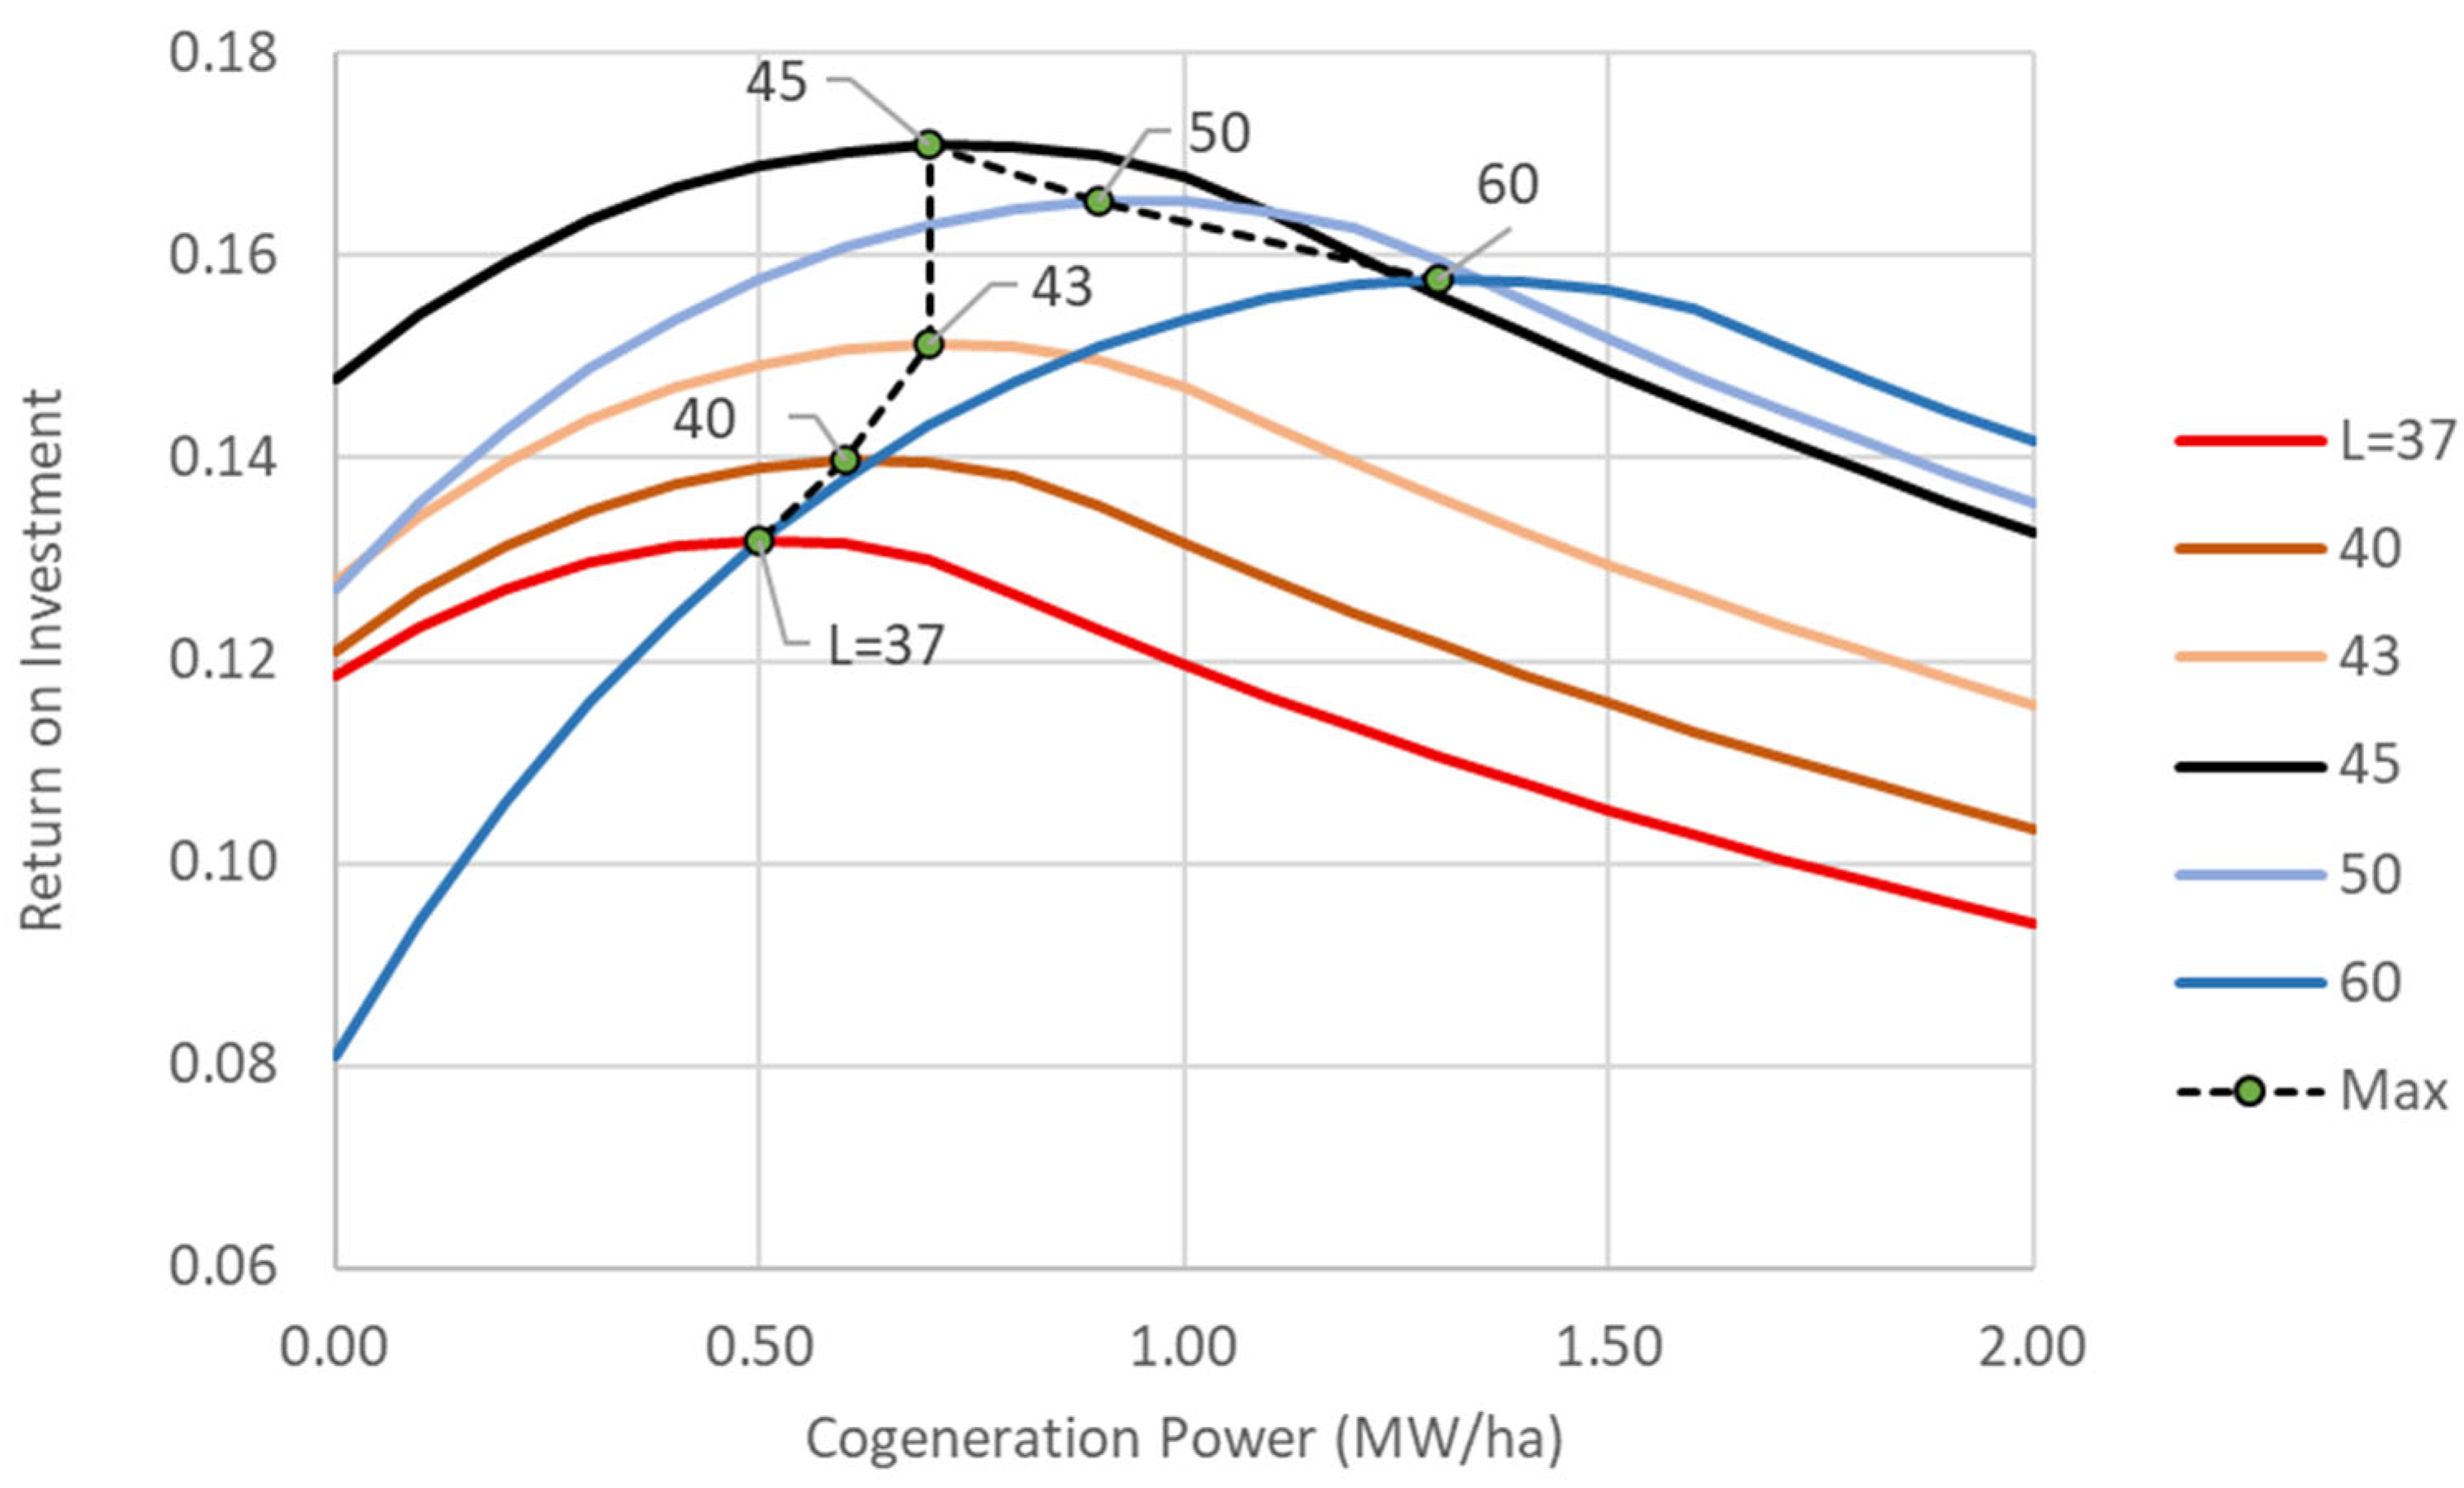
This relationship is illustrated in Figure 10, where the ROI curve from Figure 6 is reproduced for various latitudes.
The diagram also indicates the optimal cogeneration capacities corresponding to each latitude, clearly demonstrating that these optimal capacities are latitude-dependent. For example, at latitude 37°, the optimal cogeneration size is 0.5 MW/ha, while at latitude 60° it increases to 1.30 MW/ha.
Consistent with the conclusions of Section 3.2, the optimal capacities increase up to approximately latitude 45°, and then decrease beyond that point, for the reasons previously discussed.

3.4. Cultivation Conditions Effect

Energy consumption depends not only on meteorological conditions (e.g., the effect of latitude) but also on the cultivation requirements (i.e., crop type). Therefore, this section examines the role of cultivation requirements in the economic performance (ROI) of the greenhouse. Cultivation conditions are defined by the average cultivation temperature and the acceptable temperature variation range.
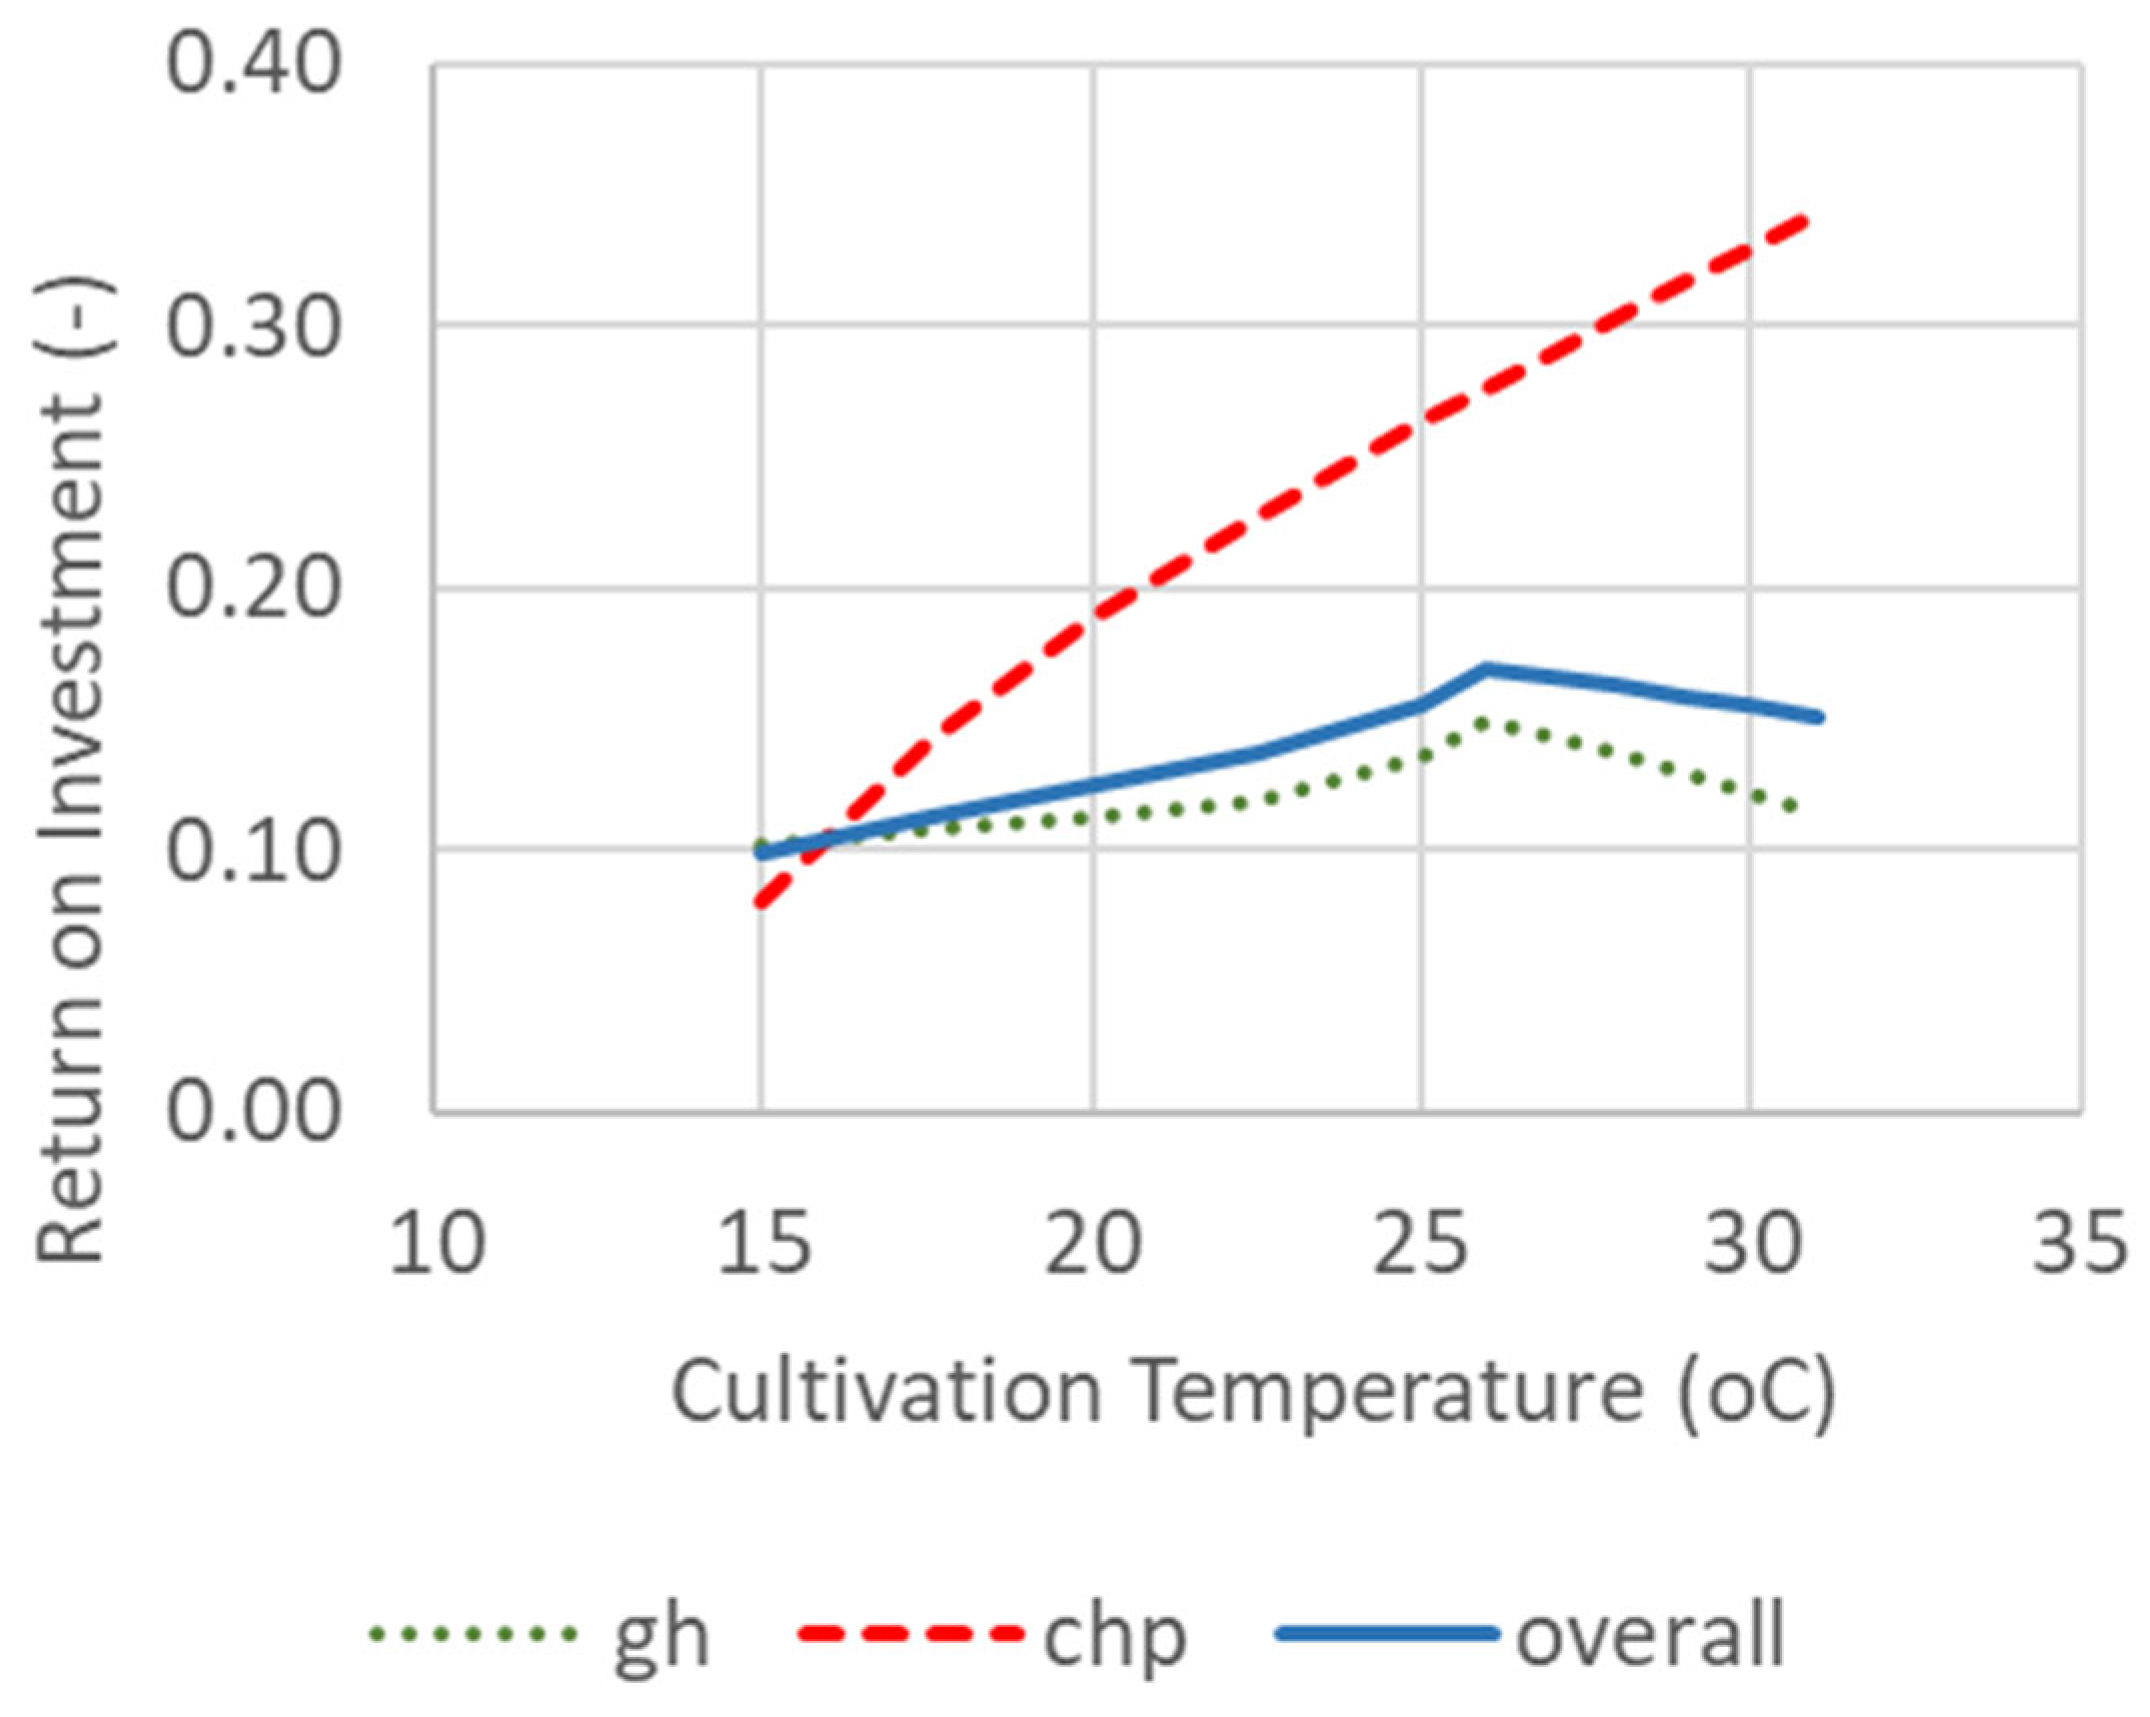
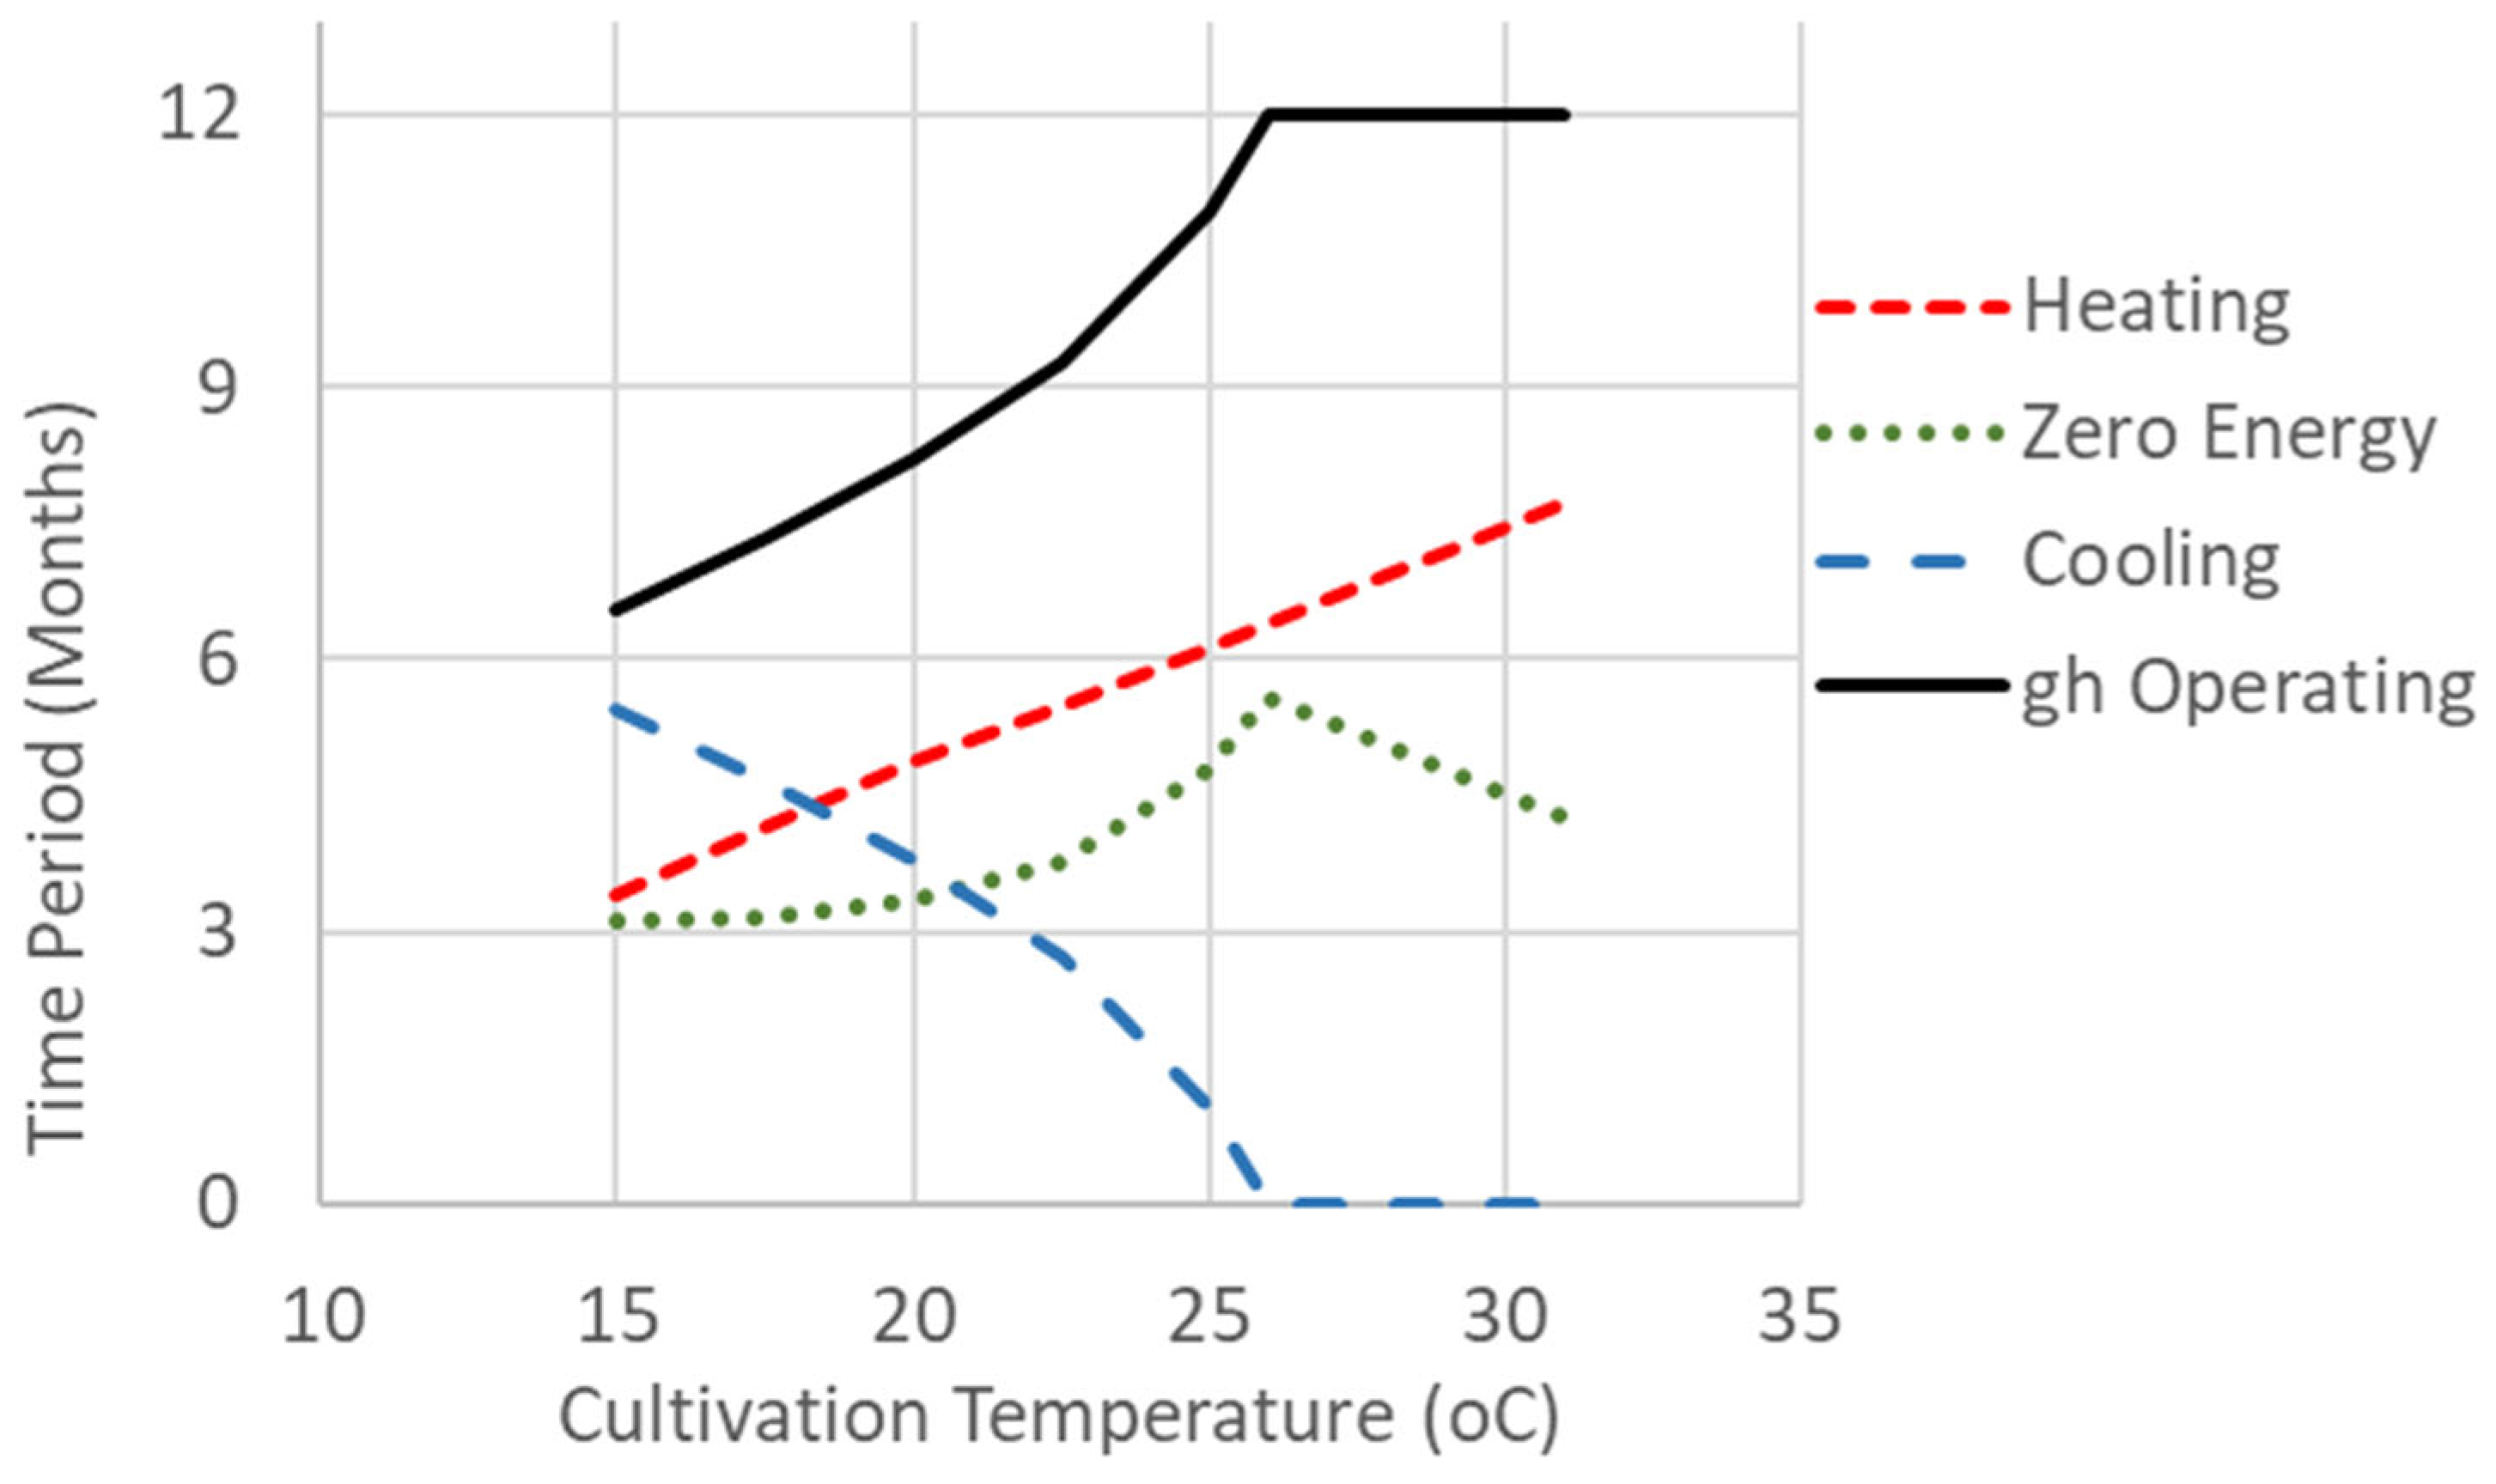
Figure 11 shows the greenhouse economic performance as a function of the average cultivation temperature. The observed behavior resembles the effect of latitude (Figure 3), which determines the average outdoor ambient temperature around the greenhouse. Similarly, as the cultivation temperature increases, heating demand rises (mainly in winter), while cooling demand decreases (mainly in summer). This results in a redistribution of operating modes. Beyond a certain temperature, cooling becomes unnecessary, and the ROI reaches a maximum. This redistribution of operating modes is illustrated in Figure 12, which is similar to Figure 4.
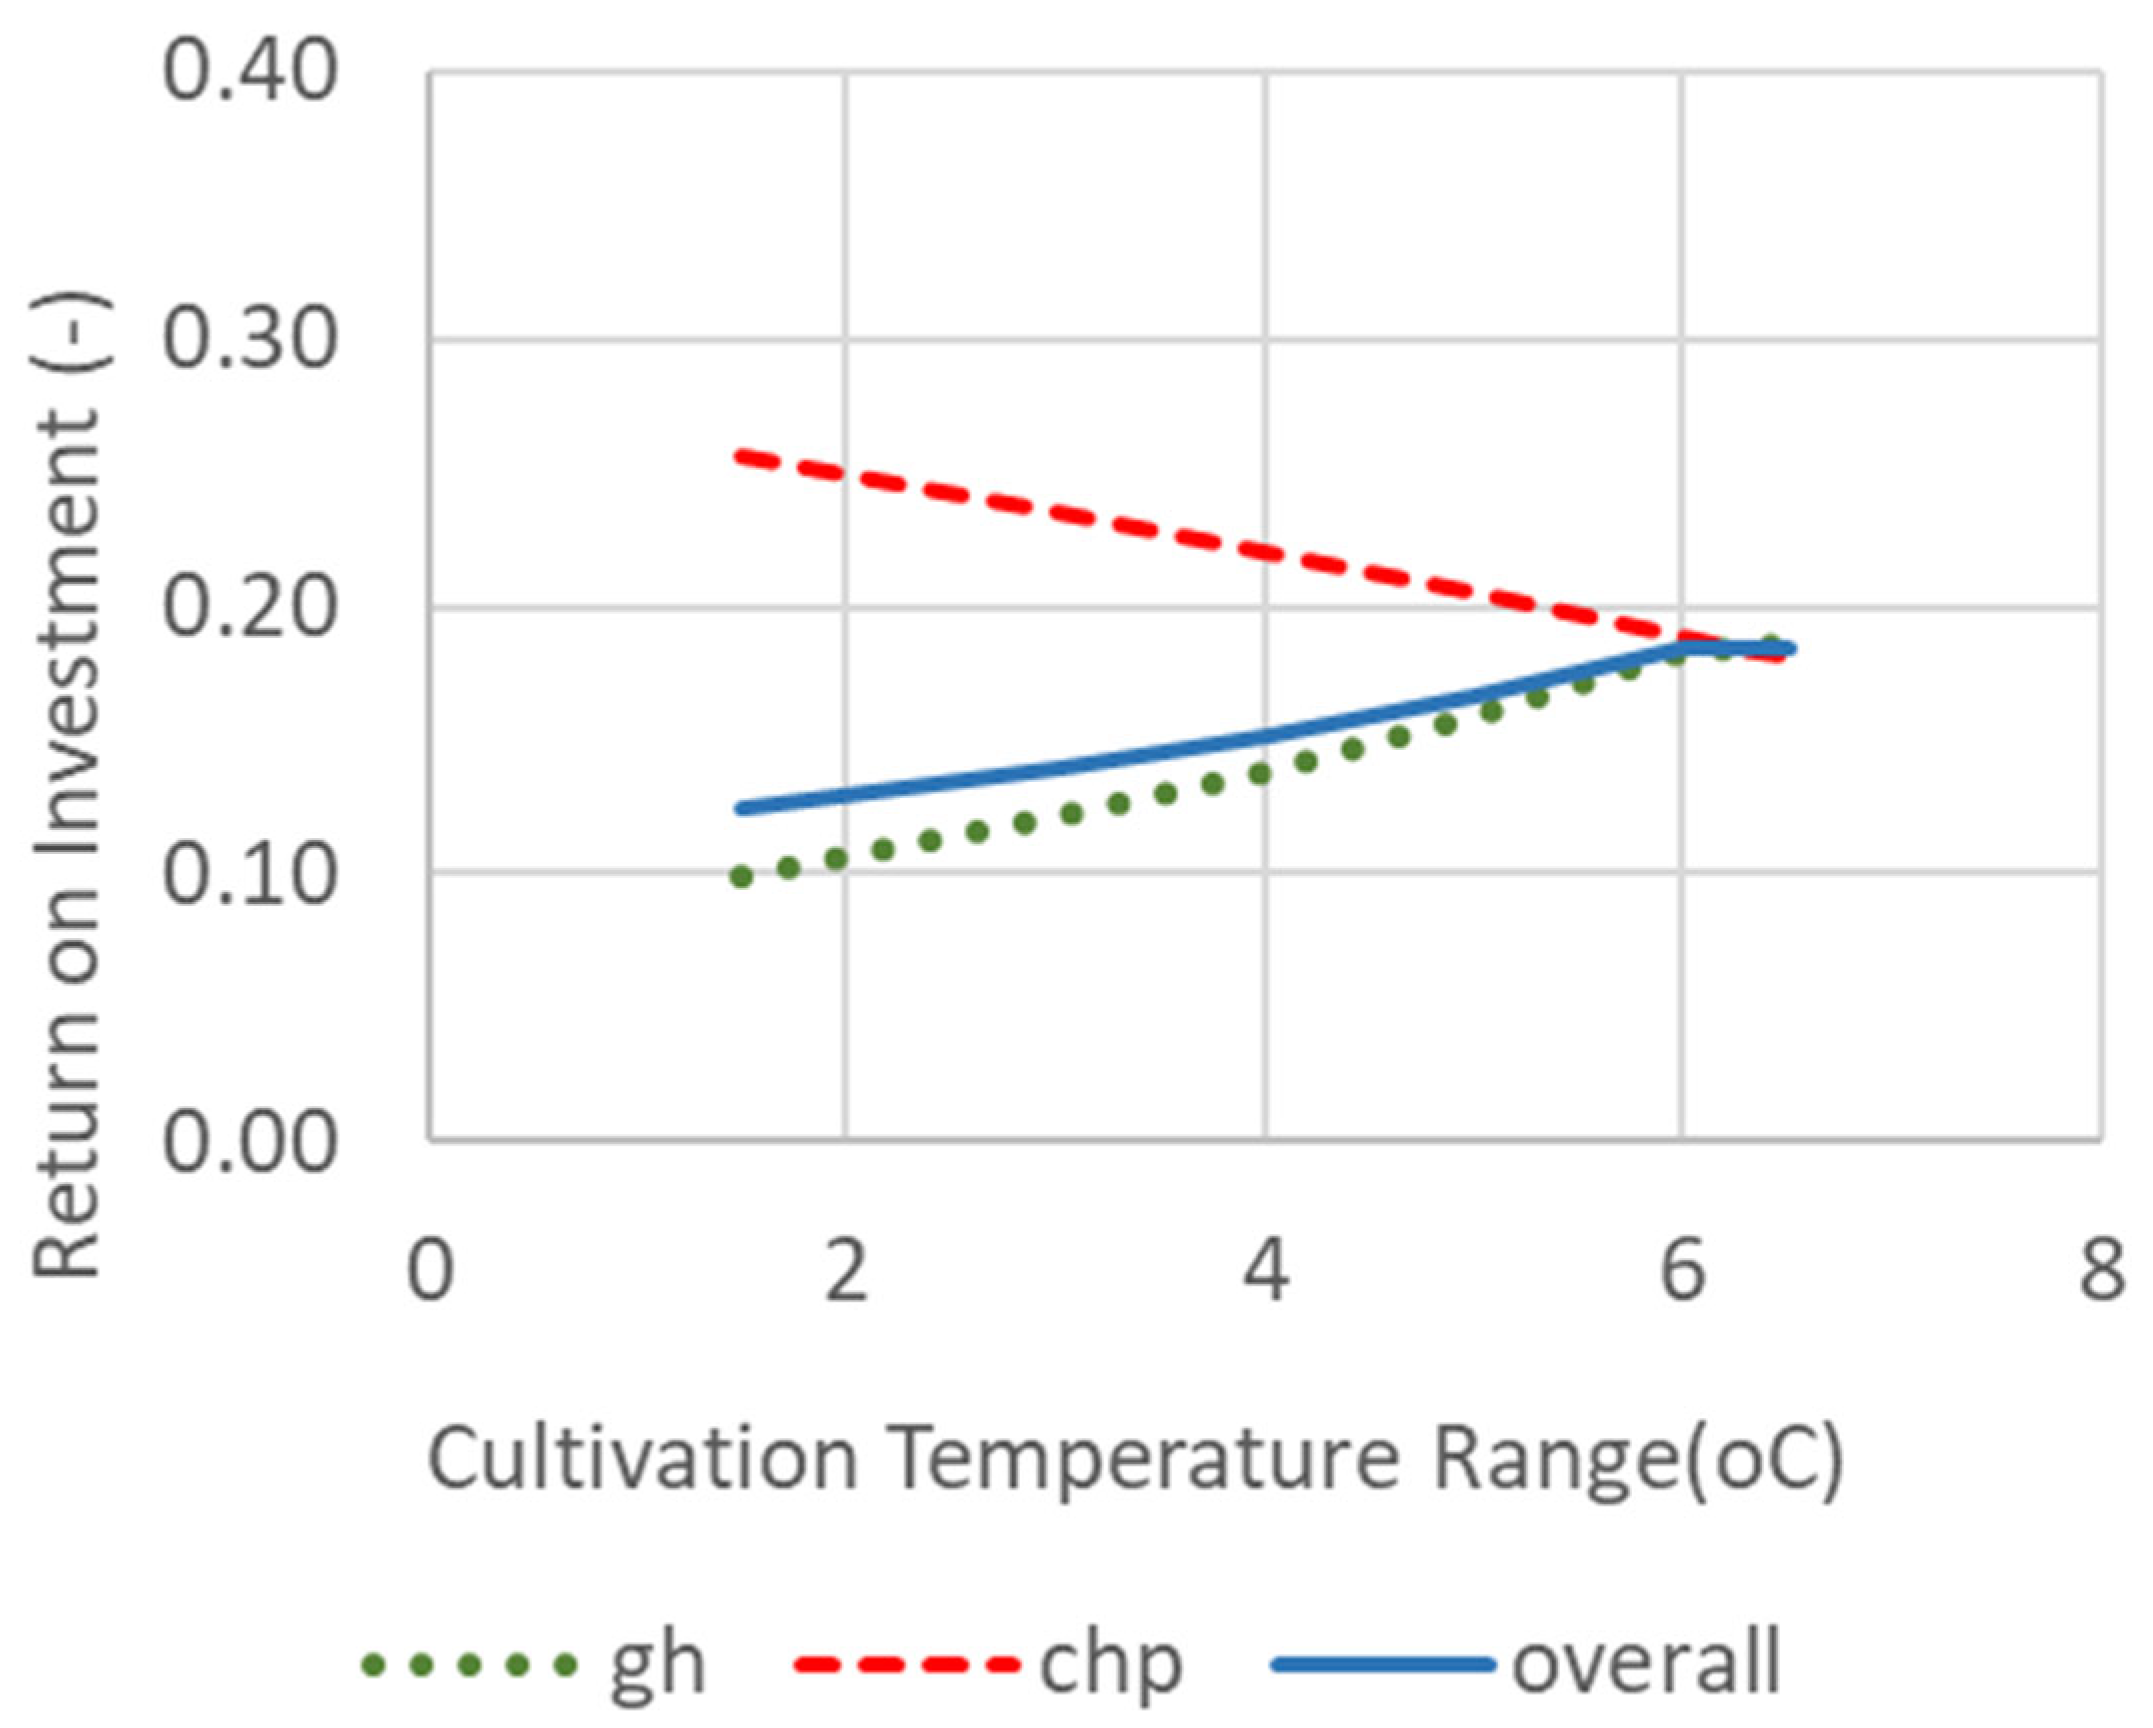
Figure 13 presents the greenhouse ROI as a function of the allowable temperature variation range for cultivation. Increasing this range—effectively relaxing the cultivation requirements—leads to lower energy consumption and, thus, improved economic performance for the greenhouse. However, it also reduces CHP operation and its contribution to profitability. As cultivation temperature increases further, the contribution of CHP to the greenhouse’s ROI eventually becomes negligible.
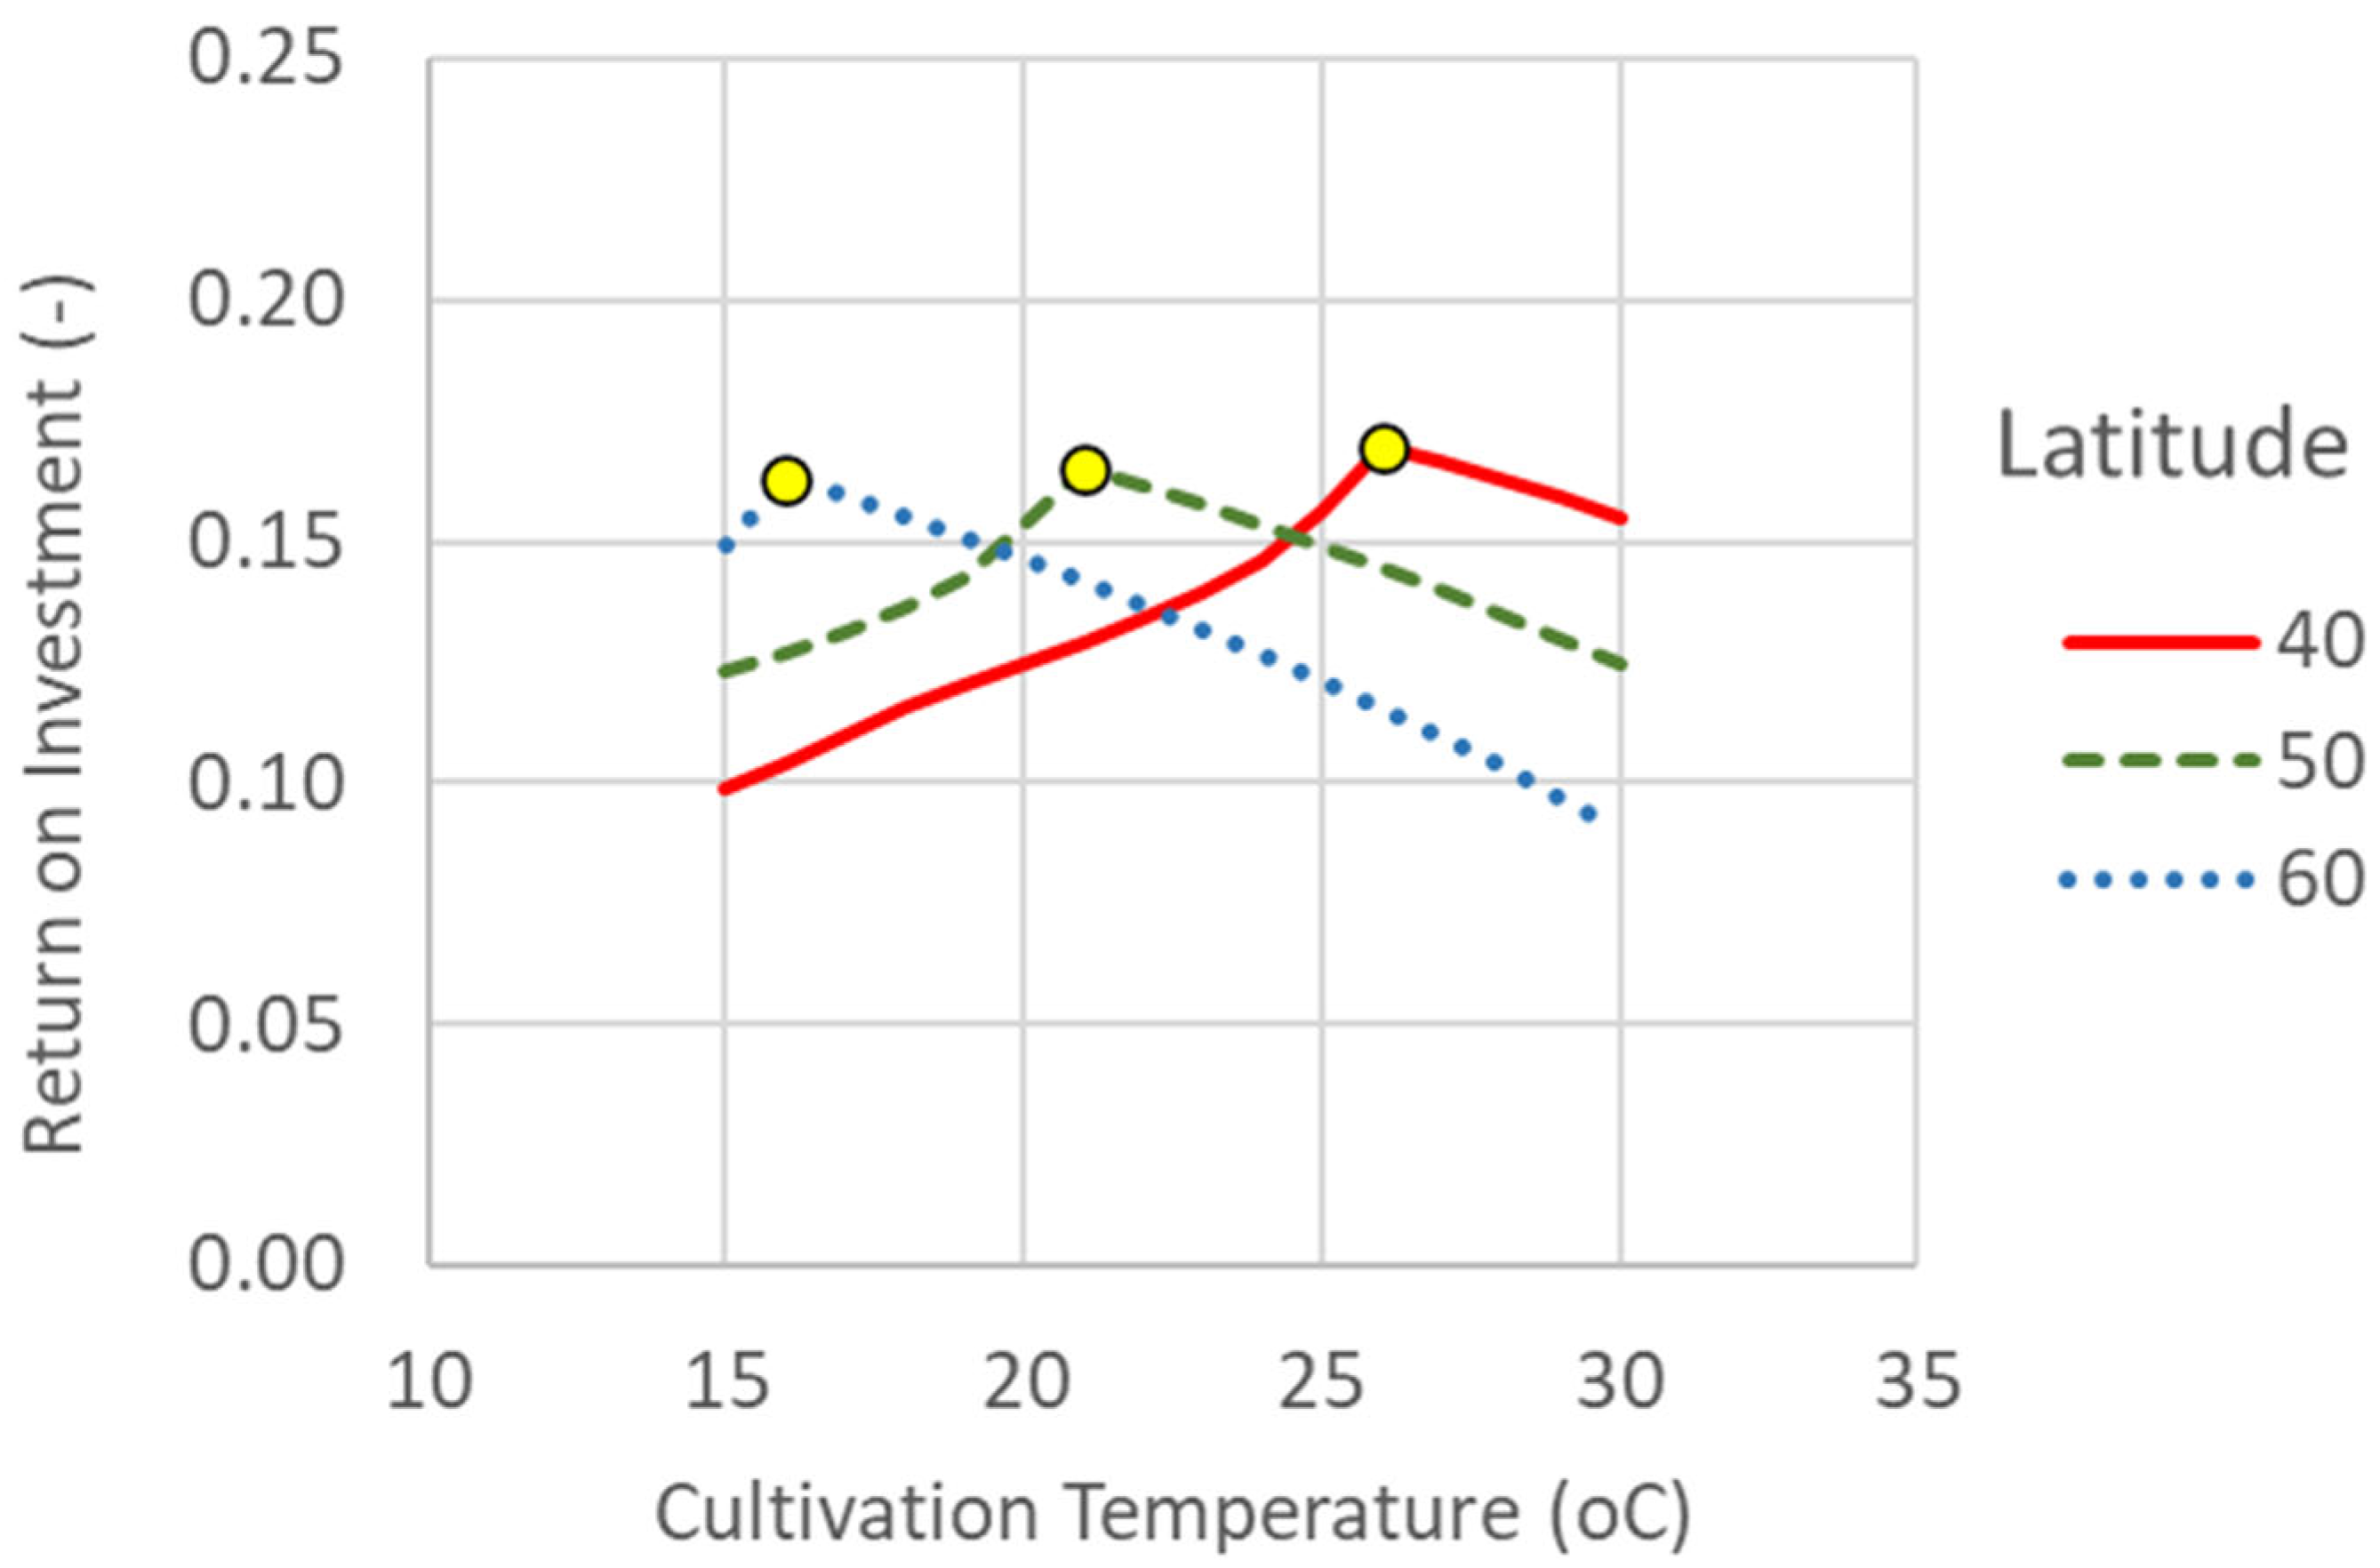
Finally, Figure 14 shows the greenhouse ROI as a function of the cultivation temperature for different latitudes. It is evident that the overall effect remains similar, with the only difference being that the inflection points shift toward higher temperatures as latitude increases.

3.5. Energy Prices Effect

Given the significant share of energy costs in the overall operating expenses, it is evident that energy prices play a crucial role in the economic performance of the system. Natural gas is consumed and represents an expense, while electricity is generated and contributes to revenue.
This section investigates the effect of energy prices on the economic performance of the greenhouse. Since, in practice, the prices of natural gas and electricity are often correlated, the present analysis treats the natural gas price as an independent variable, while the electricity price is represented through the Spark Ratio—defined as the ratio of the electricity price to the natural gas price.
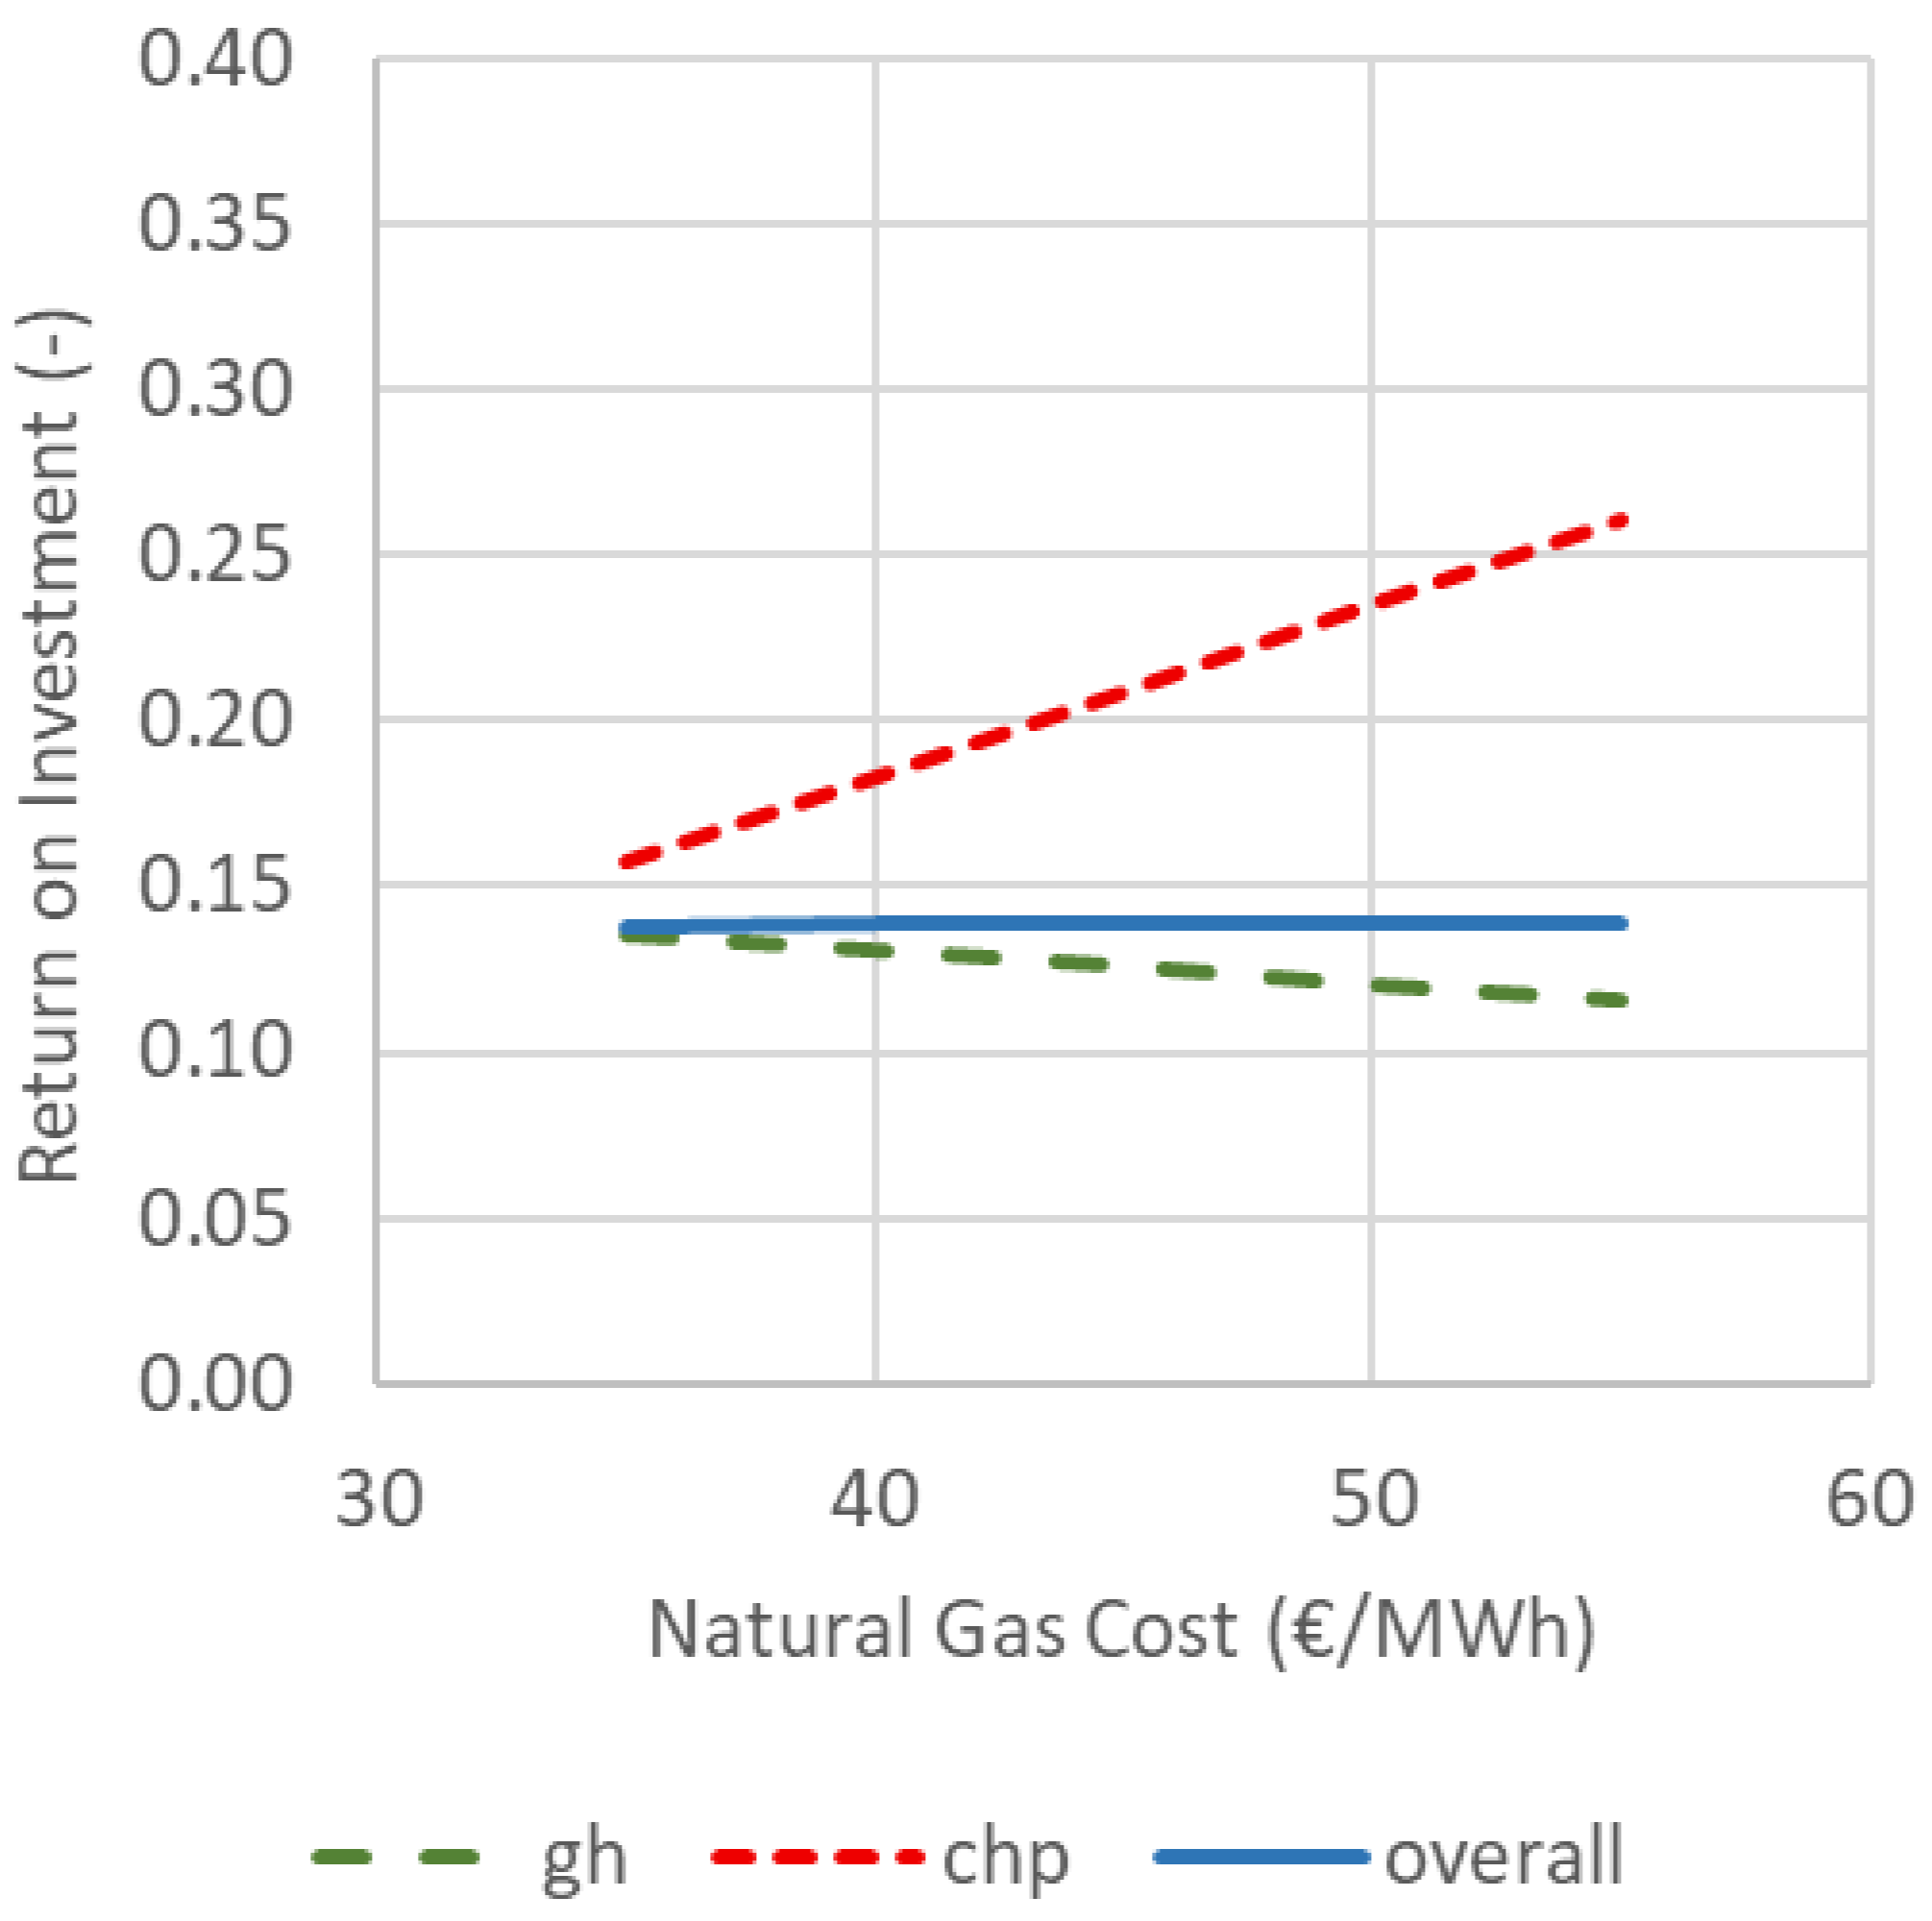
Figure 15 illustrates the economic performance (ROI) of the greenhouse, the cogeneration system, and the overall system as a function of the natural gas price. As the price of natural gas increases, the profitability of the greenhouse slightly decreases due to the rising cost of conventional heating. In contrast, the profitability of cogeneration improves significantly, owing to the higher selling price of the produced electricity (under a constant Spark Ratio).
The net result is that the overall system performance remains stable, demonstrating the stabilizing role of cogeneration in the economic viability of the greenhouse system.
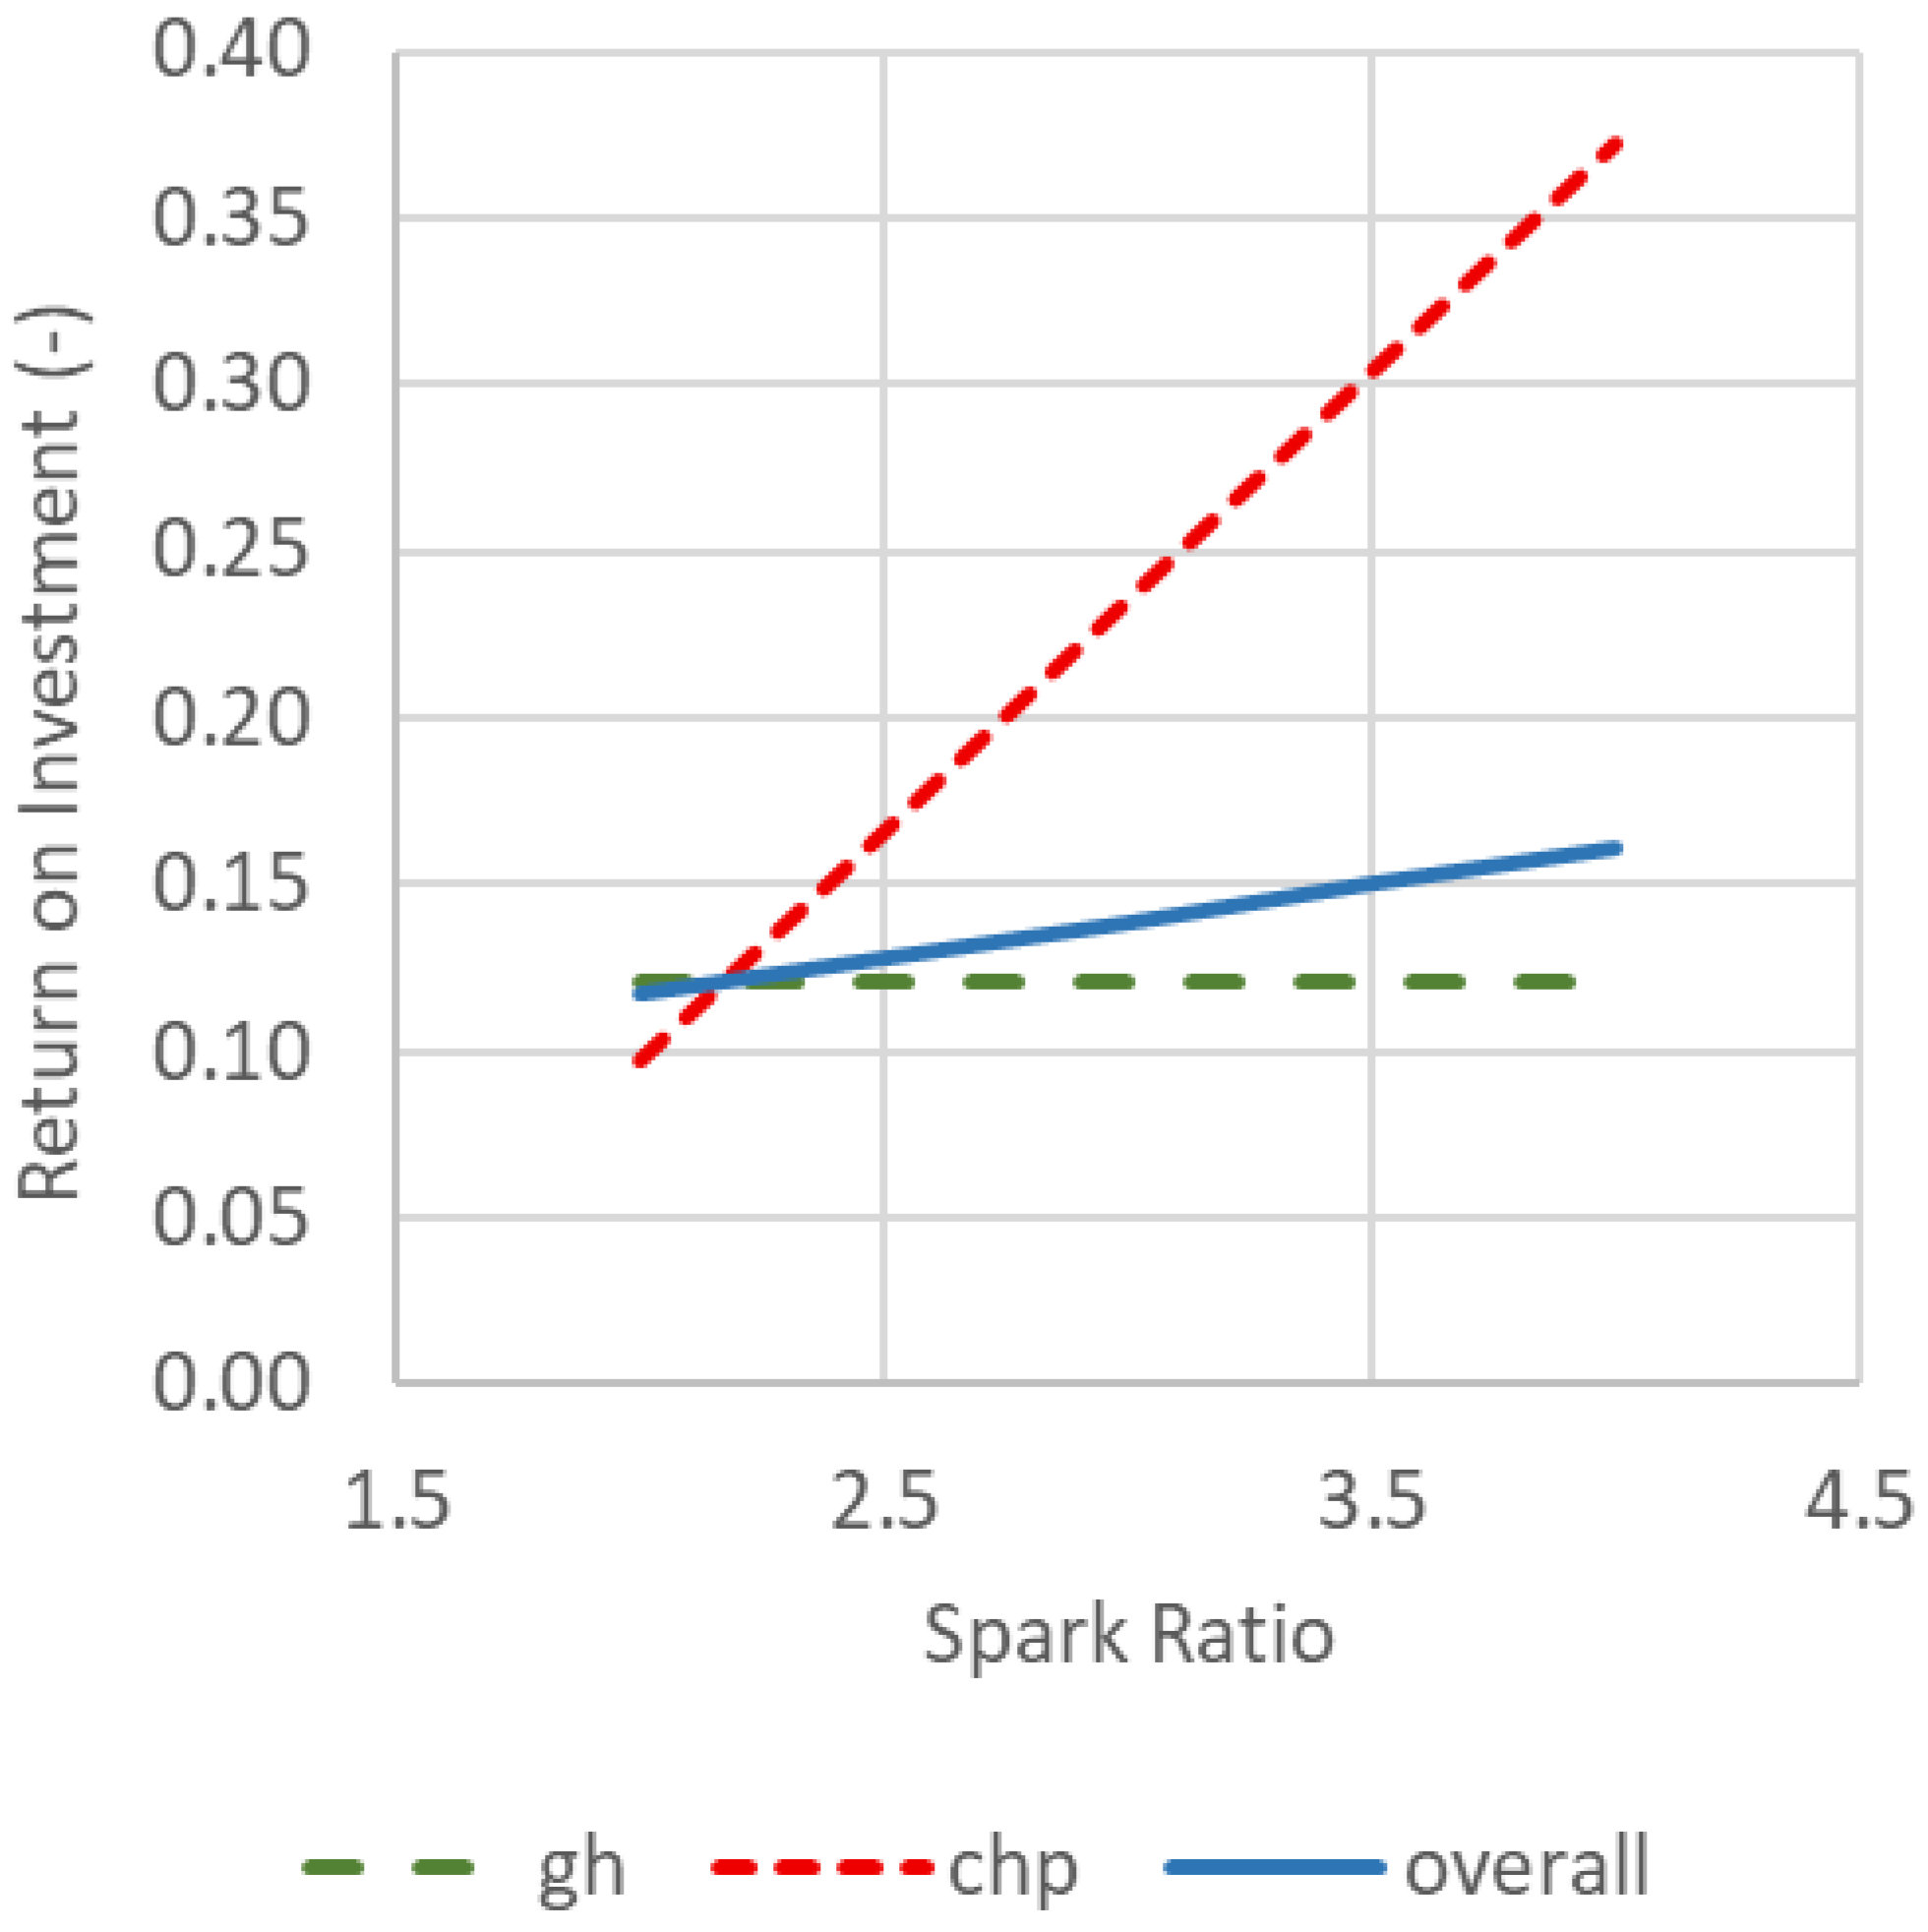
Figure 16 presents a similar analysis, this time showing the ROI of the greenhouse, cogeneration, and the overall system as a function of the Spark Ratio. An increase in the Spark Ratio leads to a remarkable improvement in the economic performance of the cogeneration system, which, in turn, enhances the overall system profitability.
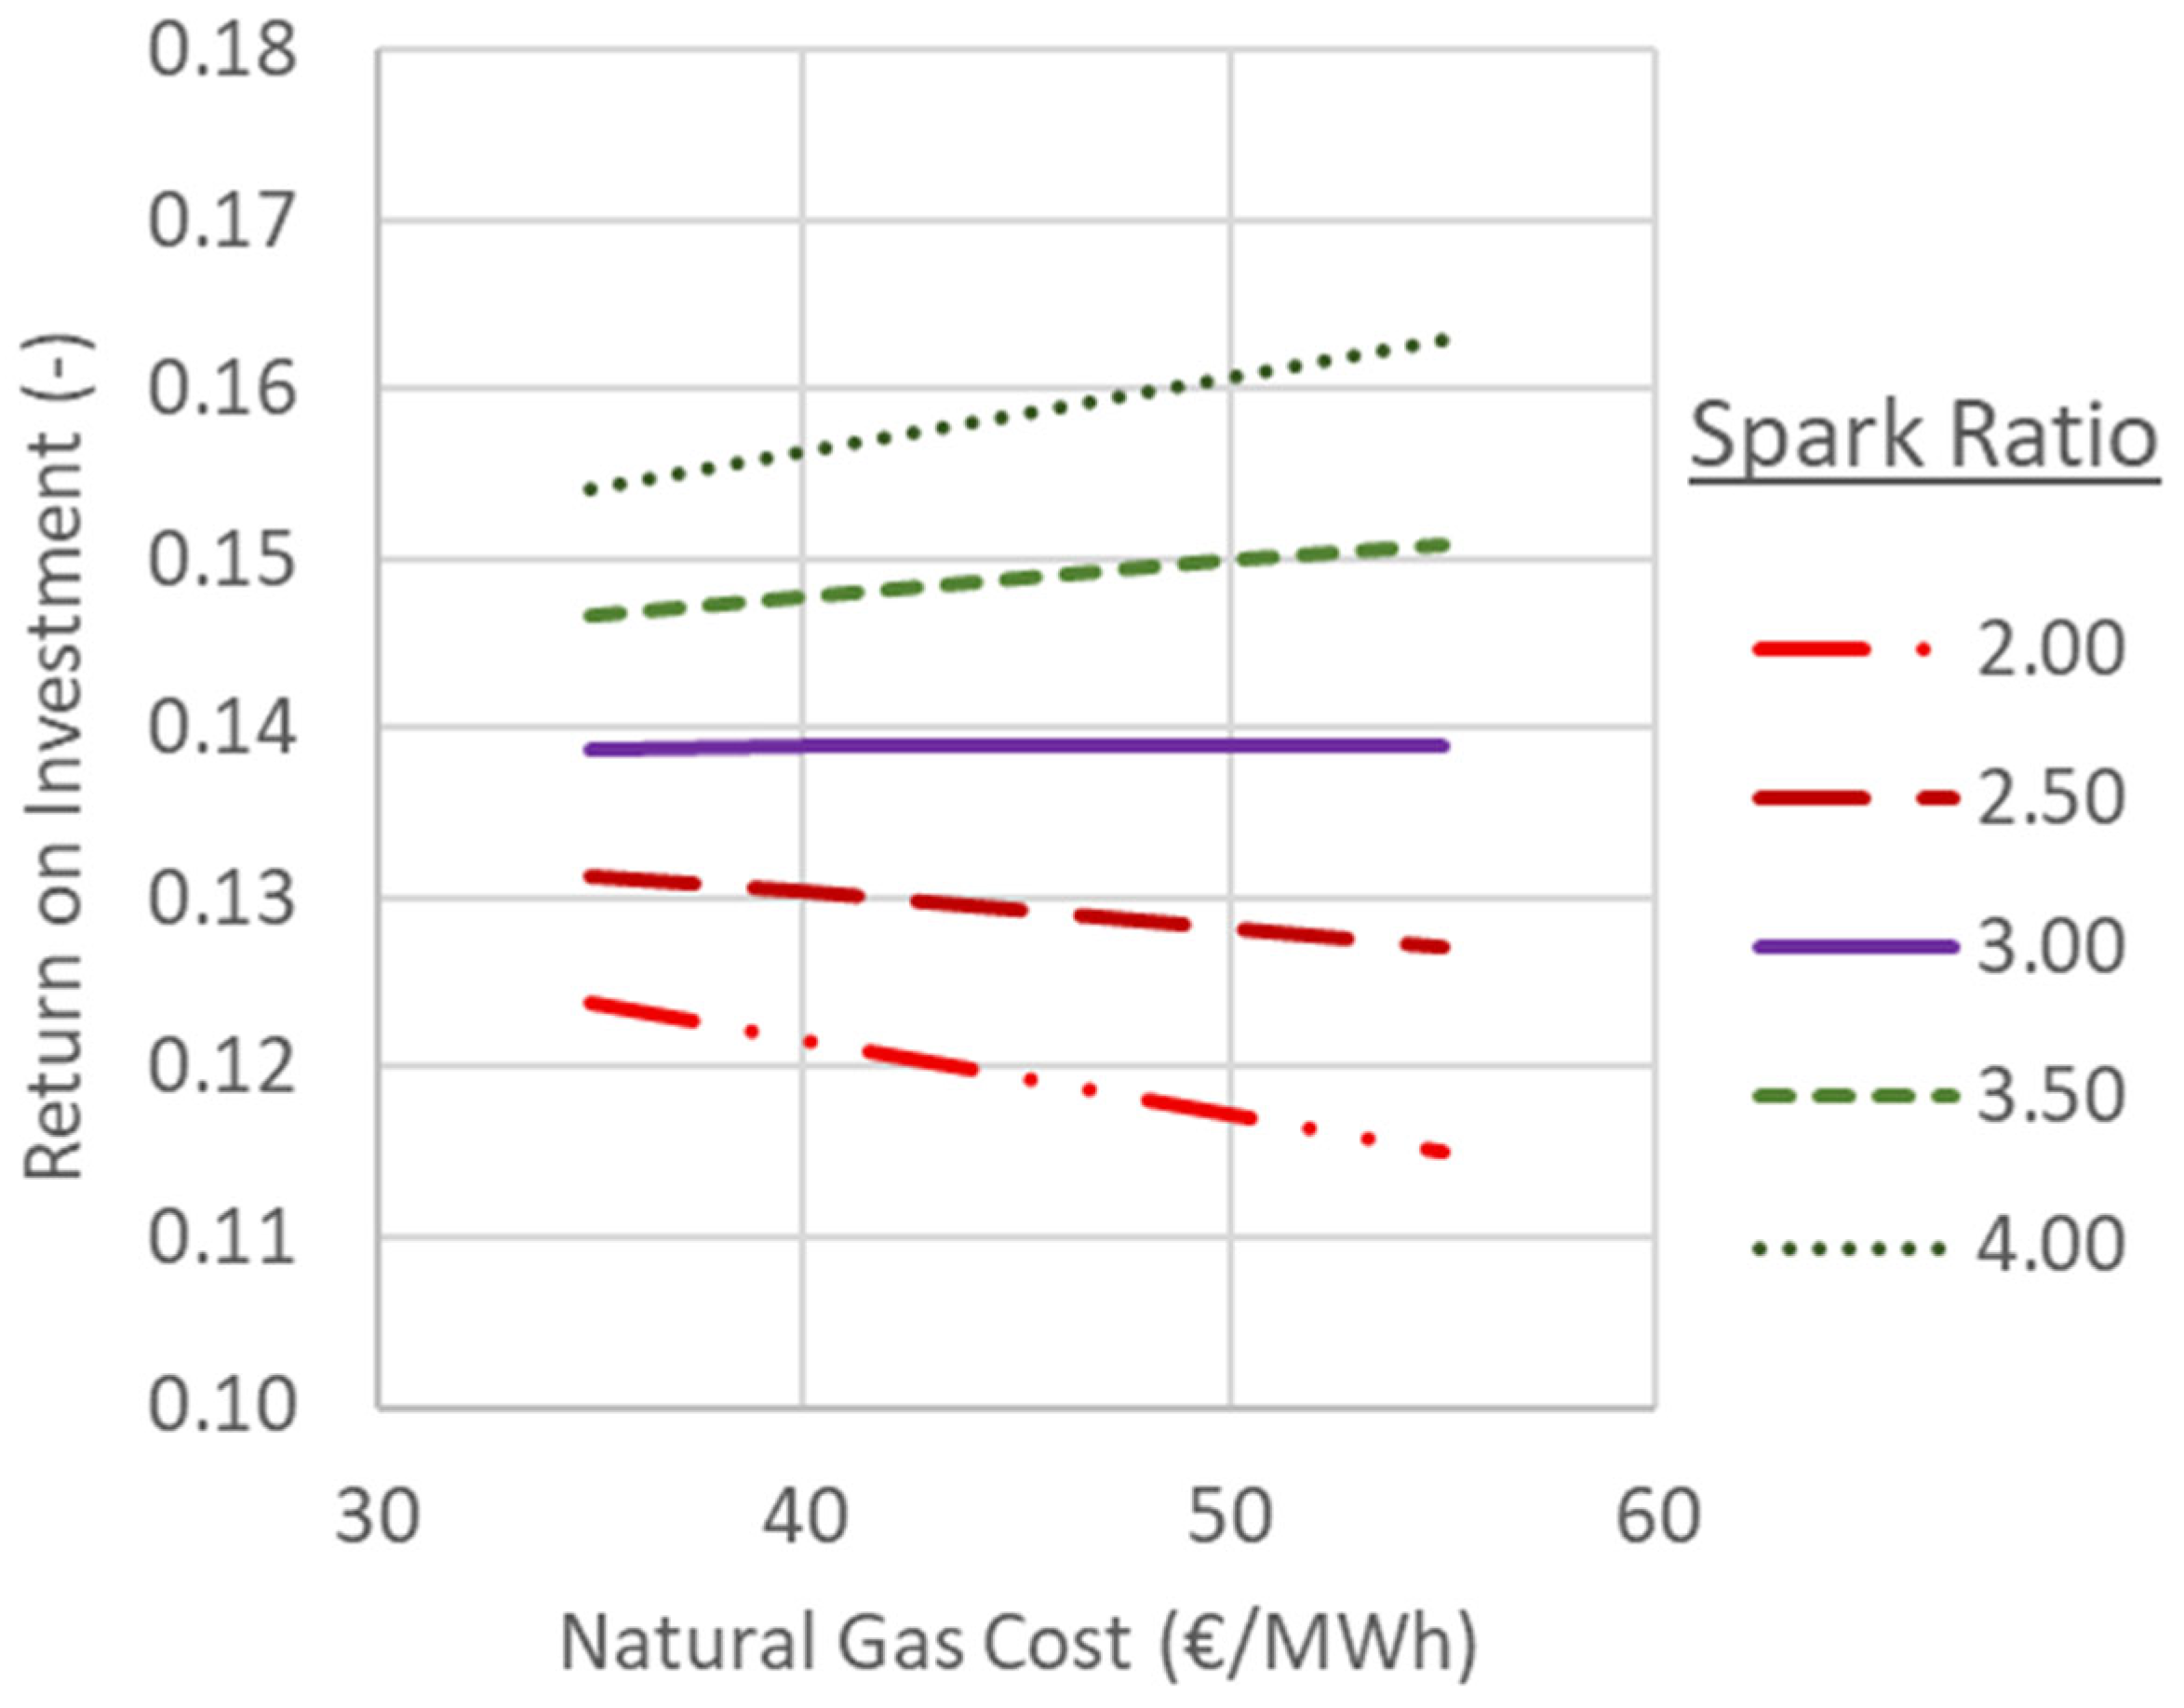
Finally, Figure 17 shows the effect of simultaneous variation in the natural gas price and the Spark Ratio on the economic performance of the overall system. A key finding is that for a Spark Ratio equal to 3, the economic performance of the overall system becomes largely independent of the natural gas price. In other words, a greenhouse equipped with cogeneration becomes resilient to energy crises characterized by rising gas prices.
At even higher Spark Ratios, the greenhouse may benefit from sudden increases in natural gas prices. However, at lower Spark Ratios, the economic performance declines.
This finding confirms a well-established empirical rule, according to which cogeneration becomes economically viable only under energy market conditions where the Spark Ratio exceeds 3 (Tataraki et al. [3]; Centrica Business Solutions [17]).

4. Discussion

4.1. Accuracy of Results and Model Validation

The accuracy of the results depends on both the accuracy of the input data and the adequacy of the model. As noted in Section 2.2, the 25 required inputs cannot be determined with complete precision, nor can representative values always be defined with confidence.
In the case of technical parameters, such as greenhouse size and CHP capacity or efficiency, the level of uncertainty is relatively low. These values can generally be specified with sufficient accuracy, although they ultimately depend on the design choices and characteristics of the selected equipment.
Cultivation conditions present a different picture. They are inherently linked to the crop in question: values differ substantially across crop types, yet for a given crop, they can be determined with relatively high precision.
Meteorological conditions, by contrast, depend on the geographical location of the installation. They vary significantly from site to site, reflecting latitude and local climate, and are additionally affected by the inherent uncertainty of weather forecasting.
Economic parameters combine elements of both low and high uncertainty. Some inputs, such as equipment costs, can in principle be refined through market surveys or supplier quotations, but such tasks fall outside the scope of this study. More importantly, the most influential economic variables—crop prices and energy prices—are characterized by substantial uncertainty and even market volatility. For this reason, rather than attempting to project future trends, the present work relies on sensitivity analysis to capture their effect.
Turning to model adequacy and validation, the study does not fall within the classical engineering validation framework, in which models are calibrated and tested against experimental or field data. Traditional error metrics such as RMSE are not applicable here, since comprehensive datasets covering all 25 required inputs are not available.
Nevertheless, certain clarifications can be made. The equations governing mass, energy, and financial balances are physically and mathematically robust, ensuring an intrinsic level of accuracy in the technical and economic components of the model. For the meteorological component, however—specifically solar radiation and ambient temperature—conventional validation methods and associated metrics are meaningful. These aspects have been examined in detail in previous work by the authors (Dimitropoulou et al. [2]), to which the reader is referred for further discussion.

4.2. Literature Comparison

The results obtained from the proposed model generally align with findings reported in the literature, but also highlight novel aspects regarding CHP sizing, the role of latitude, and energy price resilience. For example, the observed optimum CHP sizing range (0.5–1.5 MW/ha), depending on latitude, is consistent with Tataraki et al. [5] and Compernolle et al. [8] who reported similar scaling trends, albeit without explicitly linking them to capacity factors and seasonal thermal load profiles. The identification of inflection points in ROI behavior—caused by the depletion of cooling demand and redistribution of operational modes—is less commonly discussed in prior studies and represents an additional contribution of this work.
The model’s finding that profitability remains positive when the Spark Ratio is greater than 3 echoes the empirical rule cited in multiple CHP evaluations (e.g., (Tataraki et al. [3]; Centrica Business Solutions [17]). However, the present study adds value by demonstrating this stability under a parametric sensitivity framework, showing robustness across natural gas price scenarios. This has practical implications for energy policy, suggesting that stable feed-in tariffs or market conditions maintaining Spark Ratios above this threshold could secure long-term profitability.
Comparisons with cultivation-focused studies (e.g., Kurklu [9], Michalis et al. [13]) indicate that while yield improvements and product price increases can boost ROI, the volatility of energy costs often outweighs these effects. The present model confirms that CHP integration can mitigate this volatility, effectively decoupling greenhouse profitability from short-term fuel price shocks under favorable electricity-to-gas price ratios.
In broader terms, this study complements a growing body of research aimed at advancing greenhouse sustainability through renewable energy and innovative system designs. Several studies have examined region-specific renewable heating strategies such as solar thermal and geothermal energy in European greenhouses (Paris et al. [4], Boyacı et al. [18]), the use of locally sourced biomass like willow and poplar biomass in Canada (Li et al. [19]), and the incorporation of agrivoltaic systems—installation of photovoltaic panels on/above greenhouses (Torres et al. [20]. While the current model primarily focuses on cogeneration, its modular framework aligns well with evolving trends in climate-adaptive greenhouse engineering and could be readily adapted to evaluate renewable-driven scenarios with minor structural adjustments.
Finally, an important contribution of this study lies in the accessibility and flexibility of the proposed model. Unlike many technoeconomic greenhouse models that rely on commercial software, complex simulation platforms, or proprietary datasets (e.g., Seiler et al. [6], Min et al. [10]), the present approach is implemented in a spreadsheet environment, requiring no programming skills or specialized tools. This makes it accessible to a broad range of users, including agricultural engineers, producers, and policymakers. Furthermore, its modular structure—which separates technical, meteorological, and economic parameters—enables easy adaptation to diverse geographic contexts. Users can simply update the location-specific data (e.g., latitude, energy prices, crop type) to obtain regionally relevant outputs. This balance between analytical rigor and usability distinguishes the model from more specialized tools and broadens its potential for real-world application and replication.

4.3. Assumptions and Limitations

The following assumptions and limitations of this analysis should be acknowledged:
In the sensitivity analysis, only 7 of the 25 parameters presented in Figure 1 and Table 2 were examined, namely those directly related to the energy system, while the remaining ones—although in some cases equally important—were considered beyond the scope of this study. In any case, the sensitivity analysis may be extended using the Excel model available in the Supplementary Materials.
Cultivation conditions, particularly the operational temperature range, have a direct impact on both product quality and yield, and, thus, on ROI. Here, however, their effect was considered only through the energy system, under the assumption that within the narrow operational range, the yield remains unaffected.
The labor model in Section 2.2 distinguishes between two types of labor: (i) permanent managerial–administrative staff, employed throughout the year, and (ii) seasonal workers, employed only during the greenhouse’s operational period. Labor cost is expressed proportionally to the base annual salary. Therefore, the reported number of “persons” does not represent the actual headcount but rather the equivalent number of workers (Full-Time Equivalents, FTEs).
The electricity price applied in this study (and in the Spark Ratio) represents the effective market price, after accounting for mechanisms such as subsidies, carbon pricing, or grid tariffs.
A further advantage of the model is its embedded meteorological module, which estimates ambient temperature and solar radiation based solely on geographical coordinates. The resulting values are representative of local conditions and suitable for reliable greenhouse sizing and economic evaluation.
It was further assumed that the greenhouse system does not include a cooling system. Consequently, operation is limited to periods when heating is required or no energy input is necessary. In southern climates, this leads to seasonal shutdowns lasting several months, which decrease—and may even vanish—towards northern latitudes (Figure 4).
The economic evaluation is restricted to engineering economics, in contrast to financial economics, which would account for taxes, loan interest, depreciation, capital structure, and the time value of money. For this reason, ROI was selected as the main indicator instead of, for instance, IRR.
The model could be adapted to other controlled environment agriculture contexts, such as vertical farming, to broaden its applicability. By contrast, the direct incorporation of renewable energy technologies such as photovoltaic, solar thermal, or biomass systems falls outside the scope of the current model.
CO2 fertilization via controlled use of CHP exhaust gases was not explicitly included in the model, even though enriched CO2 atmospheres can enhance yields by 10–20%, provided that harmful compounds (e.g., NOx) are removed through dedicated treatment systems.
If the CHP unit belongs to a separate business entity (ESCo), a Heat Purchase Agreement must be established with a negotiated discount on thermal energy, which would require modifying Equation (12) (greenhouse expenses) and Equation (31) (ESCo revenues).

5. Conclusions

This study aimed to provide a comprehensive assessment of the economic performance of modern greenhouses, with particular emphasis on the role of the energy system. The approach was based on a detailed mathematical model capable of simulating both cultivation and energy subsystems, enabling the analysis of various technical and economic parameters. The key findings are summarized below, as practical insights for investors and policymakers:
  • Profitability: Under baseline conditions, the system ROI was 14%, with CHP alone reaching 24%. Energy-related costs represented ~35% of operational expenses, making them the dominant economic factor.
  • CHP sizing guidance: Recommended capacity ranges from 0.5 to 0.7 MW/ha in southern Europe (latitudes 37–45°) and 0.7–1.3 MW/ha in northern climates (45–60°), assuming Spark Ratio ≥ 3 and natural gas prices between 40 and 60 €/MWh.
  • Latitude and cultivation temperature: CHP becomes more profitable in colder climates, but an inflection point appears when cooling demand drops, altering the system’s operational balance. Similar reversals were observed with increasing cultivation temperature ranges.
  • Energy prices: A Spark Ratio above 3 was confirmed as the profitability threshold for CHP, supporting existing rules of thumb (Tataraki et al. [3]; Centrica Business Solutions [17]). Stable feed-in tariffs and electricity market conditions are crucial to sustaining this threshold.
  • Policy alignment: The results reinforce EU directives promoting efficient cogeneration (e.g., Energy Efficiency Directive (European Commission, [21]) and the Renewable Energy Directive (RED II) (European Commission, [22]) and suggest that predictable support mechanisms are essential for fostering long-term investment.
  • Accessibility: Unlike many existing models, the proposed tool requires no commercial software or proprietary data. Its Excel-based structure makes it transparent, adaptable, and suitable for early-stage decision-making or policy planning across diverse geographic contexts.
While the current model delivers actionable insights for greenhouse investors and policymakers, its transparent and modular structure also provides a solid foundation for future extensions into emerging agri-energy solutions and evolving cultivation systems:
  • Renewable integration: Future versions of the model could include photovoltaic, geothermal, or biomass options to align with climate-neutral greenhouse strategies.
  • CO2 enrichment: Incorporating scenarios for CO2 fertilization from CHP exhaust—common in tomato production—could improve yield estimation and ROI accuracy.
  • Vertical farming adaptation: The model could be further adapted to evaluate energy and economic performance in stacked, controlled-environment agriculture systems.

Supplementary Materials

The following supporting information can be downloaded at: https://www.mdpi.com/article/10.3390/en18174748/s1.

Author Contributions

Conceptualization, A.-M.N.D., E.N.G., and Z.B.M.; Methodology, A.-M.N.D. and Z.B.M.; Software, A.-M.N.D. and Z.B.M.; Validation, A.-M.N.D. and E.N.G.; Formal analysis, A.-M.N.D., E.N.G., and Z.B.M.; Data curation, A.-M.N.D. and E.N.G.; Writing—original draft, A.-M.N.D.; Writing—review and editing, E.N.G.; Supervision, E.N.G. and Z.B.M. All authors have read and agreed to the published version of the manuscript.

Funding

This research received no external funding.

Data Availability Statement

The data supporting the findings of this study are contained within the article and its Supplementary Materials. Specifically, the Excel file with the implemented greenhouse profitability model is provided as Supplementary File S1. Further inquiries can be directed to the corresponding author.

Acknowledgments

The authors thank the reviewers for their valuable contributions.

Conflicts of Interest

The authors declare no conflicts of interest.

References

  1. Kantor Management Consultants & Embassy of the Kingdom of The Netherlands. Greece-Market Special. Developments in the Greek Horticulture Sector: Greenhouses and Agro Logistics; Rijksdienst voor Ondernemend: The Hague, The Netherlands, 2015. [Google Scholar]
  2. Dimitropoulou, A.-M.N.; Maroulis, V.Z.; Giannini, E.N. A Simple and Effective Model for Predicting the Thermal Energy Requirements of Greenhouses in Europe. Energies 2023, 16, 6788. [Google Scholar] [CrossRef]
  3. Tataraki, K.; Giannini, E.; Kavvadias, K.; Maroulis, Z. Cogeneration Economics for Greenhouses in Europe. Energies 2020, 13, 3373. [Google Scholar] [CrossRef]
  4. Paris, B.; Vandorou, F.; Balafoutis, A.T.; Vaiopoulos, K.; Kyriakarakos, G.; Manolakos, D.; Papadakis, G. Energy Use in Greenhouses in the EU: A Review Recommending Energy Efficiency Measures and Renewable Energy Sources Adoption. Appl. Sci. 2022, 12, 5150. [Google Scholar] [CrossRef]
  5. Tataraki, K.; Kavvadias, K.; Maroulis, Z. Combined Cooling, Heating and Power Systems in Greenhouses: Grassroots and Retrofit Design. Energy 2019, 189, 116283. [Google Scholar] [CrossRef]
  6. Seiler, J.C.; Pavlak, G.; Freihaut, J.D. Energy dispatch optimization at Controlled Environment Agriculture sites with CHP: How energy utilization, storage, and market exports impact operational costs. Energy Convers. Manag. 2025, 332, 119743. [Google Scholar] [CrossRef]
  7. Lahlou, F.-Z.; Mahmood, F.; Al-Ansari, T. Economic assessment of greenhouse and vertical farm production systems in arid regions: A case study of Qatar. Clean. Circ. Bioeconomy 2025, 12, 100151. [Google Scholar] [CrossRef]
  8. Compernolle, T.; Witters, N.; Van Passel, S.; Thewys, T. Analyzing a Self-Managed CHP System for Greenhouse Cultivation as a Profitable Way to Reduce CO2 Emissions. Energy 2011, 36, 1940–1947. [Google Scholar] [CrossRef]
  9. Kurklu, A. A Feasibility Study for Different Crops in a High-tech Greenhouse in Turkey. World J. Agric. Soil Sci. 2022, 8, 000688. Available online: https://irispublishers.com/wjass/pdf/WJASS.MS.ID.000688.pdf (accessed on 22 August 2025).
  10. Min, X.; Sok, J.; Elings, A.; Oude Lansink, A. Economic feasibility of glasshouse tomato production in China: A bio-economic stochastic modelling approach. NJAS Impact Agric. Life Sci. 2022, 94, 156–183. [Google Scholar] [CrossRef]
  11. Hopwood, W.; Lopez-Reyes, Z.; Bantan, A.; Vietti, C.; Al-Shahrani, D.; Al-Harbi, A.; Qaryouti, M.; Davies, P.; Tester, M.; Wing, R.; et al. Benchmarking Techno-Economic Performance of Greenhouses with Different Technology Levels in a Hot Humid Climate. Biosyst. Eng. 2024, 244, 177–199. [Google Scholar] [CrossRef]
  12. Ahamed, M.S.; Guo, H.; Taylor, L.; Tanino, K. Heating demand and economic feasibility analysis for year-round vegetable production in Canadian Prairie greenhouses. Inf. Process. Agric. 2019, 6, 81–90. [Google Scholar] [CrossRef]
  13. Michalis, E.; Giatra, C.-E.; Skordos, D.; Ragkos, A. Assessing the Different Economic Feasibility Scenarios of a Hydroponic Tomato Greenhouse Farm: A Case Study from Western Greece. Sustainability 2023, 15, 14233. [Google Scholar] [CrossRef]
  14. Folorunso, E.A.; Schmautz, Z.; Gebauer, R.; Mraz, J. The Economic Viability of Commercial-Scale Hydroponics: Nigeria as a Case Study. Heliyon 2023, 9, e18979. [Google Scholar] [CrossRef] [PubMed]
  15. FAO. Energy-Smart Food for People and Climate: Technical Paper. Food and Agriculture Organization of the United Nations: Rome, Italy, 2023. Available online: https://www.fao.org/3/i2454e/i2454e.pdf (accessed on 22 August 2025).
  16. Eurostat. Agriculture, Forestry and Fishery Statistics—2024 Edition. Publications Office of the European Union: Luxembourg, 2024. Available online: https://ec.europa.eu/eurostat/statistics-explained/index.php?title=Agriculture,_forestry_and_fishery_statistics (accessed on 22 August 2025).
  17. Centrica Business Solutions. The Essential Guide to Combined Heat and Power. Centrica Business Solutions, UK. 2018. Available online: https://www.centricabusinesssolutions.com/sites/g/files/qehiga126/files/GDE%2001%20ENER-G%20Essential%20Guide%20to%20CHP_01_v5%20%281%29.pdf (accessed on 22 August 2025).
  18. Boyacı, S.; Kocięcka, J.; Jagosz, B.; Atılgan, A. Energy Efficiency in Greenhouses and Comparison of Energy Sources Used for Heating. Energies 2025, 18, 724. [Google Scholar] [CrossRef]
  19. Li, X.; Mupondwa, E.; Soolanayakanahally, R.; Stefner, C.; Pahari, S. Economic Feasibility of Using Willow and Poplar as Bioenergy Sources for Heating Small Greenhouses in Canadian Northern Communities. Biomass Bioenergy 2025, 197, 107822. [Google Scholar] [CrossRef]
  20. Torres, M.A.; Muñoz, D.; Burgos, C.; Casagrande, D.; Ortiz, J.; Reyes, H. Design and Performance Evaluation of a Photovoltaic Greenhouse as an Energy Hub with Battery Storage and an Electric Vehicle Charger. Sustainability 2024, 16, 981. [Google Scholar] [CrossRef]
  21. European Commission. Directive 2012/27/EU of the European Parliament and of the Council of 25 October 2012 on Energy Efficiency, Amending Directives 2009/125/EC and 2010/30/EU and Repealing Directives 2004/8/EC and 2006/32/EC. Off. J. Eur. Union L 2012, 315, 1–56. [Google Scholar]
  22. European Commission. Directive (EU) 2018/2001 of the European Parliament and of the Council of 11 December 2018 on the Promotion of the Use of Energy from Renewable Sources (recast). Off. J. Eur. Union L 2018, 328, 82–209. [Google Scholar]
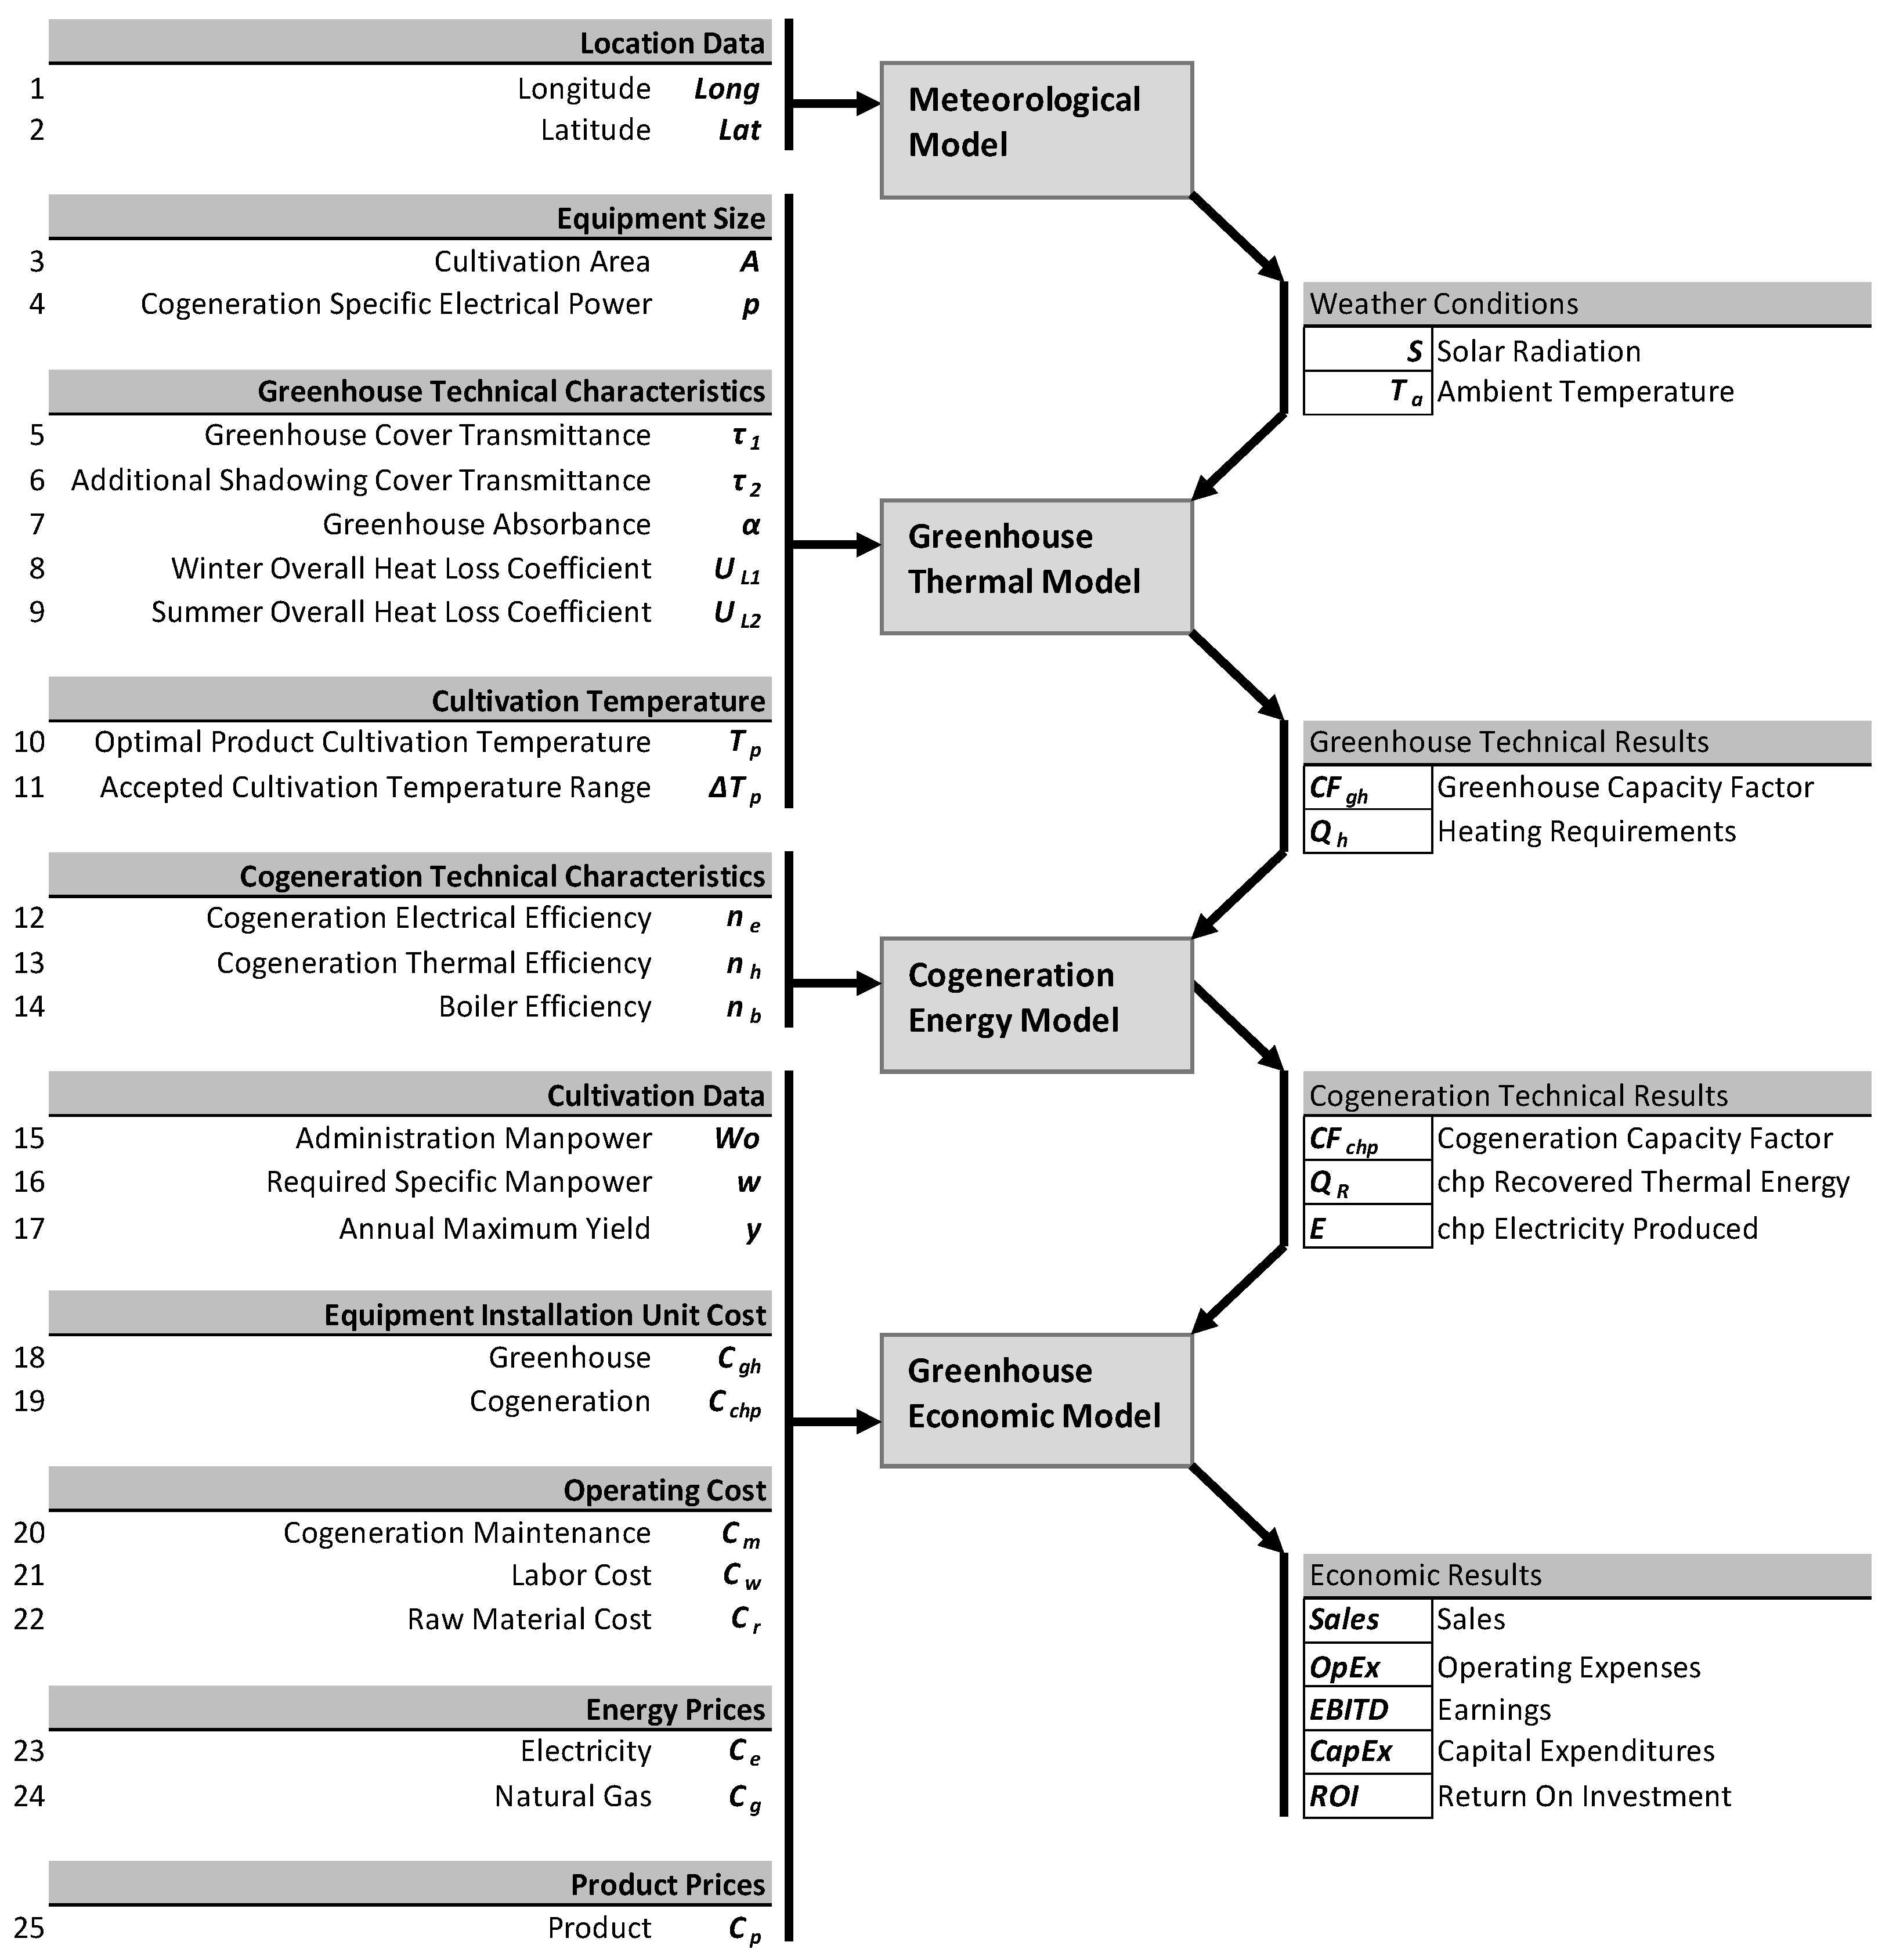
Figure 1. Model information flow diagram.
Energies 18 04748 g001
Figure 2. Model economic results: CapEx-EBITD diagram.
Energies 18 04748 g002
Figure 3. Return on Investment versus Latitude. (gh) Greenhouse, (chp) Cogeneration, and (Overall) System.
Energies 18 04748 g003
Figure 4. Modes of Operation: Heating, Cooling, Zero Energy. Greenhouse operates during Heating and Zero Energy periods.
Energies 18 04748 g004
Figure 5. CapEx-EBITD diagram: Effect of Latitude.
Energies 18 04748 g005
Figure 6. Effect of Cogeneration Size on Overall Return on Investment.
Energies 18 04748 g006
Figure 7. Effect of Cogeneration Size on Cogeneration Capacity Factor.
Energies 18 04748 g007
Figure 8. Effect of Cogeneration Size on Cogeneration Heating Covering Fraction.
Energies 18 04748 g008
Figure 9. CapEx-EBITD diagram: Effect of Cogeneration Size.
Energies 18 04748 g009
Figure 10. Effect of Cogeneration Size on Return on Investment at various Latitudes. The Optimum Size for every Latitude is denoted by small cycles.
Energies 18 04748 g010
Figure 11. Effect of the Cultivation Temperature on Return on Investment (ROI) for Greenhouse (gh), Cogeneration (chp), and Overall System.
Energies 18 04748 g011
Figure 12. Modes of Operation (Heating, Cooling, Zero Energy) versus Cultivation Temperature.
Energies 18 04748 g012
Figure 13. Effect of the Cultivation Temperature Range on Return on Investment for Greenhouse (gh), Cogeneration (chp), and Overall System.
Energies 18 04748 g013
Figure 14. Effect of the Cultivation Temperature on Return on Investment of Greenhouse at various Latitudes.
Energies 18 04748 g014
Figure 15. Effect of Natural Gas Price on Return on Investment for Greenhouse, Cogeneration, and Overall System.
Energies 18 04748 g015
Figure 16. Effect of Spark Ratio on Return on Investment for Greenhouse, Cogeneration, and Overall System.
Energies 18 04748 g016
Figure 17. Effect of Natural Gas Price on Overall Return on Investment for various Spark Ratios.
Energies 18 04748 g017
Table 1. Summary table of literature review studies.
StudyCultivation TypeRegion/ClimateMetrics UsedKey Assumptions/Findings
Paris et al. [4]General EU greenhouse sectorNorthern vs. Southern EuropeEnergy intensityLarge variation in heating demand; distinction between low- and high-energy systems
Tataraki et al. [3,5]Tomato, cucumber greenhouses with CCHPGreece, EuropeROI, Energy costsCCHP is profitable when Spark Ratio > 3; optimal CHP sizing is context-dependent
Seiler et al. [6]Controlled environment agriculture with CHP and storageUS case studyCost savingsMulti-objective optimization; CHP and storage reduce costs 7–12%
Lahlou et al. [7]Tomato greenhouse vs. vertical farmQatar (arid climate)Levelized production costGreenhouses are more cost-efficient; vertical farms save water
Compernolle et al. [8]Tomato and lettuceBelgiumNPV, CO2 savingsSelf-managed CHP viable, lettuce: CHP system of 239 kW, tomato: 1.2 MW
Kurklu [9]Multiple crops (tomato, strawberry, rose) (semi-closed, Venlo, and Gothic greenhouse)TurkeyROI, payback Profitability is highly crop-dependent; electricity and financing dominate costs
Min et al. [10]Cherry tomato (Venlo-type glasshouse)ChinaNPV, IRR, paybackWide regional variation in feasibility
Hopwood et al. [11]Low- vs. high-tech greenhousesSaudi Arabia (hot, humid climate)Payback, productivityHigh-tech closed systems: highest returns despite high Capex, Opex
Ahamed et al. [12]Tomato, cucumber, pepperCanada (cold climate)NPV, net returnTomatoes most profitable, and product prices in remote areas key driver
Michalis et al. [13]Hydroponic tomatoGreece (Mediterranean climate)NPV, IRR, paybackBaseline profitable (IRR 13%), sensitive to subsidies and prices
Folorunso et al. [14]Hydroponic vegetablesNigeria (tropical climate)NPV, IRRMedium-scale hydroponics more resilient to input cost fluctuations
Present studyHydroponic tomatoes with CHPEuropeROIUnified, spreadsheet-based model; integrates greenhouse and CHP, identifies optimum CHP sizing (0.5–1.5 MW/ha), Spark Ratio resilience, latitude/cultivation inflection points; transparent and easy-to-use
Table 2. Model input data.
Location Data
1LongitudeLong23.0
2LatitudeLat40.0
Equipment Size
3Cultivation AreaA10.0ha
4Cogeneration Specific Electrical Powerp0.50MW/ha
Greenhouse Technical Characteristics
5Greenhouse Cover Transmittanceτ10.75-
6Additional Shadowing Cover Transmittanceτ20.40-
7Greenhouse Absorbanceα0.40-
8Winter Overall Heat Loss CoefficientUL18.0W/m2/K
9Summer Overall Heat Loss CoefficientUL212.0W/m2/K
Cogeneration Technical Characteristics
10Cogeneration Electrical Efficiencyne0.40-
11Cogeneration Thermal Efficiencynh0.50-
12Boiler Efficiencynb0.90-
Cultivation Temperature
13Optimal Product Cultivation TemperatureTp23.0C
14Accepted Cultivation Temperature RangeΔTp3.0C
Cultivation Data
15Administration ManpowerWo18.0persons
16Required Specific Manpowerw8.0persons/ha
17Annual Maximum Yieldy700t/ha
Equipment Installation Unit Cost
18GreenhouseCgh3.20M€/ha
19CogenerationCchp1.20M€/MW
Operating Cost
20Cogeneration MaintenanceCm9.0€/MWh
21Labor CostCw15.0k€/y
22Raw Material CostCr0.30€/kg
Energy Prices
23ElectricityCe150€/MWh
24Natural GasCg50€/MWh
Product Prices
25ProductCp1.50€/kg
Table 3. System Evaluation using the Proposed Model: Base Case.
Economic ResultsTotalGreenhouseCogeneration
SalesSales11.98.33.6M€/y
Operating ExpensesOpEx6.74.42.2M€/y
EarningsEBITD5.33.91.4M€/y
Capital ExpendituresCapEx38.032.06.0M€
Return On InvestmentROI13.912.123.5%
Table 4. Cogeneration Contribution to Energy Cost.
Cost CategoryCost (M€/y)Cost (%OpEx)
Personnel1.2227.5
Raw Material1.6637.4
Energy1.5635.1
Operating Expenses (OpEx)4.44100
Cogeneration Contribution to Energy Cost
Energy Cost Covered by Cogeneration1.41M€/y
Energy Cost Reduction by Cogeneration90.5%
Disclaimer/Publisher’s Note: The statements, opinions and data contained in all publications are solely those of the individual author(s) and contributor(s) and not of MDPI and/or the editor(s). MDPI and/or the editor(s) disclaim responsibility for any injury to people or property resulting from any ideas, methods, instructions or products referred to in the content.