Abstract
Implementing solutions consistent with the Industry 4.0 concept, including digitalization and process automation, plays a significant role in improving the efficiency and sustainable development of manufacturing companies. One of the key areas of this transformation is internal logistics, where simulation technologies and autonomous transport systems are gaining increasing importance. The aim of this article was to assess the potential of using computer simulation as a tool to support the process of reducing the electricity consumption of electric forklifts in logistics processes. The developed methodology can serve as a foundation for a wider use of digital tools in internal logistics planning, covering not only production goals but also improving energy efficiency and reducing emissions. Importantly, the proposed approach can be a starting point for decision makers in manufacturing and logistics companies, encouraging the use of simulation as a tool to support decisions. In the longer term, the results open the way for analyses focused on the implementation of green technology solutions and the integration of electric vehicles with renewable energy sources, in line with corporate sustainable development strategies.
1. Introduction
The concept of Industry 4.0, understood as an integrated approach to the digitization of industrial processes, is gaining increasing importance in the modern economy. Its implementation by a growing number of enterprises not only reflects current technological trends but is also becoming a key factor in effectively building a competitive advantage. The dynamic development of digital technologies and their widespread availability are leading to fundamental changes in the way production processes are planned, organized, and implemented, redefining existing models of industrial operation [].
The Industry 4.0 concept encompasses advanced technologies enabling the creation of intelligent, automated, and collaborative systems. Particular importance is attached to solutions such as the Internet of Things (IoT) [,,], which enables mutual communication between machines, devices and systems in real time, artificial intelligence (AI) [,], responsible for the analysis of large data sets and supporting decision-making processes, as well as virtual reality (VR) and augmented reality (AR) [,,], which support visualization and interaction with the digital production environment.
All these technologies create an integrated ecosystem based on data flow, processing, and continuous process improvement, leading to increased flexibility, efficiency, and reliability of production systems. Digital twins are a central element of this ecosystem, increasingly recognized as one of the key tools of Industry 4.0.
A digital twin is a virtual, dynamically updated representation of a real object, process, or system that allows for its monitoring, simulation, and analysis in the context of actual operating conditions. It is created by combining data collected from sensors with analytical algorithms, mathematical models, and simulation technologies, allowing for the representation of the current state and the prediction of future events and system responses [,]. Such tools provide significant support for engineers and managers, enabling testing and process optimization without the need to interfere with the physical operating environment.
The implementation of digital twins is therefore becoming an increasingly popular strategy aimed at streamlining various production and operational processes []. Their growing popularity is reflected in the extensive literature on the subject, which covers a wide range of possible applications of this technology. Most publications focus on the use of digital twins in production processes—both in the context of monitoring the technical condition of machines and optimizing the course of technological processes [,,,,,,,]. Their use in logistics, particularly in the modeling and management of supply chains, transport optimization, and material flow analysis [,,,,], is also of great interest to researchers and practitioners.
However, the applications of digital twins go beyond industry and logistics—there are increasingly frequent initiatives to integrate them in areas such as agriculture, where they are used to manage crops, irrigation or monitor climate conditions [,,], and construction, where they support processes related to the design, operation and maintenance of buildings [,]. The universality and flexibility of digital twin technologies make them one of the most promising solutions in the field of digitization and transformation of modern economic systems.
In the context of the development of Industry 4.0, the importance of computer simulations cannot be overlooked. Alongside digital twins, they constitute a crucial component supporting the digital transformation of enterprises. However, a certain conceptual simplification is observed in the literature and industrial practice, involving the conflation of computer simulation with digital twin technology. Although the two approaches are closely related, they are not identical and should not be used interchangeably.
It is important to note that every digital twin includes a simulation component that allows for the analysis and prediction of the behavior of a real-world object or system. However, not every computer simulation meets the definition of a digital twin. Key differences between these tools include the degree of integration with the real object, the ability to update data in real time, and the level of interactivity. Computer simulations are typically static in nature, used to analyze specific scenarios in laboratory or conceptual settings, without direct connection to the physical system.
Despite these differences, computer simulation plays an important role in the design, testing and optimization of industrial and logistic processes (Table 1).

Table 1.
Examples of the use of computer simulation for production and logistics analysis.
Simulations are particularly useful at the planning stage, conceptual modeling, and when analyzing the feasibility of implementing technological or organizational improvements [,,,]. Their main advantage is the ability to conduct experiments without the risk of interfering with real processes. They allow for assessing the effectiveness of alternative solutions, analyzing emergency scenarios, and identifying bottlenecks in production and logistics systems.
Modern simulation tools are evolving towards greater functionality and flexibility. Many now offer real-time data integration, paving the way for transforming traditional simulation systems into fully fledged digital twins.
The aim of this article was to assess the potential of using computer simulation as a tool to support the process of reducing the electricity consumption of electric forklifts in logistics processes. Reducing energy consumption translates not only into economic benefits but also reduces downtime associated with battery charging, which directly impacts the efficiency of the entire production process. Furthermore, reducing energy demand is crucial for environmental protection, aligning with the principles of sustainable development and the Industry 4.0 strategy.
The research involved an analysis of a real-world logistics process using autonomous electric AGVs (Automated Guided Vehicle). The primary focus was on assessing the effectiveness of the proposed solution in optimizing the transport route, particularly in the context of shortening the distance between the input material warehouse and production stations. Shortening this route directly reduces electricity consumption and, consequently, carbon dioxide (CO2) emissions. Simulation technology, understood as a mathematical and logical model that reproduces real-world processes in the form of computer software, enabled the evaluation of the performance of an autonomous guided vehicle (AGV) system in two variants differing in route layout. This enabled a comparison of the efficiency of the analyzed solutions, with particular emphasis on energy consumption. Computer simulation thus provided a tool for objective verification and evaluation of the proposed improvements, with the autonomous logistics system being the subject of this study.
The analysis of the literature on the subject indicates significant interest in topics related to the parameters of production processes [,,,,] or the optimization of logistics [,]. Many publications focus on aspects of energy efficiency in production processes [,,,,] and its impact on reducing pollutant emissions [,,,], which remains one of the priorities in the era of implementing Industry 4.0 solutions.
Despite this broad scope of studies, there is a lack of analyses that would integrate different perspectives of process evaluation from its duration, through the distance traveled by internal transport vehicles, to the resulting energy and environmental impacts. Existing approaches often concentrate on individual aspects (e.g., energy efficiency or transport optimization), which limits the possibility of a comprehensive assessment of the effects of logistics process reorganization.
The research gap therefore concerns the development of an approach that enables a simultaneous and comprehensive operational and environmental analysis based on realistic operational data and simulation tools. The solution proposed in this study consists of the structured application of computer simulation for the concurrent evaluation of key parameters of production and logistics processes, such as process duration, transport routes, energy consumption, and CO2 emissions. The novelty of this approach lies in demonstrating the potential of simulation not only for assessing production process efficiency, but also for analyzing ecological aspects—including verification of emission reduction potential through shortening transport routes and limiting the number of battery charging cycles. Such an approach allows for a more realistic and multidimensional assessment of the consequences of process reorganization in a production environment.
2. Materials and Methods
This study analyzed the actual production process of components used in the automotive industry. The analyzed technological process included seven independent workstations, each performing specific operations within a production sequence. Each workstation had a precisely defined unit time for each operation (Table 2).

Table 2.
Duration of individual production operations.
The production batch size depended on the specific nature of the received order and could vary depending on the production station. In the analyzed case, it was 700 pieces (100 pieces at each production station). Input material was delivered to selected stations via AGV, which were part of the automated internal logistics system. The analyzed intralogistics system utilized two AGVs (AGV 1 and AGV 2), whose task was to transport materials from the raw materials warehouse to the appropriate workstations (Table 3).

Table 3.
Parameters of autonomous AGVs.
The vehicle control system was equipped with a prioritization algorithm, enabling transport to be directed to the first available station ready to begin production. Implementation of the algorithm also ensured collision-free movement of vehicles within the production hall, minimizing the risk of disruptions and delays in material flow (Figure 1).
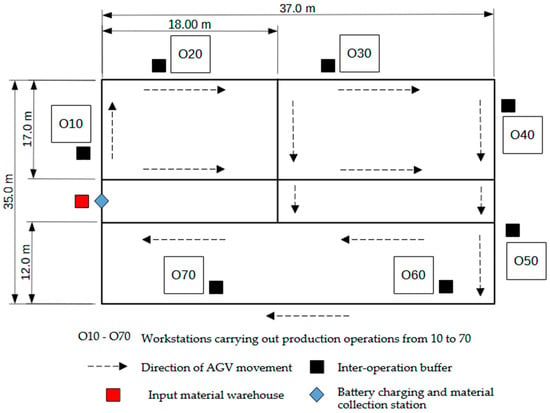
Figure 1.
Scheme of the arrangement of stations and transport paths.
Achieving the assumed goal, which was to assess the potential of using computer simulation as a tool supporting the process of reducing the consumption of electricity used by electric forklifts in logistics processes, was possible thanks to the development of a four-step methodology (Figure 2).
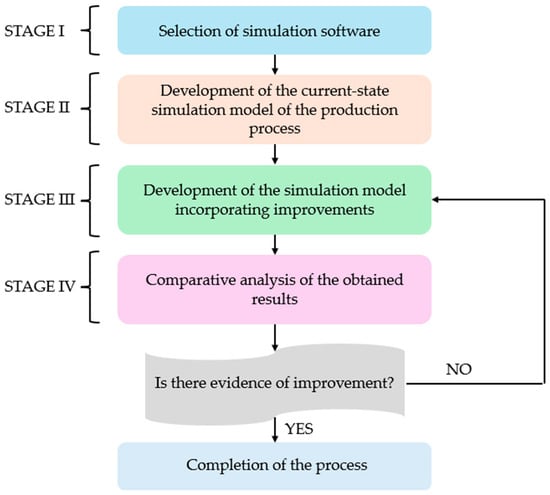
Figure 2.
Own work methodology.
In the initial phase of this study, selecting the appropriate simulation tool was crucial. It would enable a faithful representation of the studied production and logistics system and provide access to extensive analytical functions for assessing its operational efficiency. For this purpose, the commercial simulation package FlexSim, version 22.2.1, was chosen. FlexSim software was chosen based on access to a license, which allowed for analysis, and a wide range of tools enabling detailed modeling and analysis of complex industrial processes and their logistics support. FlexSim software provides advanced modeling functionality based on an object-oriented architecture. Its structure enables the integration of graphical logic blocks with mechanisms for managing material flow and controlling resource movement within the studied system. This configuration of the environment enabled the effective achievement of research goals, including:
- Creating complex process logic using the Process Flow module, which allows for the definition of decision-making and operational rules, enabling a faithful representation of the temporal and functional relationships occurring in the analyzed system;
- Conducting a detailed assessment of system performance based on automatically generated reports and data summaries, resource utilization statistics, and operation completion times, as well as exporting results to external computing tools for further analysis;
- Simulating logistics processes typical of an industrial environment, including component and material flow management and analysis of internal transport routes.
- Accurately representing the dynamics of production flow, including the supply of work stations with necessary raw materials, components, and equipment, the management of storage buffers, and the analysis of load distribution for work stations and storage points (e.g., intermediate warehouses, storage bays).
The next stage of the study required the development of a simulation model that would replicate the actual course of the analyzed production process. The goal was to quantify process performance in relation to the planned production schedule and analyze the functioning of the internal transportation system, which plays a significant role in the implementation of logistics tasks. The simulation enabled precise control and recording of selected variables responsible for process execution time, resource utilization, and the load on transportation equipment. The selection of these parameters was based on their importance for assessing the smoothness of operations and the potential for implementing improvements and their multi-criteria evaluation. The parameters used in the simulation are summarized in Table 4, along with a description of their functions and the justification for the need for monitoring.

Table 4.
Parameters analyzed during simulation.
Based on data obtained from the simulation, which took into account the individual operating parameters of each autonomous vehicles, activities were carried out to determine the total electricity consumption during the implementation of the assumed production plan. Next, taking into account the electric capacity of AGVs batteries, the number of necessary charges for the entire transport system (N) was determined.
where
n—number of means of transport [pcs.];
Dl—distance traveled by means of transport with load [km];
De—distance traveled by means of transport without load [km];
El—average electricity consumption per unit distance when driving with load [Wh/km];
Ee—average electricity consumption per unit distance when driving without load [Wh/km];
C—battery capacity of the means of transport [Wh].
Based on the estimated number of charging cycles and the total electricity consumption of autonomous vehicles, an assessment of carbon dioxide (CO2) emissions generated during the battery charging process was conducted. This analysis is crucial for assessing the environmental impact of the transport system and planning actions to reduce greenhouse gas emissions.
where
E—total electricity consumption [kW].
EI—carbon dioxide (CO2) emissions factor per unit of electricity, determined based on the source of energy supplied to the charging system. Based on the 2024 report of the National Centre for Emissions Balancing and Management the EI factor for Poland is 0.597 kg CO2 per each kilowatt-hour (kWh) produced.
In the third stage of the proposed methodology, changes in the routes covered by internal transport means were verified using computer simulation (Figure 3).
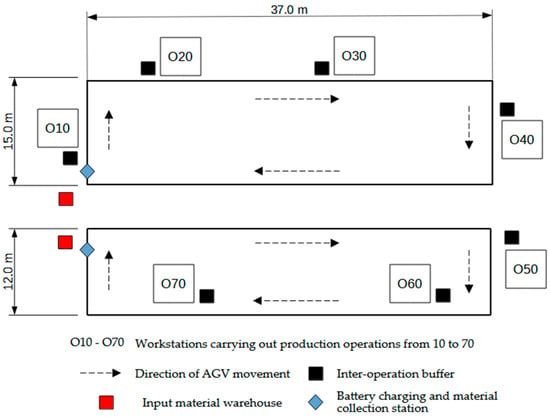
Figure 3.
Diagram of the arrangement of stations and transport paths after the improvements were introduced.
The goal of modifying the routes of AGVs was primarily to reduce electricity consumption, limit the number of charging cycles, and shorten the overall production process time. The process of designing a new transport path for autonomous vehicles considered the possibility of creating transport groups to ensure autonomous and uninterrupted system operation. A key aspect of the analysis was to improve material flow and maintain the system’s operational flexibility. The inability to change the location of production stations was a limitation in designing new transport paths. The improved solution now includes two charging stations for AGV 1 and AGV 2, as well as separate input material collection points. The total length of the transport path has been shortened. Actions to streamline the internal transport process were implemented according to the following assumptions:
where
di—distance covered in cycle i [km];
vi—average transport speed in cycle i [m/s];
tiload—loading time in cycle i [h];
tiunload—unloading time in cycle i [s];
tjcharge—charging time in cycle i [s];
N—number of charging cycles;
Echarge—energy consumed on one full charge [kW].
A computer simulation of the variant that incorporated the modified internal transport route was conducted similarly to the current simulation. The same production process parameters were considered, particularly the production operation time and the technical characteristics of the AGVs.
The final stage of the proprietary methodology proposed in this paper was a comparative analysis of the obtained results and an assessment of the universality of the developed approach in the context of diverse production plans. Verification was performed based on historical data covering various levels of production volumes implemented at selected production stations (18 variants). Statistical tests were used to assess the reliability and validity of the obtained results, determining the statistical significance of differences between the parameters generated in terms of electricity consumption by the process that incorporated the new route and the results obtained for the baseline version.
3. Results
In accordance with the assumptions presented in the methodology (Chapter 2), the first stage of the research was to develop a digital simulation model using the FlexSim environment. The goal of this stage was to replicate the actual production process in terms of inter-operational transport and related operational parameters. The developed model included key elements of the plant’s infrastructure, such as workstations, operational buffers (queues), raw material sources, input material warehouses, autonomous transport systems (AGVs), and a network of transport paths. The computer simulation used parameters relating to both the production process and the operation of AGVs, taken from Table 2 and Table 3. They constituted the starting point for analyses—both for the scenario reflecting the current state and for the variant taking into account the implemented improvements. All components were arranged in the simulation space in accordance with the actual spatial layout of the production hall (Figure 4).
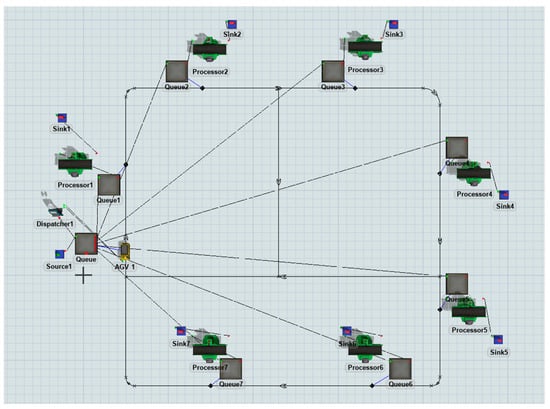
Figure 4.
Model of the production process in the FlexSim simulation software.
The operational parameters of individual facilities actively participating in the process (including production stations and means of transport) were defined based on actual data obtained from the analyzed industrial environment, in accordance with the information presented in Section 2.
As a result of the simulation, data was obtained, including the distance traveled by autonomous AGVs as part of the implementation of the assumed production plan (Figure 5).
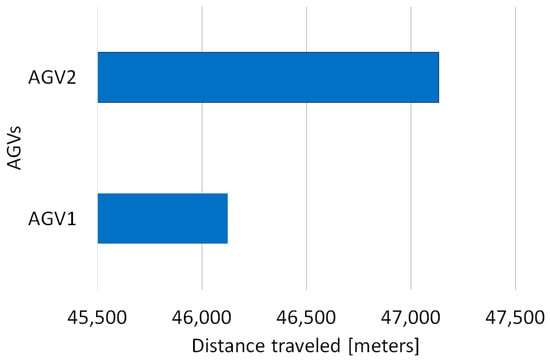
Figure 5.
Distance traveled in meters by autonomous AGV1 and AGV 2.
AGV 2 traveled the longest distance, covering over 47,133 m. The distance traveled by AGV 1 was over 46,122 m. The total distance traveled by both modes of transport was 93,255 m.
To determine the number of vehicle loads required to complete the internal transport process, computer simulation was used to determine the parameters related to the AGV utilization rate (Figure 6).
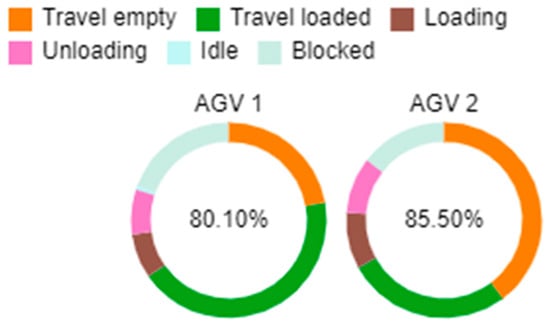
Figure 6.
Level of utilization of AGV 1 and AGV 2.
Based on the obtained results, it was determined that for AGV 1, the percentage share of loaded operation was 43.08%, while the percentage of unloaded operation was 22.18%. For AGV 2, these values were 27.17% (loaded) and 39.75% (unloaded), respectively.
Based on the calculations (Formula 1), it was determined that the total number of battery charges required for both vehicles was four, with two charging sessions for each truck (AGV 1–2 charges, AGV 2–2 charges).
Total electricity consumption was 4635.26 Wh for AGV 1 and 4713.30 Wh for AGV 2. Based on these data, the total carbon dioxide (CO2) emissions associated with the operation of both trucks were calculated to be 5580 g.
The utilization rate of the production stations in the analyzed process varied. The lowest percentage share was recorded for stations 7 (operation 70) and 1 (operation 10). The highest utilization rate was attributed to the station performing operation 60 (Figure 7).
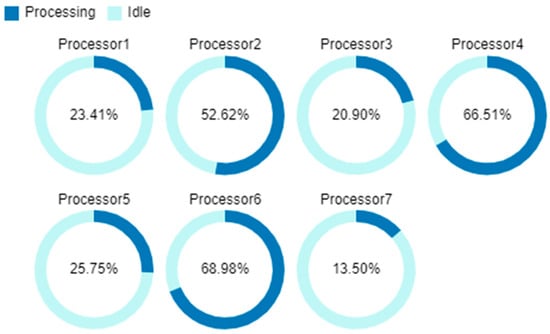
Figure 7.
Level of utilization of production stations.
The total duration of the production process was 21.93 h and included the battery charging time.
Then, in accordance with the adopted methodology, a computer simulation was carried out taking into account the modified route of AGVs (Figure 8).
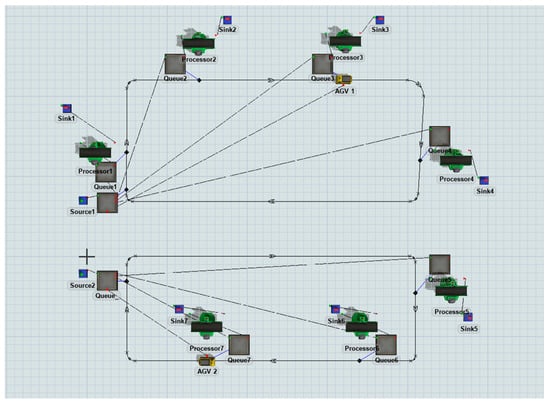
Figure 8.
The production process model in the FlexSim simulation software after the improvements were introduced.
As a result of the simulation, data was obtained regarding, among others, the distance traveled by AGVs as part of the production plan implementation (Figure 9).
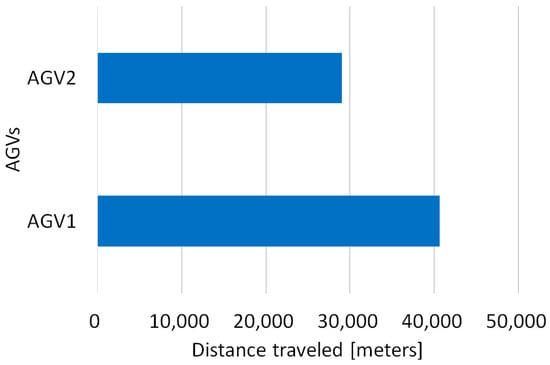
Figure 9.
Distance travelled in meters by AGV 1 and AGV 2 after the improvements were introduced.
The total distance covered by autonomous AGVs participating in internal transport after implementing the proposed improvements was over 69,648 m. The percentage of operation of the trucks in the loaded and unloaded mode is shown in Figure 10.
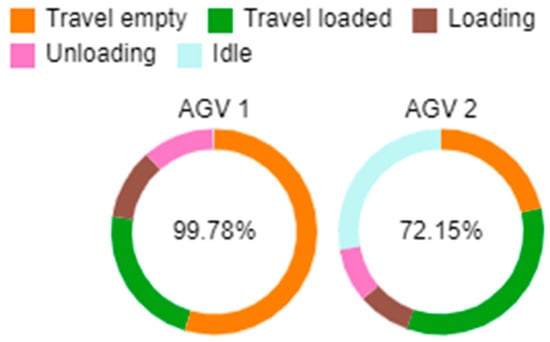
Figure 10.
Level of utilization of AGV 1 and AGV 2 after the improvements introduced.
The percentage of loaded operation time for AGV 1 was 22.71%, while unloaded operation time was 54.65%. For AGV 2, the share of loaded transport accounted for 34.02% of the total operating time, while unloaded operation time was 21.33%. At the same time, the combined percentage of both AGVs increased by 6.33 percentage points.
The total number of battery charges required to complete the planned production plan remained unchanged from the initial route version and amounted to 4. The total electricity consumption of both AGVs was 6994.82 Wh. CO2 emissions were reduced by 1409 g, reaching 4171 g.
Analysis of work station utilization showed an increase in the percentage of work stations used. The largest change occurred at work station number 6 (operation 60), where utilization increased by more than 25 percentage points. The high utilization rate of work station number 6 (94.33%) may be causing a bottleneck, but analysis of the buffer stock levels revealed that no inter-operation stock was being generated during the production process, (Figure 11).
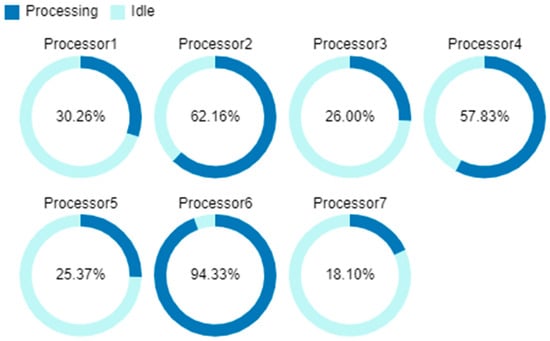
Figure 11.
The level of utilization of production stations after the improvements introduced.
The total production process time was 18.95 h, representing 86.4% of the production process time before the improvements were implemented. Table 5 presents a summary comparison of key parameters generated before and after the implementation of improvements.

Table 5.
Parameters before and after improvements.
In accordance with the work methodology, the final stage involved a statistical analysis of the impact of the proposed solution on the level of electricity consumption in the context of the internal transport route performed by the AGV. The statistical analysis was based on completed production batches ranging from 160 to 2384 units, based on historical data (18 variants).
The obtained results were verified in a two-stage process. The first stage compared the energy consumption per unit of product before and after the organizational changes were implemented. To select an appropriate statistical test to verify the hypothesis of a statistically significant difference between the study groups, a Shapiro–Wilk test was conducted to assess the normality of the data distribution. The test results indicated that the energy consumption distributions, both before and after the changes, were not normal (in both cases p < 0.001).
Based on the non-normal distribution and independence of the tested samples, the Mann–Whitney test for independent samples was used to verify the null hypothesis, with a confidence level of 0.05. This test allows for the assessment of differences between the medians of the two groups. The test results showed a statistically significant difference between the groups (p < 0.001). Before the changes were introduced, the median energy consumption per unit of product was 11.71 Wh, while after the changes it decreased to 10.01 Wh (Figure 12).
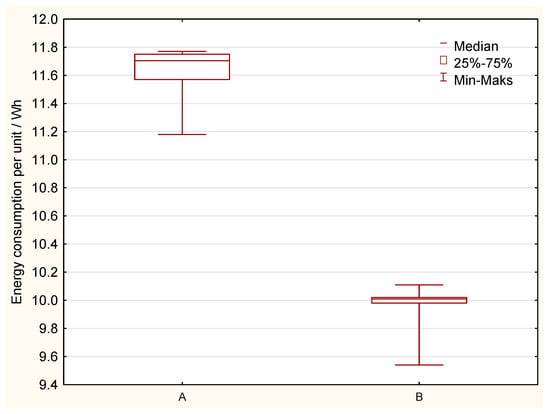
Figure 12.
Energy demand before (A) and after changes (B).
For each analyzed batch size, the percentage reduction in energy consumption was calculated, ranging from 12.47% to 15.10%. Pearson linear correlation analysis was then performed to examine the relationship between batch size and energy consumption reduction. The results showed a statistically significant correlation (p = 0.011), indicating that as batch size increases, the percentage reduction in electricity consumption increases. This relationship indicates that the verified solution will improve emission results in larger production batches, which may be important information for people responsible for production planning (Figure 13).
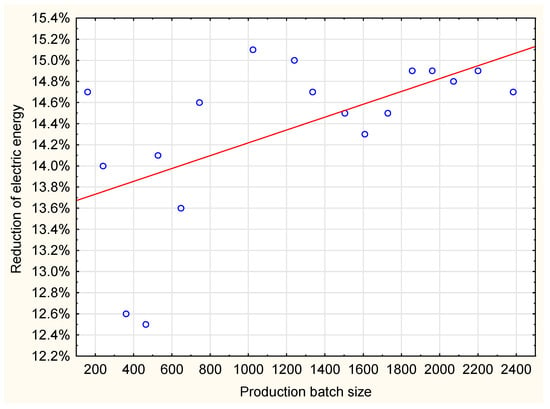
Figure 13.
Reduction in electric energy demand as a function of production batch size.
Based on the analysis of the obtained results, it was found that in eight cases, concerning the verified batch sizes and corresponding AGV1 and AGV2 internal transport distances, a change in the number of battery charges was observed. The most significant differences occurred for batch sizes of 2072 and 2200 units, where the variant with the implemented improvements reduced the number of charges by two. This reduction in the number of charges naturally contributed to a shorter duration of the analyzed manufacturing process.
4. Discussion
The results of the conducted research confirm the high usefulness of computer simulation as a tool supporting the process of analysis and optimization of internal logistics, which confirms the results of research presented in publications [,,]. In the analyzed case, computer simulation allowed for improving parameters in the context of assessing energy consumption and pollutant emissions related to the operation of AGVs. The use of the simulation environment allowed for the representation of actual operating conditions, as well as for conducting a scenario analysis, enabling the identification of the relationship between the organization of material flow and the energy and environmental parameters of the process.
It should be emphasized that one of the significant achievements of this study is filling a research gap identified in the literature concerning the lack of an integrated approach combining internal logistics analysis with environmental assessment based on actual production data. Previous publications often focus on operational or cost optimization, rarely considering emissions related to electricity consumption by transport vehicles. The presented approach therefore constitutes a valuable contribution to the development of analytical tools dedicated to planning low-emission production systems.
Computer simulation has proven particularly useful in testing various organizational variants without interfering with the actual production process, which is crucial in industrial environments where the opportunity for experimentation in real-world conditions is severely limited. This allows for assessing not only the impact of proposed changes on operational efficiency but also on energy consumption and the resulting greenhouse gas emissions. Furthermore, by modeling the complex interdependencies between resources, schedules, and routes, the simulation tool can provide a basis for strategic decision-making that takes into account not only production goals but also environmental and regulatory requirements.
The adaptability of the presented methodology should also be emphasized. Although the study focuses on a specific case study from the automotive industry, the adopted approach can be scaled and adapted to other sectors where internal transportation based on electric vehicles is used. The availability of accurate operational data and its implementation in a simulation environment are prerequisites for the successful transfer of this method to other contexts.
Further research prospects include expanding the analyses to include the full energy balance of the transport system, including the energy sources used to charge electric vehicles. Because the structure of the energy mix has a direct impact on carbon dioxide (CO2) emissions, taking this factor into account would allow for an even more precise environmental assessment. In this context, it also seems reasonable to consider the integration of renewable energy sources, e.g., powering AGVs with photovoltaic installations, which could lead to a significant reduction in operational emissions in the long term. Furthermore, extending the analyses to include life-cycle assessment (LCA) methodology would enable the inclusion of not only operational emissions but also indirect emissions related to the production and disposal of vehicles and technical infrastructure.
5. Conclusions
This article presents the results of research on the potential for reducing electricity consumption and carbon dioxide (CO2) emissions generated by AGVs in internal transport processes. For this purpose, a computer simulation was developed and carried out in the FlexSim 22.2.1 environment, reflecting the actual production conditions in an industrial plant. The main objective of the study was to determine whether reorganizing transport routes and AGV operation schedules could improve energy efficiency and reduce negative environmental impacts.
Analysis of the results showed that in the baseline scenario, the AGV fleet’s electricity consumption was 9348.56 Wh, which, taking into account the emission factor for electricity in Poland (0.597 kg CO2/kWh), translates to emissions of 5580 g CO2. In the optimized scenario, which takes into account changed transport paths and a more even distribution of tasks, energy consumption decreased to 6994.82 Wh, which corresponds to emissions of 4171 g CO2. This means a reduction in emissions of approximately 25 percentage points, achieved together with the improvement of the process timing parameters. The number of battery charges in both scenarios remained unchanged and was 4.
The simulation also allowed for a precise assessment of the utilization of inter-operational transport means, identifying areas of inefficiency, such as uneven AGV load or unused production buffer capacity. This allowed for the proposal of specific organizational improvements that not only improved energy efficiency but also increased the consistency and smoothness of the entire logistics process.
In accordance with the work methodology, the final stage involved a statistical analysis of the impact of the proposed solution on the level of electricity consumption in the context of the internal transport route performed by the AGV. The statistical analysis was based on completed production batches ranging from 160 to 2384 units, based on historical data (18 variants).
Statistical verification was conducted in two stages. Comparison of energy consumption per unit before and after the changes showed that median energy consumption decreased from 11.71 to 10.01 Wh (mean 11.18 Wh to 9.54 Wh). The difference between groups was verified using the Mann–Whitney test for independent samples at a confidence level of 0.05, which demonstrated statistical significance (p < 0.001).
For each analyzed production batch size, a percentage reduction in energy consumption was calculated, ranging from 12.47% to 15.10%. Pearson’s linear correlation analysis revealed a statistically significant relationship (p = 0.011) between production batch size and the level of energy reduction—with increasing batch size, increased energy efficiency was observed.
Furthermore, based on the analysis of verified batch sizes and the corresponding distances covered by AGV1 and AGV2 during internal transport, changes in the number of charging cycles were observed in eight cases. The largest differences were observed for batch sizes of 2072 and 2200 units, where the number of battery charging cycles decreased by two in favor of the improved variant. This reduction in the number of charging cycles contributed to a shorter manufacturing process, which positively impacted the efficiency of the entire system.
The research results confirm that simulation tools provide significant support for planning and reorganizing internal transport processes, enabling the optimization of material flows, resource allocation, and quantitative assessment of the impact of changes on carbon footprints and other environmental indicators. The methodology employed demonstrates high adaptability and can be implemented across various industrial sectors, aligning with the goals of sustainable development and industrial decarburizations within Industry 4.0.
Author Contributions
Conceptualization, S.P.; methodology, S.P.; validation, K.N.; investigation, S.P.; resources, M.S.; writing—original draft preparation, S.P.; writing—review and editing, M.S.; visualization, K.N.; supervision, M.S. All authors have read and agreed to the published version of the manuscript.
Funding
This work was supported by the statutory grant of Silesian University of Technology BK-224/RM1/2025 (11/010/BK_25/0057).
Institutional Review Board Statement
Not applicable.
Informed Consent Statement
Not applicable.
Data Availability Statement
The original contributions presented in this study are included in the article. Further inquiries can be directed to the corresponding author.
Conflicts of Interest
The authors declare no conflicts of interest.
References
- Jaskó, S.; Ruppert, T. The Future of Manufacturing and Industry 4.0. Appl. Sci. 2025, 15, 4655. [Google Scholar] [CrossRef]
- Lombardi, M.; Pascale, F.; Santaniello, D. Internet of Things: A General Overview between Architectures, Protocols and Applications. Information 2021, 12, 87. [Google Scholar] [CrossRef]
- Mansour, M.; Gamal, A.; Ahmed, A.I.; Said, L.A.; Elbaz, A.; Herencsar, N.; Soltan, A. Internet of Things: A Comprehensive Overview on Protocols, Architectures, Technologies, Simulation Tools, and Future Directions. Energies 2023, 16, 3465. [Google Scholar] [CrossRef]
- Amin, F.; Abbasi, R.; Mateen, A.; Ali Abid, M.; Khan, S. A Step toward Next-Generation Advancements in the Internet of Things Technologies. Sensors 2022, 22, 8072. [Google Scholar] [CrossRef]
- Dhiman, R.; Miteff, S.; Wang, Y.; Ma, S.-C.; Amirikas, R.; Fabian, B. Artificial Intelligence and Sustainability—A Review. Analytics 2024, 3, 140–164. [Google Scholar] [CrossRef]
- Soori, M.; Arezoo, B.; Dastres, R. Artificial intelligence, machine learning and deep learning in advanced robotics, a review. Cogn. Robot. 2023, 3, 54–70. [Google Scholar] [CrossRef]
- Hornsey, R.L.; Hibbard, P.B. Current Perceptions of Virtual Reality Technology. Appl. Sci. 2024, 14, 4222. [Google Scholar] [CrossRef]
- Strzałkowski, P.; Bęś, P.; Szóstak, M.; Napiórkowski, M. Application of Virtual Reality (VR) Technology in Mining and Civil Engineering. Sustainability 2024, 16, 2239. [Google Scholar] [CrossRef]
- Arena, F.; Collotta, M.; Pau, G.; Termine, F. An Overview of Augmented Reality. Computers 2022, 11, 28. [Google Scholar] [CrossRef]
- Emmert-Streib, F. Defining a Digital Twin: A Data Science-Based Unification. Mach. Learn. Knowl. Extr. 2023, 5, 1036–1054. [Google Scholar] [CrossRef]
- Botín-Sanabria, D.M.; Mihaita, A.-S.; Peimbert-García, R.E.; Ramírez-Moreno, M.A.; Ramírez-Mendoza, R.A.; Lozoya-Santos, J.d.J. Digital Twin Technology Challenges and Applications: A Comprehensive Review. Remote Sens. 2022, 14, 1335. [Google Scholar] [CrossRef]
- Singh, M.; Fuenmayor, E.; Hinchy, E.P.; Qiao, Y.; Murray, N.; Devine, D. Cyfrowy bliźniak: Od początku do przyszłości. Appl. Syst. Innov. 2021, 4, 36. [Google Scholar] [CrossRef]
- Kampa, A. Modeling and Simulation of a Digital Twin of a Production System for Industry 4.0 with Work-in-Process Synchronization. Appl. Sci. 2023, 13, 12261. [Google Scholar] [CrossRef]
- Christ, L.; Milloch, E.; Boshoff, M.; Hypki, A.; Kuhlenkötter, B. Implementation of Digital Twin and Real Production System to Address Actual and Future Challenges in Assembly Technology. Automation 2023, 4, 345–358. [Google Scholar] [CrossRef]
- Florescu, A. Cyfrowy bliźniak dla elastycznych systemów produkcyjnych i optymalizacji poprzez symulację: Studium przypadku. Machines 2024, 12, 785. [Google Scholar] [CrossRef]
- Lu, Y.; Liu, C.; Kevin, I.; Wang, K.; Huang, H.; Xu, X. Inteligentna produkcja oparta na cyfrowym bliźniaku: Konotacje, model odniesienia, zastosowania i problemy badawcze. Robot. Comput. Integr. Manuf. 2020, 61, 101837. [Google Scholar] [CrossRef]
- Liu, M.; Fang, S.; Dong, H.; Xu, C. Review of digital twin about concepts, technologies, and industrial applications. J. Manuf. Syst. 2020, 58, 346–361. [Google Scholar] [CrossRef]
- Tao, F.; Zhang, H.; Liu, A.; Nee, A.Y.C. Cyfrowy bliźniak w przemyśle: Stan techniki. IEEE Trans. Ind. Inf. 2019, 15, 2405–2415. [Google Scholar] [CrossRef]
- Errandonea, I.; Beltrán, S.; Arrizabalaga, S. Cyfrowy bliźniak do konserwacji: Przegląd literatury. Comput. Ind. 2020, 123, 103–316. [Google Scholar]
- Rigó, L.; Fabianová, J.; Lokšík, M.; Mikušová, N. Utilising Digital Twins to Bolster the Sustainability of Logistics Processes in Industry 4.0. Sustainability 2024, 16, 2575. [Google Scholar] [CrossRef]
- Bandara, L.V.; Buics, L. Digital Twins in Sustainable Supply Chains: A Comprehensive Review of Current Applications and Enablers for Successful Adoption. Eng. Proc. 2024, 79, 64. [Google Scholar] [CrossRef]
- Roman, E.-A.; Stere, A.-S.; Roșca, E.; Radu, A.-V.; Codroiu, D.; Anamaria, I. State of the Art of Digital Twins in Improving Supply Chain Resilience. Logistics 2025, 9, 22. [Google Scholar] [CrossRef]
- Resman, M.; Debevec, M.; Herakovič, N. Using Digital Twin Technology to Improve the Organization of the Supply Chain in Piece Type of Production. Systems 2025, 13, 505. [Google Scholar] [CrossRef]
- Werbińska-Wojciechowska, S.; Giel, R.; Winiarska, K. Digital Twin Approach for Operation and Maintenance of Transportation System—Systematic Review. Sensors 2024, 24, 6069. [Google Scholar] [CrossRef]
- Moshood, T.D.; Nawanir, G.; Sorooshian, S.; Okfalisa, O. Digital Twins Driven Supply Chain Visibility within Logistics: A New Paradigm for Future Logistics. Appl. Syst. Innov. 2021, 4, 29. [Google Scholar] [CrossRef]
- Zhang, R.; Zhu, H.; Chang, Q.; Mao, Q. A Comprehensive Review of Digital Twins Technology in Agriculture. Agriculture 2025, 15, 903. [Google Scholar] [CrossRef]
- Wang, L. Digital Twins in Agriculture: A Review of Recent Progress and Open Issues. Electronics 2024, 13, 2209. [Google Scholar] [CrossRef]
- Catala-Roman, P.; Navarro, E.A.; Segura-Garcia, J.; Garcia-Pineda, M. Harnessing Digital Twins for Agriculture 5.0: A Comparative Analysis of 3D Point Cloud Tools. Appl. Sci. 2024, 14, 1709. [Google Scholar] [CrossRef]
- Yang, Z.; Tang, C.; Zhang, T.; Zhang, Z.; Doan, D.T. Digital Twins in Construction: Architecture, Applications, Trends and Challenges. Buildings 2024, 14, 2616. [Google Scholar] [CrossRef]
- Park, J.; Lee, J.-K.; Son, M.-J.; Yu, C.; Lee, J.; Kim, S. Unlocking the Potential of Digital Twins in Construction: A Systematic and Quantitative Review Using Text Mining. Buildings 2024, 14, 702. [Google Scholar] [CrossRef]
- Barosz, P.; Gołda, G.; Kampa, A. Efficiency Analysis of Manufacturing Line with Industrial Robots and Human Operators. Appl. Sci. 2020, 10, 2862. [Google Scholar] [CrossRef]
- Sarvan Kumar, U.; Shivraj Narayan, Y. Productivity improvement in a windows manufacturing layout using FlexSim simulation software. Int. J. Res. Advent Technol. 2015, 3, 86–90. [Google Scholar]
- Kikolski, M. Identification of production bottlenecks with the use of Plant Simulation Software. Econ. Manag. 2016, 8, 103–112. [Google Scholar] [CrossRef]
- Gola, A.; Wiechetek, Ł. Modelling and simulation production flow in job-shop production system with Enterprise Dynamics software. Appl. Comput. Sci. 2017, 13, 87–97. [Google Scholar] [CrossRef]
- Pekarcikova, M.; Trebuna, P.; Kliment, M.; Dic, M. Solution of Bottlenecks in the Logistics Flow by Applying the Kanban Module in the Tecnomatix Plant Simulation Software. Sustainability 2021, 13, 7989. [Google Scholar] [CrossRef]
- Fedorko, G.; Molnár, V.; Strohmandl, J.; Horváthová, P.; Strnad, D.; Cech, V. Research on Using the Tecnomatix Plant Simulation for Simulation and Visualization of Traffic Processes at the Traffic Node. Appl. Sci. 2022, 12, 12131. [Google Scholar] [CrossRef]
- Galić, M.; Thronicke, R.; Schreck, B.M.; Feine, I.; Bargstädt, H. Process modeling and scenario simulation in construction using enterprise dynamics simulation software. Electron. J. Fac. Civ. Eng. Osijek-E-GFOS 2015, 6, 22–29. [Google Scholar] [CrossRef]
- Wang, Y.R.; Chen, A.N. Production logistics simulation and optimization of industrial enterprise based on FlexSim. Int. J. Simul. Model. 2016, 15, 732–741. [Google Scholar] [CrossRef]
- Kamrani, M.; Abadi, S.M.H.E.; Golroudbary, S.R. Traffic simulation of two adjacent unsignalized T-junctions during rush hours using Arena software. Simul. Model. Pract. Theory 2014, 49, 167–179. [Google Scholar] [CrossRef]
- Pawlak, S.; Małysa, T.; Fornalczyk, A. Analysis of Production Process Parameters Using Computer Simulation at the Planning Stage. Appl. Sci. 2024, 14, 10863. [Google Scholar] [CrossRef]
- Xin, Y.; Chen, Y.; Li, W.; Li, X.; Wu, F. Refined Simulation Method for Computer-Aided Process Planning Based on Digital Twin Technology. Micromachines 2022, 13, 620. [Google Scholar] [CrossRef]
- Jeon, S.-W.; Lee, D.; Oh, S.-C.; Park, K.-T.; Noh, S.-D.; Arinez, J. Design and Implementation of Simulation-Based Scheduling System with Reinforcement Learning for Re-Entrant Production Lines. Machines 2022, 10, 1169. [Google Scholar] [CrossRef]
- Lewicki, W.; Niekurzak, M.; Wróbel, J. Development of a Simulation Model to Improve the Functioning of Production Processes Using the FlexSim Tool. Appl. Sci. 2024, 14, 6957. [Google Scholar] [CrossRef]
- Daroń, M.; Górska, M. Relationships between Selected Quality Tools and Energy Efficiency in Production Processes. Energies 2023, 16, 4901. [Google Scholar] [CrossRef]
- Urban, W. Energy Savings in Production Processes as a Key Component of the Global Energy Problem—The Introduction to the Special Issue of Energies. Energies 2022, 15, 5158. [Google Scholar] [CrossRef]
- Rokicki, Ł.; Parol, M.; Pałka, P.; Kopyt, M. Reducing the Peak Power Demand and Setting the Proper Operating Regimes of Electrical Energy Devices in an Industrial Factory Using a Multi-Agent System—The Solutions of the DIEGO Project. Energies 2025, 18, 2416. [Google Scholar] [CrossRef]
- Zhao, N.; Li, R.; Yang, X. Harmonogramowanie AGV i optymalizacja zużycia energii w zautomatyzowanych terminalach kontenerowych na podstawie algorytmu wyszukiwania zmiennego sąsiedztwa. J. Mar. Sci. Eng. 2025, 13, 647. [Google Scholar] [CrossRef]
- Sperling, M.; Furmans, K. Energy Requirement Modeling for Automated Guided Vehicles Considering Material Flow and Layout Data. Designs 2024, 8, 48. [Google Scholar] [CrossRef]
- Lemos, J.; Gaspar, P.D.; Lima, T.M. Environmental Risk Assessment and Management in Industry 4.0: A Review of Technologies and Trends. Machines 2022, 10, 702. [Google Scholar] [CrossRef]
- Oláh, J.; Aburumman, N.; Popp, J.; Khan, M.A.; Haddad, H.; Kitukutha, N. Impact of Industry 4.0 on Environmental Sustainability. Sustainability 2020, 12, 4674. [Google Scholar] [CrossRef]
- Zoubek, M.; Poor, P.; Broum, T.; Basl, J.; Simon, M. Industry 4.0 Maturity Model Assessing Environmental Attributes of Manufacturing Company. Appl. Sci. 2021, 11, 5151. [Google Scholar] [CrossRef]
- Martín-Gómez, A.M.; Agote-Garrido, A.; Lama-Ruiz, J.R. A Framework for Sustainable Manufacturing: Integrating Industry 4.0 Technologies with Industry 5.0 Values. Sustainability 2024, 16, 1364. [Google Scholar] [CrossRef]
Disclaimer/Publisher’s Note: The statements, opinions and data contained in all publications are solely those of the individual author(s) and contributor(s) and not of MDPI and/or the editor(s). MDPI and/or the editor(s) disclaim responsibility for any injury to people or property resulting from any ideas, methods, instructions or products referred to in the content. |
© 2025 by the authors. Licensee MDPI, Basel, Switzerland. This article is an open access article distributed under the terms and conditions of the Creative Commons Attribution (CC BY) license (https://creativecommons.org/licenses/by/4.0/).