Abstract
Although wind-assisted ship propulsion (WASP) is an effective technique for reducing the emissions of merchant ships, the best fuel type for complementing WASP remains an open question. This study presents a new original life cycle assessment method for ship fuels that uses a validated ship performance prediction model and actual operation conditions for a WASP ship. As a case study, the method is used to evaluate the fuel consumption and environmental impact of different fuels for a WASP ship operating in the Baltic Sea. Using a novel in-house-developed platform for predicting ship performance under actual operation conditions using hindcast data, the engine and fuel tank were sized while accounting for fluctuating weather conditions over a year. The results showed significant variation in the required fuel tank capacity across fuel types, with liquid hydrogen requiring the largest volume, followed by LNG and ammonia. Additionally, a well-to-wake life cycle assessment revealed that dual-fuel engines using green ammonia and hydrogen exhibit the lowest global warming potential (GWP), while grey ammonia and blue hydrogen have substantially higher GWP levels. Notably, NOx, SOx, and particulate matter emissions were consistently lower for dual-fuel and liquid natural gas scenarios than for single-fuel marine diesel oil engines. These results underscore the importance of selecting both an appropriate fuel type and production method to optimize environmental performance. This study advocates for transitioning to greener fuel options derived from sustainable pathways for WASP ships to mitigate the environmental impact of maritime operations and support global climate change efforts.
1. Introduction
Decarbonizing the shipping industry is crucial for reducing its environmental impact and meeting global climate goals. Shipping plays a vital role in the global economy, facilitating nearly 90% of worldwide trade by cargo mass [1]. However, it also significantly contributes to global greenhouse gas (GHG) emissions, accounting for 2.9% of anthropogenic GHG emissions in 2018 [2]. Without intervention, these emissions could increase to 130% of 2008 levels by 2050, posing a substantial threat to meeting climate objectives. To address this challenge, the International Maritime Organization (IMO) has revised its GHG strategy, aiming to reduce emissions by 20% by 2030 and by 70% by 2040, compared with 2008 levels, with full decarbonization (i.e., net-zero GHGs from shipping) by around 2050. However, the IMO GHG strategies only define targets and aims and do not provide guidance or discuss approaches on how to achieve the emission reductions.
To achieve these regulatory targets, various approaches to reducing emissions by the shipping industry have been proposed [3,4,5,6,7,8]. These include operational measures such as reducing ship speed, implementing weather routing, and optimizing route planning and voyages. Although these strategies are cost-effective and can reduce GHG emissions, they are limited in scope, offering only a maximum reduction of 20% [9], which is insufficient to reach zero emissions. To further reduce shipping emissions, design-oriented measures are essential. Among these, the use of alternative fuels and propulsions is the most promising approach, as it directly targets the source of emissions by replacing carbon-intensive fuels. Unlike other design modifications, such as optimizing the hull shape and improving energy efficiency, alternative fuels impact the GHG emissions for a given power consumption and possibly fully eliminate them, making alternative fuels a crucial solution for achieving full decarbonization while maintaining global trade.
One of the key challenges in using alternative fuels for maritime decarbonization is selecting the most suitable fuel for each type of ship. Life cycle assessments (LCAs) are essential for informed decision-making in this selection and have been the focus of many studies. Law et al. [10] evaluated alternative marine fuel pathways and found that biofuels offer a balanced solution in terms of energy, cost, and emissions, even though each fuel has specific strengths and limitations. Similarly, Huang et al. [11] assessed marine fuels such as methanol, ammonia, and liquid natural gas (LNG), concluding that solar- and battery-based methanol and ammonia provide significant GHG reductions, although zero emissions remain unachievable. Battery-based methanol refers to methanol produced using only solar power (or stored excess solar power) and CO2 captured from the air. Seddiek and Ammar [12] investigated the use of blue and green ammonia, finding that green ammonia significantly reduced emissions, while blue ammonia with fuel cells was more cost-effective. Additionally, Law et al. [13] analyzed seven alternative fuels to heavy fuel oil (HFO) in marine applications. They concluded that while all alternatives offer decarbonization potential, their performance depends on cargo density and voyage distance. This variability underscores the need for detailed LCAs to tailor decarbonization strategies to specific ship types and operational conditions.
Tomos et al. [14] used LCA to compare hydrogen, ammonia, methanol, and waste-derived biofuels as shipping fuels, employing a simplified model to calculate the GHG emissions associated with one year of global shipping fleet operations. They found that the decarbonization potential from alternative fuels alone is insufficient to achieve the 100% emission reduction by 2050 targeted by the maritime sector. They emphasized the need to integrate alternative fuels with other decarbonization strategies, such as slow steaming and wind propulsion; see [4], for an example. Many scholars have studied the use of specific types of ships and fuel alternatives to reduce GHG emissions. Most studies combined models of ship power systems, simplified engine models and related energy management models, and LCA methods. Perčić et al. [15] presented a case study of Croatia’s short-sea shipping sector over the lifetime of roll-on/roll-off (RoRo) passenger ships, analyzing the viability of different ship fuels and electrification while accounting for environmental and economic criteria. They found that electricity-powered ships were the most ecological and cost-effective option among the energy sources considered. Balcombe et al. [16] conducted an environmental life cycle and cost assessment for ships with different types of engines fueled by LNG, HFO, marine diesel oil (MDO), methanol, and ‘renewable fuels’ such as hydrogen, ammonia, biogas, and biomethanol. They concluded that LNG resulted in improved air quality, reduced fuel costs, and moderate climate benefits compared with liquid fossil fuels, but with considerable variation across different LNG engine types. Similarly to Tomos et al. [14], they found that successful decarbonization strategies must include a range of fuels and energy carriers that can be utilized efficiently, depending on ship type and operation conditions.
Li et al. [17] presented a study on marine alternative fuels for decarbonization, where the authors discussed technologies, applications, and challenges. One of the important findings of the study is that the pathway of marine alternative fuels is crucial for achieving low-carbon shipping. One recommendation is to carry out systematic LCA of various marine fuels applied to different ship types and operational conditions, possibly including various combinations of ship power solutions (e.g., fuel cells, batteries, WASP). Kanchiralla et al. [18] investigated how variations in ship operations impact the techno-economic feasibility and environmental performance of fossil-free fuels. Their assessment used three methods: simplified ship power prediction and energy management, LCA, and life cycle cost analysis. They considered several energy carriers, such as battery-electric power and three electro-fuels (hydrogen, methanol, and ammonia), used in combination with engines and fuel cells. Their study focused on three types of ships: a roll-on/roll-off passenger (RoPax) ferry, a tanker, and a service vessel. The results indicate that the potential for global warming reduction depends on the ship type and the most optimal techno-economic solution. The study highlights the need for simulation models and tools that offer ship-type-specific assessment to achieve the most efficient and realistic GHG reductions. Fan et al. [19] conducted a similar study on inland shipping, with their conclusions for this ship segment and its operation conditions aligning with those of Kanchiralla et al. [18].
Simulation tools for ship power systems and energy management have been developed and used to assess power consumption and evaluate the effects of combining different energy carriers and retrofitting alternatives. Barone et al. [20] aimed to reduce port emissions by calculating the electric power required by hybrid ships using batteries and supercapacitors. Their model showed that CO2 emission in port stays can be reduced by 55% by implementing their proposed hybrid power management solution. Ling-Chin and Roskilly [21,22,23] conducted an LCA of a power plant retrofitted on a RoRo ship to evaluate how integrating emerging technologies, such as photovoltaic systems and lithium-ion batteries, can reduce the need for fossil fuels and thereby GHG emissions. Their model focused on the ship’s power system but included a detailed representation of the vessel’s overall performance, including the hydrodynamics, aerodynamics, and operation. They found that hybrid solutions using emerging technologies significantly reduced GHG emissions, with the LCA’s eco-indicator showing a considerable improvement compared with that of the reference vessel without hybrid technology. Park et al. [24] conducted a comparative LCA of zero-carbon fuels, ammonia, hydrogen, diesel, and inland electricity using a simplified ship energy power system model and a well-to-wake (WTW) environmental impact model for ferry traffic along the UK coast. They found that, at a conceptual level, integrating zero-carbon fuels as energy carriers could reduce GHG emissions by approximately 20% compared with pure diesel engines. Perčić et al. [25] presented a similar study for Croatian short-sea shipping traffic and found that lithium-ion batteries were the most appropriate alternative according to both environmental and economic indicators.
Trivyza et al. [26] performed a state-of-the-art review of decision support methods for sustainable ship energy systems. They identified the need for research and methods that take a more holistic approach, incorporating safety and reliability indicators as well as social sustainability. WTW models must include methods and models that accurately represent physical processes at all model fidelity levels to ensure that potential energy savings are not overestimated, leading to recommendations of inappropriate energy carriers for specific ship types and operating conditions. Methods and models that use machine learning and neural networks, such as those proposed by Wu et al. [27] and Yan et al. [28], have the potential to optimize energy carrier and power management solutions if data from a validated physics-based model are available as the base case.
Wind-assisted ship propulsion (WASP) has been widely studied as an essential retrofitting solution that can reduce GHG emissions for existing ships. These studies typically focus on net power savings under various operating conditions by considering the positive effects of sails, such as extra thrust, and negative hydrodynamic effects, such as added resistance from drift, heel, and rudder effects. Ships with sails require significantly less fossil fuel, although the reduction depends on the ship type, operation conditions, and type of sail used. Effective methods and models are crucial for obtaining reliable recommendations for decision-makers [26]. In addition, ships equipped with sail technology still require additional energy carriers to power the engine when wind conditions cannot generate the thrust needed to maneuver the ship or maintain the target speed, or when the sails must be reefed during severe weather.
Previous studies have shown that the most suitable alternative fuel depends on the ship type and operational conditions, highlighting the need for tailored fuel solutions. However, the question of which fuel best complements WASP has not yet been examined, despite the emergence of sails as an effective green technique for merchant ships. This study fills this gap by combining a novel and previously validated ship performance prediction model ([29,30,31]) with an LCA method to guide fuel selection for sailing merchant ships. The ship performance model, which considers realistic routes and weather conditions, is used to estimate the fuel consumption of the ship. This is a unique feature of the present work compared to other scholars’ studies, as previous LCA studies have typically relied on simplified fuel consumption predictions based on a fixed specific fuel consumption (SFC) value for the entire operation of the ship. Furthermore, unlike most previous studies that typically focus on a single CO2-reducing measure, our work investigates two distinct strategies, which offers greater potential to reduce CO2 emissions. This study also considers the fuel tank volume needed for different fuel alternatives, a factor that is rarely considered in other studies. Our prediction model includes all the components required to simulate a ship’s energy performance for actual or historical operations and metocean conditions: hydrodynamics, aerodynamics, engine performance, and energy management system. In this study, the model is enhanced with a feature that enables LCA for alternative fuels as energy carriers. Through our LCA for WASP merchant ships, we compare the environmental impact and the fuel tank volume required of several alternative fuels with that of conventional MDO, estimating their impacts for both the well-to-tank (WTT) and tank-to-wake (TTW) phases. Multiple fuel production pathways are evaluated for the WTW phase, while an in-house platform with actual weather and sea data (hindcast) is used to estimate fuel consumption for the TTW phase. This study provides a novel, comprehensive comparison of alternative fuels for WASP ships, informing decarbonization strategies for specific ship types and operating conditions. A wind-assisted merchant ship operating in the Baltic Sea is used as a case study to demonstrate the methodology. In this work, we focus solely on the environmental impact of the selected fuels. Cost analysis is beyond the scope of this paper and has therefore not been included.
The remaining sections of this paper are organized as follows: Section 2 outlines the methods used to estimate the environmental impacts of different alternative fuels for the WTT and TTW phases. It also describes the ship used in the case study, along with its route and schedule. Section 3 presents the results, comparing the environmental impact of each fuel in detail. Finally, Section 4 concludes this work.
2. Methodology and Methods
LCA is used in this study to investigate the environmental impact of various alternative fuels for a WASP ship. The analysis follows the ISO 14040 standard [32] and involves four steps: defining the goal and scope, inventory analysis, impact assessment, and interpretation. The first three steps are explained in detail in the following and the interpretation step is outlined in Section 3. ISO 14040 provides a framework for evaluating the emissions of products during their full life cycle. In this study, the products are different fuels, making it a WTW analysis. If the ship itself was defined as the product, the assessment would become a cradle-to-grave analysis, involving emissions from building to scrapping the ship.
2.1. Fuel Consumption Model and Data for Life Cycle Assessment
The inventory analysis step involves collecting and quantifying all inputs and outputs throughout the life cycle of each alternative fuel. Since the functional unit in this study is one year of ship operation, the total fuel consumption for each fuel over the one-year period is estimated using our in-house platform. This platform, described in detail in References [29,30,31,33], can simulate a ship’s performance over a realistic route and one-year schedule, accounting for actual sea and weather conditions. It includes an engine model used to estimate power and speed limits, as well as fuel consumption at specific waypoints along the journey; see [33] for validation studies. To determine these limits, we apply the procedure outlined by Tillig et al. [34], which is based on engine data from MAN Energy Solutions. Figure 1 shows the engine load diagram, illustrating the possible operating conditions at various engine speeds, constrained by four boundary lines. Lines 1 to 4 represent the maximum torque at different engine speeds, the maximum mean effective pressure (MEP), the engine’s maximum power, and the maximum engine speed, respectively.
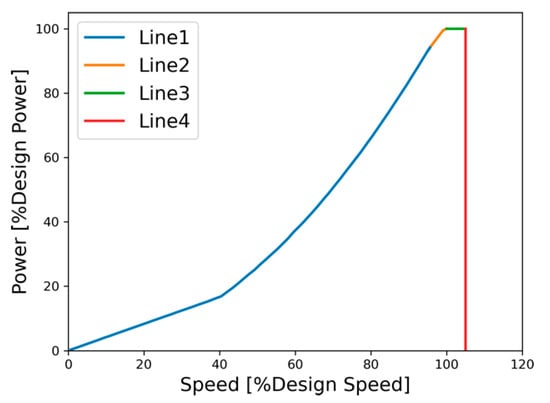
Figure 1.
Assumed engine load based on MAN’s engines. Line1: Maximum torque at different engine speeds. Line2: Maximum mean effective pressure (MEP). Line3: Maximum engine power. Line4: Maximum engine speed.
The fuel consumption of the engine for fuel k at waypoint i in journey j in the year, , is estimated using
where is the required power from the engine; is the brake-specific fuel consumption factor at the waypoint, which is a function of the engine load ; and is the time step of the simulation at the waypoint. at different loads is taken from [35], which is based on the average industry level and publicly available data for engines from the manufacturers Wärtsilä and MAN. The engine load is calculated by dividing the required power of the ship by the engine’s maximum power. The required power includes the auxiliary load. Figure 2 shows these factors for different fuels in dual- and single-fuel engines. These factors are for two-stroke engines as it is assumed that this type of engine is used in the studied ship. Two-stroke engines offer significantly higher thermal efficiency compared to four-stroke engines. Modern low-speed two-stroke engines are increasingly being developed with dual-fuel capability and are optimized for the use of alternative fuels. The minimum load in Figure 2 is 25% of the design load. If fuel consumption at lower loads is required, extrapolation is used. It should be noted that we have assumed a constant auxiliary power consumption of 2 MW for the ship studied in this paper. This means that the engine load will never approach zero. The total annual fuel consumption of the engine is calculated by summing the fuel consumption over all waypoints and journeys throughout the year:
where is the number of journeys in the year and is the number of waypoints in each journey.
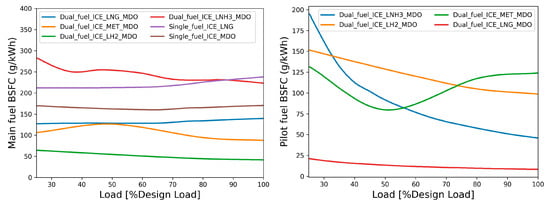
Figure 2.
Brake-specific fuel consumption (BSFC) factor as a function of engine load taken from [35]: (left) BSFC factors for the main fuel in single- and dual-fuel engines, (right) BSFC factors for MDO as the pilot fuel in dual-fuel engines with different main fuels (legends in the plot).
The emission of substance l, , at waypoint i and journey j for can be obtained from
where is the emission factor of emitted substance for in the engine. In this study, the emission factor is divided into two parts: emission factors from the WTT phase, , and those from the TTW phase, , of the fuel life cycle.
The emission factors for the WTT phase of each fuel are obtained using data from the literature presented below. We assume that LNG and MDO are supplied from the Middle East. For LNG, there are several supply chain pathways, each with different emission factors, including extraction method, transportation distance, and liquefaction technology. To provide a representative value, we average the emission factors across these pathways [36,37,38,39,40]. We also consider various pathways for hydrogen production: green hydrogen is assumed to be produced through water electrolysis powered by wind or hydropower; blue hydrogen is produced from natural gas by steam methane reforming (SMR) with carbon capture; and grey hydrogen is produced by the same SMR process without carbon capture [37,41]. Ammonia is assumed to be produced via the Haber–Bosch process using hydrogen. Namely, green, blue, and grey ammonia are obtained according to the hydrogen source [41]. Similarly, methanol is assumed to be produced from either natural gas (NG) or willow (W) biomass [36]. The emission factors for each fuel are summarized in Table 1. The emission factors for the TTW phase of each fuel are similarly based on publicly available data [42,43,44] and are presented in Table 2.

Table 1.
Emission factors in kg/kg for the well-to-tank stage for different fuels [36,37,38,39,40].

Table 2.
Emission factors in kg/kg for the tank-to-wake stage for different fuels [42,43,44].
2.2. Environmental Impact Assessment Model
To assess the environmental impact of each alternative fuel, we consider the global warming potential (GWP) over three time periods: 20 years (GWP20), 100 years (GWP100), and 500 years (GWP500). The characterization factors used to calculate these impact indicators are taken from Pachauri et al. [45] and presented in Table 3. Climate change mitigation is currently the primary environmental driver in the marine industry, especially in the context of alternative fuels. This is reflected in regulatory frameworks such as the IMO GHG Strategy, which focus predominantly on greenhouse gas (GHG) emissions. This is the main reason for selecting GWP as the sole metric to evaluate the environmental impact in this study. Moreover, other environmental impacts—such as acidification, eutrophication, and toxicity—are considered less critical in the early stages of decision-making. A more comprehensive life cycle assessment that includes additional impact categories could be considered in future work, once the GWP reduction potential is clearly established.

Table 3.
Characterization factors used to calculate the environmental impact using global warming potentials (GWPs).
2.3. Case Study Ship and Route
This study aims to assess the environmental impact of different alternative fuels for a WASP merchant ship by considering the emissions associated with each fuel throughout its entire life cycle (WTW). The RoRo cargo ship Tavastland, which operates in the Baltic Sea, is selected as the case study ship; see Table 4 for the ship’s specifications. Tavastland is a merchant ship that can be retrofitted with WASP technology. The ship is assumed to be equipped with four Flettner rotors. Each rotor is 30 m tall and 5 m in diameter, and their positions relative to the aft perpendicular (AP) and fore perpendicular (FP) are depicted in Figure 3. The effect of the Flettner rotors on the energy consumption was extensively studied for this ship with the same route and time frame in Arabnejad et al. [31]. The results showed that these rotors reduced the energy required to complete a journey by about 17% to 40%, depending on the weather. To build on these promising results, we focus on the ship with Flettner rotors to perform the LCA study of different fuels.

Table 4.
Specifications of the Tavastland RoRo cargo ship.

Figure 3.
Locations of Flettner rotors relative to the aft perpendicular (AP) and fore perpendicular (FP) of the ship (Lpp: length between AP and FP; B: beam length).
The functional unit used in this study is the one-year operation of the diesel-powered Tavastland for its route and timetable in 2017. The ship follows a weekly schedule, starting from Oulu (Finland) on Monday at 21:00 CET and returning to the same port the following Monday at 13:00 CET. Stops along the voyage include Kemi (Finland) on Tuesday from 05:00 to 13:00 CET, Husum (Sweden) on Wednesday from 06:00 to 12:00 CET, and Lübeck (Germany) on Friday from 16:00 to 22:00 CET, as illustrated in Figure 4. Table 5 summarizes the information for the legs of the route.
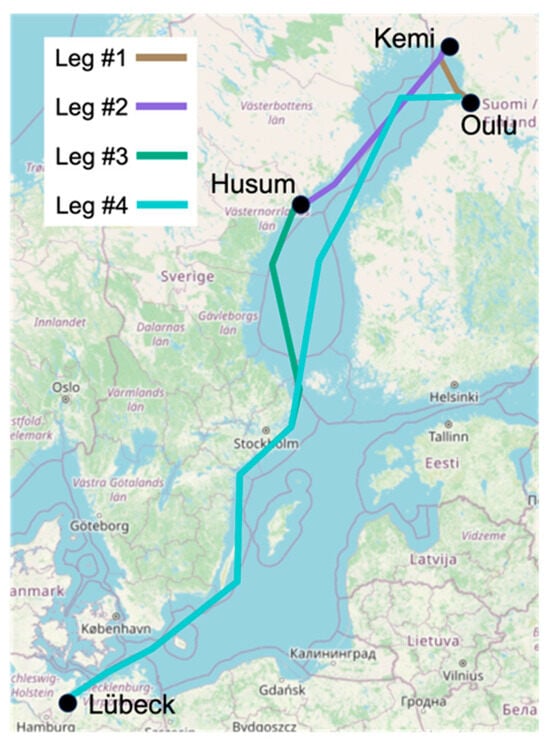
Figure 4.
Routes and legs of Tavastland’s voyage.

Table 5.
Summary of the studied route.
We consider four alternative fuels, LNG, liquid hydrogen, methanol, and liquid ammonia, which are assumed to be used in both single-fuel and dual-fuel engines. LNG and MDO are employed in the single-fuel scenarios, whereas in the dual-fuel scenarios, one of the alternative fuels is used as the main fuel and MDO is used as the pilot fuel. These scenarios are summarized in Table 6.

Table 6.
List of investigated scenarios.
3. Results
This section is divided into two parts, with the results for the case study ship used to demonstrate the methodology. The first part determines the amount of fuel required for one year of the ship’s operation. In this part, the engine and fuel tank capacity are sized for the annual operation of the ship. The second part assesses the environmental impact of each alternative fuel in terms of GWP at various stages of its life cycle, based on different emission indicators.
3.1. Engine Sizing and Determination of Fuel Consumption
To size the engine, the power required over one year of the ship’s operation must be calculated. This is achieved using our in-house-developed platform described in detail in Arabnejad et al. [31], which considers interactions between engine load, power, sail aerodynamics, and ship hydrodynamics. Figure 5 shows the power required from the engine during one year of operation, normalized by the maximum required power throughout the year of 12.30 MW. The engine is sized to 13.52 MW, 1.1 times this value. The variation in Figure 5 is due to weather conditions, with the maximum required power varying for different journeys. Note that if the engine’s output falls below the required power, a loss of speed will occur. The 10% additional capacity is intended to prevent delays and speed loss in the case of harsher weather conditions than those in 2017.
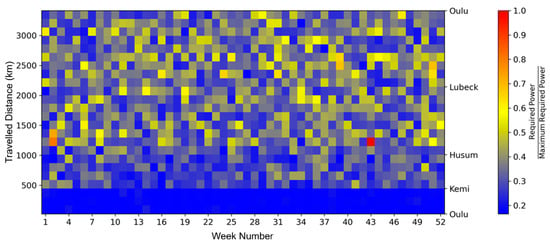
Figure 5.
Power required at different waypoints to complete each journey according to the 2017 schedule. Power values are normalized by the maximum required power (12.30 MW).
Based on the engine size, the engine load at each waypoint is calculated using Equation (1) and the total fuel consumption for the year is determined using Equation (2). Figure 6 compares the total weight of fuel used over one year across the different engine scenarios. The highest fuel weight is obtained for the dual-fuel engine with ammonia as the main fuel (LNH3_MDO in Figure 6), while the lowest is for the dual-fuel engine with LNG as the main fuel (LNG_MDO in Figure 6). The total weight of each fuel for each scenario is later used with the emission factors at different phases of the life cycle (as presented in Table 1 and Table 2) to determine the environmental impact of each scenario.
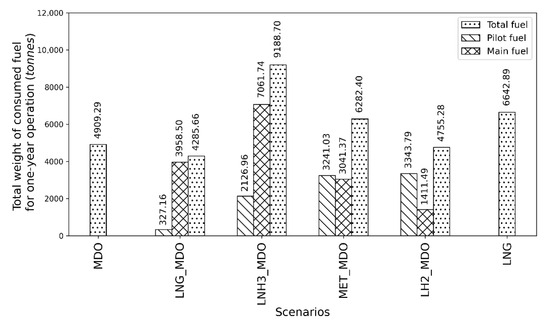
Figure 6.
Total weight of fuel consumed in a year for different scenarios.
Using the estimated fuel consumption, the volume of fuel used during the journeys is calculated for each scenario, which indicates the required fuel tank size. For hydrogen, we assume that liquid storage technology is used, with liquid hydrogen stored at approximately 20 K and 1 bar. The hydrogen density under these conditions is ρH2 = 71 kg/m3. For methanol and MDO, we assume liquid storage at ambient temperature, with densities of ρMeOH = 791 kg/m3 and ρMDO = 860 kg/m3. For ammonia, we assume liquid storage at 8.6 bar and ambient temperature, with a density of ρNH3 = 610 kg/m3. For LNG, we assume storage at 10 bar and 111.15 K, with a density of ρLNG = 448 kg/m3.
Figure 7 illustrates the maximum fuel volumes used per journey over a year for each fuel scenario. The dual-fuel engine operating with hydrogen and MDO (LH2 MDO in Figure 7) requires 430 m3 of liquid hydrogen and 84.09 m3 of MDO, making it the most fuel-intensive option and requiring the largest fuel tank. This is followed by the single-fuel engine operating with LNG, requiring 353.90 m3 of fuel, also suggesting the need for a large LNG tank. The scenario with liquid ammonia and MDO requires 260.48 m3 of ammonia and 46.73 m3 of MDO, resulting in a significant total fuel storage requirement. In contrast, LNG MDO requires 209.86 m3 of LNG and 7.74 m3 of MDO, suggesting a more moderate tank size requirement. MDO has the smallest total fuel volume of 134.29 m3 and would require the smallest tank. Finally, although MET MDO (methanol with MDO) has a relatively low main fuel consumption of 81.82 m3, it also requires 95.08 m3 of MDO, resulting in a total storage need similar to that of other dual-fuel scenarios.
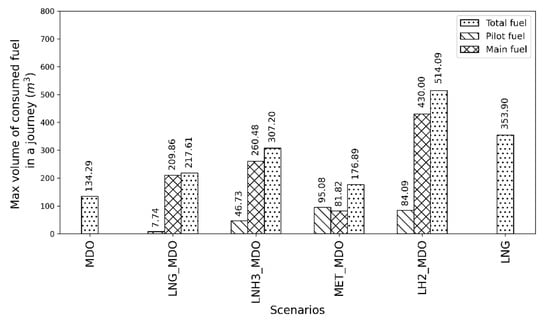
Figure 7.
Maximum volume of fuel consumed in a journey for different scenarios.
3.2. Evaluation of Environmental Impact
Figure 8 illustrates the GWP for the WTT phase of the fuel life cycle over 20, 100, and 500 years for different fuel scenarios. Various fuel pathways are considered for the hydrogen, ammonia, and methanol scenarios (see Section 2.1). The dual-fuel engine using green ammonia (LNH3) with MDO exhibits the lowest GWPs, closely followed by the LNG_MDO configuration. Next are LH2_MDO configuration with green hydrogen, the dual-fuel systems using methanol (both pathways) with MDO and the single-fuel LNG scenario, which have comparable GWP levels. Additionally, the GWPs for scenarios involving ammonia and hydrogen significantly increase for the grey and blue pathways and are considerably higher than those for the single-fuel MDO configuration. This indicates that the environmental benefits of using ammonia and hydrogen as fuels are strongly influenced by their production method. Therefore, careful consideration of the fuel pathway is crucial in assessing the overall climate impact of these alternative fuel systems.
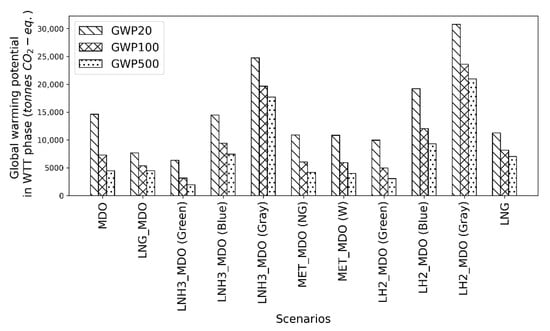
Figure 8.
Global warming potential for the well-to-tank (WTT) phase of various fuel life cycles over 20, 100, and 500 years (GWP20, GWP100, and GWP500, respectively).
Figure 9 presents the GWP over 20, 100, and 500 years for the TTW phase of the life cycle across various scenarios. The lowest GWPs are observed for the dual-fuel engine with ammonia and MDO, followed by the dual-fuel engine with hydrogen and MDO. Interestingly, the dual-fuel engine with methanol and MDO produces similar GWPs to those of the dual-fuel engine using LNG and MDO. The highest GWPs are for the single-fuel engine running on LNG. Notably, the GWPs across all scenarios remain almost constant over the different time periods, except for those involving LNG. This is due to the emission of methane (CH4) from LNG, which has a short atmospheric lifetime, resulting in greater impact in the shorter term.
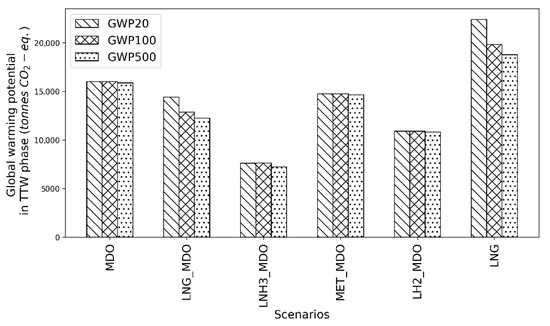
Figure 9.
Global warming potential (GWP) for the tank-to-wake (TTW) phase of various fuel life cycles over 20, 100, and 500 years.
Figure 10 (upper) presents the GWP for the entire life cycle across different fuel scenarios. The lowest GWPs are achieved for the dual-fuel engine using green ammonia. The use of grey ammonia significantly increases the GWPs, though they remain lower than those for the single-fuel MDO engine. The dual-fuel engine with grey ammonia shows almost no advantage over the single-fuel MDO engine. A similar pattern can be observed for the dual-fuel engine with hydrogen, with green hydrogen leading to a substantial reduction in GWPs compared with the single-fuel MDO engine but blue hydrogen offering no benefit and grey hydrogen increasing the GWPs. For dual-fuel engines with methanol, the GWPs are lower than those for MDO, and the two methanol pathways produce similar GWP levels. In the LNG scenarios, the dual-fuel LNG MDO engine results in a smaller reduction in the GWPs than the single-fuel MDO engine. However, the single-fuel LNG engine has higher GWPs than the single-fuel MDO engine. Figure 10 (lower) shows the percentage of GWPs in the WTT phase relative to the entire life cycle for the different fuels. In all scenarios except for dual-fuel engines with grey and blue hydrogen or ammonia, the percentage of GWPs in the WTT phase is below 50%. For dual-fuel engines with grey ammonia and grey hydrogen, the percentage is as high as 70–80%. This indicates that although these fuels appear to be cleaner in the TTW phase, where they are combusted in the engine, their less environmentally friendly production pathways can significantly contribute to global warming.
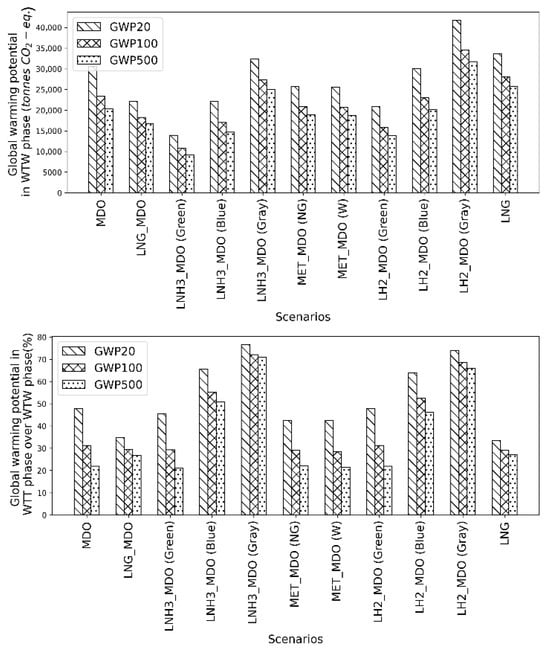
Figure 10.
Global warming potential (GWP) over entire life cycle (upper) for the well-to-wake (WTW) phase for various scenarios over 20, 100, and 500 years; (lower) GWP in the well-to-tank phase (WTT) as a percentage of the GWP over the entire life cycle.
Figure 11 illustrates the emissions of NOx, SOx, and particulate matter (PM) during the WTW phase across the scenarios. All dual-fuel scenarios and the single-fuel LNG scenario produce lower NOx and PM emissions than the single-fuel MDO engine. This trend also holds for SOx emissions, with the exception of the dual-fuel engine using methanol, which produces higher SOx emissions than the MDO single-fuel engine. The data also indicate that the engines using LNG have significantly lower NOx, SOx, and PM emissions than the other fuel scenarios. In addition, the NOx and PM emissions are largely independent of the fuel pathway. This is primarily because they are mainly generated by combustion in the engine, making the specific fuel pathway less influential. However, this independence does not apply to SOx emissions, with scenarios employing green hydrogen and ammonia having significantly lower SOx emissions than those using blue or grey hydrogen. Additionally, scenarios with methanol exhibit a clear dependence of emissions on the fuel pathway, indicating that the production method plays a crucial role in determining the overall environmental impact of these fuels.
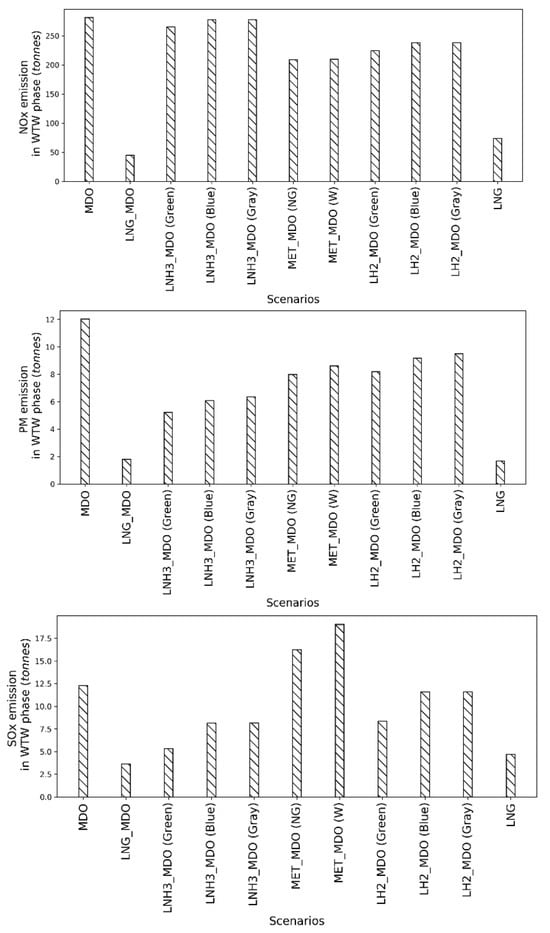
Figure 11.
(Upper) NOx, (middle) PM, and (lower) SOx emissions for the well-to-wake (WTW) phase of various fuel life cycles.
4. Conclusions
We presented a method that incorporates LCA as an important factor in selecting complementary fuels for merchant ships installed with WASP. The method provides a new approach to the holistic design and operation of WASP ships. We performed a detailed analysis of the operational efficiency and environmental impact of various alternative fuels. We concluded that both factors are important in maritime fuel selection, as focusing on only one factor might lead to the selection of an unsuitable fuel. Moreover, to mitigate environmental impacts, greener fuels, particularly those derived from sustainable pathways, should be used.
A novelty of this study is the use of our in-house-developed platform for realistic ship performance prediction, which enabled the sizing of the engine for a WASP ship. This approach took into account fluctuations in real weather conditions encountered by the case study ship during a year of operation on a real schedule. By determining the engine size and calculating the fuel consumption, we determined the total weight of fuel used over the year and the maximum volume of fuel consumed per journey, which indicated the required fuel tank capacity for each scenario. For the dual-fuel engine with hydrogen, the tank capacity should be nearly four times larger than that for an engine with conventional MDO. Using the proposed and simulation methods, we found that the required fuel tank size varied significantly among the scenarios. This underscores the variation of the storage capacity needed for different fuel types, with liquid hydrogen requiring the largest volume, followed closely by LNG and ammonia. The methodology proposed in this study can be applied to other ship types and sail technologies and can be adopted when sizing the engine and considering the fuel tank size for different fuels.
Furthermore, we analyzed the WTW life cycle for a WASP ship to determine the environmental impact of each fuel type. The dual-fuel engine using green ammonia and hydrogen exhibited the lowest GWP, highlighting their potential as alternatives to traditional marine fuels. In contrast, the use of grey ammonia and blue hydrogen significantly increased GWP levels, demonstrating the critical influence of the production pathway on environmental outcomes. This finding underlines the necessity for sustainable production methods to maximize the environmental benefits of alternative fuels. Moreover, NOx, SOx, and PM emissions were consistently lower for dual-fuel and LNG scenarios than for single-fuel MDO engines. However, since SOx emissions depend on the fuel pathway, the fuel production method must be considered to minimize environmental impacts. The findings suggest that while certain alternative fuels can lead to substantial reductions in emissions, careful consideration of both the fuel type and the production pathway is crucial for optimizing environmental performance.
This study was limited to a representative benchmark ship with Flettner rotors operating in the Baltic Sea. Although general findings have been obtained, specific characteristics could be case-dependent. Future research should focus on further refining these analyses by integrating real-world operational data and exploring innovative storage and engine technologies. It would also be interesting to extend the model to include more environmental impact categories, such as acidification potential and eutrophication potential. Future work can also investigate the need for fuel bunkering infrastructure, fuel volume availability, and shipping economics for the various fuel and energy carrier alternatives.
Author Contributions
Conceptualization, M.H.A., F.T., H.-D.Y. and J.W.R.; methodology, M.H.A., F.T. and J.W.R.; software, M.H.A. and F.T.; validation, M.H.A. and F.T.; formal analysis, M.H.A., F.T., H.-D.Y. and J.W.R.; investigation, M.H.A., F.T., H.-D.Y. and J.W.R.; resources, F.T. and J.W.R.; data curation, M.H.A., F.T., H.-D.Y. and J.W.R.; writing—original draft preparation, M.H.A.; writing—review and editing, M.H.A., F.T., H.-D.Y. and J.W.R.; visualization, M.H.A.; supervision, F.T., H.-D.Y. and J.W.R.; project administration, J.W.R.; funding acquisition, M.H.A., F.T., H.-D.Y. and J.W.R. All authors have read and agreed to the published version of the manuscript.
Funding
This study received funding from Chalmers Transport Area of Advance and Chalmers University of Technology Foundation for the strategic research project ‘Hydro- and aerodynamics’.
Data Availability Statement
The data presented in this study are available on request from the corresponding author due to legal reasons.
Conflicts of Interest
The authors declare no conflicts of interest.
References
- Brooks, M.R.; Faust, P. 50 Years of Review of Maritime Transport, 1968–2018: Reflecting on the Past, Exploring the Future; Technical Report; UNCTAD: Geneva, Switzerland, 2018; Available online: https://unctad.org/publication/50-years-review-maritime-transport-1968-2018-reflecting-past-exploring-future (accessed on 15 August 2025).
- IMO. 2023 IMO Strategy on Reduction of GHG Emissions from Ships; Technical Report; Marine Environment Protection Committee, International Maritime Organization: London, UK, 2023; Available online: https://www.imo.org/en/OurWork/Environment/Pages/2023-IMO-Strategy-on-Reduction-of-GHG-Emissions-from-Ships.aspx (accessed on 15 August 2025).
- Du, W.; Li, Y.; Zhang, G.; Wang, C.; Zhu, B.; Qiao, J. Energy saving method for ship weather routing optimization. Ocean Eng. 2022, 258, 111771. [Google Scholar] [CrossRef]
- Julià, E.; Tillig, F.; Ringsberg, J.W. Concept design and performance evaluation of a fossil-free operated cargo ship with unlimited range. Sustainability 2020, 12, 6609. [Google Scholar] [CrossRef]
- Lindstad, H.; Asbjørnslett, B.E.; Strømman, A.H. Reductions in greenhouse gas emissions and cost by shipping at lower speeds. Energy Policy 2011, 39, 3456–3464. [Google Scholar] [CrossRef]
- Wang, H.; Mao, W.; Eriksson, L. A three-dimensional Dijkstra’s algorithm for multi-objective ship voyage optimization. Ocean Eng. 2019, 186, 106131. [Google Scholar] [CrossRef]
- Xing, H.; Spence, S.; Chen, H. A comprehensive review on countermeasures for CO2 emissions from ships. Renew. Sustain. Energy Rev. 2020, 134, 110222. [Google Scholar] [CrossRef]
- Xing, H.; Stuart, C.; Spence, S.; Chen, H. Alternative fuel options for low carbon maritime transportation: Pathways to 2050. J. Clean. Prod. 2021, 297, 126651. [Google Scholar] [CrossRef]
- DNV. DNV Maritime Forecast to 2050. 2023. Available online: https://www.dnv.com/maritime/publications/maritime-forecast/ (accessed on 15 August 2025).
- Law, L.C.; Foscoli, B.; Mastorakos, E.; Evans, S. A comparison of alternative fuels for shipping in terms of lifecycle energy and cost. Energies 2021, 14, 8502. [Google Scholar] [CrossRef]
- Huang, J.; Fan, H.; Xu, X.; Liu, Z. Life cycle greenhouse gas emission assessment for using alternative marine fuels: A very large crude carrier (VLCC) case study. J. Mar. Sci. Eng. 2022, 10, 1969. [Google Scholar] [CrossRef]
- Seddiek, I.S.; Ammar, N.R. Technical and eco-environmental analysis of blue/green ammonia-fueled Ro/Ro ships. Transp. Res. Part D Transp. Environ. 2023, 114, 103547. [Google Scholar] [CrossRef]
- Law, L.C.; Mastorakos, E.; Evans, S. Estimates of the decarbonization potential of alternative fuels for shipping as a function of vessel type, cargo, and voyage. Energies 2022, 15, 7468. [Google Scholar] [CrossRef]
- Tomos, B.A.D.; Stamford, L.; Welfle, A.; Larkin, A. Decarbonising international shipping—A life cycle perspective on alternative fuel options. Energy Convers. Manag. 2024, 299, 117848. [Google Scholar] [CrossRef]
- Perčić, M.; Vladimir, N.; Fan, A. Life-cycle cost assessment of alternative marine fuels to reduce the carbon footprint in short-sea shipping: A case study of Croatia. Appl. Energy 2020, 279, 115848. [Google Scholar] [CrossRef]
- Balcombe, P.; Staffell, I.; Kerdan, I.G.; Speirs, J.F.; Brandon, N.P.; Hawkes, A.D. How can LNG-fueled ships meet decarbonisation targets? An environmental and economic analysis. Energy 2021, 227, 120462. [Google Scholar] [CrossRef]
- Li, Z.; Wang, K.; Liang, H.; Wang, Y.; Ma, R.; Cao, J.; Huang, L. Marine alternative fuels for shipping decarbonization: Technologies, applications and challenges. Energy Convers. Manag. 2025, 329, 119641. [Google Scholar] [CrossRef]
- Kanchiralla, F.M.; Brynolf, S.; Olsson, T.; Ellis, J.; Hansson, J.; Grahn, M. How do variations in ship operation impact the techno-economic feasibility and environmental performance of fossil-free fuels? A life cycle study. Appl. Energy 2023, 350, 121773. [Google Scholar] [CrossRef]
- Fan, A.; Wang, J.; He, Y.; Perčić, M.; Vladimir, N.; Yang, L. Decarbonising inland ship power system: Alternative solution and assessment method. Energy 2021, 226, 120266. [Google Scholar] [CrossRef]
- Barone, G.; Buonomano, A.; Del Papa, G.; Maka, R.; Palombo, A. Approaching zero emissions in ports: Implementation of batteries and supercapacitors with smart energy management in hybrid ships. Energy Convers. Manag. 2024, 314, 118446. [Google Scholar] [CrossRef]
- Ling-Chin, J.; Roskilly, A.P. Investigating a conventional and retrofit power plant on-board a Roll-on/Roll-off cargo ship from a sustainability perspective—A life cycle assessment case study. Energy Convers. Manag. 2016, 117, 305–318. [Google Scholar] [CrossRef]
- Ling-Chin, J.; Roskilly, A.P. A comparative life cycle assessment of marine power systems. Energy Convers. Manag. 2016, 127, 477–493. [Google Scholar] [CrossRef]
- Ling-Chin, J.; Roskilly, A.P. Investigating the implications of a new-build hybrid power system for Roll-on/Roll-off cargo ships from a sustainability perspective—A life cycle assessment case study. Appl. Energy 2016, 181, 416–434. [Google Scholar] [CrossRef]
- Park, C.; Jeong, B.; Zhou, P. Lifecycle energy solution of the electric propulsion ship with Live-Life cycle assessment for clean maritime economy. Appl. Energy 2022, 238, 120174. [Google Scholar] [CrossRef]
- Perčić, M.; Frković, L.; Pukšec, T.; Ćosić, B.; Li, O.L.; Vladimir, N. Life-cycle assessment and life-cycle cost assessment of power batteries for all-electric vessels for short-sea navigation. Energy 2022, 251, 123895. [Google Scholar] [CrossRef]
- Trivyza, N.L.; Rentizelas, A.; Theotokatos, G.; Boulougouris, E. Decision support methods for sustainable ship energy systems: A state-of-the-art review. Energy 2022, 239 Pt C, 122288. [Google Scholar] [CrossRef]
- Wu, N.; Zhang, F.; Zhang, F.; Jiang, C.; Lin, J.; Xie, S.; Jing, R.; Zhao, Y. An integrated multi-objective optimization, evaluation, and decision-making method for ship energy system. Appl. Energy 2024, 373, 123917. [Google Scholar] [CrossRef]
- Yan, R.; Yang, D.; Wang, T.; Mo, H.; Wang, S. Improving ship energy efficiency: Models, methods, and applications. Appl. Energy 2024, 368, 123132. [Google Scholar] [CrossRef]
- Thies, F.; Ringsberg, J.W. Retrofitting WASP to a RoPax vessel—Design, performance and uncertainties. Energies 2023, 16, 673. [Google Scholar] [CrossRef]
- Thies, F.; Ringsberg, J.W. Wind-assisted, electric, and pure wind propulsion—The path towards zero-emission RoRo ships. Ships Offshore Struct. 2023, 18, 1229–1236. [Google Scholar] [CrossRef]
- Arabnejad, M.H.; Thies, F.; Yao, H.; Ringsberg, J.W. Zero-emission propulsion system featuring, Flettner rotors, batteries and fuel cells, for a merchant ship. Ocean. Eng. 2024, 310, 118618. [Google Scholar] [CrossRef]
- ISO 14040:2006; Environmental Management-Life Cycle Assessment-Principles and Framework. International Standard Organization: Geneva, Switzerland, 2006. Available online: https://www.iso.org/standard/37456.html (accessed on 15 August 2025).
- Tillig, F. Simulation Model of a Ship’s Energy Performance and Transportation Costs. Ph.D. Thesis, Chalmers University of Technology, Gothenburg, Sweden, 2020. Available online: https://research.chalmers.se/en/publication/516908 (accessed on 15 August 2025).
- Tillig, F.; Ringsberg, J.W.; Mao, W.; Ramne, B. A generic energy systems model for efficient ship design and operation. Proc. Inst. Mech. Eng. Part M J. Eng. Marit. Environ. 2017, 231, 649–666. [Google Scholar] [CrossRef]
- Zhang, W.; He, Y.; Wu, N.; Zhang, F.; Lu, D.; Liu, Z.; Jing, R.; Zhao, Y. Assessment of cruise ship decarbonization potential with alternative fuels based on MILP model and cabin space limitation. J. Clean. Prod. 2023, 425, 138667. [Google Scholar] [CrossRef]
- Brynolf, S.; Fridell, E.; Andersson, K. Environmental assessment of marine fuels: Liquefied natural gas, liquefied biogas, methanol and bio-methanol. J. Clean. Prod. 2014, 74, 86–95. [Google Scholar] [CrossRef]
- Chatterjee, S.; Parsapur, R.K.; Huang, K. Limitations of ammonia as a hydrogen energy carrier for the transportation sector. ACS Energy Lett. 2021, 6, 4390–4394. [Google Scholar] [CrossRef]
- Jang, H.; Jeong, B.; Zhou, P.; Ha, S.; Nam, D. Demystifying the lifecycle environmental benefits and harms of LNG as marine fuel. Appl. Energy 2021, 292, 116869. [Google Scholar] [CrossRef]
- Kollamthodi, S.; Norris, J.; Dun, C.; Brannigan, C.; Twisse, F.; Biedka, M.; Bates, J. The Role of Natural Gas and Biomethane in the Transport Sector; Final Report; Ricardo Energy & Environment: Shoreham-by-Sea, UK, 2016; Available online: https://www.transportenvironment.org/uploads/files/2016_02_TE_Natural_Gas_Biomethane_Study_FINAL.pdf (accessed on 15 August 2025).
- Sharafian, A.; Blomerus, P.; Mérida, W. Natural gas as a ship fuel: Assessment of greenhouse gas and air pollutant reduction potential. Energy Policy 2019, 131, 332–346. [Google Scholar] [CrossRef]
- Dong, D.; Schönborn, A.; Christodoulou, A.; Ölçer, A.I.; González-Celis, J. Life cycle assessment of ammonia/hydrogen-driven marine propulsion. Proc. Inst. Mech. Eng. Part M J. Eng. Marit. Environ. 2024, 238, 531–542. [Google Scholar] [CrossRef]
- International Maritime Organization. IMO 2020—Cutting Sulphur Oxide Emissions. 2020. Available online: https://www.imo.org/en/MediaCentre/HotTopics/Pages/Sulphur-2020.aspx (accessed on 15 August 2025).
- Lu, D.; Theotokatos, G.; Zhang, J.; Tang, Y.; Gan, H.; Liu, T.; Ren, Q. Numerical investigation of the high pressure selective catalytic reduction system impact on marine two-stroke diesel engines. Int. J. Nav. Archit. Ocean. Eng. 2021, 13, 659–673. [Google Scholar] [CrossRef]
- Tsujimura, T.; Suzuki, Y. Development of a large-sized direct injection hydrogen engine for a stationary power generator. Int. J. Hydrogen Energy 2019, 44, 11355–11369. [Google Scholar] [CrossRef]
- Pachauri, R.K.; Allen, M.R.; Barros, V.R.; Broome, J.; Cramer, W.; Christ, R.; Church, J.A.; Clarke, L.; Dahe, Q.; Dasgupta, P.; et al. Climate Change 2014: Synthesis Report. Contribution of Working Groups I, II and III to the Fifth Assessment Report of the Intergovernmental Panel on Climate Change; IPCC: Geneva, Switzerland, 2014; Available online: https://www.ipcc.ch/site/assets/uploads/2018/02/SYR_AR5_FINAL_full.pdf (accessed on 15 August 2025).
Disclaimer/Publisher’s Note: The statements, opinions and data contained in all publications are solely those of the individual author(s) and contributor(s) and not of MDPI and/or the editor(s). MDPI and/or the editor(s) disclaim responsibility for any injury to people or property resulting from any ideas, methods, instructions or products referred to in the content. |
© 2025 by the authors. Licensee MDPI, Basel, Switzerland. This article is an open access article distributed under the terms and conditions of the Creative Commons Attribution (CC BY) license (https://creativecommons.org/licenses/by/4.0/).