Article

Coupled CFD-DEM Numerical Simulation of Hydrothermal Liquefaction (HTL) of Sludge Flocs to Biocrude Oil in a Continuous Stirred Tank Reactor (CSTR) in a Scale-Up Study

by
Artur Wodołażski
Department of Energy Saving and Air Protection, Central Mining Institute, PlacGwarków 1, 40-166 Katowice, Poland
Energies 2025, 18(17), 4557; https://doi.org/10.3390/en18174557
Submission received: 16 July 2025 / Revised: 6 August 2025 / Accepted: 19 August 2025 / Published: 28 August 2025
(This article belongs to the Section A: Sustainable Energy)

Abstract

A multiphase model of hydrothermal liquefaction (HTL) using the computational fluid dynamics coupling discrete element method (CFD-DEM) is used to simulate biocrude oil production from sludge flocs in a continuous stirred tank reactor (CSTR). Additionally, the influence of the agitator speed and the slurry flow rate on dynamic biocrude oil production is investigated through full transient CFD analysis in a scaled-up CSTR study. The kinetics of the HTL mechanism as a function of temperature, pressure, and residence time distribution were employed in the model through a user-defined function (UDF). The multiphysics simulation of the HTL process in a stirred tank reactor using the Lagrangian–Eulerian (LE) approach, along with a standard k-ε turbulence model, integrated HTL kinetics. The simulation accounts for particle–fluid interactions by coupling CFD-derived hydrodynamic fields with discrete particle motion, enabling prediction of individual particle trajectories based on drag, buoyancy, and interphase momentum exchange. The three-phase flow using a compressible non-ideal gas model and multiphase interaction as design requirements increased process efficiency in high-pressure and high-temperature model conditions.

1. Introduction

High-temperature continuous stirred tank reactors (CSTRs) operating under high pressure are widely used in fine chemical industries involving fast and strongly exothermic reactions for processing waste, such as straw, waste food, and sewage sludge. They also find applications in hydrotreatment of heavy petroleum residues, methanol synthesis, and Fischer–Tropsch processes [1,2,3,4]. Compared to traditional tubular reactors with a fixed catalyst bed, the main advantages of CSTR reactors with a slurry catalyst bed in the HTL process include the possibility of obtaining high slurry concentration, high interphase mass transfer rates at low energy consumption, and a high degree of selectivity in the biocrude oil synthesis reaction from sewage sludge [5,6]. The high heat capacity of the slurry enables efficient heat removal, providing a stable isothermal reaction environment and maintaining the catalyst at an optimal temperature. CSTRs enable continuous operation with consistent product quality, while their effective mixing ensures uniform temperature and pressure distributions, enhancing reaction efficiency and minimizing hot spots. However, operating under high-pressure and high-temperature conditions increases design complexity and material requirements, especially when handling abrasive biomass slurries. The process is energy-intensive due to the need to pump viscous feedstocks and maintain homogeneous conditions and back-mixing in the reactor, which can lead to non-ideal residence time distributions [7]. However, compared to the tube reactor, CSTR reactors prevent clogging without requiring such restrictions on the slurry’s purity. Despite these challenges, CSTRs are well suited for scalable, industrial HTL applications, especially for wet biomass feedstocks requiring robust and flexible processing. The main disadvantages of CSTR reactors include the occurrence of back-mixing in both the continuous and dispersed phases. There are difficulties in scaling up the process due to problems associated with the implementation of this type of system on an industrial scale [8]. CFD modeling and simulation tools are frequently used nowadays for process design, optimization, and scale-up because they provide a reliable, inexpensive, and rapid way to investigate the impact of design parameters on the process’s overall performance [9]. Modern computational fluid dynamics (CFD) software can predict fluid flow, heat and mass transfer coupling with chemical reactions, and other related phenomena by solving a set of appropriate mathematical equations as differential equations with distributed parameters. It can be widely and successfully employed to process sewage sludge into biofuels [10]. The modeling of the thermochemical process for converting sewage sludge into biofuels is a complex and multidisciplinary task. It requires simultaneous advancements in process technology and the development of precise measurement instruments. Additionally, the process demands the optimization of operational conditions, such as catalyst selection and physicochemical parameters, alongside minimizing capital and operational costs. These efforts collectively represent an innovative approach to the production of alternative fuels. Computational fluid dynamics (CFD) has proven to be a valuable tool in visualizing slurry mixing hydrodynamics, particularly in identifying turbulent zones where reagent interactions are most pronounced. This enables a detailed understanding of mass and heat transfer processes in these regions, ultimately leading to improved reaction yields. However, the heterogeneous nature of reactive fluids presents significant challenges, as it complicates quantitative measurements and makes flow visualization a time-consuming endeavor. Despite these challenges, CFD serves as an indispensable tool for enhancing the conversion efficiency of sewage sludge. On the other hand, experimental studies conducted under high-temperature and high-pressure conditions have fallen short of achieving the desired spatial resolution in continuous stirred tank reactors (CSTRs). To overcome this limitation, non-ideal mixing models should be incorporated, taking into account the behavior of gases under non-ideal conditions. In this context, equations like the Peng–Robinson (PR) model should be applied in this area. PR has wider adoption and better performance in representing the thermophysical properties of water and organics at HTL-relevant pressures and temperatures when compared with the Soave–Redlich–Kwong equation. The PR model has also demonstrated higher accuracy in previous studies involving phase behavior and property prediction for hydrothermal and biocrude systems. Moreover, the multiphase interaction of multiphysics phenomena at high processing temperatures causes changes in slurry rheology, which can be effectively analyzed using CFD. The uneven nature of reactive fluids and particles also necessitates careful optimization of mixing processes to increase the biomass conversion rate of biofuels. This highlights the need for advanced CFD techniques to simulate, optimize, and scale up hydrothermal liquefaction (HTL) processes. On the other hand, practical implementation remains a challenge, as the scalability of such processes often introduces additional complexities. For these reasons, recent advancements in computational capabilities have positioned CFD as a highly attractive tool for visualizing, optimizing, and designing HTL processes in large-scale applications. Such developments show promise for efficient and sustainable biofuel production [11,12,13,14]. Issues related to carrying out the HTL process in a tubular reactor were dealt with by Ranganathan and Savithri [15], who developed a two-dimensional CFD model to combine with an HTL kinetic model of microalgae suspension in a continuous flow. The effects of raw material flow rate, temperature, and pressure on product yield were determined. Joshi et al. [11] developed a 3D CFD model to simulate the effects of slurry flow and particulate transport on the process through a horizontal pipe bend at different Prandtl numbers. Quian et al. [16] identified research gaps that motivated the present study, which develops a continuous HTL system in Aspen Plus to investigate the influence of operating conditions (biomass moisture content, pressure, and temperature) on biocrude yield and its energy recovery in order to obtain optimal thermodynamic reaction conditions. W.-X. Chu et al. [17] investigated various reactor configurations which can significantly affect reactor production efficiency. The issue of increasing the production scale of CSTR reactors was addressed by Campolo and Paglianti [18,19]. Wodołażski et al. [20] demonstrated the significant effects of pressure and temperature on catalyst suspension behavior in the HTL process using a batch-type reactor. Moreover, they examined how different operating conditions such as solid loading, particle size, and impeller speed determine the velocity and concentration fields of the suspension, which influence the feasibility and effectiveness of bioenergy production. This also has implications for the behavior of heterogeneous catalysts. In article [21], a multiphase numerical computational fluid dynamics (CFD) model was presented for simulating hydrothermal liquefaction of sewage sludge to biocrude oil in a continuous plug-flow reactor. Some studies have reported HTL in batch reactors using various types of biofeedstocks including algae [22,23,24,25], wood [26,27] and sewage sludge [23,28,29,30,31,32,33,34]. As reactor size increases, maintaining uniform mixing becomes increasingly challenging. Large-scale systems often develop dead zones or regions with insufficient mixing, resulting in uneven reaction conditions and reduced efficiency. In larger reactors, the decreased surface-to-volume ratio complicates efficient heat and mass transfer, potentially causing temperature gradients, localized overheating, or slower reaction rates. Additionally, scaling up necessitates larger stirrers and mechanical components, which heightens the risk of mechanical failure. The demands of high-pressure and high-temperature operations further exacerbate these challenges, requiring more robust materials and advanced designs to ensure reactor integrity [23,31,32,33,34,35,36,37,38,39]. Recent experimental studies have significantly contributed to the understanding of hydrothermal liquefaction (HTL) of sewage sludge. Di Lauro et al. [34] performed detailed HTL experiments using a 500 mL batch autoclave, analyzing bio-crude yield, composition, and operational behavior under realistic conditions. Further, Balsamo et al. [35] investigated the role of biochemical constituents in real sludge mixtures, revealing their influence on HTL product selectivity and phase distribution. To complement the experimental insights. Liu et al. [36] evaluated biocrude production efficiency and waste stream management within sludge-to-energy conversion frameworks, emphasizing sustainability aspects. Balsamo et al. [37] also developed kinetic and elemental balance models to describe reaction pathways and conversion efficiency. These studies provide valuable benchmarks for validating simulation-based approaches and for guiding the design of scalable HTL systems. Ma and Li et al. [38] conducted a comprehensive review of the thermal–hydraulic performance and optimization of printed circuit heat exchangers (PCHEs) operating with supercritical fluids. The study emphasizes the role of CFD in resolving complex flow and heat transfer behaviors under extreme thermophysical conditions, with a focus on channel geometry, pressure drop, and thermal effectiveness. Their findings underscore the importance of high-fidelity numerical modeling for the design and scale-up of compact heat exchangers in advanced energy systems. Sun et al. [39] proposed a novel in situ sensor calibration method for building thermal systems, which couples CFD-based virtual sampling with autoencoder networks to improve measurement accuracy. The energy requirements of large-scale systems are particularly significant. Higher energy inputs are needed to ensure effective stirring and maintain homogeneous conditions, especially when processing viscous or solid–liquid–gas multiphase-slurry interactions. This leads to increased operational costs, which can significantly impact on process economics. One of the most critical factors in achieving efficient biocrude oil production is precise control of temperature and pressure, which have a substantial influence on process outcomes. In large-scale reactors, thermal runaway can become a serious issue, particularly under non-optimized conditions. Reaction time also plays a vital role in product yield and quality. Extended reaction times can reduce the efficiency of biocrude oil production due to undesirable secondary reactions, such as repolymerization or excessive cracking. These phenomena highlight the challenges of optimizing and controlling continuous stirred tank reactors (CSTRs), especially given their transient behavior, high nonlinearity, and the wide range of operating conditions typically encountered in HTL processes. The inherent requirements for high temperature and pressure in HTL make it an energy-intensive process, further impacting economic feasibility. Therefore, optimizing thermal energy utilization is essential to maximize biocrude yield within the shortest possible reaction time, ultimately enhancing the overall process economic performances. This challenge becomes even more pronounced during scale-up, where energy demands escalate and the risk of suboptimal operating conditions increases. To address these issues, capturing the dynamic behavior of the continuous HTL process is crucial. Scaling up requires innovative approaches to link hydrodynamics, heat transfer and process kinetics under larger operational scales. This relationship significantly influences process efficiency and economics. Hence, the novelty of scaling up lies in developing methods to optimize reactor design and operational parameters, ensuring a balance between enhanced production capacity and economic feasibility [23,32].
The paper presents a full-transient multiphase coupled CFD-DEM simulation of sludge flocs’ hydrothermal liquefaction to biocrude oil in a continuous stirred tank reactor (CSTR) for scaling up. A finite volume method with a nonlinear ordinary differential equation of the DEM system was used to model the scale-up study of the CSTR to investigate the impact of design parameters on the overall process performance. The heterogeneous character of the model, which focuses on gas–liquid–solid multiphase interactions is highlighted in this work. A program code written in C was used to solve mass and energy balance equations numerically using UDFs (user-defined functions). Additionally, the effects of hydrodynamics–kinetics–thermal multiphase analysis relation were applied to reactor design, operation, and maintenance using Euler–Lagrange approach to model multiphase interaction with particle trajectories as a novel study. CFD-DEM-UDF is presented as a powerful tool with which to assist process design in scale-up studies via a multiphysics approach. A novel scaling analysis based on power-to-volume ratio (P/V)was introduced to assess how mixing and heat transfer performance vary with reactor size. These features represent a significant step forward in modeling and designing scalable HTL systems beyond the lab scale.

2. Materials and Methods

2.1. CFD Multicomponent Modelling

In this work a multidimensional, unsteady, multiphase CFD model was used to simulate the hydrothermal liquefaction of sewage sludge into biocrude eoil in a continuous stirrer tank reactor (CSTR). The non-ideal Peng–Robinson equation, which accurately describes real gas behaviour under high-pressure and high-temperature conditions, was used as the equation of state for the gas phase implemented through UDF (user-defined functions). The solid biomass particles’ formation behaviour, size distribution, and variation over time were modeled; this included nucleation caused by aggregation and breakage phenomena induced by high temperature and pressure. These sub-processes are represented using established population balance equations (PBEs), with rate expressions implemented via user-defined functions (UDFs) in ANSYS Fluent ver 15. The population balance of the liquid phase, described as flocs for sewage sludge, is represented by the inhomogeneous discrete model. The gas phase is represented by the standard method of moments (SMM). The model equations were solved for each bubble size as a separate phase. The specific methodology for the multiphase population balance model in a CSTR reactor is presented in [40]. Three-dimensional Lagrangian-Eulerian multiphase transient model was used to simulate gas-liquid-solid multicomponent flow in HTL process. User-Defined Function (UDF) is necessary to define fluctuated boundary conditions when carrying out a transient numerical analysis. A drag correlation for spherical particles in multiphase systems, derived from comprehensive CFD–DEM simulations correlation was adopted to account for particle–fluid momentum exchange in the HTL–CSTR model [41]. Therefore, hydrodynamic phenomena play a significant role in determining the thermal and mass transfer coefficient, which can be influenced by reactor design parameters. The general governing equations of continuity (1) and momentum (2) balance can be expressed as follows [20,21,22,23,24,32,42]:
ρ t + ρ v = 0
t ρ v + ρ v v = p + σ ¯ + ρ g + F
The continuity equation for the gas phase is (3)
ε g ρ g t + ε g ρ g v g R g
The liquid phase of continuity (4) and momentum (5) equation is
t α l ρ l + α l ρ l v l = 0
t α l ρ l v l + α l ρ l v l v l = α l p l α l T v + α l T R + α l ρ l g + S M
The momentum equation for the gas phase is (6)
ε g ρ g v g t + ε g ρ g v g v g S g + m = 1 M I g s m + ε g ρ g g
The gas species is calculated from (7):
ρ g Y i t + ρ g Y i v g ρ g D e f f Y i + S p i Y i + S Y i
The solid particles’ phase momentum is (8)
m p v p t f g + m p g
The standard k–ε turbulence model proposed by Launder and Spalding [43] for the liquid phase describing the kinetic energy of turbulence k and its dissipation ε is presented in (9) and (10):
t α l ρ l u l + α l ρ l u l k l = α l μ l + μ t l σ k k l + α l P l α l ρ l ε l ,
t α l ρ l ε l + α l ρ l u l ε l = α l μ l + μ t l σ ε + α l ε l k l C ε 1 ρ l C ε 2 ρ l ε l ,
where parameters are as in the standard k-ε model, and the following values are selected: Cε1 = 1.45, Cε2 = 1.9, σk = 1.0, and σε= 1.3.
The drag component of the solid–liquid interfacial force is given by (11):
F i s D = 3 4 C D , i s d s ρ l α s u s u l u s u l ,
where the drag coefficient C D , i s exerted by the solid–liquid phase.
The energy equation for solid particles is given in (12)
m p c p T p t h A p T g T p + e p A p 4 G 4 σ T p 4 + Q p
The drag force for the unit volume of solid biomass particles in liquid is calculated from Equation (13):
F D = 18 μ l C D Re p ρ p d p 2 24
The drag coefficient for non-spherical particles is calculated from (14):
C d = 24 Re p 1 + 0.98 Re p 0.674 + 0.77854 Re p 0.5869 + Re p
The energy equation for a fluid region is given by (15) [27]
t p h + ρ h u = k + k l T + S h

2.2. Kinetics Model of Sludge Hydrothermal Liquefaction

In the present study, a lumped kinetic model was utilized in the CFD simulation to estimate the yield of biocrude oil derived from hydrothermal liquefaction (HTL) of sewage sludge employing user-defined functions (UDFs) written in C language. Figure 1 illustrates the reaction pathway model, which incorporates the biochemical composition of sewage sludge, including proteins (P), carbohydrates (C) and lipids (L), leading to formation of the aqueous phase and biocrude oil products. Hence, the kinetic mechanism of the HTL model, along with the corresponding Arrhenius parameters, was sourced from experimental data reported in [34,35,36,37]. The hydrothermal liquefaction (HTL) process of sewage sludge involves the conversion of organic materials into biofuels such as biocrude oil. In the first stage of the process, sewage sludge, which consists mainly of proteins, carbohydrates and lipids, is subjected to high temperature and pressure in the presence of water. Under the influence of these conditions, organic compounds in the sludge decompose are converted into water-soluble substances and biocrude oil. As the temperature increases, the water-soluble products and biocrude oil are transformed into gaseous products such as methane, hydrogen, carbon monoxide and carbon dioxide. The process kinetics, including the reaction mechanisms, depend on temperature and reaction time, as well as on the composition of the sludge. As a result of this process, obtained biocrude oil can be further processed to produce valuable fuels. The green arrows indicate the dominant reaction pathways that contribute most significantly to biocrude formation and gas evolution, distinguishing them from the other secondary conversion routes shown in black. The kinetic constant k represents the rate coefficient of the individual reaction pathways in the hydrothermal liquefaction mechanism. Each constant corresponds to a specific conversion step; for example, k1P, k1C, k1L are the decomposition of proteins, carbohydrates, and lipids into aqueous-phase products or direct conversion to biocrude oil, respectively; k2P, k2C, k2L are the secondary transformation of proteins, carbohydrates, and lipids into other products (solid, aqueous phase, or biocrude); k3, k4 are the forward and backward conversions between biocrude and aqueous-phase products, respectively; k5, k6 are transformations from aqueous-phase products into gas; k7 is the decomposition of biocrude oil into gaseous products; and kS1, kS2 are bidirectional conversions between solids and biocrude oil.

2.3. Scale-Up

In scale-up studies of continuous stirrer tank reactors (CSTRs), the hydrodynamic shear stresses generated by turbulent flow cause a major problem. The scale-up of CSTRs (continuous stirred tank reactors) operating in the hydrothermal liquefaction (HTL) process in high-temperature and high-pressure conditions is associated with a number of challenges that can affect efficiency, safety, and process control. The mixing process is crucial to ensure uniform temperature, pressure, and component distribution throughout the reactor. As the reactor scale-up increases, it is more difficult to maintain optimal mixing uniformity, which can lead to local temperature and pressure fluctuations. In larger reactors, it is more difficult to control all process parameters, such as temperature, pressure, reaction time, and reactant concentrations. This leads to incomplete substrate conversion, reducing the process efficiency and the biocrude oil’s quality. On a larger production scale, the temperature is difficult to control, especially at large volumes, which can lead to overheating or cooling of some reaction areas, i.e., dead zones. During scale-up, it is also necessary to use more durable materials, because there is a higher probability of deformation and leaks. One of the CSTR scale-up procedures consists of increasing the size of the system while maintaining geometric similarity, in such a way as to ensure the stability of the selected parameters constituting scale-up criteria. Due to the complexity of HTL processes, the slurry’s physicochemical properties do not change during scale-up.
The empirical scale-up criterion in our case is P/V (constant power input per liquid volume). The power draw by the impeller is expressed by the Equation (16):
P = R q N 3 D 5
where Rq is a power number, which depends on impeller type, dimensions, and phase properties.
The next scale-up criteria are the impeller Reynolds number and impeller tip speed Vtip, which are related to geometry and can be expressed as (17) and (18):
Re i m p = N D 2 / ν
V t i p = π N D
Scale-up increases risk in reaction operations. However, chemical rate constants are scale-independent, whereas physical parameters are not. The Reynolds number, impeller tip speed, and the maximum shear stress were calculated in a 3 to 12 L high-pressure reactor.

2.4. Geometry and Meshing

A 3D geometry model of a continuous stirred tank reactor is shown in detail in Figure 2 for the scale-up procedure. The presented model is a reactor from 3 to 12 L, which was used to simulate the HTL process of transforming sludge flocs to biocrude oil. The lack of baffles meant we had to limit the abrasion of solid particles and improve the mass transfer between the solid and liquid phase. Sludge flocs inside the reactor were heated to a temperature of 380–450 °C and pressure of 180–240 bar. A continuous flow was implemented to investigate the effects of flow rate, pressure, and temperature on the HTL process. The computational grids were generated with the MixSim 2.1.12 pre-processing module, employing the Moving Reference Frame (MRF) approach. The numerical simulations are based on the experimental setup [34,35,37], among which the reactor was manufactured by Berghof company in Germany from Hastelloy C-276, ensuring compatibility with the high-pressure and high-temperature conditions of the HTL process. Grid sensitivity tests were performed to ensure that the solutions did not obviously change with the increasing number of computational cells. There were 0.08258419 million hexahedron elements throughout the computational domain for the largest reactor scale, and 0.00015233 million cells for the small-scale reactor. This was deemed sufficient for obtaining the grid independence results. The mesh quality for the simulation was checked (max angular skewness: 0.72; minimum orthogonal quality of cells: 0.22; and maximum aspect ratio: 6.18). A structured hexahedral grid was employed to improve the convergence and accuracy of the calculation. The grid distribution impacts the computation time and the number of iterations required for the solution to converge. Hence, the interval size of 0.2 mm was able ensure the simulation results, and it remained independent of the grid resolution. The selected grid resolutions are presented in Table 1. The accuracy of the solution improves with increasing grid resolution, but this often results in high computational time.

2.5. Numerical Procedure

The CFD simulations were performed using ANSYS CFD 15. The standard RANS k–ε model was used to simulate the turbulence behavior of multiphase interaction. A Lagrangian–Eulerian approach was adopted to describe the flow behaviour of the liquid, solid and gas phase. A user-defined function (UDF) was used to define the fluctuating boundary conditions when carrying out a transient numerical analysis. The PRESTO scheme was used for pressure discretization. The velocity–pressure coupled equation was solved using the PISO algorithm. To improve the efficiency of this calculation, the PISO algorithm performed two additional corrections: neighbor correction and skewness. A second-order upwind scheme was used to approximate the convective terms in the momentum, energy and composition equations, respectively. A second-order upwind discretization scheme was used to calculated the face fluxes in the momentum and species transport equations. A DES (detached eddy simulation) dissipation model containing reactants and products was used to determine reaction rates. The detached eddy simulation method in its purest form computes reaction rates based on rates of turbulent mixing. It works well in simulations with strong pressure–flow interaction. For simulating unsteady compressible flow, p-adaptive methods were adjusted. The Reynolds-averaged velocity field and stress terms were derived to elucidate the overall flow structure and statistical properties of the turbulent flow. Under relaxation, factors were 0.2 for pressure, 0.3 for momentum, and 0.5 for energy. Under relaxation, the species transport equation increased with iterative simulations. The numerical computations in this study were considered converged when the residuals for continuity, momentum and energy equations dropped below the prescribed convergence criteria. In order to verify that the simulations converged, the residuals and additional parameters (namely, pressure, velocity, turbulence dissipation energy, and mass flux) were monitored. Convergence was not easily achievable for the highly coupled equations of the nature of transport. The residual convergence criteria were set to be 10−6 in this study. The hydrodynamics–kinetics relation for the three-phase simulation in high-temperature and -pressure conditions required a high number of CPUs and a long computational time in order to achieve appropriate solution accuracy for the required mesh resolution. The numerical simulations were run on an i7–3770 CPU 3.70 GHz processer Intel (R) computer with 128 GB RAM and 64-bit operating system. An unsteady simulation with a time step size of 0.0001 s and 15,827 time steps was employed to simulate the model dynamic behavior needed to achieve simulation convergence.

2.6. Thermodynamics Model of Non-Ideal Gases

The Peng–Robinson equation was used to describe the behavior of real gases under high-temperature and high-pressure conditions, as below:
P = R T V m b a α V m 2 + 2 b V m b 2
where parameters a and b are functions of critical temperature (Tc) and pressure (Pc).
The fugacities fs and fv are expressed as functions of pressure p and compressibility, Z as follows:
ln f p = Z i 1 ln ( Z i B ) A 2 2 B ln Z i + 2.414 B Z i 0.414 B
where A and B are dimensionless parameters. The individual polynomial coefficients for describing the equation were taken from reference [33] from the literature.
The Peng–Robinson equation is particularly useful in HTL processes, where gas mixtures contains CO2, H2, CH4 and other gases. The Peng–Robinson equation is much more accurate than the Sovay–Redlich–Kwong equation and gives better results, especially in critical regions. It also allows the particular accuracy and density of the liquid and gas phase of the system in the gas–liquid phase equilibrium to be determined. It should also be noted that the molar heats and enthalpies of real gases under HTL conditions depend not only on temperature but also on pressure.

2.7. Coupling CFD-DEM Metod

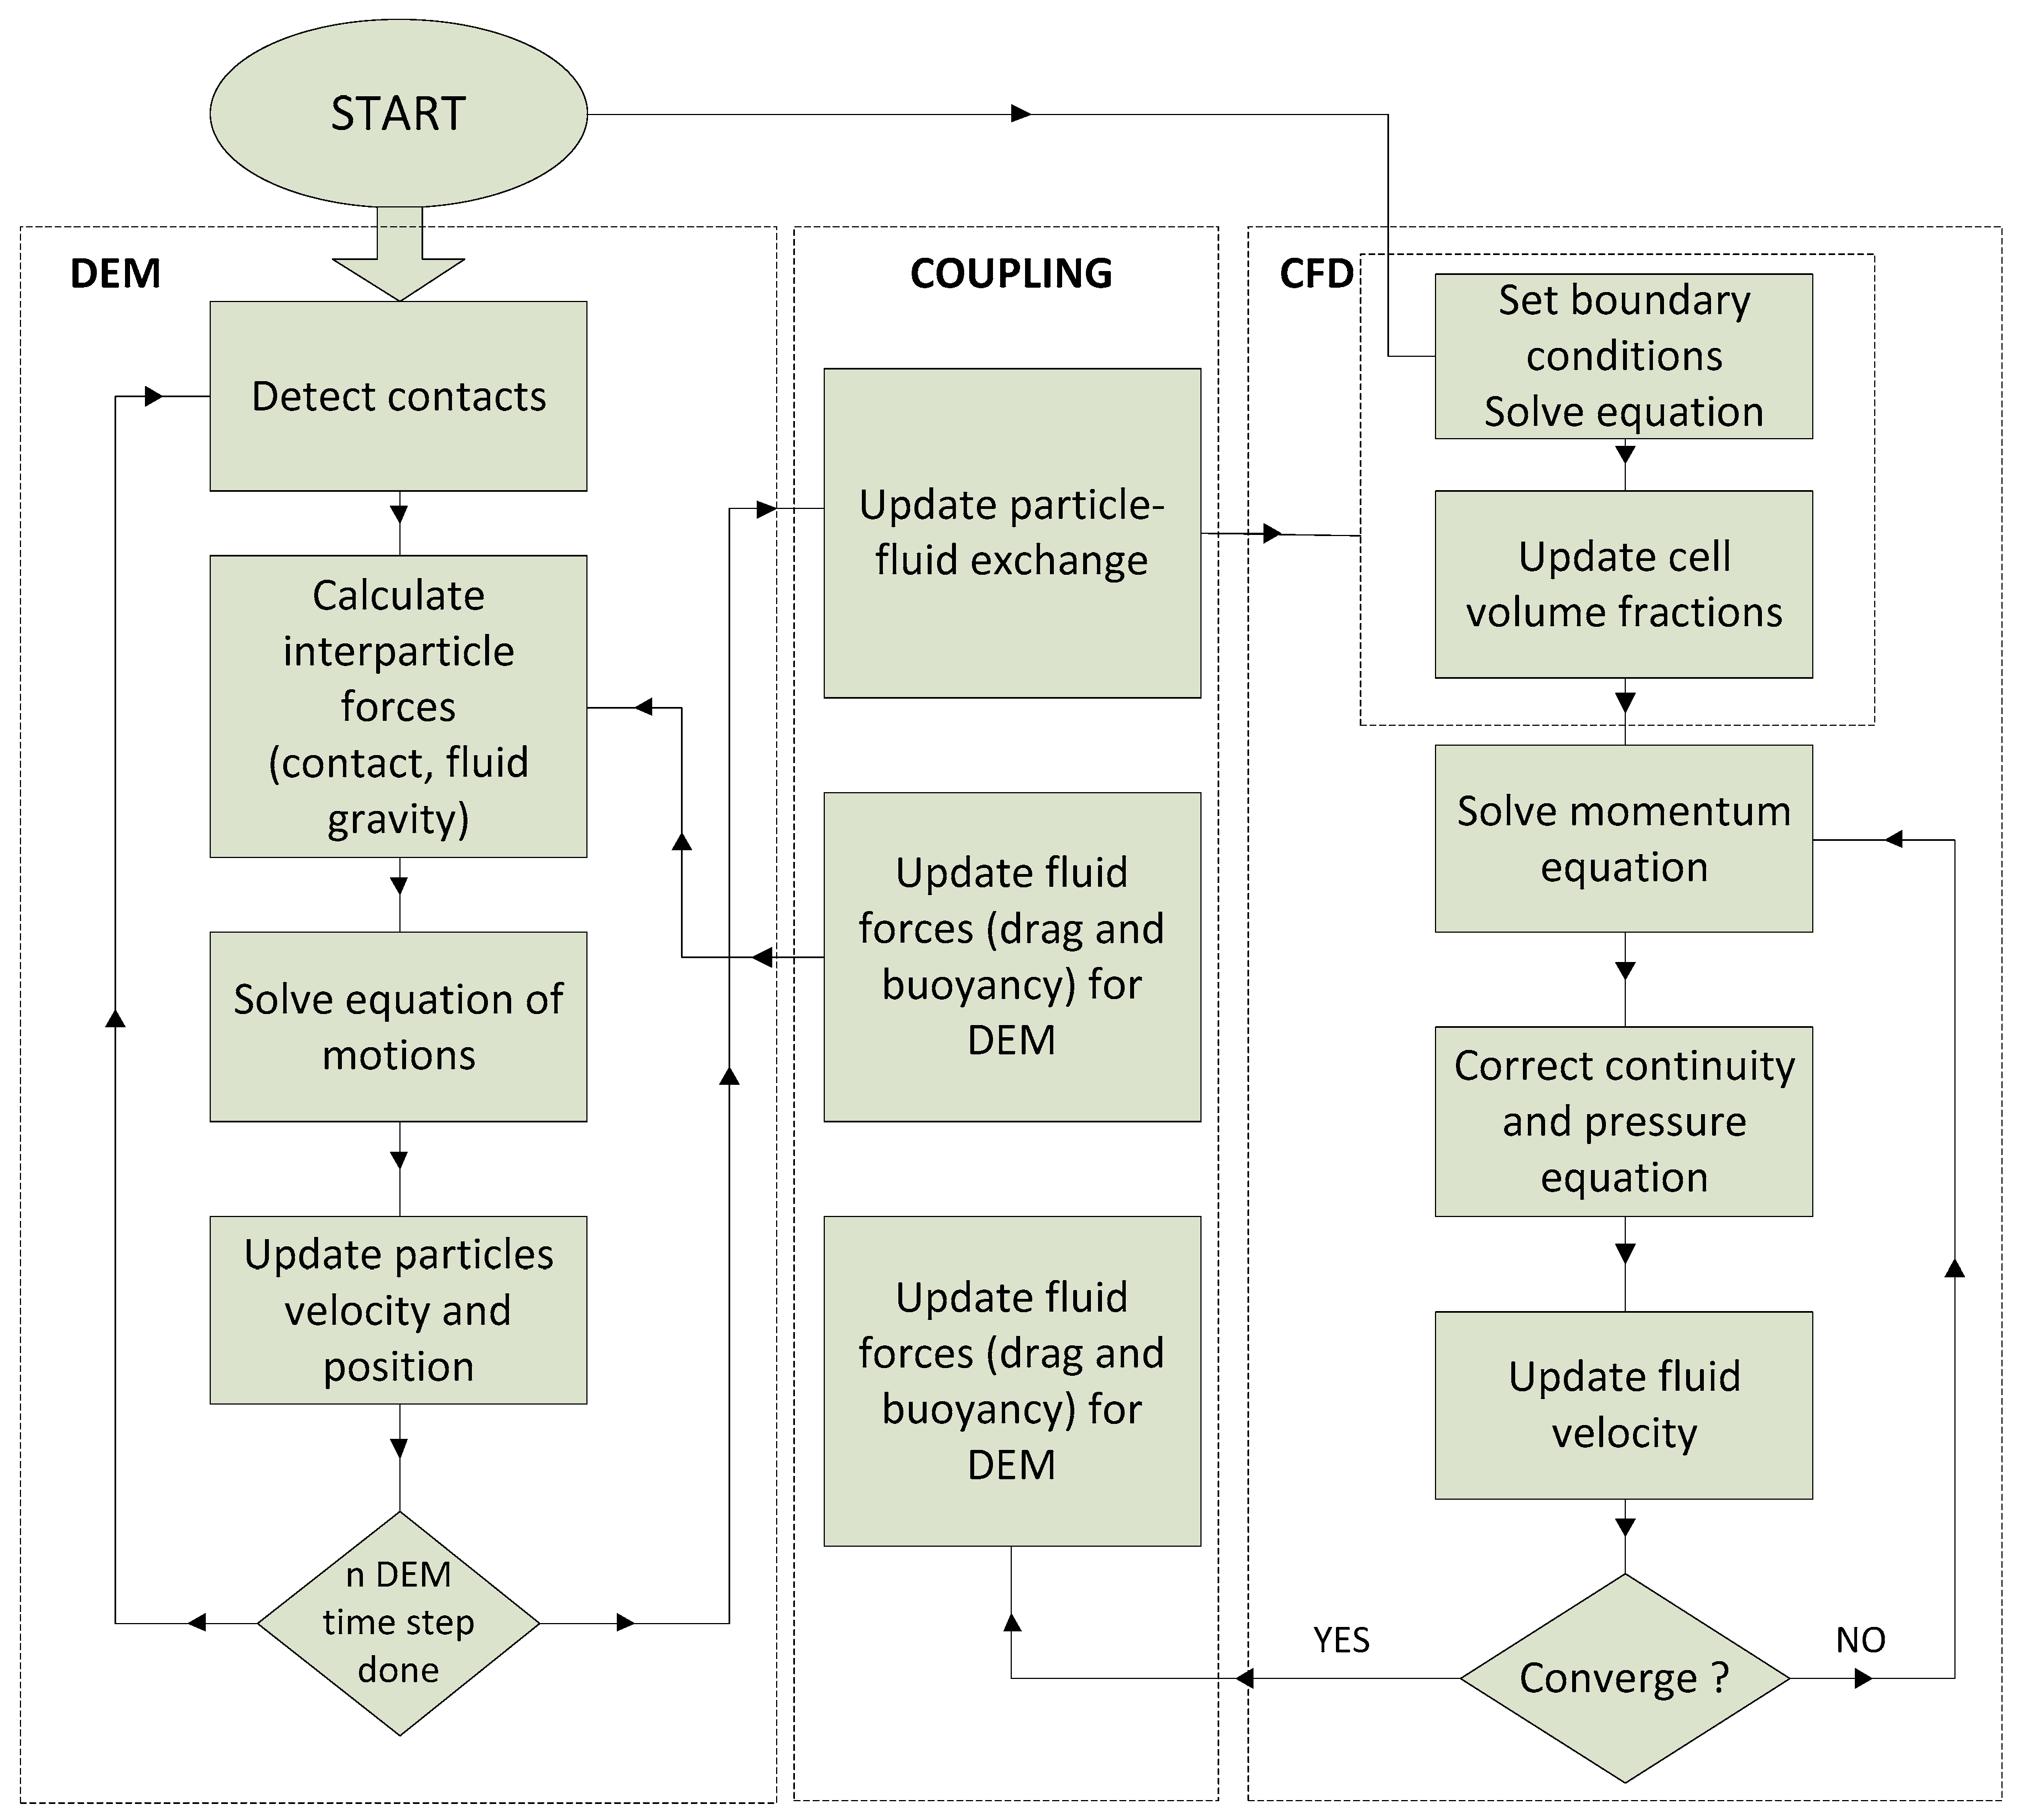
The coupling of the CFD-DEM algorithm is illustrated in Figure 3. The discrete element method (DEM) simulates the motion and interactions of solid particles, treating them as separate, discrete entities. Each particle has its own physical properties (such as mass, shape, and friction) and can interact with other particles as well as with the surrounding fluid. In the CFD-DEM approach, each phase (fluid and solid) is modeled separately, while information is exchanged between them. The computational fluid dynamics (CFD) method calculates the fluid velocity, pressure distribution, and other fluid properties throughout the computational domain. The fluid exerts forces such as drag and pressure on the particles. The DEM calculates the forces acting on each solid particle, including contact forces between particles, fluid resistance, and gravitational forces. Based on these forces, particles move according to Newton’s laws of motion. Particles may collide with each other or with the reactor walls. Particle–particle and particle–wall interactions are resolved using contact mechanics, accounting for normal and tangential forces including friction and restitution. Hydrodynamic forces such as drag and lift were calculated from CFD flow fields and applied to each DEM particle. Particle collisions were resolved using a soft-sphere model with Hertz–Mindlin contact mechanics. The model considered four-way coupling (fluid–solid, solid–solid, wall interactions, and phase momentum transfer), ensuring realistic interaction dynamics under turbulent multiphase conditions. The DEM solver was integrated with CFD through user-defined functions (UDFs) coded in C, enabling accurate resolution of non-ideal flow, mixing patterns, and particle behavior in scaled-up CSTR reactors. The DEM method requires a smaller time step than the CFD method. The calculations begin with the DEM solver, which computes particle positions and contacts. Following this, the equations of motion are solved, and the positions and velocities of the particles are updated based on the interactions with the fluid and gravitational forces. The PISO algorithm is used to couple the particle and velocity fields. Particle–fluid interactions, along with DNS-based coupling, are combined with four-way interactions, necessitating fine computational meshes and small time steps. These methods yield high accuracy but are computationally intensive. The interactions are often highly nonlinear and require collision detection algorithms integrated with hydrodynamic force models. The computational cost increases exponentially with the number of particles. The interparticle interactions are resolved explicitly through the DEM method, coupled with fluid dynamics (CFD) and interphase interactions, which are addressed by solving the Navier–Stokes equations for each particle.

2.8. CFD Multiphysics Model Experimental Setup

The DEM-CFD model was developed based on experimental data and geometrical specifications of the Parr Autoclave Engineering system, as described in references [34,35,37]. The physical reactor used was the PA 4575A series from Parr Instruments, which served as the basis for geometry definition and boundary conditions. Numerical validation based on experimental setup [34,37] replicated the internal structure, agitation system and fluid–solid interactions. Parametric alignment between the physical system and the virtual model ensured consistent heat and momentum transfer behavior. This validated CFD-DEM framework was then applied to simulate the scale-up of the Parr reactor system under hydrothermal liquefaction (HTL) conditions. As a result, the model supported predictive analysis and design optimization in scaling up high-pressure and high-temperature stirred tank reactors.

3. Results and Discussions

Hydrodynamics Flow Field of Biomass Slurry

Figure 4 shows velocity vectors for the vertical cross-section of a continuous stirred tank reactor. It can be observed higher shear stresses are generated therein. With the increase in the mixer rotational frequency, the number of collisions of biomass particles in the water phase increases. On the other hand, overly intensive mixing generates high shear stresses, which can cause the breaking of biomass flocs, thus increasing the efficiency of the HTL process. Liquid recirculation significantly improves the conversion rate of biomass to biocrude oil. At a too-low mixing intensity, dead zones are observed, which significantly reduce the efficiency which with the biomass solid-particle phase is broken. The suspension stream with the high kinetic energy of turbulence circulates in the area above and below the mixer in accordance with the direction of the circulating fluid. The intensity of the turbulence’s kinetic energy is the highest near the ends of the mixer blades. The most intensive mixing zone is located around the mixer. Dead zones are located near the tank wall and at the agitator shaft. The scaling up of the CSTR reactor in the HTL process affects the reaction efficiency and effectiveness due to the difficulty in controlling parameters such as temperature, pressure, mixing, residence time, and heat and mass distribution. To maintain high efficiency and process effectiveness in a larger reactor, careful design and optimization of reaction conditions are necessary, including better insulation, optimized agitator speed, and temperature and pressure control. The flow pattern can be optimized by reducing dead spaces. Increasing mixer speed reduces the poorly mixing zones and increases the kinetic energy of the non-dead zone but does not decrease the dead zone areas. This is due to high energy dissipation around the mixing areas. It is clear that the intensity of the recirculation in the mixing region causes increased particle and bubble coalescence and a break-up mechanism during mutual agitator–paddle collisions. Therefore, large bubbles are broken up and turned into smaller bubbles to increase the interfacial surface area of the gas–liquid–solid phase.
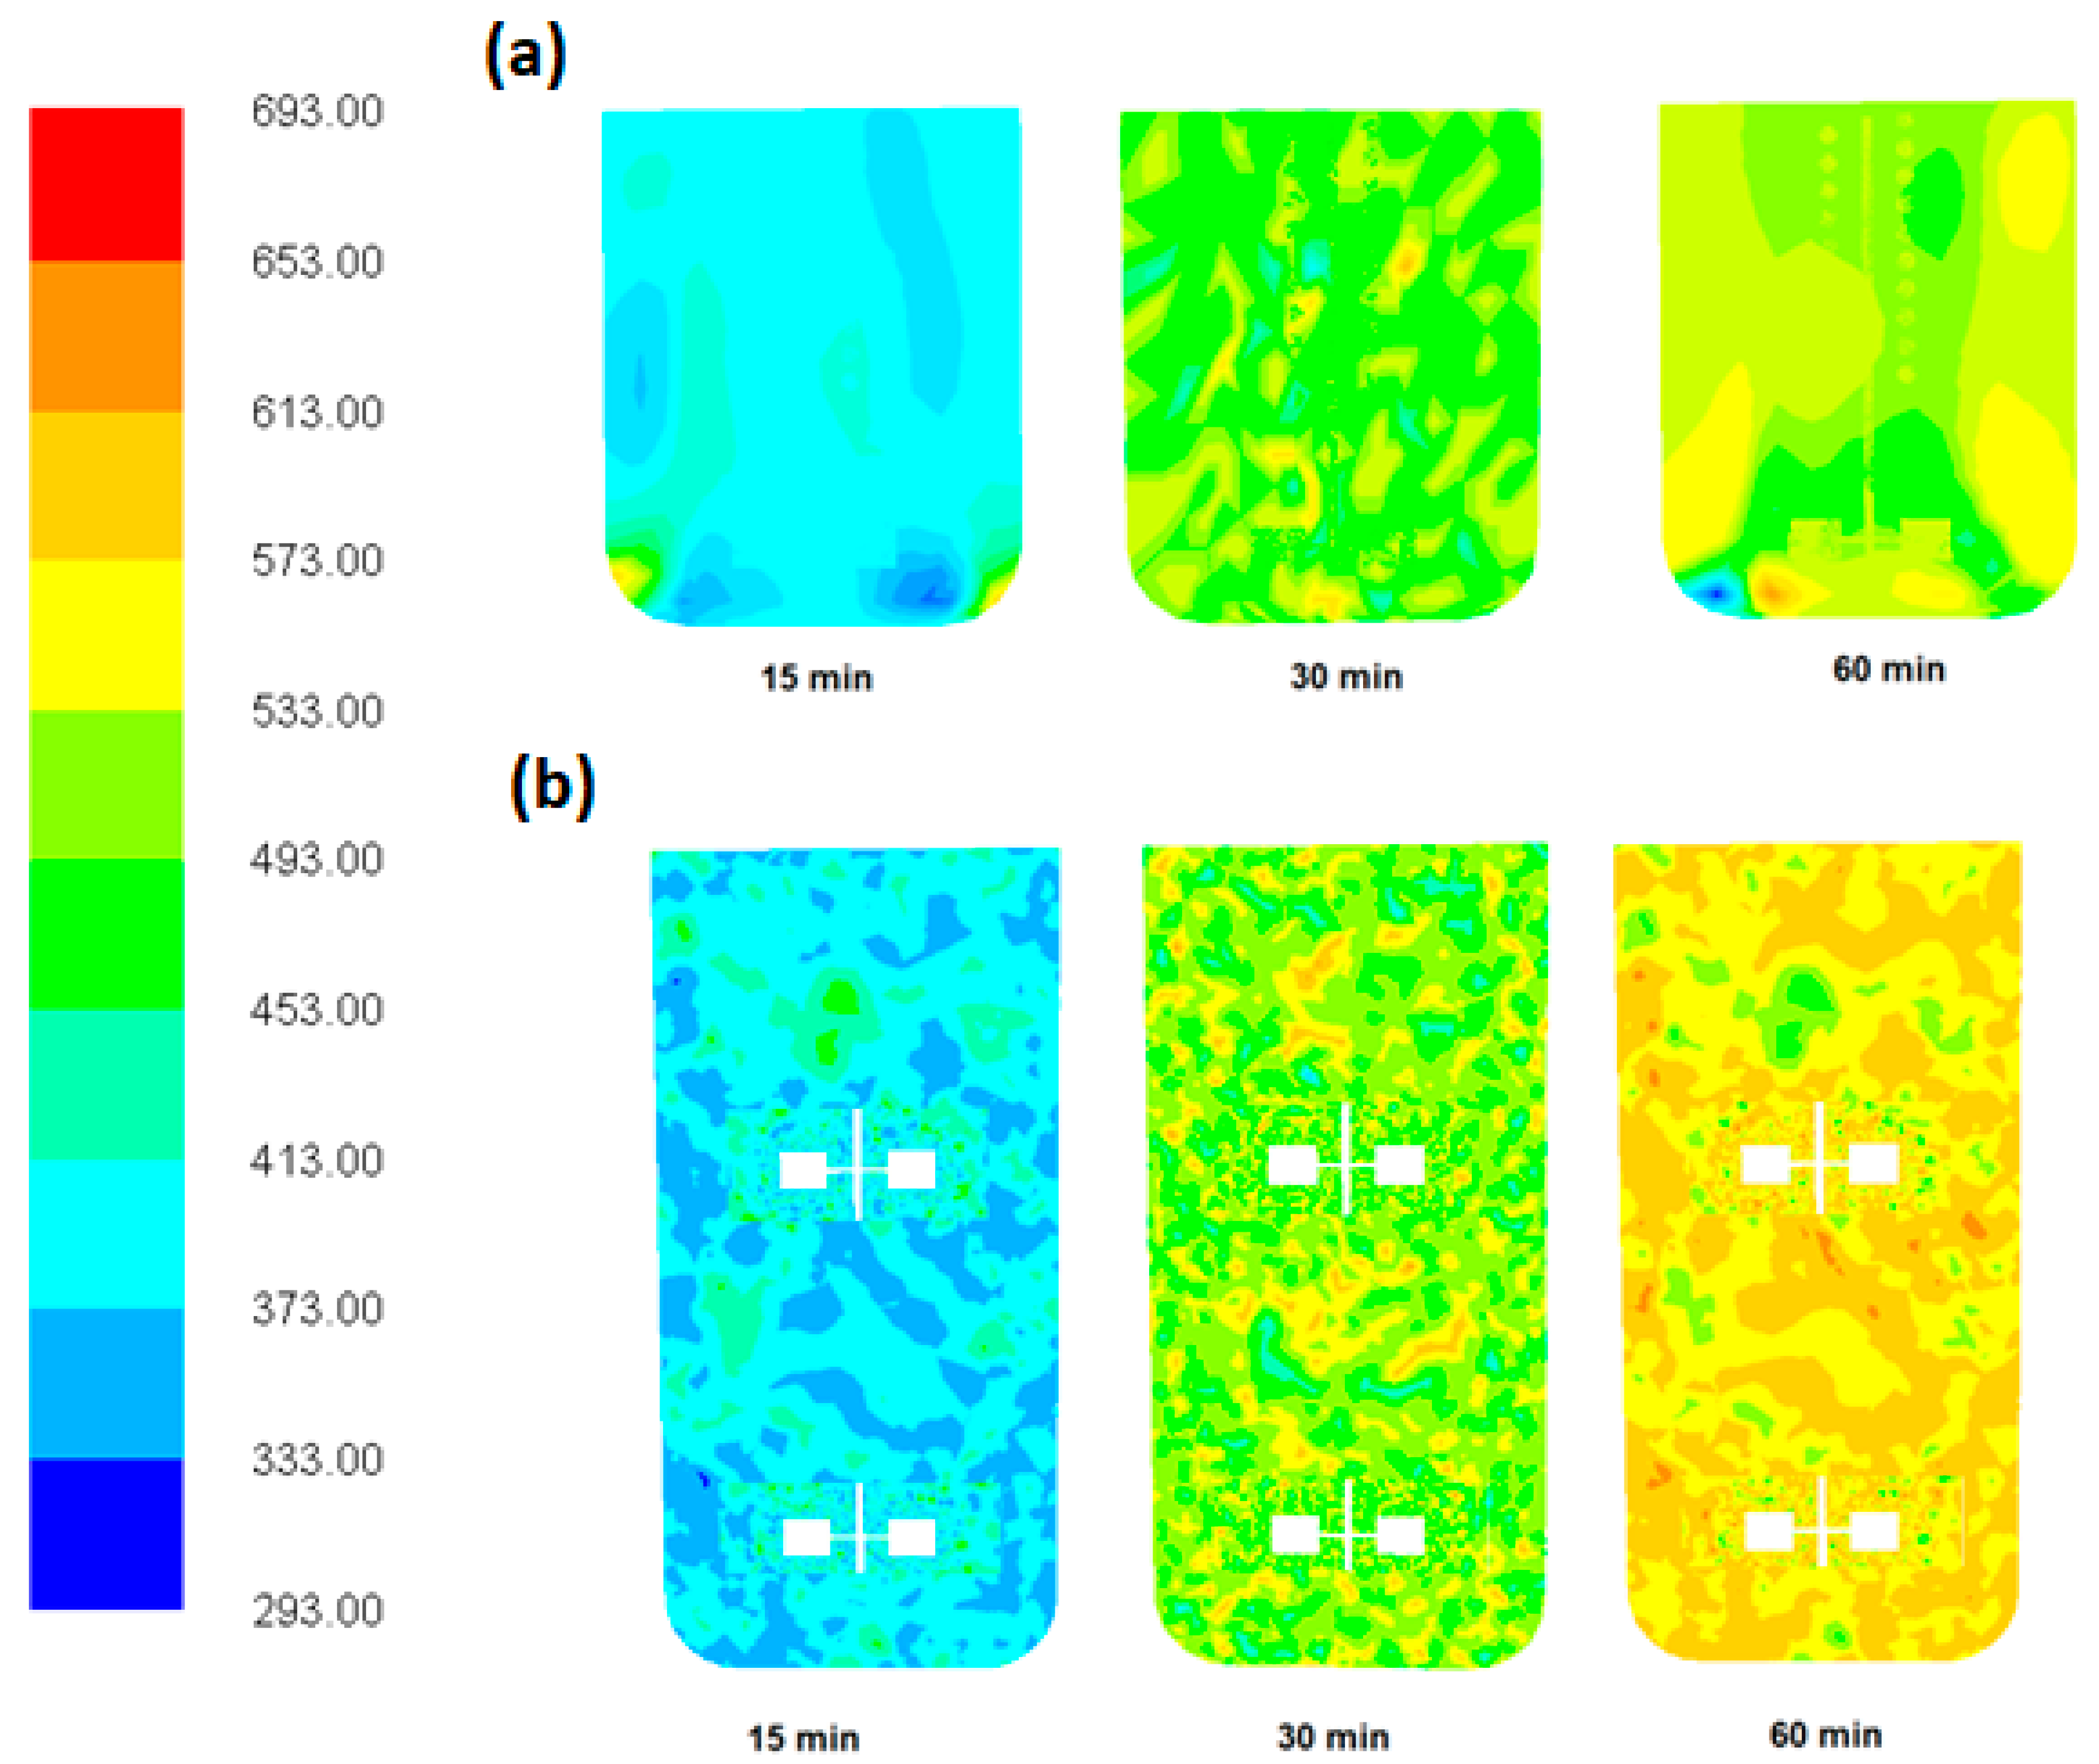
Figure 5 shows contour diagrams of the reactor temperature distribution in the unsteady state for reactor volumes (a) 3 L and (b) 12 L. It can be observed that the reactor is able to heat up to a maximum temperature of 50 °C within 15 min. This is related to the high thermal inertia as well as the uneven distribution of biomass in the entire reactor volume, which is the cause of thermal gradients. It is also important to match the bio-raw material flow rate to the reactor heating rate, which significantly contributes to process efficiency. The uneven distribution of bio-raw material and the temperature distribution are largely promoted by the mixer rotation speed and the vortex effect created by the mixer tangential stresses. At about 30 min, the reactor reached a temperature of 210 °C, but thermal gradients caused a phenomenon called “thermal runaway”, where the temperature control of the synthesis reactor was lost whenever the rate at which the cooling system was able to remove the heat generated by the synthesis reactions was lower than that at which the heat was released by the reactions themselves. Many studies have investigated the identification of the so-called “runaway boundary” (that is, the set of design and operating parameters at which there is the triggering of a runaway phenomenon). After about 50 min, the temperature stabilized, and the thermal gradients disappeared. Spatial visualization allowed for the identification of the distribution of biomass under a pressure of 200 bar at a temperature of 90–423 °C. The increase in convective heat transfer increased with the increase in the stirrer speed, which affected the operating conditions and efficiency of the HTL process. In a smaller-scale reactor, there are smaller thermal gradients, and the process is conducted in more stable conditions. When the reactor scale is enlarged, larger gradients occur. However, when higher process intensification is required in order to increase reactor productivity, the operating conditions of the process are important. The intrinsic safety of the process can be ensured by reducing the reaction volumes (and therefore the reactant hold-up) and increasing the effectiveness of the heat exchange during synthesis.
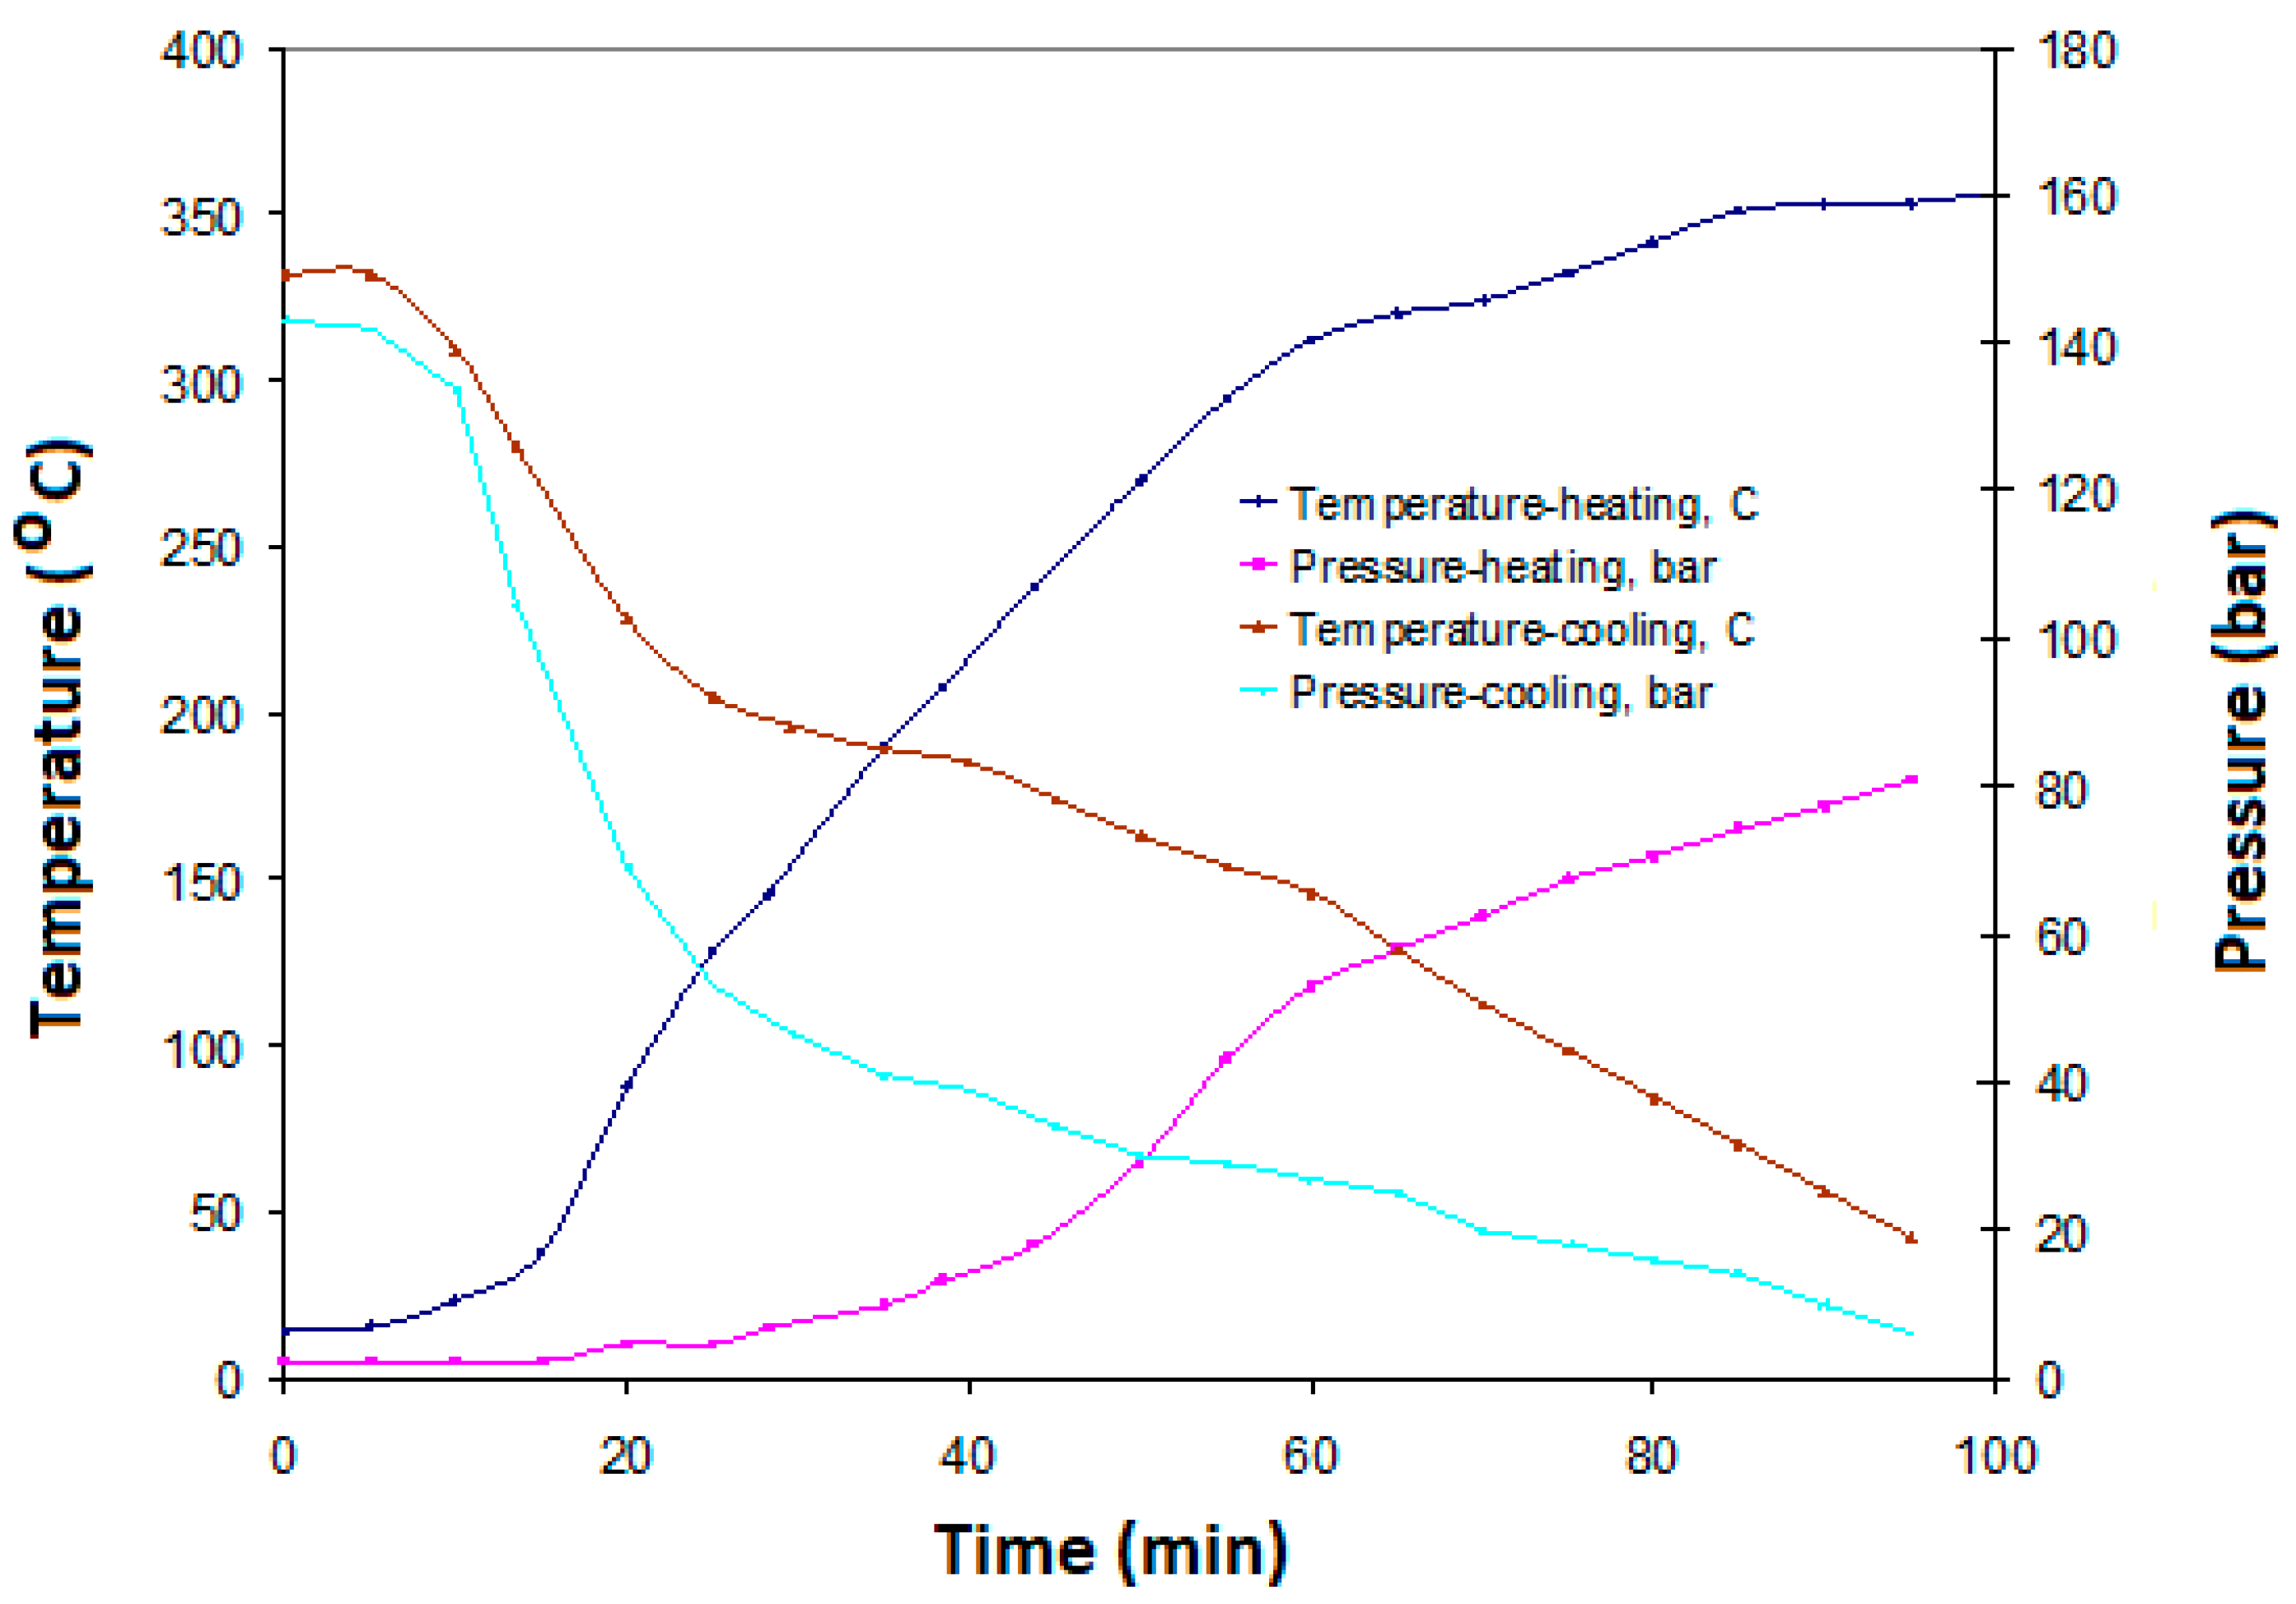
Figure 6 shows the heating dynamics of a 1 L reactor with increasing temperature; the increase in dynamics is proportional. It can be seen that at a temperature of 350 °C, the pressure is 180 bar. In the case of reactor cooling, the dynamics of the pressure drop with decreasing temperature are intensive. Figure 6 shows the heating dynamics of the reactor, where the increase in the reactor temperature leads to an increase in pressure due to the increase in the water temperature and its subsequent phase transitioning into steam. After reaching a temperature exceeding 100 °C, the pressure inside the reactor increases exponentially. Figure 7b shows the cooling dynamics of the reactor, where the temperature drop causes a corresponding pressure drop. This pressure drop can also lead to intensive liquid evaporation, phase transitions, and a decrease in the temperature and gas volume. However, with intensive mixing, both heat and pressure are evenly distributed throughout the reactor. However, if the mixing intensity is reduced, local temperature gradients (thermal gradients) can occur, potentially affecting the local pressure inside the reactor. Local pressure fluctuations can be caused by gas cooling, endothermic reactions, or liquid evaporation. As the temperature decreases, the solubility of gas in liquids increases, which can lead to decreased pressure in the gas phase.
Figure 7 shows the concentration profile of biocrude oil at different reactor volumes of (a) 3 L and (b) 12 L formed during the HTL process at various time intervals in the transient state. With the increase in reaction time, a larger amount of biocrude oil is produced. The contours of biocrude oil accumulating in the region above the mixer are visible, and this is closely associated with hydrodynamic conditions as the reaction progresses. The area favorable for the formation of biocrude oil above the mixer is strongly correlated with hydrodynamic flow patterns, which are most intense in the radial region of the mixer. The highest shear rate also occurs in this area, which is crucial for the intensity of the conversion of sludge into biocrude oil. For biocrude oil particles, the flow becomes more disturbed, as evidenced by the differentiated contours at the bottom of the tank. As particle size increases, the sedimentation velocity also increases, leading to a decrease in suspension homogeneity. This indicates the necessity of applying higher stirrer rotational frequencies to maintain particles in suspension within the slurry volume. The highest values of the dimensionless kinetic energy of turbulence occur in the edge zone of the stirrer blades. On the other hand, this area has the highest values of the dissipation rate of kinetic energy, where information about the degree of dispersion in the liquid phase is of great importance. Better dispersion of solid particles in the suspension volume causes a larger active surface area to be available for the substrate. Energy absorption in the process is a key factor determining the efficiency of the process. For the 3 L and 12 L reactors, the highest concentration of biocrude oil occurs in the area above the stirrer blades. At the same time, the contours for the 3 L reactor are significantly denser, indicating that on a smaller scale, the formation of biocrude oil is more intensive, whereas on a larger scale, energy dissipation is faster, and dead zones are more pronounced. However, the reactor and two mixers being on a larger scale stabilizes the area of biocrude oil formation, which is related to the hydrodynamic flow pattern. This emphasizes the significant role of the mixing flow pattern in stabilizing the areas of biocrude oil. However, a smaller reactor volume intensifies biocrude oil formation.
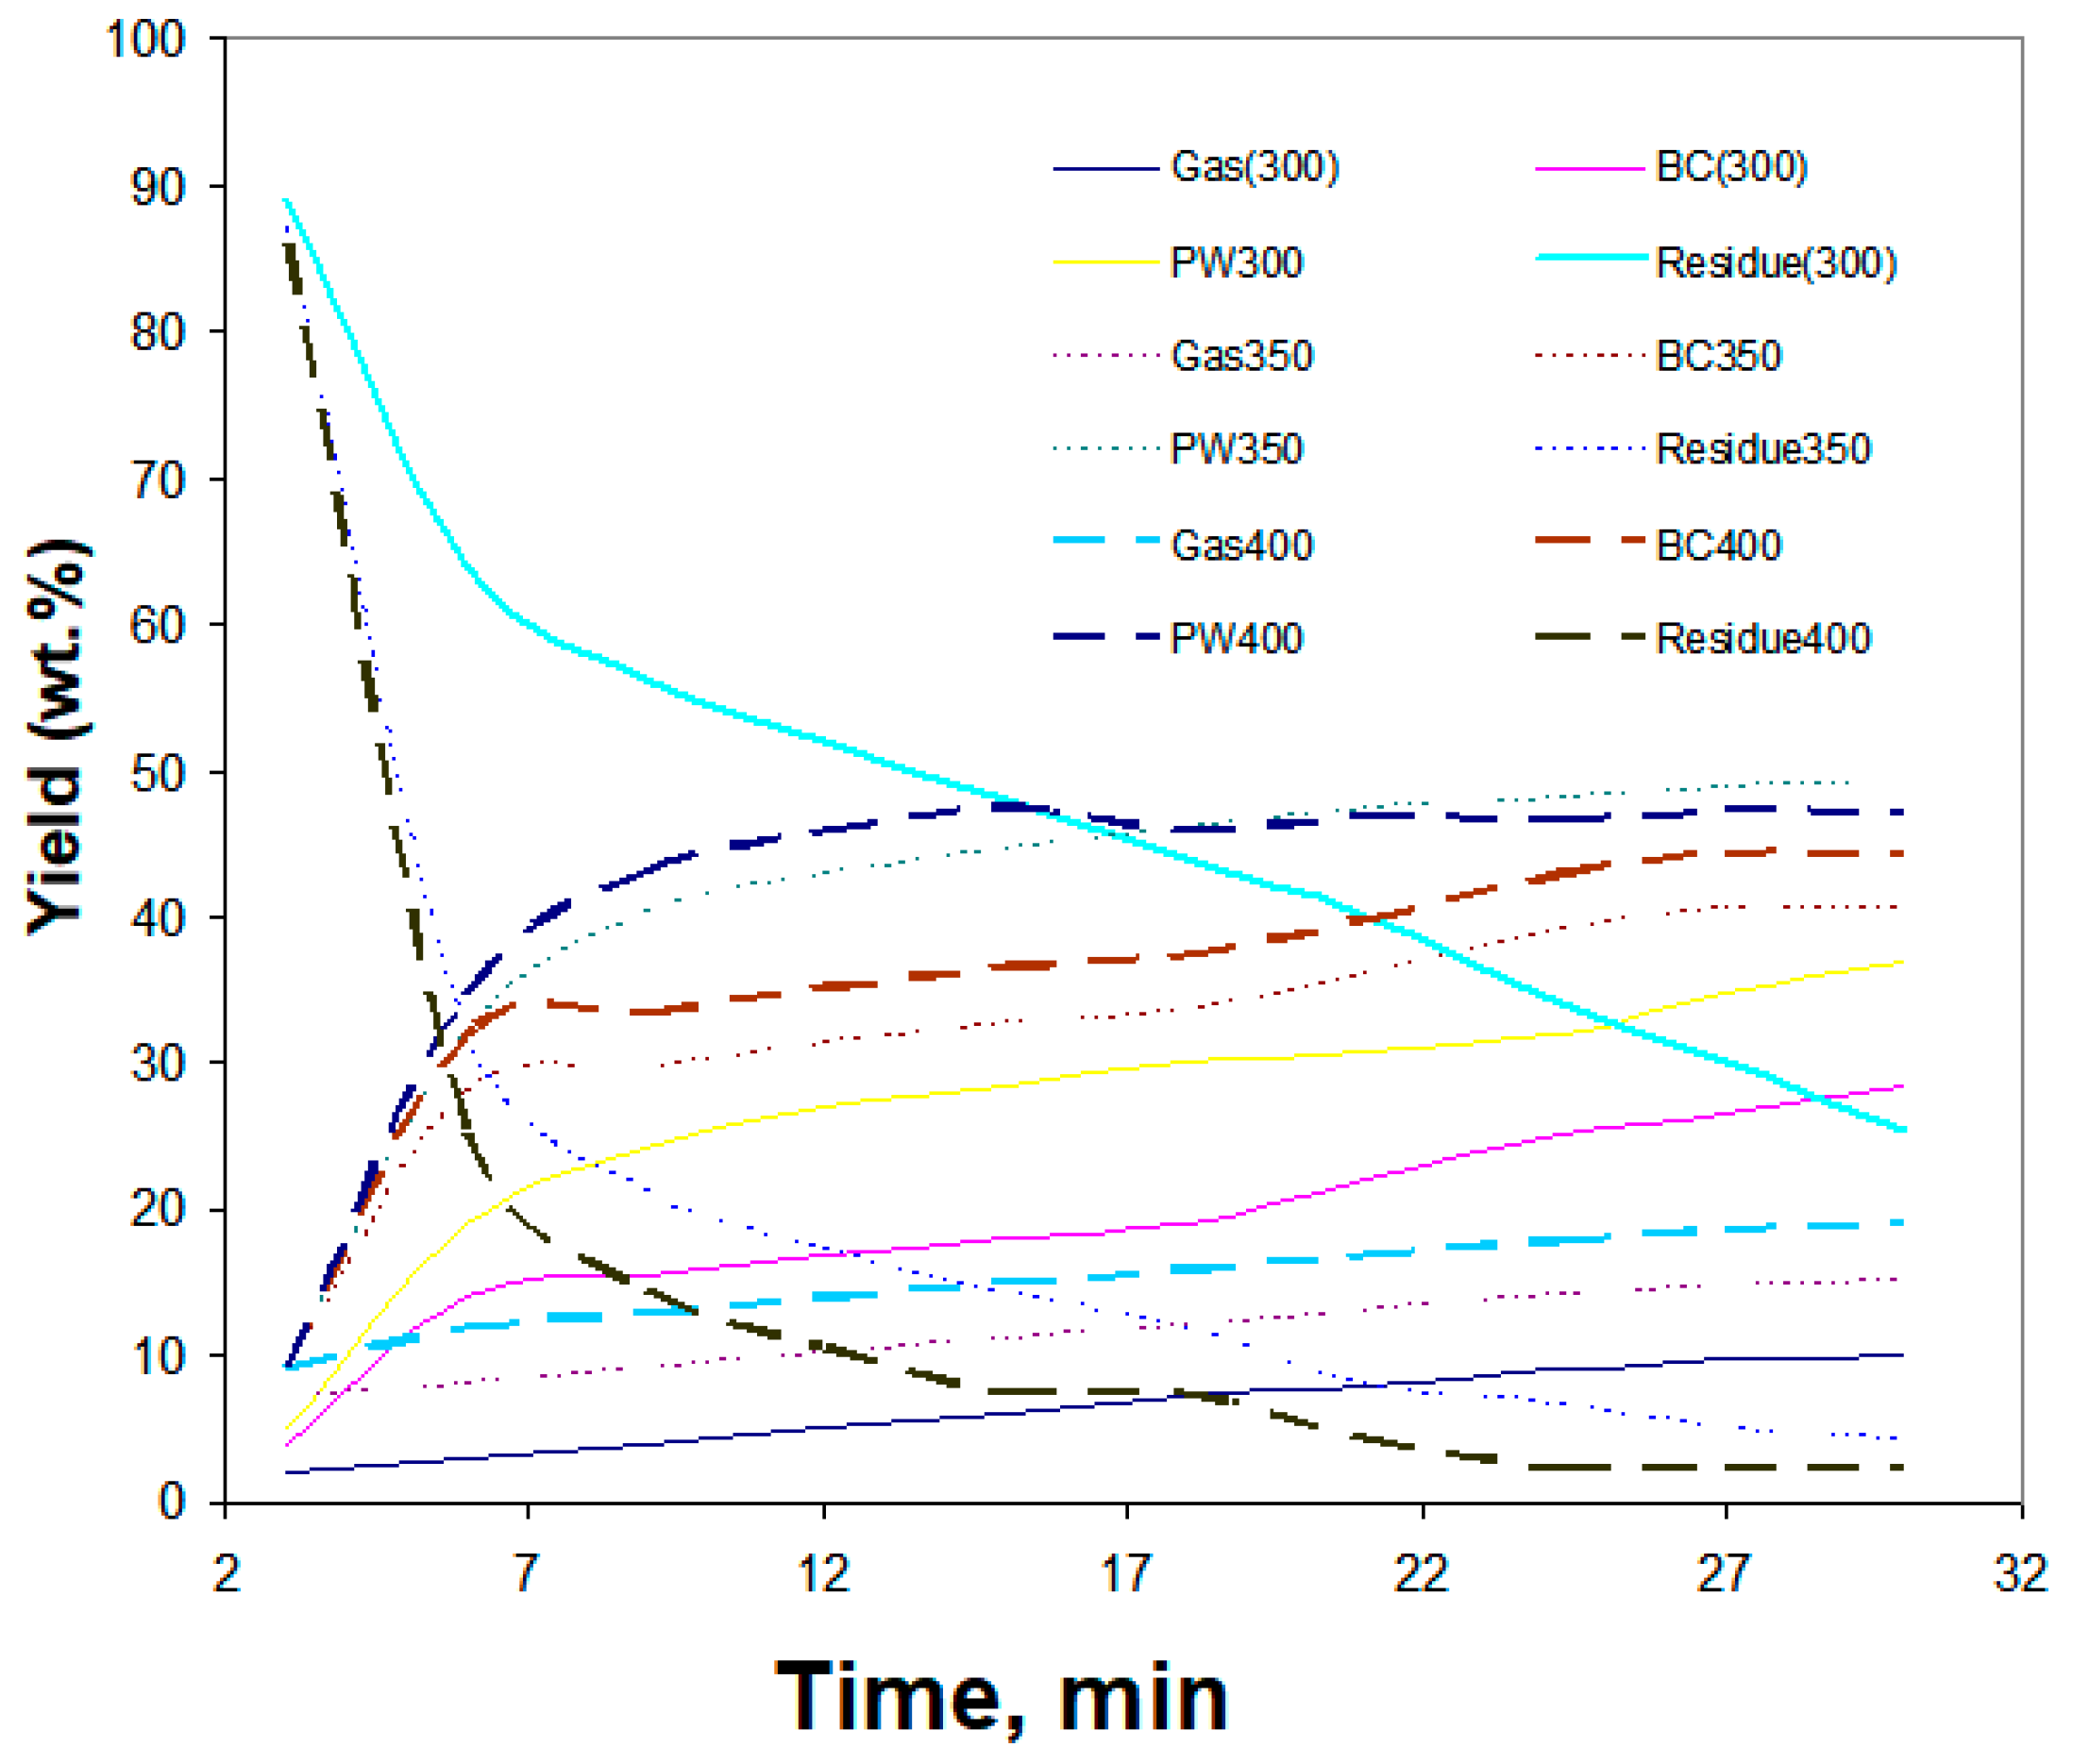
The figure below (Figure 8) illustrates product yields from the hydrothermal liquefaction (HTL) of sewage sludge (16 wt% DM slurry) conducted at a pressure of 220 bar and temperatures of 300, 350, and 400 °C for various phases of the multiphysical system during transient conditions. As the temperature increases, the yield of gases rises, while the residue fraction decreases. For the aqueous phase, its yield increases to a threshold value of 48.38% but subsequently declines at 400 °C in favor of the gas phase. These results pertain to a 3 L reactor operating at an impeller speed of 184 rpm. The transient state revealed dynamic changes in the concentrations of individual reactants. Temperature plays a pivotal role in predicting the concentrations of reactants involved in the HTL process, particularly if we are to avoid undesired carbonization and polymerization reactions at higher temperatures. The issue of char and coke formation is a common challenge in HTL processes. Char originates from partially converted biomass solids, while coke results from the further thermal decomposition of biocrude oil formed during the HTL process. Although the decomposition of biomass occurred more rapidly at 350 °C, as indicated by the steeper decline in the slope of residual solids, the biocrude oil yield at 350 °C was slightly lower than 325 °C at the reactor outlet.
The influence of flow rate and temperature on biocrude oil yield from sewage sludge in the hydrothermal liquefaction (HTL) process is shown in Figure 9a. As indicated, increasing the flow rate of sewage sludge (thus affecting contact time) and reducing temperature led to a decrease in biocrude oil yield. To improve the conversion of sewage sludge to biocrude oil, the process can be optimized by lowering the slurry flow rate and raising the reactor temperature to 673 K. However, this often reduces the reactor’s production capacity. One potential way to address this limitation is to employ multiple reactors in a cascade configuration. Figure 9b shows the effect of flow rate and temperature on biomass conversion rate. In the range of 60–104 mL/min, the conversion rate reached its maximum, beyond which it declined for the 3 L reactor. The flow rate’s impact on biomass conversion into bio-oil is also closely related to the hydrodynamic conditions within the HTL process, where temperature and pressure significantly influence the reaction conditions due to the process’s nonlinear hydrodynamics. Parameters such as stirrer rotation speed, solid concentration, and reactor design can be modified. The variable concentrations of H2 and CO could potentially be adjusted in future applications to align with the requirements of gas synthesis, which would involve industrial-scale systems for gas composition control. As the reactor volume increases, more volumetric flow is needed to maintain the biocrude conversion rate. In Figure 9b, it can be seen that as the reactor volume increases, the volumetric flow rate must be increased to keep the biocrude conversion rate at a constant level. Increasing the flow rate in a CSTR reactor while simultaneously increasing its volume is intended to maintain a constant conversion of biomass to biocrude for several reasons. If the volume is increased and the flow rate is reduced, the biomass particles have more time to react. However, too long a residence time can lead to byproduct formation or biocrude degradation. Upon increasing the volume and decreasing the flow rate, the biomass concentration becomes higher. This can lead to slower reactions due to diffusion limitations. Understanding the relationship between reactor volume, flow rate, and flow and biomass conversion is essential for optimizing the HTL process. By properly selecting these parameters, maximum biocrude production efficiency can be achieved at minimum production cost. The simulation results demonstrate that at larger scales, increased impeller torque and modified vortex structures lead to reduced axial recirculation and asymmetric solid distribution. This in turn weakens vertical mixing and limits heat transport between the lower and upper reactor zones. The DEM-CFD model captures these effects by resolving local velocity fields, solid concentrations, and thermal gradients under varying reactor diameters. Therefore, the scaling mechanism is explained through both fluid–solid dynamics and their impact on energy transport efficiency during HTL operation.
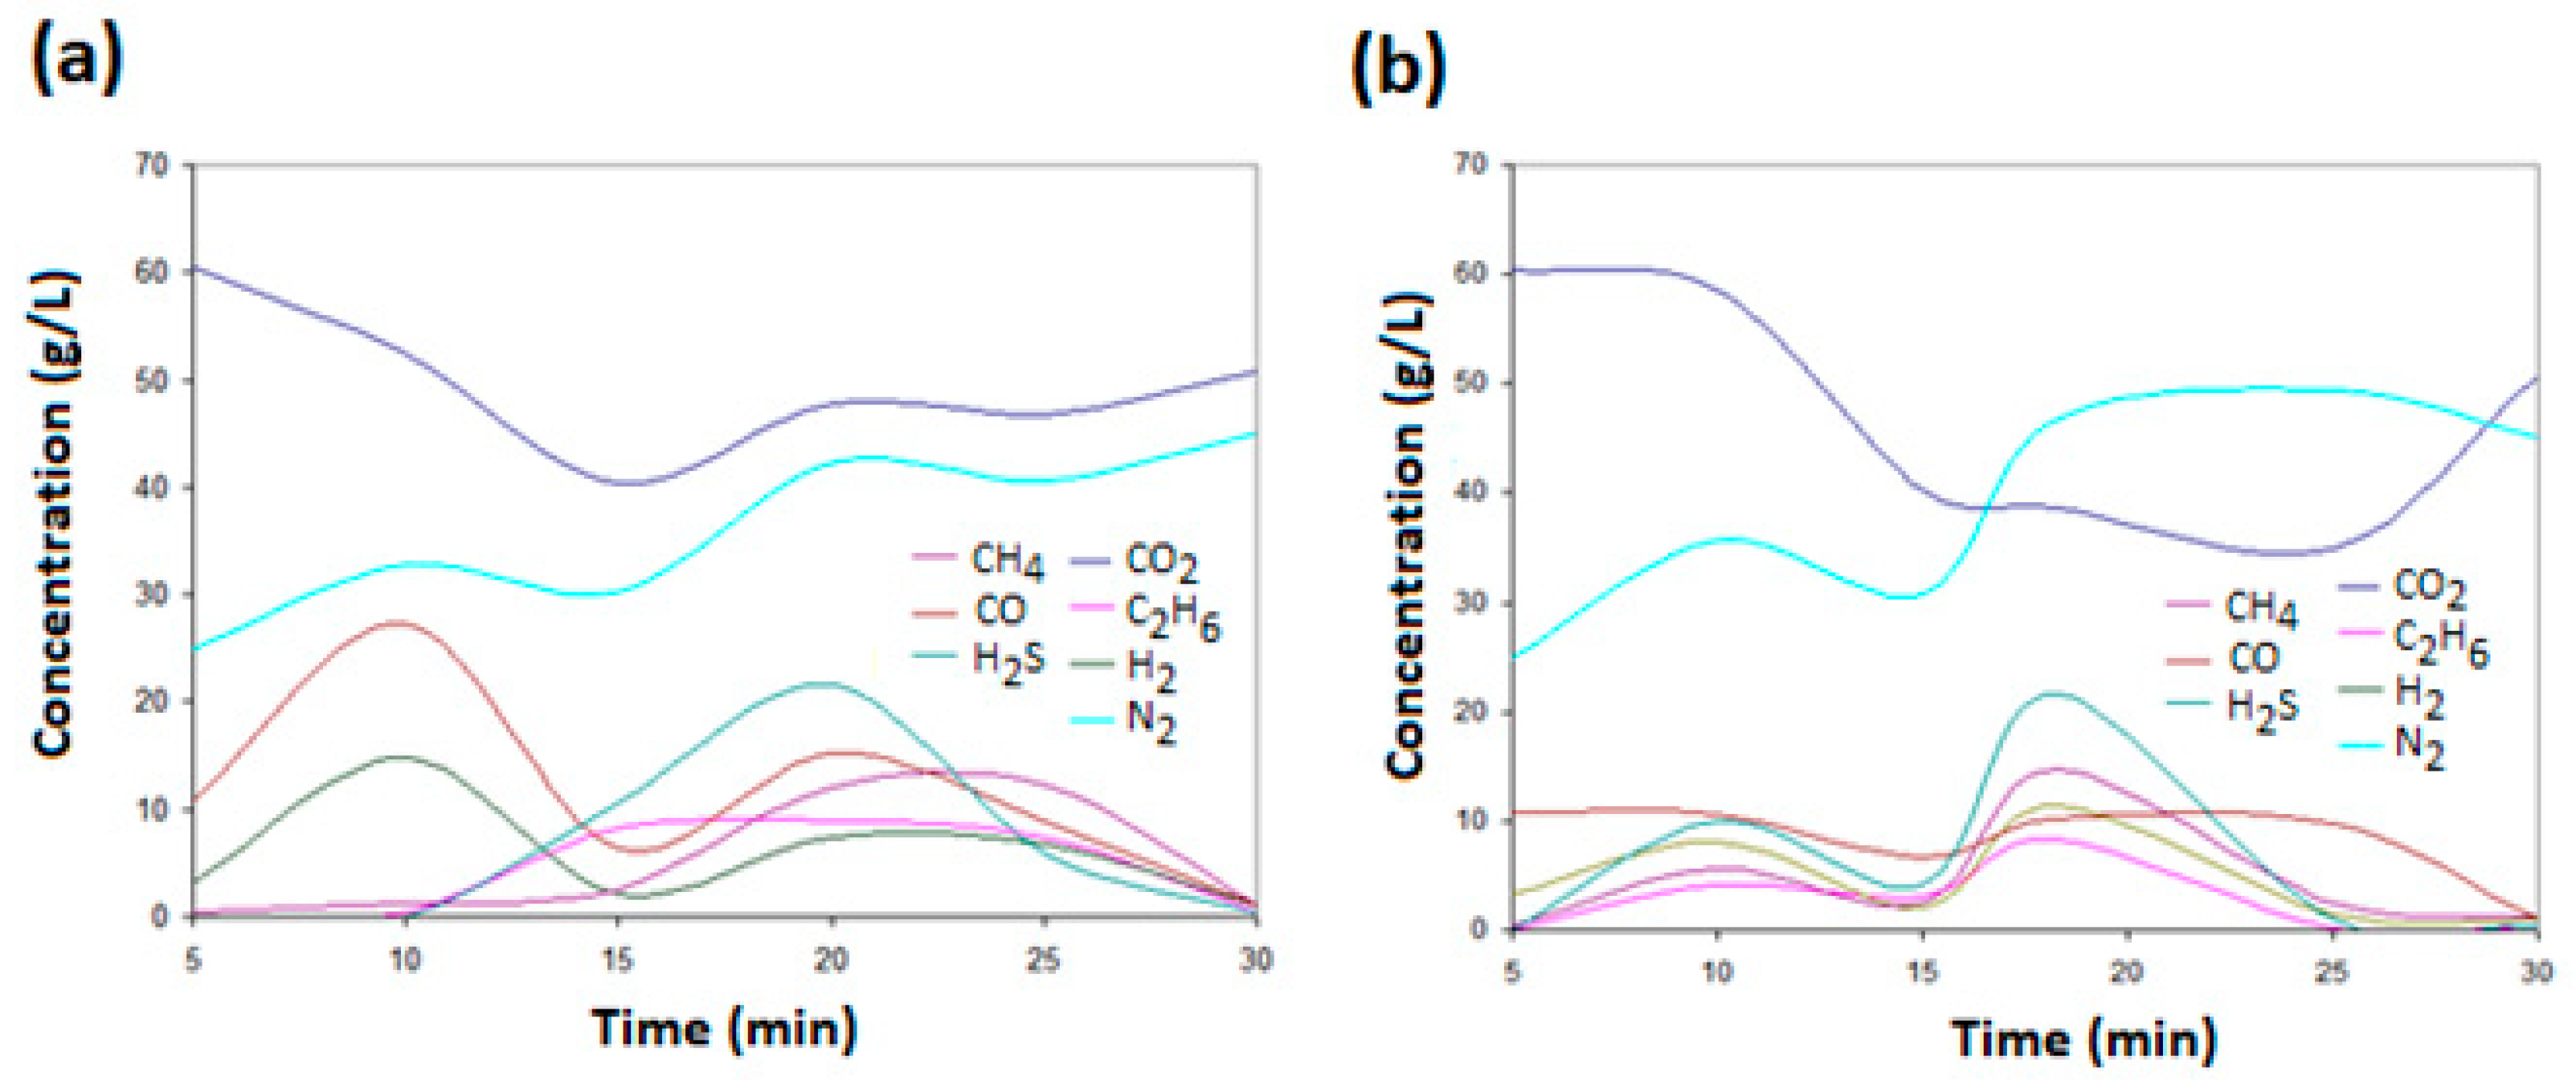
Figure 10 shows that with the increase in the reactor volume, the amount of CO2 produced increases, and the amount of CO decreases. With the increase in temperature, the amount and calorific value of the gases produced increase. In the figures below, we can see that the composition of gases for reactors operating under the same process conditions is the same. CO is a reactive compound that is converted to CO2 in the presence of water (at high temperatures). With a longer reaction time, the degree of reaction increases, which leads to a decrease in the amount of CO and an increase in CO2 and H2. The efficiency of some reactions increases with higher temperature, which is characteristic of the HTL process, and with greater access to water vapor (which is enabled by a longer reaction time).
In Figure 11a, it can be observed that with increasing reactor volume, the composition of the individual gas components changes under identical operating conditions. With an increase in reactor volume, the amount of CO2 increases, while the amount of CO decreases, indicating that different reactions may occur depending on temperature, pressure, and reaction mixture composition. Increasing reactor scale can influence both reaction kinetics and product concentration distributions. As the reactor scale increases, it is more difficult to maintain constant temperature and pressure conditions, especially in the HTL process, where the reactions are strongly endothermic or exothermic. Temperature increases—which are often observed in larger reactors due to less efficient heat transfer—together with scale effects can shift the chemical equilibrium toward different products The catalytic effects of the reactor walls are also important, as increased surface area enhances CO2 conversion pathways. As the contact surface increases, the conversion to CO2 can be more pronounced. The increase in the scale of the CSTR reactor for the HTL process leads to different slurry hydrodynamics, among which temperature, pressure, and concentration gradients can occur, although the reaction conditions are maintained at a constant level. The reaction time and the change in reactor equilibrium shift in favor of CO2 at the expense of CO. With the increase in the reactor scale, although the nitrogen concentration remains at the same level, the concentrations of H2S and C2H6 decrease slightly. In Figure 9b, it can be seen that with the increase in the reactor volume, the amount of the gas phase increases, while the amount of the water phase decreases. In the hydrothermal liquefaction (HTL) process, with the increase in the scale of the CSTR reactor, the amount of the gas phase tends to increase. This is due to several factors specific to high-temperature, high-pressure processes that occur in reactors with larger volumes. (1) These reactions often lead to the formation of gaseous products, such as CO2, CO, or CH4. As a result, the amount of gas phase may increase with a larger-scale reactor. (2) The parameters are more difficult to control; in large-scale reactors, it is more difficult to maintain a uniform temperature and pressure throughout the volume, which can result in areas of higher temperature that favor gas formation. In particular, local temperature increases can increase the rate of the thermolysis reaction that generates the gas phase. (3) The phase distribution depends on pressure and temperature. In HTL processes, maintaining high pressure helps to preserve water in the liquid state, but in large reactors, the pressure can be more difficult to control. If the pressure is not optimal, partial conversion of water into the gas phase can occur, which will further increase the proportion of gases. In large-scale reactors, it is more difficult to precisely control temperature and pressure, which leads to an increase in the number of thermal reactions. In larger-volume reactors, it is more difficult to maintain a high biocrude yield, because some of this liquid phase undergoes further reactions, then transforming into gas. With the increase in the reactor production upon scaling up, contact between the phases also increases, which can promote condensation of water vapor and gases and their absorption into the liquid phase. In larger reactors, more efficient mixing processes can improve the solubility of gases and water vapor in the liquid phase, resulting in less of them as a separate phase. As the reactor is scaled up, temperature and pressure control become more difficult. Local temperature differences can occur, which can lead to slightly different reaction conditions, favoring the formation of the liquid phase at the expense of the water and gas phases.
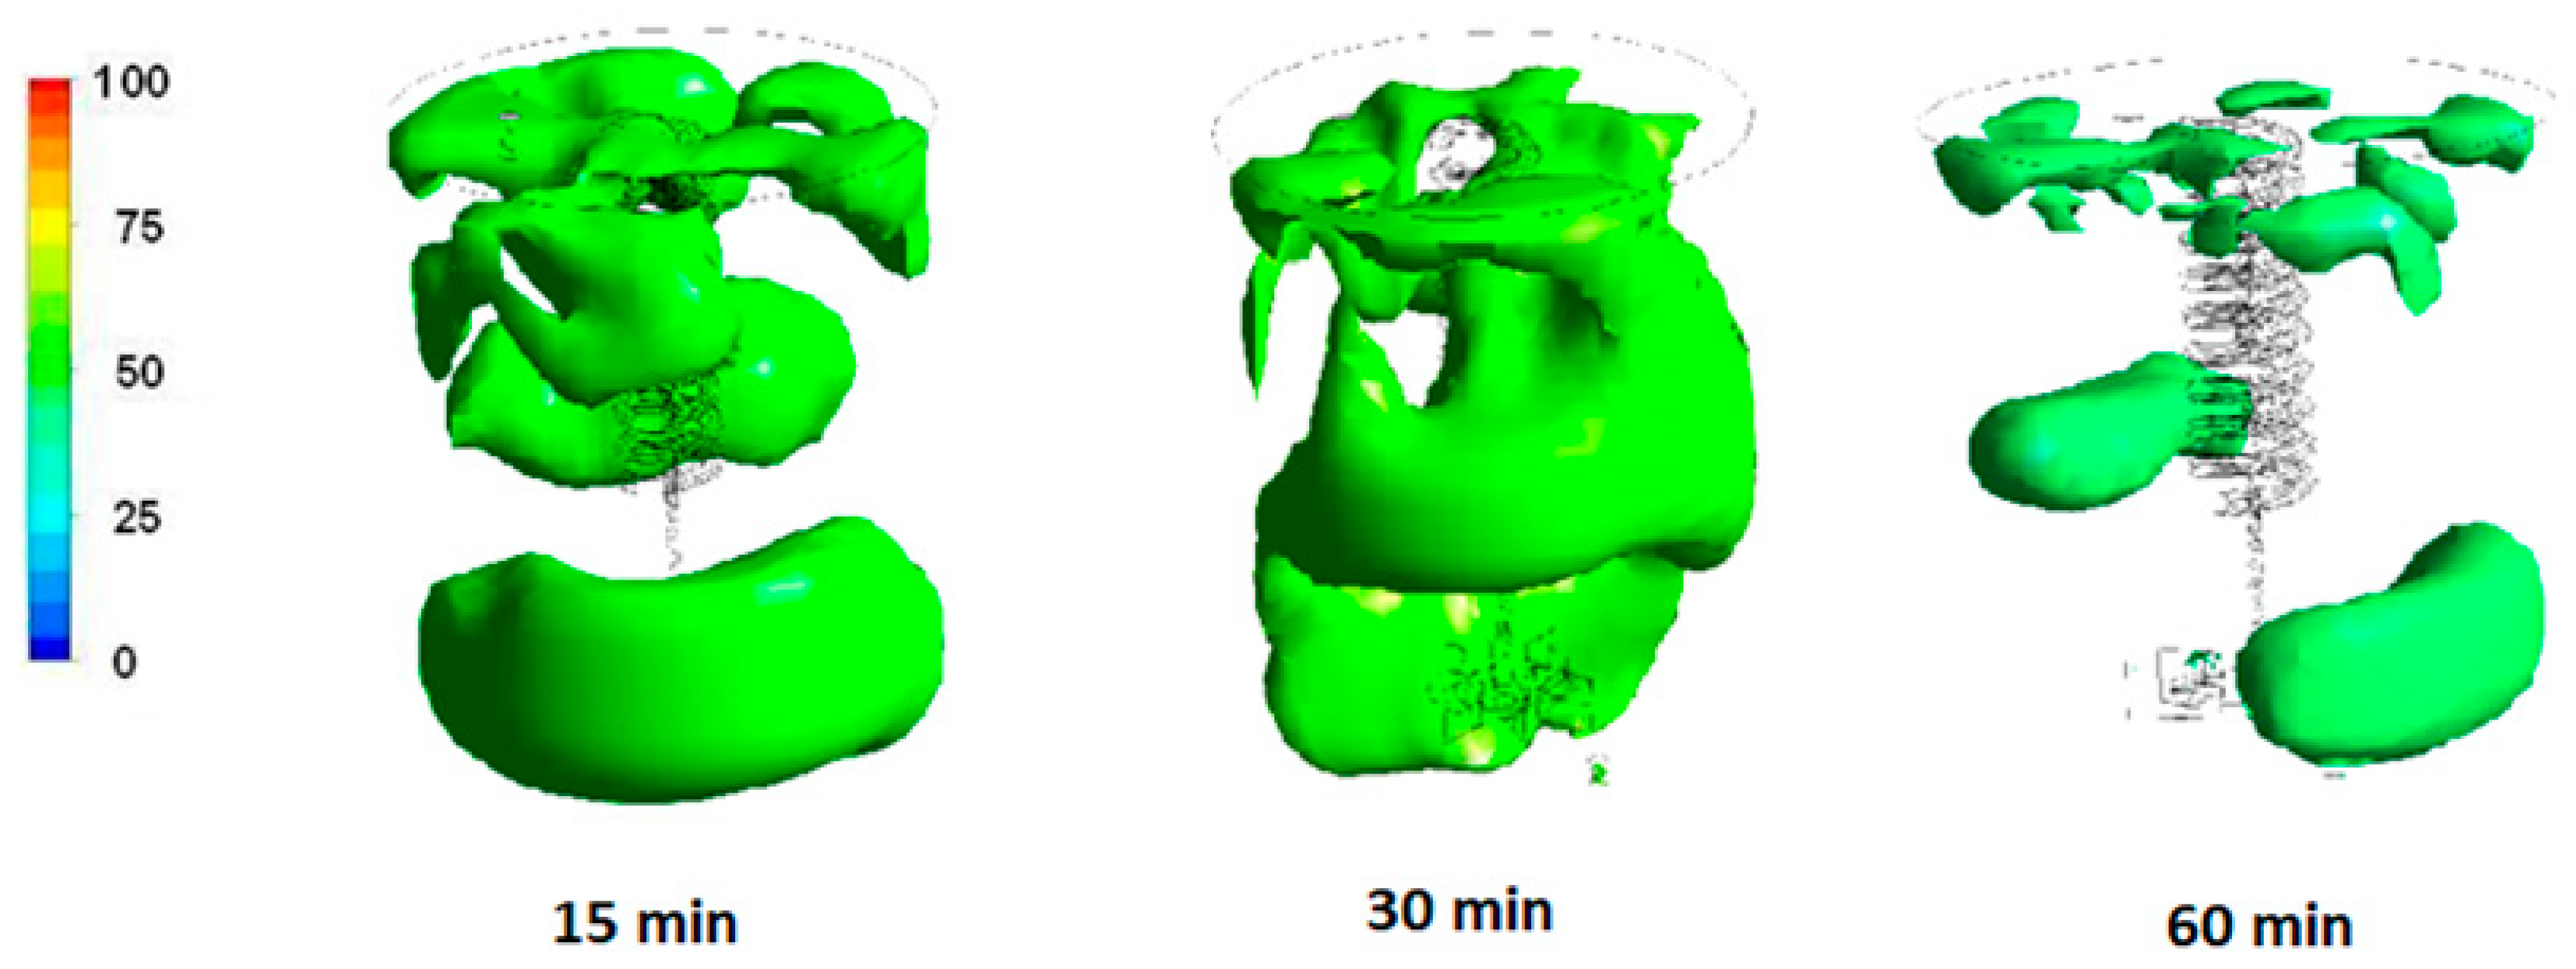
Figure 12 shows a post-processing visualization of a transient-state HTL showing the volume fraction of the solid biosource. With the increase in the process time, the solid phase content decreases. This is due to the viscous properties of sewage sludge flocs and their collision efficiency, which mainly depends on the temperature and the stirrer’s rotational speed. The dynamic behavior of sludge floc solid-phase distribution and structure is governed by the flow pattern, which strongly influences the fraction distribution within the reactor. Experimental measurement of the volumetric visualization of sludge flocs is impossible, which is why numerical simulations play such an important role. An increase in the impeller’s rotational speed plays a significant role in the hydrodynamic flow of the suspension within the entire reactor volume. For this reason, instantaneous contours show flow structures in high-temperature and high-pressure conditions, which is expected because of the high degree of fluctuation in solid-phase hydrodynamics systems. The distribution of the solid phase varies over transient times in reactors of different scales. At about 60 min, the solid phase volumetric content was about 40%. In accordance, an increase in the mixer rotation speed caused fluctuations in sludge flocs dynamics. Process scale-up demands greater mixing power, which is attributable to the reactor volume. In the bubble phase with internals, the large gas structures in the center broke down through the reactor.
Figure 13 below shows the effect of differing stirrer speed and reactor volume on different values of heat exchange coefficients: (a) 400 and (b) 800 W/m·K. Increasing the mixer speed increases the efficiency of biocrude yield. However, the figure shows that the increase in reactor volume does not affect the efficiency of the HTL reaction in producing biocrude oil; it only affects the reactor production capacity. The mixer speed has a significant effect on the amount of biocrude oil produced, which above a certain value does not affect the further production of biocrude oil. Effective mixing in the CSTR reactor is crucial for maintaining uniform conditions in the reaction taking place. In larger reactors, mixing can be less effective, especially at the edges and near the walls. In the case of uneven mixing, this leads to the formation of “dead zones” or areas with different temperatures, which reduces the efficiency of biomass conversion and can cause local differences in product concentrations, which affects the final efficiency of the biocrude oil. Too long a residence time can also lead to secondary reactions that reduce biocrude oil yield by converting some of the organic compounds into gas or byproducts. Optimizing residence time on a larger scale is key to ensuring adequate conversion and limiting losses from secondary reactions.
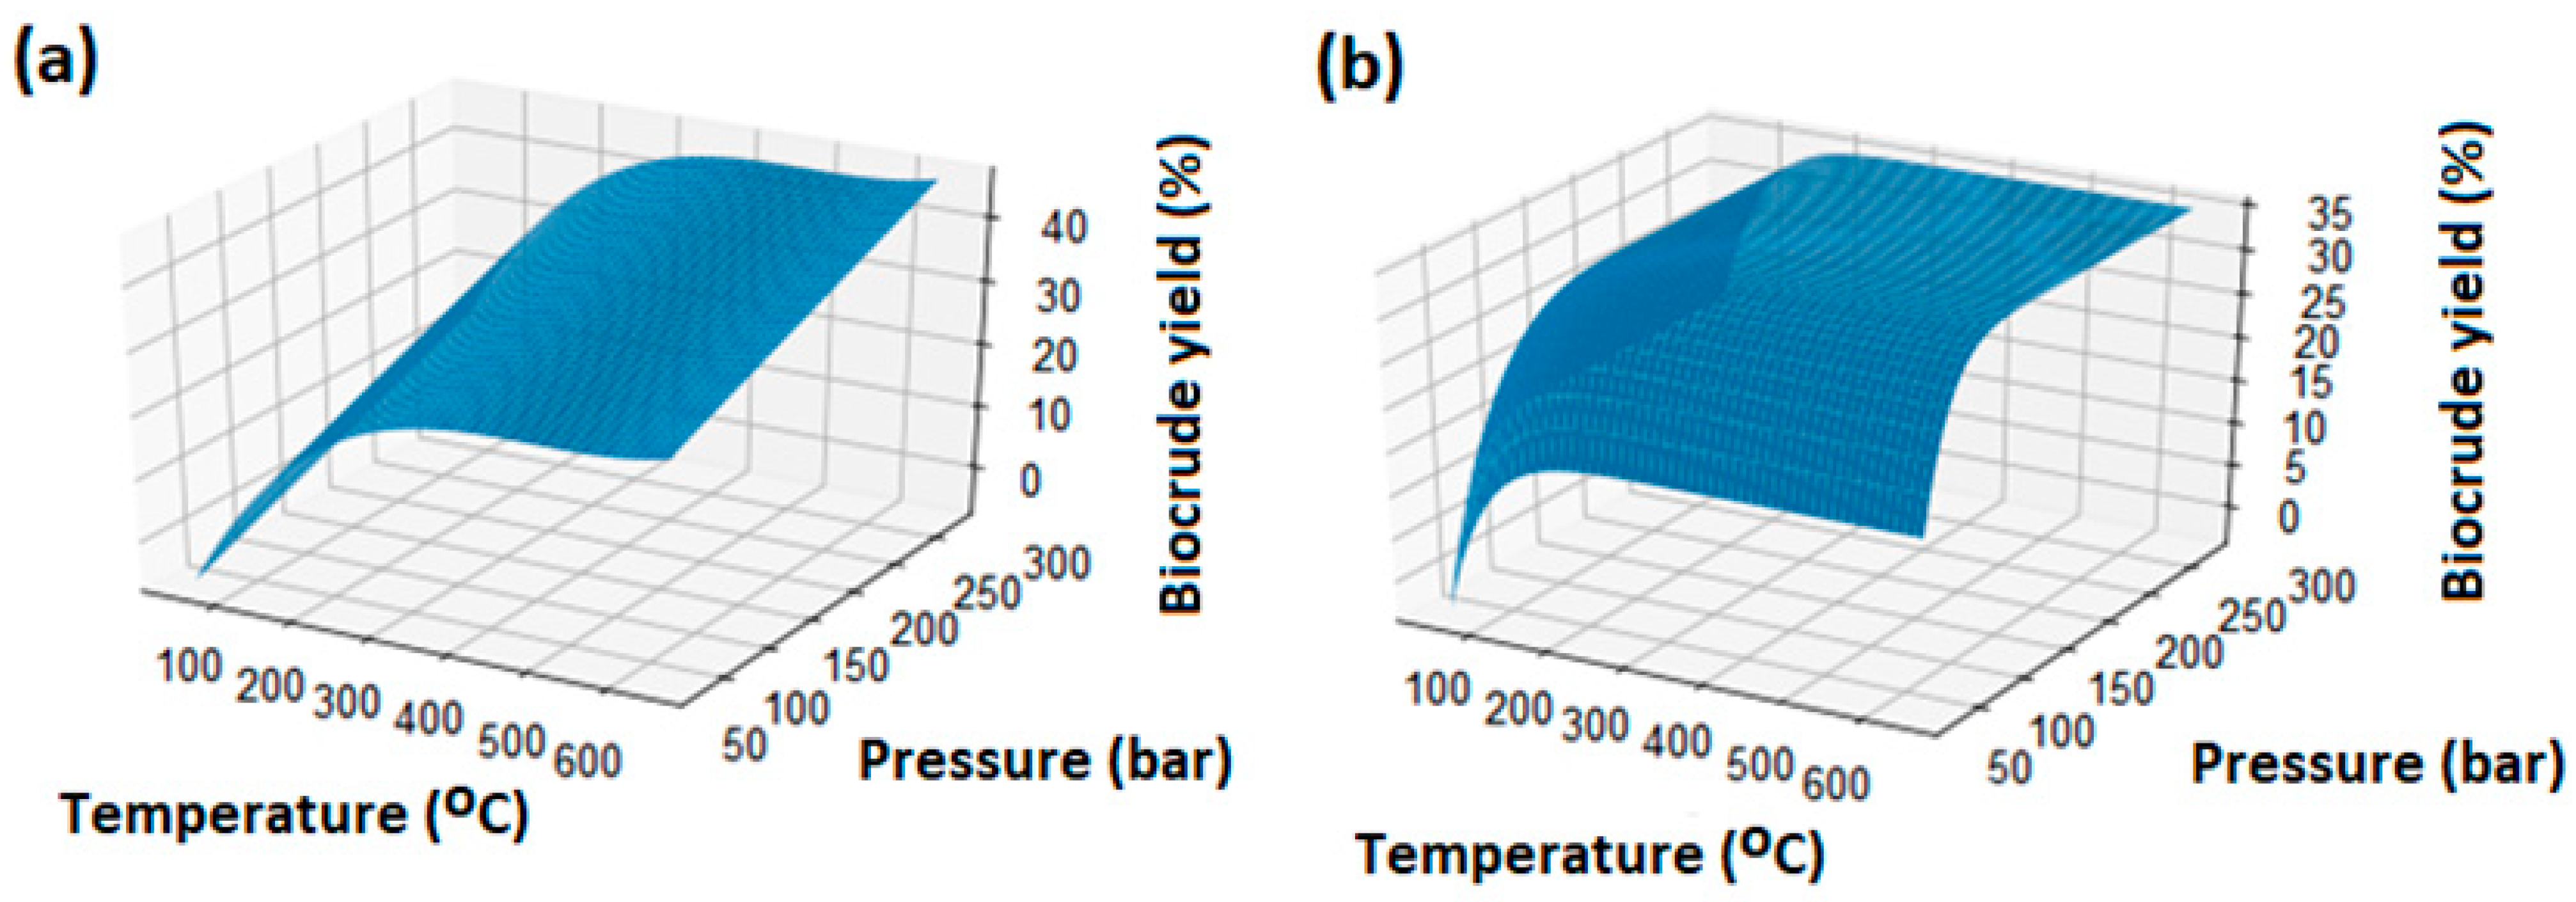
In Figure 14, the effect of temperature and pressure on biocrude yield for a (a) 3 L and (b) 12 L reactor can be observed. With increasing temperature and pressure, biocrude yield is promoted. However, with a 4-fold increase in reactor volume, the effect of pressure is much more significant than with small reaction volumes. In a larger-scale reactor, mass and heat transfer occur at a reduced rate. High pressure promotes diffusion and reactions between the liquid phase (biomass + water) and the gas phase. Higher pressure helps to keep water in a liquid state, even at very high temperatures, which allows for more intense chemical reactions, leading to higher biocrude yield. For larger reactors, pressure plays a much greater role, but it is a more energy- and material-intensive undertaking to maintain the pressure level on a larger scale. In addition, increased pressure promotes the solubility of gases (e.g., hydrogen, oxygen, CO2) in water, which promotes their reactivity with the decomposed biomass. In smaller reactors, due to their more compact design, mass and heat are better distributed, and pressure does not play such a significant role. In larger reactors, however, higher pressure allows for deeper penetration of the reactants into the biomass, aiding conversion and improving biocrude oil yield. Higher pressure on a larger scale helps to reduce the formation of gases such as CO and CO2, because the increase in pressure promotes reactions that lead to the formation of liquid hydrocarbons rather than gaseous byproducts. In larger reactors, it is more difficult to maintain uniformity of temperature and reactant concentration, leading to local differences in reaction conditions. High pressure helps to minimize these differences, because it increases mixing efficiency and reactants’ distribution.
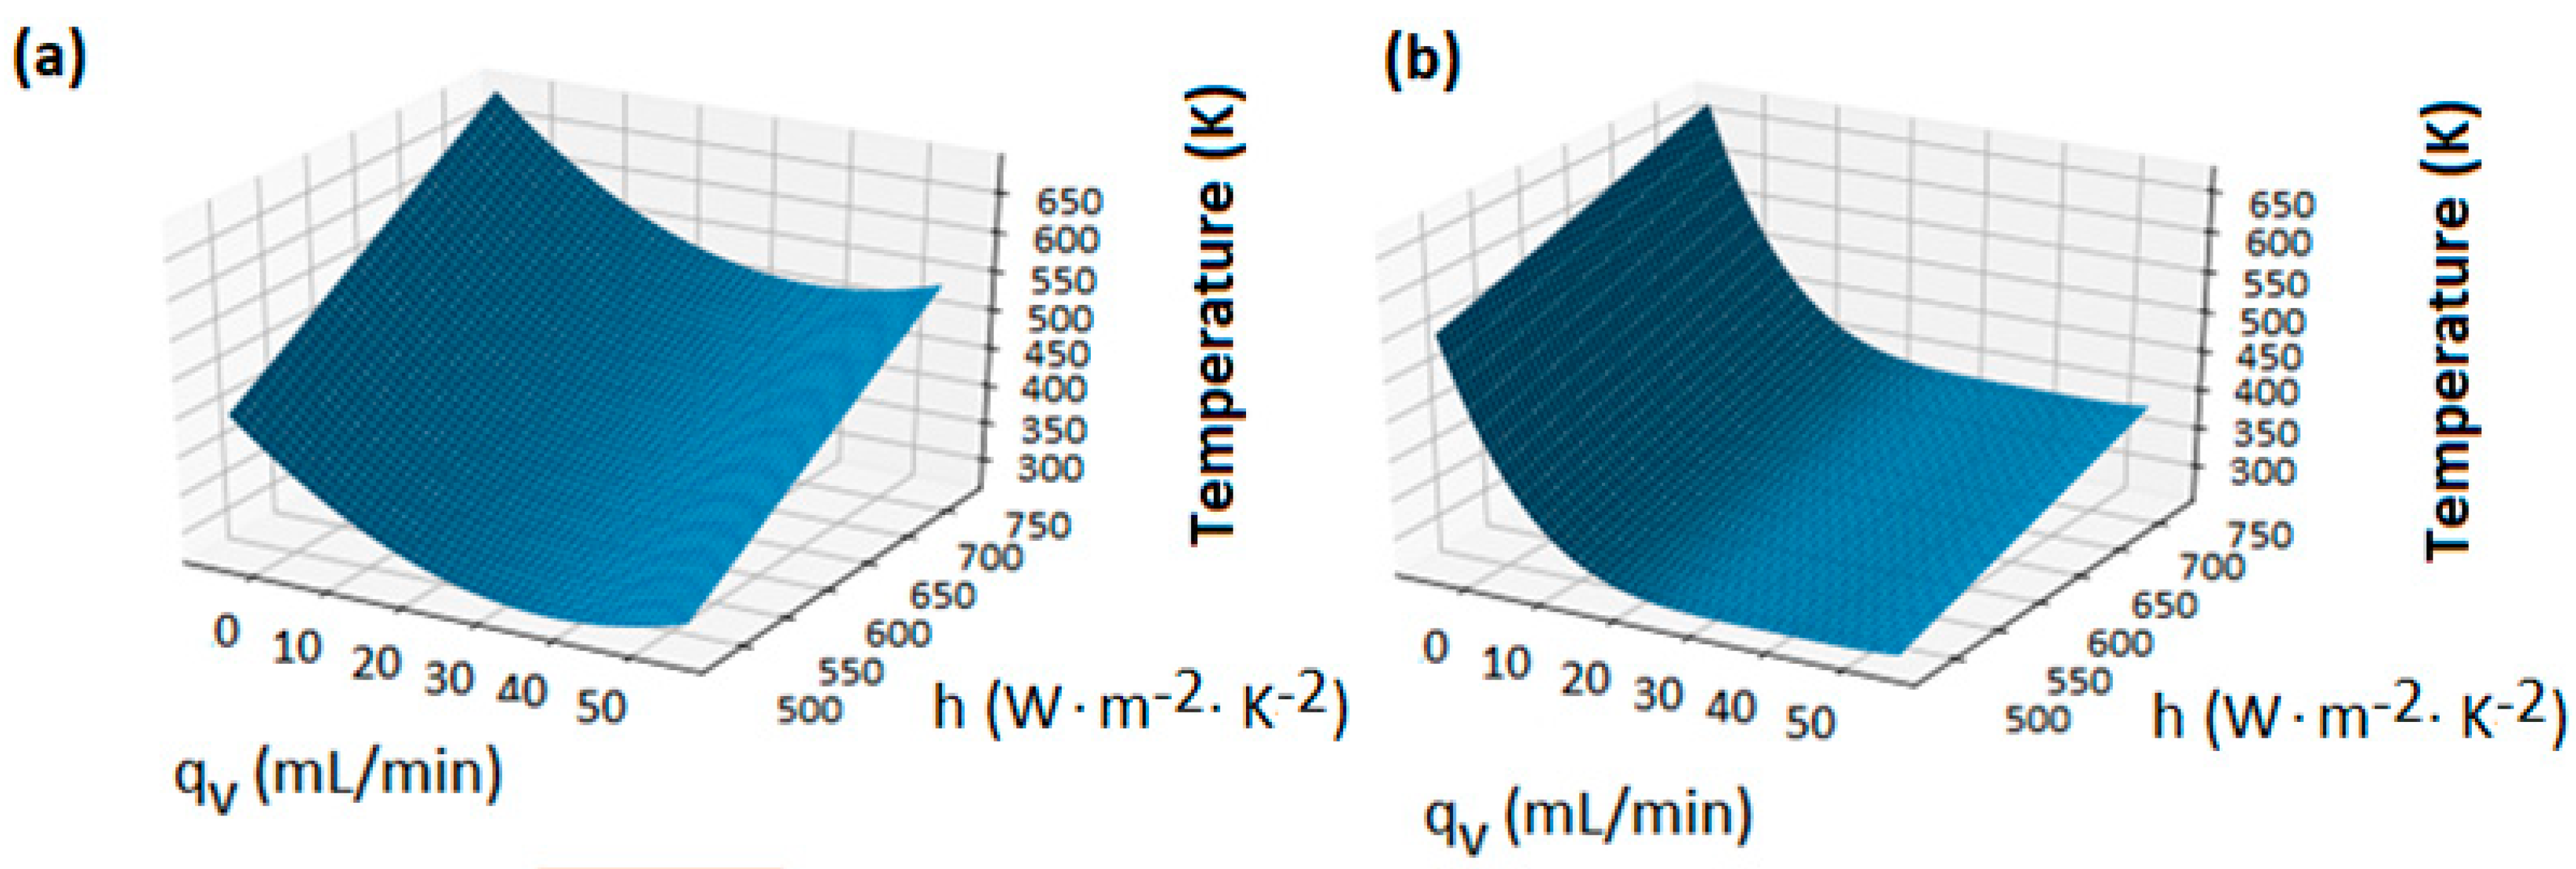
Figure 15 shows the effect of volumetric flow rate and convective heat transfer coefficient on temperature for (a) 3L and (b) 12 L reactor. It can be observed that the convective heat transfer coefficient of the slurry increased from 500 to 750 W⋅m−2⋅K−1 when flow rate increased from 1 to 50 mL/min. While the increase in flow rate inhibited the HTL process, the temperature limited the conversion rate of the biocrude oil. Therefore, it is necessary to guarantee the reaction temperature of sewage slurry in the HTL process. The conversion rate of biocrude can be promoted by enhancing the convective heat transfer within a small range of flow rates. However, with a larger-scale reactor and the same heat transfer coefficient, a significantly lower reactor temperature was obtained at the same heating power per unit of reactor volume.
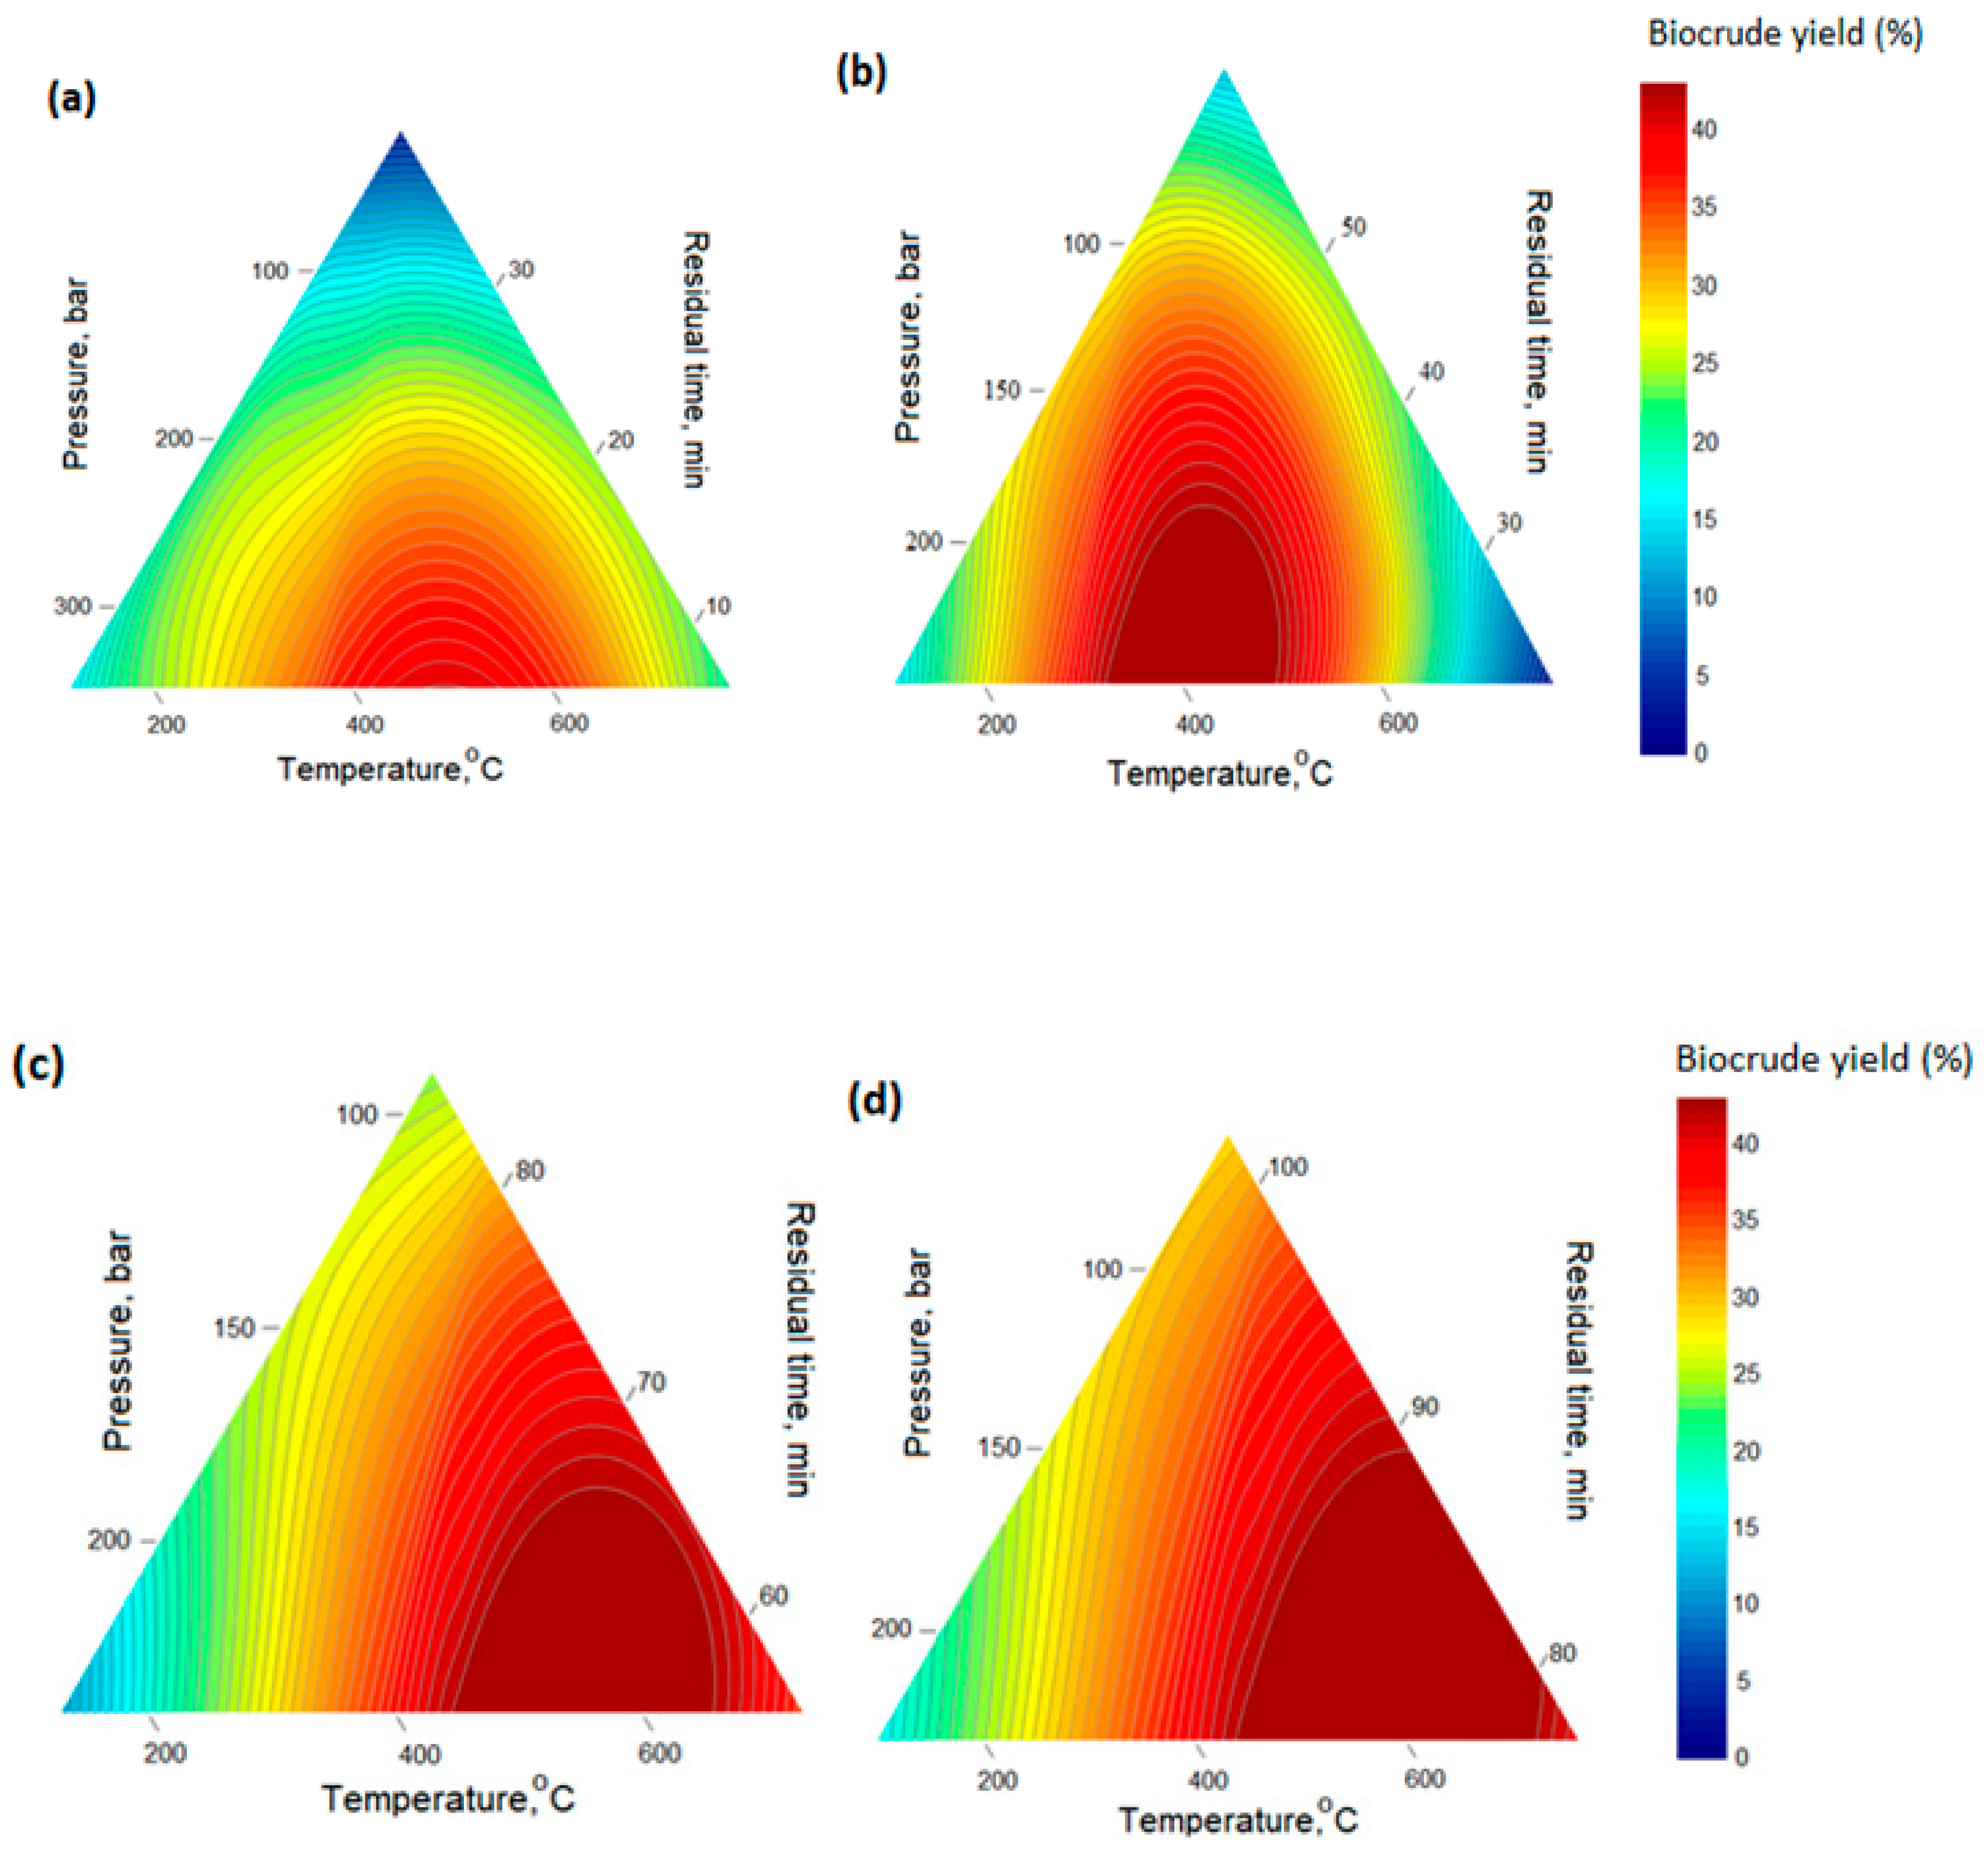
Figure 16 presents a ternary contour diagram showing the correlation between the main process parameters of biomass HTL (i.e., temperature, pressure, and residual time) and the biocrude oil yield. The higher biocrude oil yields are obtained at temperatures, pressures, and residual times between 300 and 350 °C, 24 and 27 MPa, and 80–90 min, respectively. Figure 16a,b show the significant impact of residual time on the process efficiency compared to the impact of temperature and pressure. Increasing pressure to supercritical levels benefits the HTL process by keeping water in its liquid phase and reduces C–C bond fragmentation by increasing the density of the local solvent environment. As the process time increases beyond 90 min, the yield of biocrude oil decreases due to the appearance and promotion of repolymerization reactions, which might boost the yield of unwanted byproducts at the expense of biocrude oil. When the pressure exceeds 250 bar, it favors the formation of gaseous fractions from biomass. Importantly, temperature and pressure act in close connection within the liquefaction process, which is strictly dependent and changes nonlinearly depending on process time. High pressures decrease the biomass degradation rate, thus overcoming the decomposition or depolymerization reactions. Increasing reaction temperature beyond a certain value decreases the biocrude oil yield above 650 °C, thus forming a higher amount of incondensable gas and char phase. At elevated temperatures, the reduction in biocrude oil yield during HTL of sewage sludge is primarily attributed to secondary cracking, repolymerization and condensation reactions, which promote gas formation and char generation, rather than to Boudouard-type gas reactions.

4. Conclusions

This study presents a scale-up analysis of a continuous stirred tank reactor (CSTR) model applied to hydrothermal liquefaction (HTL) of sewage sludge into biocrude oil. A distinctive feature of the developed model is its ability to adaptively scale the HTL reactor according to the desired product distribution. As the production scale of the reactor increases, the mass flow and hydrodynamics of the slurry undergo significant changes which, in turn, influence the efficiency of interactions between reagents, such as biomass and water. Reaction efficiency may decline if hydrodynamics are not optimally adapted to the increased reactor volume. This leads to suboptimal heat and mass transfer within the reactive zones, thereby reducing reaction performance. Moreover, in larger reactors, the interfacial area between the reactive phases changes, promoting condensation of water vapor and absorption of gases into the liquid phase. Hence, the effects of pressure and temperature become increasingly nonlinear, with the potential emergence of dead zones and non-uniform flow patterns. Additionally, localized temperature and concentration gradients intensify, which may adversely affect the selectivity and efficiency of the HTL process. To mitigate dead zones and enhance heat transfer, the dimensions and rotational speed of the impeller must be appropriately matched to the reactor volume. Oscillations and hydrodynamic instabilities may arise due to operational conditions (e.g., pH, temperature, pressure, and slurry concentration). However, these parameters are typically kept constant, as most high-temperature reactors operate within steady-state conditions at low slurry flow rates. In large-scale reactors, effective heat dissipation becomes increasingly challenging, often resulting in localized overheating and the formation of hotspots. The scale-up process is further complicated by amplified oscillations and hydrodynamic fluctuations. Designing more efficient mixing systems, such as multi-stage impellers with optimized geometries and rotational speeds, is therefore essential. The intricate interplay between hydrodynamics, reaction kinetics, and mass and heat transfer represents a critical strand of research for realizing large-scale continuous stirred tank reactors for hydrothermal liquefaction applications. Application of computational fluid dynamics (CFD) simulations enables detailed analysis of multiphase flow and mixing dynamics. Thanks to the employed numerical coupled CFD-DEM (discrete element method) approach, local hydrodynamic parameters were estimated, identifying zones with varying intensities of momentum, heat, and mass exchange within the CSTR during the HTL process. In the future, techno-economic and optimization analyses will be conducted to evaluate economic impacts and further scale up the reactor with minimal energy consumption.

Funding

This article is based upon work supported by the Ministry of Science and Higher Education, Poland (Grant No. 111610125-324).

Data Availability Statement

The original contributions presented in the study are included in the article; further inquiries can be directed to the corresponding author.

Conflicts of Interest

The author declares no conflict of interest.

Nomenclature

v flow velocity (m/s)
ρ l density of fluid phase (kg/m3)
u l liquid velocity (m/s)
p static pressure (Pa)
σ ¯ stress tensor (N/m2)
g gravitational body force (m/s2)
F external force (N)
ρ g gas density (kg/m3)
v g gas velocity (m/s)
R g interphase mass transfer terms for the gas-solid interface reactions
S g second-order stress tensor of the gas
I interaction force representing momentum transfer between gas and solid phase
D e f f effective mass diffusion coefficient (cm2·s−1)
Re p Reynolds number of particles
c p specific heat of biomass particle (J/kg⋅K)
kthermal conductivity coefficient (W/mK)
T p particle temperature (K)
R g interphase mass transfer terms for the gas–solid interface reactions
hheat transfer coefficient (W/m2K).
A p surface area of biomass particles (m2)
Yimass fraction of gas species I
S p i Y i species source term from particle
S Y i species source term from reactions
T temperature (K)
ShSherwood number
e p emissivity
G incident radiation (Wh/m2)
σ Stefan–Boltzmann constant
Q p energy source term
α l void fraction of fluid phase
v l velocity of fluid phase, (m/s)
T v momentum viscous tensor
T R Reynolds tensor
S M momentum of source term
m p mass of biomass particles (kg)
T p particle temperature (K)
Rqimpeller power number (depends on impeller type and dimensions)
v l velocity of fluid phase
T v momentum viscous tensor
S g second-order stress tensor of the gas
I interaction force representing momentum transfer between gas and solid phase
D e f f effective mass diffusion coefficient
Ymass fraction of gas species I
S p i Y i species source term from particle
S Y i species source term from reactions
m p mass of biomass particles
v p velocity of biomass particles
ktheat conductivity due to turbulent transport
c p specific heat of biomass particle
T p particle temperature heat transfer coefficient
A p surface area of biomass particles
e p emissivity
G incident radiation
σ Stefan–Boltzmann constant
Q p energy source term
Greek letters
ε g gas volume fraction
α l void fraction of fluid phase
ε turbulence dissipation rate (m2·s−3)
μ viscosity (Pa·s)
σsurface tension (N/m)
σ t turbulent Prandtl number
Subscript
lliquid phase
mmixture
ssolid phase
tturbulence
jphase j
iphase i

References

  1. Gai, C.; Zhang, Y.; Chen, W.-T.; Zhang, P.; Dong, Y. An investigation of reaction pathways of hydrothermal liquefaction using chlorella pyrenoidosa and Spirulina platensis. Energy Convers. Manag. 2015, 96, 330–339. [Google Scholar] [CrossRef]
  2. Gollakota, A.R.K.; Kishore, N.; Gu, S. A review on hydrothermal liquefaction of biomass. Renew. Sustain. Energy Rev. 2018, 81, 1378–1392. [Google Scholar] [CrossRef]
  3. Jensen, C.U.; Rosendahl, L.A.; Olofsson, G. Impact of nitrogenous alkaline agent on continuous HTL of lignocellulosic biomass and crude bio-oil upgrading. Fuel Process Technol. 2017, 159, 376–385. [Google Scholar] [CrossRef]
  4. Zhang, Y.; Minaret, J.; Yuan, Z.; Dutta, A.; Xu, C. Mild hydrothermal liquefaction of high water content agricultural residue for bio-crude oil production: A parametric study. Energies 2018, 11, 3129–3142. [Google Scholar] [CrossRef]
  5. Dote, Y.; Sawayama, S.; Inoue, S.; Minowa, T.; Yokoyama, S. Recovery of liquid fuel from hydrocarbon- rich microalgae by thermochemical liquefaction. Fuel 1994, 73, 1855–1857. [Google Scholar] [CrossRef]
  6. Ginzburg, B.Z. Liquid fuel (oil) from halophilic algae: A renewable source of nonpolluting energy. Renew. Energy 1993, 3, 249–252. [Google Scholar] [CrossRef]
  7. Miao, X.; Wu, Q. Biodiesel production from heterotrophic microalgal oil. Bioresour. Technol. 2006, 97, 841–846. [Google Scholar] [CrossRef] [PubMed]
  8. Minowa, T.; Yokoyama, S.Y.; Kishimoto, M.; Okakurat, T. Oil production from algal cells of Dunaliellatertiolecta by direct thermochemical liquefaction. Fuel 1995, 74, 1735–1738. [Google Scholar] [CrossRef]
  9. Panahi, H.K.S.; Tabatabaei, M.; Aghbashlo, M.; Dehhaghi, M.; Rehan, M.; Nizami, A.S. Recent updates on the production and upgrading of bio-crude oil from microalgae. Bioresour. Technol. Rep. 2019, 7, 100216. [Google Scholar] [CrossRef]
  10. Elliott, D.C.; Biller, P.; Ross, A.B.; Schmidt, A.J.; Jones, S.B. Hydrothermal liquefaction of biomass: Developments from batch to continuous process. Bioresour. Technol. 2015, 178, 147–156. [Google Scholar] [CrossRef]
  11. Joshi, T.; Parkash, O.; Krishan, G. CFD modeling for slurry flow through a horizontal pipe bend at different Prandtl number. Int. J. Hydrogen Energy 2022, 47, 23731–23750. [Google Scholar] [CrossRef]
  12. Joshi, T.; Parkash, O.; Krishan, G. Numerical Investigation of Slurry Pressure Drop at Different Pipe Roughness in a Straight Pipe Using CFD. Arab. J. Sci. Eng. 2022, 47, 15391–15414. [Google Scholar] [CrossRef]
  13. Biller, P.; Ross, A. Potential yields and properties of oil from the hydrothermal liquefaction of microalgae with different biochemical content. Bioresour. Technol. 2011, 102, 215–225. [Google Scholar] [CrossRef]
  14. Vardon, D.R.; Sharma, B.K.; Blazina, G.V.; Rajagopalan, K.; Strathmann, T.J. Thermochemical conversion of raw and defatted algal biomass via hydrothermal liquefaction and slow pyrolysis. Bioresour. Technol. 2012, 109, 178–187. [Google Scholar] [CrossRef]
  15. Ranganathan, P.; Savithri, S. Computational fluid dynamics simulation of hydrothermal liquefaction of microalgae in a continuous plug-flow reactor. Bioresour. Technol. 2018, 258, 151–157. [Google Scholar] [CrossRef]
  16. Qian, L.; Ni, J.; Xu, Z.; Yu, B.; Wang, S.; Gu, H.; Xiang, D. Biocrude production from hydrothermal liquefaction of Chlorella: Thermodynamic modelling and reactor design. Energies 2021, 14, 6602. [Google Scholar] [CrossRef]
  17. Chu, W.-X.; Tsai, C.-A.; Lee, B.-H.; Cheng, K.-Y.; Wang, C.-C. Experimental investigation on heat transfer enhancement with twisted tape having various V-cut configurations. Appl. Therm. Eng. 2020, 172, 115148. [Google Scholar] [CrossRef]
  18. Campolo, M.; Paglianti, A.; Soldati, A. Fluid dynamic efficiency and scale-up of a retreated blade impeller CSTR. Ind. Eng. Chem. Res. 2002, 41, 164–172. [Google Scholar] [CrossRef]
  19. Campolo, M.; Soldati, A. Appraisal of fluid dynamic efficiency of retreated-blade and turbofoil impellers in industrial-size CSTRs. Ind. Eng. Chem. Res. 2002, 41, 1370–1377. [Google Scholar] [CrossRef]
  20. Wodołażski, A.; Skiba, J.; Zarębska, K.; Polański, J.; Smoliński, A. CFD modeling of the catalyst oil slurry hydrodynamics in a high pressure and temperature as potential for biomass liquefaction. Energies 2020, 13, 5694. [Google Scholar] [CrossRef]
  21. Wodołażski, A. Multiphase numerical CFD simulation of the hydrothermal liquefaction process (HTL) of sewage sludge in a tubular reactor. Appl. Sci. 2024, 14, 4513. [Google Scholar] [CrossRef]
  22. Ross, A.; Biller, P.; Kubacki, M.; Li, H.; Lea-Langton, A.; Jones, J. Hydrothermal processing of microalgae using alkali and organic acids. Fuel 2010, 89, 2234–2243. [Google Scholar] [CrossRef]
  23. Madsen, R.B.; Bernberg, R.Z.K.; Biller, P.; Becker, J.; Iversen, B.B.; Glasius, M. Hydrothermal co-liquefaction of biomasses quantitative analysis of bio-crude and aqueous phase composition. Sustain. Energy Fuels 2017, 1, 789–805. [Google Scholar] [CrossRef]
  24. Biller, P.; Ross, A.B. Hydrothermal processing of algal biomass for the production of biofuels and chemicals. Biofuels 2012, 3, 603–623. [Google Scholar] [CrossRef]
  25. Demirbas, A. Competitive liquid biofuels from biomass. Appl. Energy 2011, 88, 17–28. [Google Scholar] [CrossRef]
  26. Yu, J.; Biller, P.; Mamahkel, A.; Klemmer, M.; Becker, J.; Glasius, M.; Iversen, B.B. Catalytic hydrotreatment of bio-crude produced from the hydrothermal liquefaction of aspen wood: A catalyst screening and parameter optimization study. Sustain. Energy Fuels 2017, 1, 832–841. [Google Scholar] [CrossRef]
  27. Davis, H. Chemistry and stoichiometry of wood liquefaction. Biotechnol. Bioenergy Symp. 1981, 11, 151–170. [Google Scholar]
  28. Jarvis, J.M.; Albrecht, K.O.; Billing, J.M.; Schmidt, A.J.; Hallen, R.T.; Schaub, T.M. Assessment of hydrotreatment for hydrothermal liquefaction biocrudes from sewage sludge, microalgae, and pine feedstocks. Energy Fuels 2018, 32, 8483–8493. [Google Scholar] [CrossRef]
  29. Shi, W.; Liu, C.; Shu, Y.; Feng, C.; Lei, Z.; Zhang, Z. Synergistic effect of rice husk addition on hydrothermal treatment of sewage sludge: Fate and environmental risk of heavy metals. Bioresour. Technol. 2013, 149, 496–502. [Google Scholar] [CrossRef]
  30. Xu, D.; Lin, G.; Liu, L.; Wang, Y.; Jing, Z.; Wang, S. Comprehensive evaluation on product characteristics of fast hydrothermal liquefaction of sewage sludge at different temperatures. Energy 2018, 159, 686–695. [Google Scholar] [CrossRef]
  31. Huang, H.J.; Yuan, X.Z. The migration and transformation behaviors of heavy metals during the hydrothermal treatment of sewage sludge. Bioresour. Technol. 2016, 200, 991–998. [Google Scholar] [CrossRef]
  32. Mathew, M. Scaling up of a Continuous Stirred Tank Reactor for Hydrothermal Liquefaction of Biomass: A Concept Study on Local Mass Transfer Coefficients. 2016. Available online: https://www.researchgate.net/publication/307430186_Scaling_up_of_a_continuous_stirred_tank_reactor_for_hydrothermal_liquefaction_of_biomass_A_concept_study_on_local_mass_transfer_coefficients?channel=doi&linkId=57c5747508ae6db2cc769677&showFulltext=true (accessed on 11 July 2025).
  33. Alba, L.G.; Torri, C.; Fabbri, D.; Kersten, S.R.; Brilman, D.W. Microalgae growth on the aqueous phase from Hydrothermal Liquefaction of the same microalgae. Chem. Eng. J. 2013, 228, 214–223. [Google Scholar] [CrossRef]
  34. Di Lauro, F.; Balsamo, M.; Solimene, R.; Alfieri, M.L.; Manini, P.; Migliaccio, R.; Salatino, P.; Montagnaro, F. Characterization of Biocrude Produced by Hydrothermal Liquefaction of Municipal Sewage Sludge in a 500 mL Batch Reactor. Ind. Eng. Chem. Res. 2024, 63, 955–967. [Google Scholar] [CrossRef]
  35. Balsamo, M.; Di Lauro, F.; Alfieri, M.L.; Manini, P.; Salatino, P.; Montagnaro, F.; Solimene, R. Unravelling the role of biochemical compounds within the hydrothermal liquefaction process of real sludge mixtures. Sustainability 2024, 16, 1770. [Google Scholar] [CrossRef]
  36. Liu, H.; Basar, I.A.; Eskicioglu, C. Hydrothermal liquefaction for sludge-to-energy conversion: An evaluation of biocrude production and management of waste streams. Energy 2023, 281, 128268. [Google Scholar] [CrossRef]
  37. Balsamo, M.; Hejazi, B.; Di Lauro, F.; Marotta, G.; Solimene, R.; Salatino, P.; Montagnaro, F. Kinetic modelling and elemental balances applied to the hydrothermal liquefaction of sewage sludge. Chem. Eng. J. 2025, 505, 158767. [Google Scholar] [CrossRef]
  38. Ma, Y.; Liu, D.; Wang, J.; Zeng, M.; Wang, Q.; Ma, T. Thermal-hydraulic performance and optimization of printed circuit heat exchangers for supercritical fluids: A review. Renew. Sustain. Energy Rev. 2025, 208, 115051. [Google Scholar] [CrossRef]
  39. Sun, Z.; Yao, Q.; Jin, H.; Xu, Y.; Hang, W.; Chen, H.; Li, K.; Shi, L.; Gu, J.; Zhang, Q.; et al. A novel in-situ sensor calibration method for building thermal systems based on virtual samples and autoencoder. Energy 2024, 297, 131314. [Google Scholar] [CrossRef]
  40. Wodołazski, A. Co-simulation of CFD-multiphase population balance coupled model aeration of sludge flocs in stirrer tank bioreactor. Int. J. Multiph. Flow 2020, 123, 103162. [Google Scholar] [CrossRef]
  41. Zhang, L.; Feng, Y.; Guan, H.; Wu, S.; Jia, H. A general drag coefficient model for a spherical particle incorporating rarefaction and particle-to-gas temperature ratio effects. Chem. Eng. Sci. 2024, 298, 120442. [Google Scholar] [CrossRef]
  42. ANSYS. Fluent Theory Guide; Ansys Inc.: Canonsburg, PA, USA, 2015. [Google Scholar]
  43. Launder, B.E.; Spalding, D.B. Lectures in Mathematical Models of Turbulence; Academic Press: London, UK, 1972. [Google Scholar]
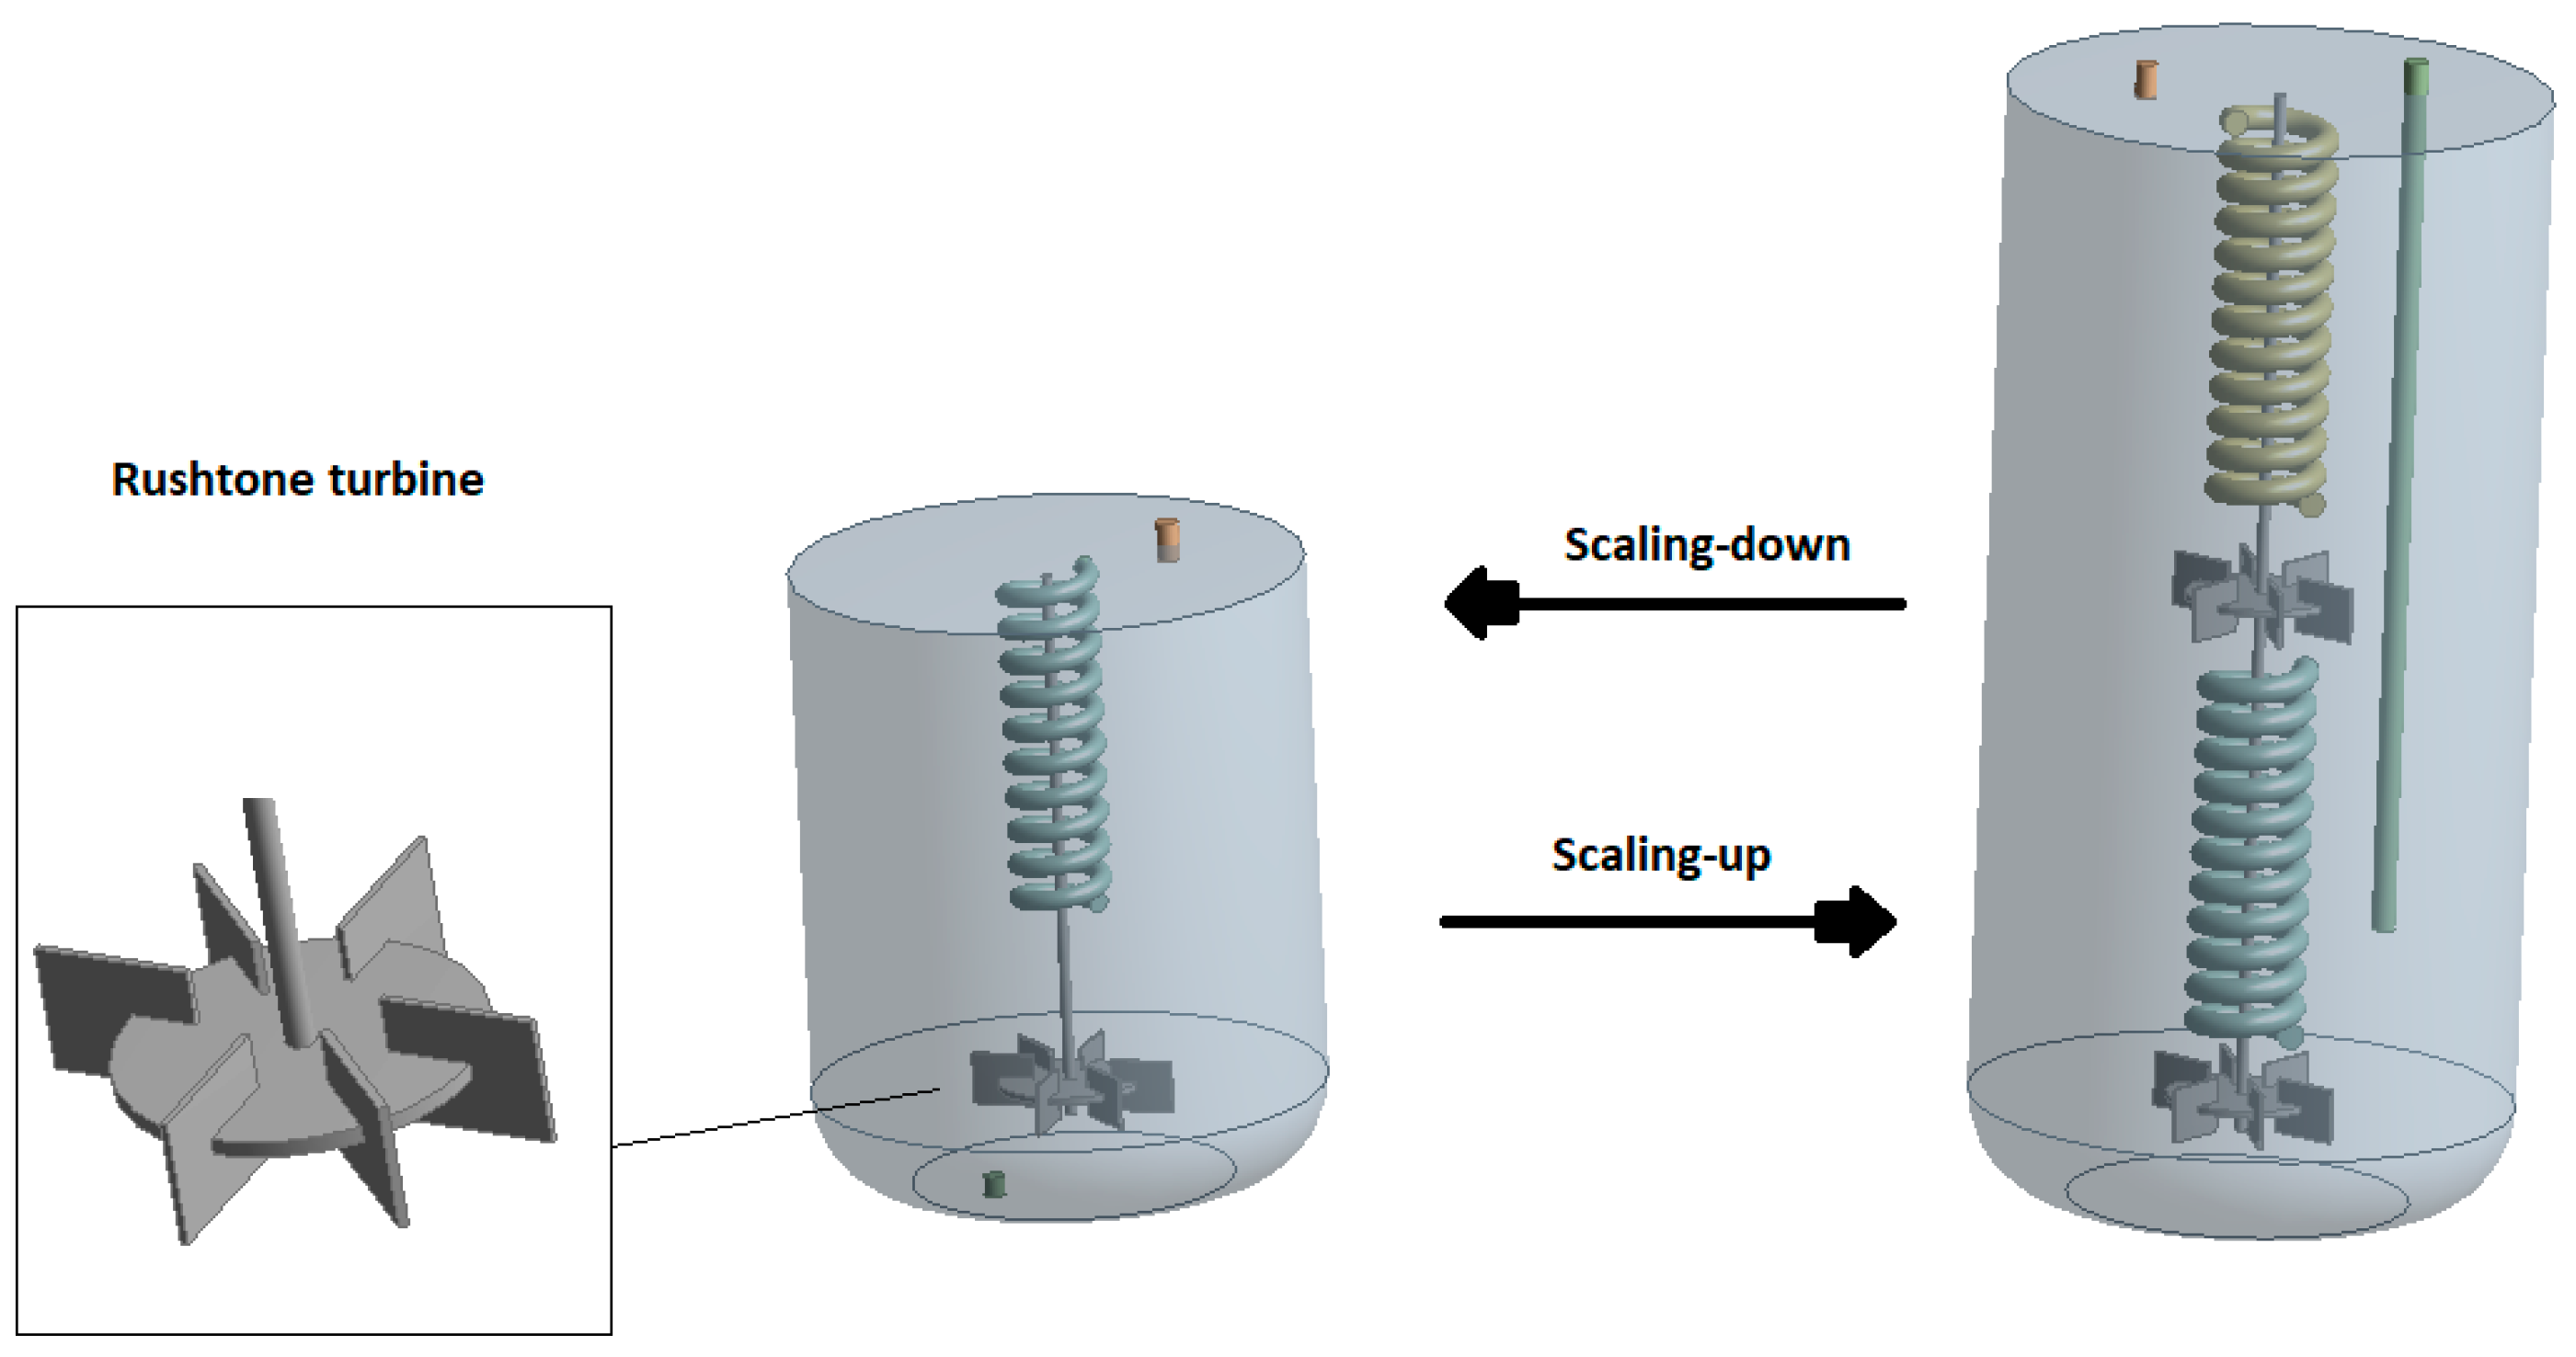
Figure 1. Reaction pathways for hydrothermal liquefaction of sewage sludge [2,21,37].
Energies 18 04557 g001
Figure 2. Schematic diagram of the reactor geometry with a Rushton turbine (RT) impeller and meshing scheme for the scale-up procedure.
Energies 18 04557 g002
Figure 3. Coupling algorithm of CFD-DEM calculations.
Energies 18 04557 g003
Figure 4. Hydrodynamics contours of transient solid–liquid velocity vectors’ distribution with increasing agitator speed (V = 12 L reactor).
Energies 18 04557 g004
Figure 5. Transient state of temperature distribution of reactor heating dynamics for different time intervals for (a) V = 3 L (b) V = 12 L (Tinit = 700 K, Pend =220 bars, N = 194 rpm).
Energies 18 04557 g005
Figure 6. Relationship between the reactor’s inner conditions of increasing temperature and pressure for Parr Autoclave Eng. (reactor volume=1000 mL, agitation rotor speed = 168 rpm, thermal power of heating collars = 500 W, maximum temperature achieved inside the reactor = 529 °C).
Energies 18 04557 g006
Figure 7. Biocrude oil concentration of different time intervals for transient conditions for (a) V = 3 L (b) V = 12 L (T = 658 K, P = 190 bars, N = 200 rpm).
Energies 18 04557 g007
Figure 8. Model-predicted product yields from hydrothermal liquefaction of sewage sludge (16 wt% DM slurry) at 220 bar and temperatures of 300, 350, 400 °C (solids lines), 325 °C (dashed lines) and 350 °C (dotted lines) as a function of reaction time in minutes. (V = 3L, T = 628 K, P = 220 bar, N = 184 rpm).
Energies 18 04557 g008
Figure 9. Effect of flow rate and temperature on biocrude oil yield (%) (a). Effect of flow rate and reactor volume on biocrude oil production rate (g/L−1s−1) (b) (T = 658 K, P = 220 bar, N = 2018 rpm).
Energies 18 04557 g009
Figure 10. Changes in the composition fo individual gas-phase reactants over time for a reactor volume of (a) 3 L and (b) 12 L.
Energies 18 04557 g010
Figure 11. Gas concentration (a) and compositional distribution of the multiphase HTL process (b) for different reactor volumes. (N = 196 rpm, T= 685 K, P = 220 bars).
Energies 18 04557 g011
Figure 12. The instantaneous volume percentage of solid-phase biosource material subjected to a transient-state HTL process at different time intervals of 15, 30, and 60 min (T = 685 K, P = 210 bar, N = 150 rpm, V =3 L).
Energies 18 04557 g012
Figure 13. The effect of mixing stirrer speed and reactor column for different heat transfer coefficients of (a) 400 and (b) 800 W/m·K.
Energies 18 04557 g013
Figure 14. Effect of temperature and pressure on biocrude oil yield during the HTL process in a CSTR reactor of (a) 3 L and (b) 12 L during our scale-up study (N = 186 rpm).
Energies 18 04557 g014
Figure 15. Effect of slurry flow rate and convective heat transfer coefficient on temperature inside a CSTR reactor of (a) 3 L and (b) 12 L during our scale-up study (N = 186 rpm, P = 180–240 bars).
Energies 18 04557 g015
Figure 16. Ternary contour diagram depicting correlations between the main process parameters of biomass HTL (i.e., temperature, pressure, and residual time) and the biocrude oil yield in a CSTR reactor of 3-iter volume with a mixing speed of (a) 120 rpm and (b) 420 rpm and a CSTR of 9-liter volume with a mixing speed of (c) 120 rpm and (d) 420 rpm.
Energies 18 04557 g016
Table 1. Selected grid resolution for independence mesh check.
Scale (Reactor Volume), LTotal Nodes (mln)Total Elements (mln)
30.000528630.00015233
60.006284560.00245768
90.024875360.00981112
120.586435480.08258419
Disclaimer/Publisher’s Note: The statements, opinions and data contained in all publications are solely those of the individual author(s) and contributor(s) and not of MDPI and/or the editor(s). MDPI and/or the editor(s) disclaim responsibility for any injury to people or property resulting from any ideas, methods, instructions or products referred to in the content.