Abstract
When a transformer operates under three-phase unbalanced conditions, the location of the winding hot-spot temperature (HST) is no longer fixed on a certain phase. Taking an S13-M-100 kVA/10 kV transformer as the research object, this paper proposes a streamline inversion method for inverting the winding HST based on the analysis of oil flow morphology. The study employs the finite volume method for coupled calculations of a transformer’s thermal fluid field and combines a support vector regression (SVR) model for the HST inversion. An orthogonal experimental method is used to construct the training and testing sample sets, and the grid search method is utilized to optimize the parameters of the SVR model. In response to variations in hot-spot locations under three-phase unbalanced conditions, representative streamlines are reasonably selected, and a genetic algorithm-based dimensionality reduction optimization is performed on the feature quantities. The research results indicate that the established inversion model exhibits high inversion accuracy under three-phase unbalanced conditions, with a maximum temperature difference of 3.71 K, and the robustness check verifies the stability of the model.
1. Introduction
Accurate acquisition of a transformer’s thermal characteristics is important for ensuring safe operation [,]. The existing methods for collecting the transformer’s hot-spot temperature (HST) include the measurement method and calculation methods. The measurement method is mainly based on fiber optic temperature sensors. Optical fiber sensing technology emerged in the 1970s and 1980s and took advantage of electromagnetic interference immunity and high measurement accuracy; it is now widely used for measuring the temperature of transformer windings [,]. However, for transformers in actual operation, using optical fiber sensors implanted into the transformer may cause consequences such as transformer oil leakage and water ingress and accumulation in the oil steel tank in humid environments.
As for the indirect calculation methods, IEEE Standard C57.91-2011 and IEC 60076-7 standards provide empirical formulas for calculating transformer winding hot-spot temperatures [,]. O. A. Amoda et al. improved the IEEE recommended empirical formula by considering the changes in top oil temperature, and verified the effectiveness of the improved algorithm by combining operating data from two 28 MVA-capacity transformers []. Z. D. Wang et al. analyzed the operational data of 35 retired transformers and revised the hot-spot coefficient value adopted in the recommended empirical formula of the IEC 60076-7 standard [].
In 2001, G. Swift et al. analogized thermoelectrics and used the thermal circuit model method for the first time to calculate the transformer HST []. In order to consider the nonlinearity of thermal parameters during the transient temperature rise process of transformers, corresponding improvements need to be made to the thermal circuit model. Z. R. Radakovic et al. proposed a thermal circuit model for oil-immersed transformers and pointed out that thermal parameters in the model can be calculated from transformer temperature rise test data []. D. Susa et al. further analyzed the influence of winding structures, while considering the nonlinear effects of thermal resistance and heat capacity on the circuit model calculation accuracy [].
Artificial intelligence algorithms have been used to construct an HST calculation model based on the collected transformer operational data. The artificial intelligence algorithm directly considers factors such as the transformer type, the unevenness of material parameters, and complex environmental conditions. After the model is established, it can be directly used for calculating the hot-spot temperature of transformer windings [,]. The establishment of the calculation model relies on a large amount of transformer test data or on-site operational data, and the input feature quantities of the model are selected based on experience lack effective physical basis, which limits the application of intelligence algorithms. The combination of transformer multiphysics field analysis methods and artificial intelligence algorithms provides a new method for effectively detecting transformer HSTs. The transformer multiphysics field simulation analysis method can analyze the transformer thermal characteristics, thereby providing support for more effective acquisition of steel tank temperature measurement points. In addition, the digital simulation analysis method can be used to construct the training samples required for the establishment of artificial intelligence algorithm models, which can eliminate or reduce the dependence on experimental and operational data in establishing transformer hot-spot temperature detection models.
Due to uneven user loads, there is a high probability that 10 kV distribution transformers will be in a three-phase unbalanced working state. Under three-phase unbalanced operation, the hot-spot position is no longer fixed on a certain phase, but moves among the three phases along with the imbalance of the three-phase load [,,]. Due to the continuous changes in the hot-spot position of the winding under unbalanced load conditions, the winding temperature rise characteristics under three-phase unbalanced conditions can be analyzed through multiphysics field simulation analysis. This article constructs training samples through transformer thermal fluid field coupling calculation and combines a support vector regression model to establish a winding hot-spot temperature inversion model of an S13-M-100 kVA/10 kV distribution transformer, considering three-phase unbalanced operation conditions. A feature optimization algorithm is proposed to improve the HST inversion model. The high degree of coincidence between the HST inversion results and experimental or computational results verifies the effectiveness and accuracy of this algorithm.
2. Oil-Immersed Transformer Thermal Fluid Field Calculation
The research transformer selected in this paper is an S13-M-100 kVA/10 kV three-phase transformer with a no-load loss of 149.2 W and a load loss of 1517.3 W. The transformer structure is shown in Figure 1.
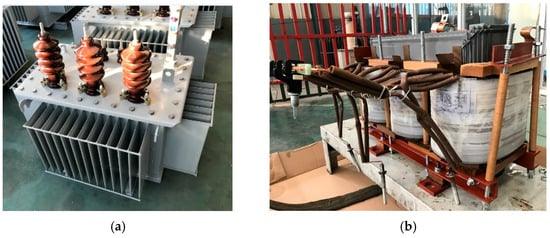
Figure 1.
Internal and external structure of transformer. (a) External structure, (b) internal structure.
2.1. Transformer Thermal Fluid Field Numerical Calculation Method
- (1)
- Control equation of thermal fluid field
For oil-immersed transformers, the thermal fluid field coupling control equation is as follows [,,]:
The mass conservation equation is
In the formula, ∇ is the Hamiltonian operator; t is the time quantity, s; ρ is the oil density, kg/m3; v represents the oil velocity vector, m/s.
The equation of conservation of momentum is
In the formula, p is the oil pressure, Pa; f represents the external force per unit volume, N/m3; is the fluid dynamic viscosity, kg/(m·s).
The energy conservation equation is
In the formula, T represents the temperature, K; c is the specific heat capacity of the oil, J/(kg·K); k is the thermal conductivity of the oil fluid, W/(m·K); Φ is the heat source within the fluid, W/m3; Sh is the part where the mechanical energy of the fluid converted into thermal energy with the influence of fluid viscous force, W/m3.
In this paper, the finite volume method was used to solve the above control equation and obtain the temperature field and fluid field distributions within the transformer [,].
- (2)
- Boundary condition
By simplifying the transformer steel tank and radiator shell into a smooth plane, the transformer steel tank heat dissipation process can be considered as the convection heat transfer of the longitudinal plate []. The feature correlation formula when longituding the plate is shown as Equation (4).
In the formula, Nu represents the Nusselt Number, Re represents the Reynolds Number, Pr represents the Prandtl parameter; V represents the mainstream velocity of the air, m/s; L is the characteristic size, m; μair is the viscosity coefficient of the air, kg/(m·s); cair is the specific heat capacity of the air, J/(kg·K); kair is the thermal conductivity of the air, W/(m·K).
After obtaining the Nu, substituting it into Equation (5), the transformer under windy conditions can be obtained:
In the formula, h is the transformer steel tank heat transfer coefficient, W/(m2·K). According to Formulas (4) and (5), the influence of different environmental wind speeds on the transformer heat dissipation process can be expressed by applying the corresponding heat transfer coefficients on the steel tank.
2.2. Simulation Results
As shown in Figure 2, under rated load and an ambient temperature of 7.5 °C, the winding’s hottest spot occurs at the inner winding of phase B, with an HST of 74.4 °C and a temperature rise of 66.9 K. The hottest point on the steel tank is located at the top corner at about two-thirds of the height of the side wall, with a temperature of approximately 46.5 K.
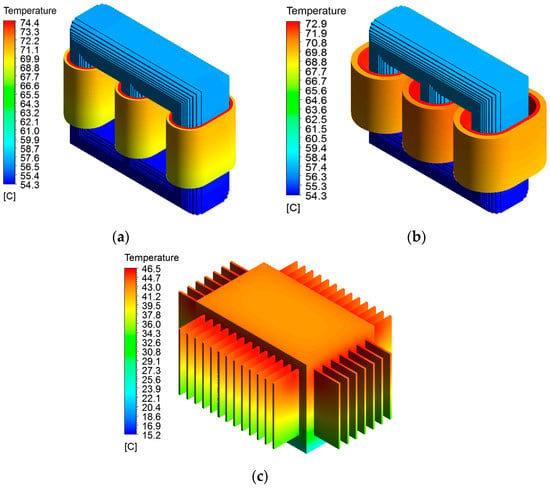
Figure 2.
Transformer temperature distribution. (a) Low-voltage (LV) windings and iron core, (b) high-voltage (HV) windings and iron core, (c) steel tank.
2.3. Comparison with Transformer Rise Test Results
- (1)
- Temperature rise test
The short-circuit temperature rise test method was conducted to accomplish the test []. During the test, the Z-Temp-GT-6000optical fiber temperature sensors (manufactured by Zero Optoelectronics Technology Co., Ltd. in Hefei, China), were used to measure the winding temperature. There are 6 optical fiber measurement points arranged in the oil channel of the transformer three-phase winding. The specific installation positions of the six optical fibers are shown in Figure 3 and Table 1, and the schematic diagram of the on-site installation of the optical fiber is shown in Figure 4.
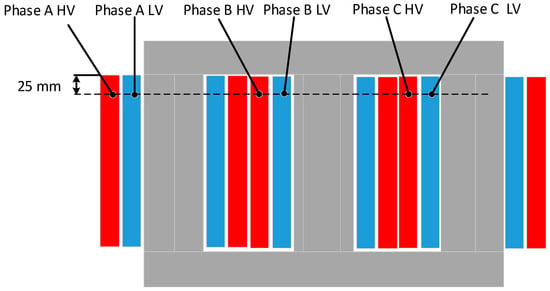
Figure 3.
Schematic diagram of fiber optic temperature sensors installation.

Table 1.
Optical fiber temperature measurement point layout.
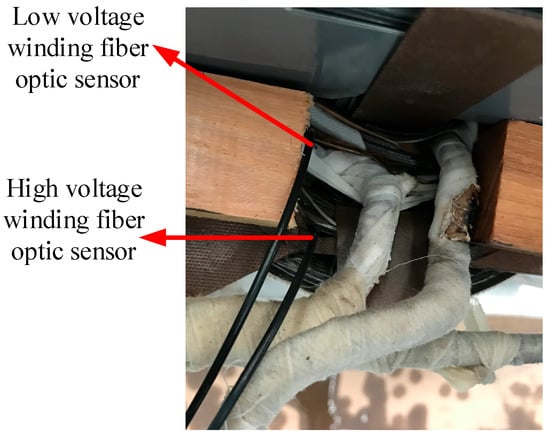
Figure 4.
Schematic diagram of optical fiber temperature sensor layout.
During the test, the temperature change of the steel tank was measured using the thermal resistor temperature sensors. Transformer outer steel tank temperature sensors were arranged at the top center and the bottom of the transformer’s outer steel tank.
- (2)
- Comparison with temperature rise test results
When the ambient temperature is 7.5 °C, under rated load, the transformer temperature rise test values and calculated results are shown in Table 2.

Table 2.
Temperature rise simulation and experimental values.
From the table below, it can be seen that the maximum temperature difference between the simulation results and the experimental results is not more than 3 K, which verifies the accuracy of the transformer temperature fluid field simulation model established in this paper.
3. Application of Support Vector Regression Machine in Winding HST Inversion
Due to the fact that the winding HST is located inside the transformer and is difficult to measure directly, we monitored the temperature that are more easily obtained on the transformer steel tank. These temperature measurement points and load rates were used as input variables, and then a winding hot-spot temperature inversion model was constructed by building the relationship between these input variables and the HST.
As the support vector regression (SVR) machine has good fitting characteristics, this paper uses the SVR model to construct the strong nonlinear relationship between these input feature quantities and winding HST.
3.1. Principles of SVR Model
The SVR model uses support vectors to construct the optimal hyperplane, making the obtained data closest to this plane []. The principles of the SVR model can be expressed as follows:
For a set of datasets, (xi, yi), i = 1,2, …, N, xi∈ RN, yi ∈ R. A hyperplane function f(x) can be defined as f(x) = ω·x + b, ω ∈ RN, b ∈ R.
In the above equation, ɛ represents the insensitive loss coefficient, and xi and yi are the input and output values, respectively.
For any set of data (xi, yi), the distance di to f(x) is as follows:
Therefore, solving the function f(x) can be transformed into the following optimal problem:
The dual problem of the above optimal problem is as follows:
where K(xi, xj) = φ(xi)Tφ(xj) represents the kernel function, C represents the penalty coefficient, and αi and αi* are the Lagrangian multipliers.
In this paper, the radial basis function (RBF) kernel function is selected:
where γ represents the kernel function parameter.
Through the construction process of the SVR model, it can be determined that the penalty coefficient C and the kernel parameter γ are important model parameters, and their optimal parameters need to be obtained.
3.2. Parameter Optimization Method
Cross validation (CV) is a statistical analysis method used to verify the performance of SVR. The basic idea is to group the input training sample data, with some groups as the training set and the remaining as the validation set. The internal validation of the SVR model’s performance constructed from the training sample dataset is used to evaluate the learning ability of the model. K-fold Cross Validation (K-CV) is the process of dividing raw data into K groups (usually evenly distributed), making each subset a validation set, and using the remaining K-1 subset data as the training set to obtain K cross validation models. Therefore, we chose the grid search method under K-fold cross validation as the parameter optimization method, and the number of folds selected is 4.
The grid search (GS) algorithm is a kind of exhaustive optimal parameters search method. The possible values of the penalty coefficient C and the kernel parameter γ of the SVR model are arranged and combined, and all the possible combinations are listed to generate a “grid”. Comparing the regression effects of the SVR model under each combination of C and γ parameters, we took the parameter group corresponding to the best regression effect as the optimal C and γ of the model.
3.3. Error Analysis Method
In order to analyze the inversion effect of the transformer winding’s hot-spot temperature, this article adopts the following error indicators for the inversion result error analysis:
- (1)
- Mean Absolute Deviation (eMAD)
- (2)
- Mean Absolute Percentage Error (eMAPE)
- (3)
- Mean Square Percentage Error (eMSPE)
- (4)
- Mean Square Error (eMSE)
In the formulas, Ai represents the actual value of the i-th test samples, and Pi is the inversion value; M represent the number of the samples. The four error indicators, eMAD, eMAPE, eMSPE, and eMSE, are used to evaluate the inversion effect of the model.
4. Inversion of Transformer Winding HST Under Three-Phase Unbalanced Conditions
4.1. HST Inversion Method Under Three-Phase Imbalance
When a distribution transformer is in three-phase working load unbalanced operation, the hot-spot position is no longer fixed on the winding of a certain phase, but moves among the three phases along with the imbalance of the three-phase load. To observe the hot-spot positions when the three-phase load balance degrees are different, a transformer thermal fluid simulation model under three-phase imbalance was established. When the ambient temperature is fixed at 7.5 °C, and the A-phase winding is loaded with 1.1 to 1.3 times the load currents of the other two phases, the obtained winding temperatures are shown in Table 3.

Table 3.
Winding HST change under different load rates (°C).
Table 3 shows that when the transformer in three-phase equilibrium, hot spots are located in the B-phase winding. When the transformer is in a three-phase unbalanced state, the HST is located in the phase with the highest load rate.
When the transformer is in a three-phase unbalanced state, the inner oil flow streamlines will change under the variation of the hot spot. At this time, a single streamline can no longer establish the correlation between the winding HST and steel tank temperatures under different load conditions. Instead, for different phases that are hot spots, representative streamlines need to be selected, and the corresponding temperature measurement points at the transformer steel tank need to be extracted, thereby establishing the winding hot-spot–steel tank temperature measurement points mapping model.
Therefore, the realization of winding HST inversion under three-phase load unbalanced conditions, based on transformer oil flow streamline analysis and the SVR model, is presented as shown in Figure 5.
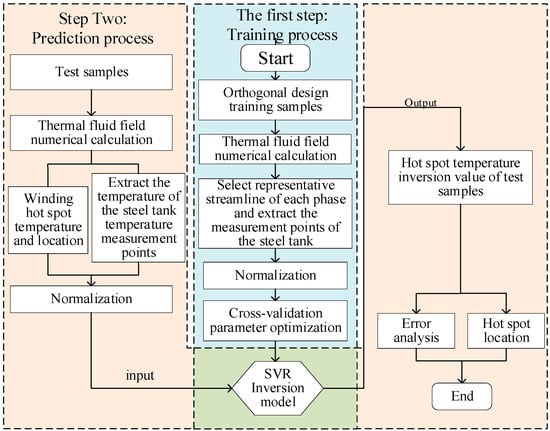
Figure 5.
Flowchart of the transformer HST inversion method under three-phase imbalance.
4.2. Training and Testing Sample Construction
Due to the randomness of the loss at the user load side, the winding hot spot of the distribution transformer may occur in any winding phase. In order to accurately invert the hot-spot temperature, an orthogonal table of 5 factors and 4 levels was designed as shown in Table 4, which can be used to construct the training samples required for HST inversion. The obtained orthogonal training samples are shown in Table 5.

Table 4.
Orthogonal table of 5 factors and 4 levels.

Table 5.
Training samples.
The established inversion model test samples are shown in Table 6. The test samples considered the effects of different three-phase loads, ambient temperatures, and wind speeds.

Table 6.
Test samples.
Based on the established transformer thermal fluid field simulation model, the various working conditions of the training samples and test samples can be efficiently calculated.
4.3. Selection of Oil Flow Streamline
When the three-phase winding HST occurs in phase A, phase B, or phase C, the oil flow pattern near the three-phase windings will change due to the variation in the position of the hot spots. As shown in Figure 6, a cross-section in the middle of the transformer is set, and Figure 7 shows the transformer internal oil flow velocity distribution under rated load and three-phase balance, as well as the oil flow velocity distribution under a certain phase load alone, which increases to 1.1 times the rated load.
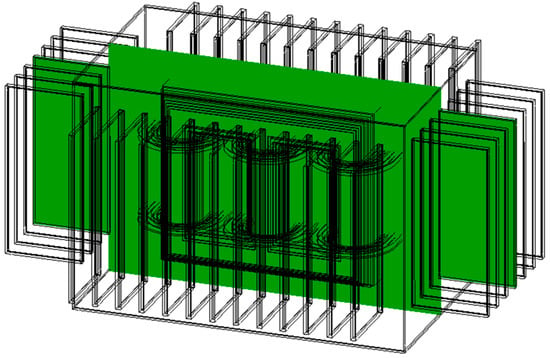
Figure 6.
Cross-section in the middle of transformer winding.
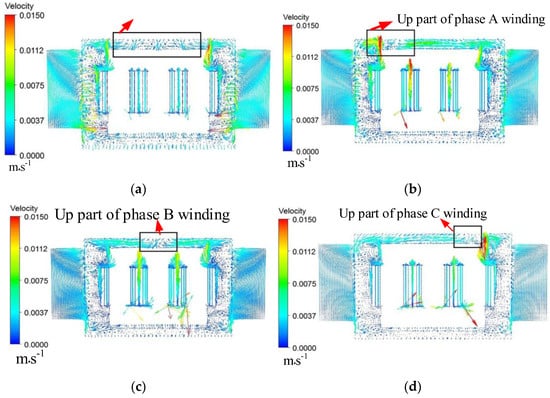
Figure 7.
The transformer internal oil flow velocity distribution. (a) Rated load and three-phase balance, (b) phase A load increases to 1.1 times the rated load, (c) phase B load increases to 1.1 times the rated load, (d) phase C load increases to 1.1 times the rated load.
When the three-phase load of the transformer is balanced, the hot oil surges from the windings to the top layer of the transformer and then flows uniformly to all directions of the transformer. When the load current of phase A is the largest, the hot oil mainly concentrates above the winding of phase A and then flows towards the other two phases. Therefore, when the phase A load current is larger, the main oil flow streamline near the winding of phase A should be selected as the representative streamline. When the load current of phase B is greater, the hot oil mainly concentrates directly above the winding of phase B and then flows towards the other two phases. At this time, the shortest path for the oil to pass through the winding’s hot spot is the main streamline near the winding of phase B. Similarly, when the load current of phase C is greater, the main streamline near the winding of phase C is also selected as the representative flow line.
Based on the above analysis and observing the oil flow trends flowing near the hot spot under different loading conditions, representative streamlines were screened out, as shown in Figure 8.
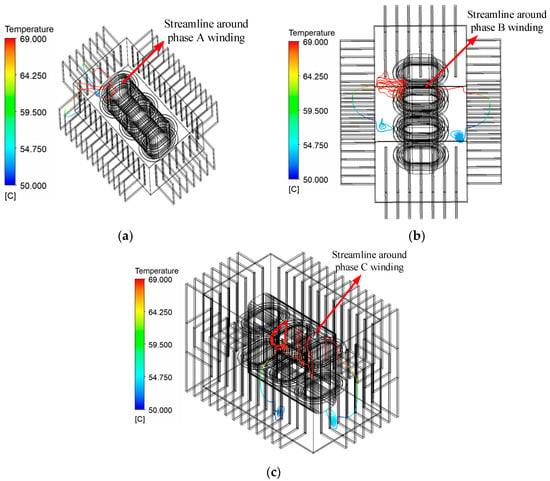
Figure 8.
Representative streamlines flowing through each phase winding. (a) The representative streamline when the hot spot is located in the phase A winding, (b) the representative streamline when the hot spot is located in the phase B winding, (c) the representative streamline when the hot spot is located in the phase C winding.
As shown in Figure 8, according to the different conditions of the hot-spot positions, two representative streamlines flowing through each phase winding were selected, and six streamlines were used to perform combined inversion of the transformer hot-spot temperature under unbalanced working conditions. According to the temperature distribution on the selected six mainstream line clusters, the two points with the largest temperature difference on each streamline were screened out, and the corresponding steel tank temperature measurement points for them were respectively located.
Taking the typical streamline flowing through phase C as an example, two streamlines were selected. Based on the highest and lowest temperature points on each streamline, the corresponding points on the outer shell were selected as characteristic temperature measurement points. Each streamline point corresponds to two outer shell temperature measurement points. Therefore, the eight characteristic temperature measurement points that can be directly measured on the outer shell are shown in Figure 9. Considering phases A and B, a total of 24 temperature measurement points on the steel tank were selected.
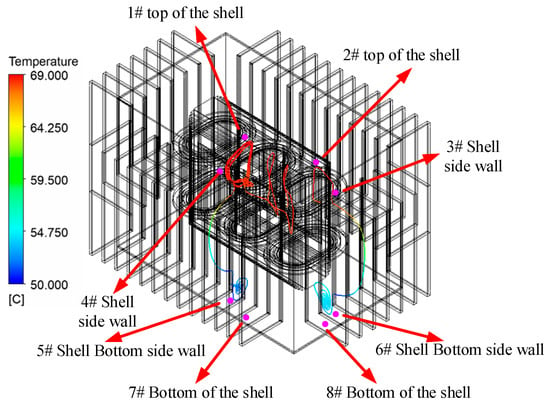
Figure 9.
Shell characteristic temperature measurement point selection based on oil flow streamline.
4.4. HST Inversion Results
According to the selected mainstream line, a total of 24 transformer steel tank temperature measurement points were successively arranged to apply the winding hot-spot temperature inversion when the three phases are unbalanced. Also, the maximum load rate of the three-phase winding was selected as the input feature quantity, and the 24 selected steel tank temperature measurement points were added; a total of 25 feature quantities were input into SVR for HST inversion model training.
The parameters of the SVR model were optimized by the grid search method. The optimization interval of the penalty coefficient C was set as [23, 217], and the optimization interval of the kernel function parameter γ was [2−20, 2−10]. The corresponding hot-spot locations (HSLs) of the HSTs are shown in Table 7, and the error indicators of the inversion results are shown in Table 8.

Table 7.
The inversion results of the test samples.

Table 8.
The inversion error using GS-SVR.
Table 7 and Table 8 show that the maximum temperature difference of 20 groups of test samples is 3.71 K, and the mean absolute percentage error is 1.35%, which indicates the effectiveness of the inversion model.
However, due to the fact that there are as many as 24 steel tank temperature measurement points for the hot-spot temperature of the winding under three-phase imbalance, the inversion model is difficult to apply in practice. Therefore, an appropriate dimensionality reduction method should be used to reduce the number of input temperature measurement points.
4.5. Dimensionality Reduction of Input Feature Quantities Based on Genetic Algorithm
Genetic algorithms emulate the principles of natural selection and genetics, including replication, crossover, and mutation. Beginning with an arbitrary starting population, these algorithms apply genetic operators to produce individuals exhibiting greater environmental fitness. This process drives the population toward progressively improved regions within the search space. Through repeated evolutionary iterations, the algorithm converges on a group of optimally adapted individuals, yielding the problem’s optimal solution. Figure 10 illustrates the dimensionality reduction procedure for inversion model input features utilizing this genetic algorithm approach.
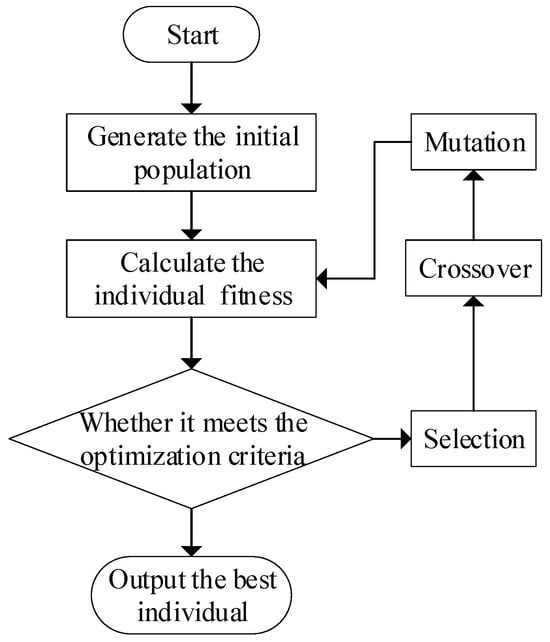
Figure 10.
Genetic algorithm dimensionality reduction process.
4.6. HST Inversion Results After Feature Dimension Reduction
Setting the initial population to 20, we randomly encoded the 25-dimensional feature quantities to obtain the feature quantity set of the initial population. Then, cross-mutation operations were carried out on the chromosomal fund of the initial population to obtain better offspring. We set the evolution algebra to 100 and used the genetic algorithm to optimize the 25-dimensional feature quantity.
In genetic algorithms, the reciprocal of the mean square error (eMSE) of the training samples is selected as the fitness function; the evolution curve of the fitness function of the training samples is shown in Figure 11. With increased evolutionary algebra, the fitness function of the offspring gradually approaches stability; at the end of the iteration, the 25-dimensional feature quantity drops to 8 dimensions. The winding HST inversion results of test samples obtained before and after dimensionality reduction are shown in Table 9.
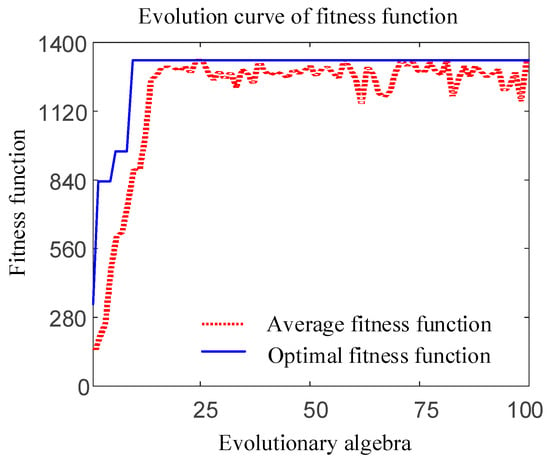
Figure 11.
The genetic algorithm fitness function.

Table 9.
Inversion values of hot-spot temperatures of 10 kV oil-immersed transformers before and after dimension reduction based on genetic algorithm.
The distribution of the optimized seven transformer steel tank temperature measurement points after dimensionality reduction is shown in Figure 12.
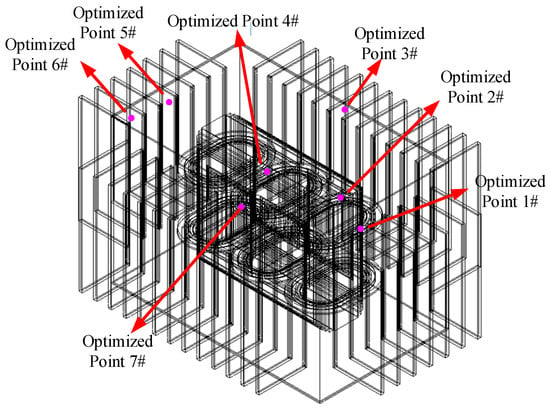
Figure 12.
Optimized 7 steel tank feature temperature measurement points.
Before and after using the genetic algorithm for dimensionality reduction, the error indicators of the inversion model for the HST of test samples are shown in Table 10.

Table 10.
The model error index after dimension reduction.
As shown in Table 9 and Table 10, after the inversion model input features dimensionality reduction, the mean square error (eMSE) of the SVR model decreases from 1.58 × 10⁻³ to 8.07 × 10⁻⁴, indicating that the learning ability of the model after dimension reduction improved. After dimension reduction, the number of temperature measurement points laid on the transformer outer steel tank decreased from 24 to 7, and the input feature quantity required for the inversion model changed from 25 dimensions to 8 dimensions. The efficiency and operability of inversion detection can be greatly improved.
4.7. Robustness Verification
In actual measurements, perturbation of system characteristics or parameters is often inevitable. The robustness verification is introduced to verify the anti-interference ability of the HST inversion model in practical applications.
As shown in Figure 13, in order to test the robustness of the mapping relationship between the reduced 8-dimensional feature quantities and winding HST, a set of Gaussian white noise with a mean of 0 and a variance of 0.5 was randomly added to the temperature feature quantities of the test samples to simulate the actual temperature measurement errors that may be caused.
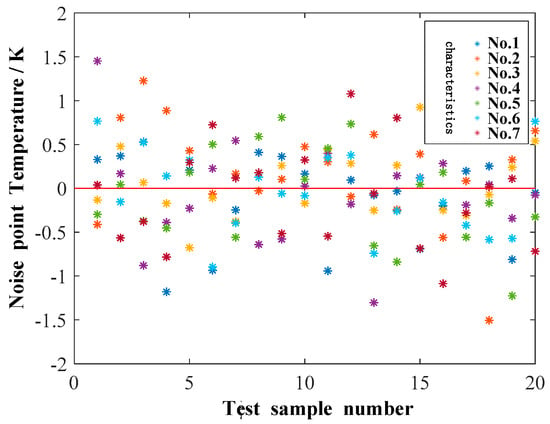
Figure 13.
Randomly set Gaussian white noise in temperature measuring points.
The test samples with added noise were placed into the SVR model that had been trained by the training samples for testing. The HST inversion values after adding noise are shown in Table 11. The maximum change in the inversion value of the sample before and after the addition of noise is 1.97 K, and the minimum change is 0.05 K. The maximum HST inversion difference of the test samples after adding noise is 3.64 K. This performance indicates that the model proposed is less affected by noise interference and has a good system robustness.

Table 11.
The inversion values of the hot-spot temperatures before and after adding noise.
5. Conclusions
This paper established a transformer HST inversion model under three-phase load unbalanced conditions, and the main research conclusions are as follows:
- (1)
- In response to the occurrence of HSTs in phases A, B, and C, representative streamlines flowing through the winding area and the steel tank area were selected. Based on the trajectory of the streamlines, the temperature measurement points of the transformer steel tank were chosen. A three-phase unbalanced transformer winding HST inversion model was established, and HSTs of 20 test samples were inverted. The maximum temperature difference of the HST inversion values was 3.71 K, which verified the effectiveness of the inversion model.
- (2)
- The genetic algorithm was applied to reduce the dimensionality of the input feature quantities of the inversion model, the number of temperature measurement points laid on the transformer steel tank was reduced from 24 to 7, and the required input feature quantities of the inversion model were reduced from 25 to 8, which improved the monitoring efficiency of the inversion model for winding HST and the operability in practical applications.
- (3)
- The robustness of the inversion model in this paper was tested by adding random Gaussian white noise to the test samples. The test samples’ maximum HST inversion difference after adding noise was 3.64 K, indicating that the winding HST inversion model established in this paper has a strong robustness.
The inversion model established in this article is based on the accurate simulation model of a transformer’s thermal fluid field. After establishing a high-precision thermal fluid field simulation for large transformers, the research method in this article can also be applied to the inversion model of winding HSTs in large transformers.
Author Contributions
Conceptualization, M.X. and J.R.; methodology, B.S.; software, N.Z. and W.W.; validation and formal analysis, X.D.; validation and investigation, Y.L. All authors have read and agreed to the published version of the manuscript.
Funding
This research was supported the Science and Technology project of Henan Power Grid Company under Grant 52170224001Q.
Data Availability Statement
The data that support the findings of this study are available from the corresponding author, upon reasonable request.
Conflicts of Interest
Author Mingming Xu, Bowen Shang, Ning Zhou, Wei Wang, Xuan Dong and Yunbo Li were employed by the Electric Power Research Institute of State Grid Henan Electric Power Company. The remaining authors declare that the research was conducted in the absence of any commercial or financial relationships that could be construed as a potential conflict of interest.
References
- Rommel, D.; Di Maio, D.; Tinga, T. Transformer hot spot temperature prediction based on basic operator information. Int. J. Electr. Power Energy Syst. 2021, 124, 106340. [Google Scholar] [CrossRef]
- Daminov, I.; Prokhorov, A.; Caire, R. Assessment of dynamic transformer rating, considering current and temperature limitations. Int. J. Electr. Power. Energy. Syst. 2021, 129, 106886. [Google Scholar] [CrossRef]
- Saravolac, M.P. The use of optic fibres for temperature monitoring in power transformers. In Proceedings of the IEE Colloquium on Condition Monitoring and Remanent Life Assessment in Power Transformers, London, UK, 22 March 1994; pp. 1–7. [Google Scholar]
- Tian, T.; Zhou, X.; Wang, S.; Luo, Y.; Li, X.; He, N.; Ma, Y.; Liu, W.; Shi, R.; Ma, G. A π-Phase-Shifted Fiber Bragg Grating Partial Discharge Sensor toward Power Transformers. Energies 2022, 15, 5849. [Google Scholar] [CrossRef]
- IEC 60076-7:2005; Power Transformers—Part 7: Loading Guide for Oil-Immersed Power Transformers. IEC: Geneva, Switzerland, 2005.
- IEEE Std C57.91-2011; IEEE Guide for Loading Mineral-Oil-Immersed Transformers and Step-Voltage Regulators. IEEE: Piscataway, NJ, USA, 2011.
- Amoda, O.A.; Tylavsky, D.J.; McCulla, G.A.; Knuth, W.A. Acceptability of three transformer hottest-spot temperature models. IEEE Trans. Power Deliv. 2011, 27, 13–22. [Google Scholar] [CrossRef]
- Feng, D.; Wang, Z.; Jarman, P. Evaluation of power transformers’ effective hot-spot factors by thermal modeling of scrapped units. IEEE Trans. Power Deliv. 2014, 29, 2077–2085. [Google Scholar] [CrossRef]
- Swift, G.; Molinski, T.S.; Lehn, W. A fundamental approach to transformer thermal modeling. I. Theory and equivalent circuit. IEEE Trans. Power Deliv. 2001, 16, 171–175. [Google Scholar] [CrossRef]
- Radakovic, Z.; Radoman, U.; Kostic, P. Decomposition of the hot-spot factor. IEEE Trans. Power Deliv. 2015, 30, 403–411. [Google Scholar] [CrossRef]
- Susa, D.; Nordman, H. A simple model for calculating transformer hot-spot temperature. IEEE Trans. Power Deliv. 2009, 24, 1257–1265. [Google Scholar] [CrossRef]
- Deng, Y.; Ruan, J.; Quan, Y.; Gong, R.; Huang, D.; Duan, C.; Xie, Y. A Method for Hot Spot Temperature Prediction of a 10 kV Oil-Immersed Transformer. IEEE Access 2019, 7, 107380–107388. [Google Scholar] [CrossRef]
- Ruan, J.; Deng, Y.; Quan, Y.; Gong, R. Inversion Detection of Transformer Transient Hot Spot Temperature. IEEE Access 2021, 9, 7751–7761. [Google Scholar] [CrossRef]
- Mikha-Beyranvand, M.; Faiz, J.; Rezaeealam, B.; Rezaei-Zare, A.; Jafarboland, M. Thermal analysis of power transformers under unbalanced supply voltage. IET Electr. Power Appl. 2019, 13, 503–512. [Google Scholar] [CrossRef]
- Li, Y.; Gong, Y.; Zhao, Y.; Guo, X. Three-phase Imbalance Control Strategy Based on Precomputation. Proc. CSU-EPSA 2020, 32, 20–24. (In Chinese) [Google Scholar]
- Zeng, X.; Zhai, H.; Yang, M.; Wang, M. A system optimization method for mitigating three-phase imbalance in distribution network. Int. J. Electr. Power Energy Syst. 2019, 113, 618–633. [Google Scholar] [CrossRef]
- Zhang, X.; Wang, Z.; Liu, Q.; Jarman, P.; Negro, M. Numerical investigation of oil flow and temperature distributions for ON transformer windings. Appl. Therm. Eng. 2018, 130, 1–9. [Google Scholar] [CrossRef]
- He, D.-S.; Jia, Z.-D.; Wang, J.-X.; Fu, J.-B.; He, F.; Dai, F. Investigating temperature rise dynamics at hot-spots within dry-Type transformer windings: A comparative analysis across varied loading rates and an extrapolative computational model. Case Stud. Therm. Eng. 2024, 60, 104699. [Google Scholar] [CrossRef]
- Córdoba, P.A.; Dari, E.; Silin, N. A 3D numerical model of an ONAN distribution transformer. Appl. Therm. Eng. 2019, 148, 897–906. [Google Scholar] [CrossRef]
- Ruan, J.; Deng, Y.; Huang, D.; Duan, C.; Gong, R.; Quan, Y.; Hu, Y.; Rong, Q. HST calculation of a 10 kV oil-immersed transformer with 3D coupled-field method. IET Electr. Power Appl. 2020, 14, 921–928. [Google Scholar] [CrossRef]
- Liu, G.; Zheng, Z.; Yuan, D.; Li, L.; Wu, W. Simulation of Fluid-Thermal Field in Oil-Immersed Transformer Winding Based on Dimensionless Least-Squares and Upwind Finite Element Method. Energies 2018, 11, 2357. [Google Scholar] [CrossRef]
- Çengel, Y.A. Introduction to Thermodynamics and Heat Transfer; McGraw-Hill: New York, NY, USA, 2008. [Google Scholar]
- IEC 60076-2-2011; Power Transformers—Part 2: Temperature Rise for Liquid-Immersed Power Transformers. IEC: Geneva, Switzerland, 2011.
- Chang, C.C.; Lin, C.J. LIBSVM: A library for support vector machines. ACM Trans. Intel. Syst. Technol. 2011, 2, 1–27. [Google Scholar] [CrossRef]
Disclaimer/Publisher’s Note: The statements, opinions and data contained in all publications are solely those of the individual author(s) and contributor(s) and not of MDPI and/or the editor(s). MDPI and/or the editor(s) disclaim responsibility for any injury to people or property resulting from any ideas, methods, instructions or products referred to in the content. |
© 2025 by the authors. Licensee MDPI, Basel, Switzerland. This article is an open access article distributed under the terms and conditions of the Creative Commons Attribution (CC BY) license (https://creativecommons.org/licenses/by/4.0/).