Abstract
This paper presents a preliminary feasibility study for integrating hydro-pneumatic energy storage (HPES) with off-grid offshore wind turbines and green hydrogen production facilities—a concept termed HydroGenEration (HGE). This study compares the performance of this innovative concept system with an off-grid direct wind-to-hydrogen plant concept without energy storage, both under central Mediterranean wind conditions. Numerical simulations were conducted at high temporal resolution, capturing 10-min fluctuations of open field measured wind speeds at an equivalent offshore wind turbine (WT) hub height over a full 1-year, seasonal cycle. Key findings demonstrate that the HPES system of choice, namely the Floating Liquid Piston Accumulator with Sea Water under Compression (FLASC) system, significantly reduces Proton Exchange Membrane (PEM) electrolyser (PEMEL) On/Off cycling (with a 66% reduction in On/Off events), while maintaining hydrogen production levels, despite the integration of the energy storage system, which has a projected round-trip efficiency of 75%. The FLASC-integrated HGE solution also marginally reduces renewable energy curtailment by approximately 0.3% during the 12-month timeframe. Economic analysis reveals that while the FLASC HPES system does introduce an additional capital cost into the energy chain, it still yields substantial operational savings exceeding EUR 3 million annually through extended PEM electrolyser lifetime and improved operational efficiency. The Levelized Cost of Hydrogen (LCOH) for the FLASC-integrated HGE system, which is estimated to be EUR 18.83/kg, proves more economical than a direct wind-to-hydrogen approach with a levelized cost of EUR 21.09/kg of H2 produced. This result was achieved through more efficient utilisation of wind energy interfaced with energy storage as it mitigated the natural intermittency of the wind and increased the lifecycle of the equipment, especially that of the PEM electrolysers. Three scenario models were created to project future costs. As electrolyser technologies advance, cost reductions would be expected, and this was one of the scenarios envisaged for the future. These scenarios reinforce the technical and economic viability of the HGE concept for offshore green hydrogen production, particularly in the Mediterranean, and in regions having similar moderate wind resources and deeper seas for offshore hybrid sustainable energy systems.
1. Introduction
The global energy transition has drawn attention to green hydrogen as a versatile energy carrier capable of decarbonizing hard-to-carbonise sectors, such as heavy industry, long-distance transport and maritime shipping [1,2]. Although hydrogen (H2) production through water electrolysis using renewable energy sources provides a carbon-neutral pathway, the intermittent nature of renewable sources such as wind power poses a significant technical challenge for continuous hydrogen production [3,4]. This challenge is particularly acute in offshore environments where abundant wind resources still show significant variability on different time scales (e.g., diurnal, seasonal and annual) and thus present a supply versus demand temporal mismatch.
Although the shift towards renewable energies (RE) is generally perceived to be one of the solutions to reduce our reliance on fossil fuels and their associated greenhouse gas (GHG) emissions, such a transition does not come without its own set of challenges. Apart from the economic challenges to reduce costs, there will inevitably also be resource- and technology-based challenges, both of which can have their own distinct set of environmental and socio-economic impacts. As the installed capacity of wind farms grows, and penetration levels of wind power fed into electricity grids increases, one is bound to experience more grid instability, attributed to fluctuations and variations of the renewable electrical power source itself. Larger electricity networks are expected to be more stable and to be ready to accept higher RE penetration levels. In larger countries, the spatial distribution of RE technologies located in different regions and in different landscapes also helps, as resources tend to fluctuate on different timescales depending on the spatial distribution of the RE power plants themselves. On the other hand, in smaller countries having smaller, or even isolated electricity grids, spatial distribution of RE sources is even more of a challenge, and the RE sources’ variability leads to larger impacts on the grid with more fluctuations leading to more grid instability. Another important aspect relates to mismatch between the RE supply and consumers’ or processes’ demands for energy services, or loads. This mismatch could, in some cases, also lead to wind power curtailment, in which case the excess green energy goes to waste when it surpasses the amount required by the grid or electricity-reliant process at a particular instant in time.
These, and other issues, point towards a growing need for a storage medium where the excess green energy can be retained; either to be used at a later time, or in real-time, with the storage system balancing the inputs and outputs to provide a steadier quasi-instantaneous electrical energy output. The duration over which the stored energy is retained, or the holding time, becomes another pertinent aspect, as different storage technologies have different capabilities when it comes to holding that energy over time. The ability to release the energy over extended periods or to dispatch it quickly and when required is yet another facet of energy storage technologies’ portfolio.
Various storage technologies exist, with some being more familiar than others, as they have been in use for decades [5,6]. Examples are batteries of differing design and material composition, mechanical energy storage in the form of hydropower or pumped hydro storage (PHS) and hydro pneumatic energy storage (HPES), and last but not least, thermal energy storage. Other, more recent options are kinetic energy storage and super capacitor storage, amongst others.
Therefore, this growing demand for more renewables creates a new space for energy storage options. For a larger and more complete transition towards large-scale renewable electricity generation, the issue of developing Long Duration Energy Storage (LDES) is becoming more urgent and important. This requirement is expected to grow in line with the increasing number of renewable energy projects. LDES technologies are being seen as a vital component of large-scale renewable energy generation plants and, in certain instances, have already reached pilot project scale. Amongst the salient obstacles to the development of LDES technologies are the lack of financial incentives, as well as the need to develop a common vision and policies aimed at implementing these storage technology options in the long term.
For small island states like the central Mediterranean island of Malta, with limited landmass and high population density, these issues are particularly relevant. The geographical location offers opportunities for pilot testing and development of commercial projects using offshore renewable energy technologies with embedded LDES technologies in relation to the marine environment. In addition to direct energy, environmental and economic impacts, such projects would reduce the burden on land resources and various inter-linked socio-economic activities and industries. The route to Green H2 production faces many challenges, with technological innovation and cost reductions being at the forefront. Feasibility depends on the proposed plant size, utilization rate of its various components and also on its location and exposure to geophysical conditions.
The work being reported here consists of a desk-based techno-economic feasibility study which focuses on the synergies and optimisation of an offshore system with HPES integrated between an intermittent offshore renewable energy source and a co-located H2 production plant operating under Central Mediterranean wind conditions.
The EU’s European Green Deal [7] has instituted a portfolio of actions to reach a target of no net GHG emissions by the year 2050. These actions extend to diverse sectors and put in place various supporting mechanisms. The HGE project concept is in line with this strategy. Meanwhile, this concept also targets a number of national policies and policy directions such as the Energy and Water Agency’s National Strategy for Research and Innovation in the energy and water sectors [8] and Malta’s 2030 National Energy and Climate Plan, 2019 (and updated version in 2024) [9] in line with the following objectives, targets and policy measures, including decarbonisation, GHG emissions and removals, implementation of renewable energy technologies, energy security, strengthening of the internal energy market, and Research and Innovation (R&I) and improved competitiveness. Another important contribution of such a concept is towards Transport Malta’s National Transport Strategy, 2050 [10] and Transport Master Plan, 2025 [11], thus specifically contributing to internal and external maritime transport on which a maritime nation like Malta is heavily dependent.
With RE technologies moving offshore, the scope for energy storage options which are suited for the offshore environment is likewise bound to increase. In an offshore environment, RE technologies are growing in scale with yet larger wind turbines being designed and installed in greater numbers and at larger distances away from shore. Aspects such as modularity, scalability, reliability and resilience to a hostile environment call for a new generation of energy storage devices. Marine applications are required to have higher resilience compared to onshore options. For a review of storage technologies dedicated for deployment offshore, refer to [12,13]. It is worth mentioning that unlike other types of ESS, an HPES system does not require very deep waters to achieve reasonable storage densities (in terms of kWh/m3). Furthermore, unlike Li-Ion batteries, HPES does not present fire hazards and challenges associated with recycling.
The challenge of introducing yet another component in an energy supply chain, in the form of an energy storage system, while still keeping the whole energy chain economically feasible, is a key issue. Moreover, energy storage devices have their inherent inefficiencies leading to the term ‘round trip efficiency’ which relates to a storage system’s efficiency, or capability of returning as much of the energy being input as possible.
So, a storage system introduces yet another component, which makes the energy supply process more inefficient, and subsequently also escalates the costs for every kWh of RE produced, stored and re-dispatched. Hypothetically, an energy storage device can be built large enough to absorb all the RE produced, but this is not cost-effective. In the case of an offshore RE generation plant connected to a grid, it is much easier to convey the excess RE electricity away to be used elsewhere. Unless grid-connected, any green energy which is not used on site for an electricity-reliant process will have to be curtailed. It is here that designing for the specific source’s supply and the load’s demand characteristics and fine-tuning a storage system that is capable of meeting the storage requirements of most, if not all occurrences of excess electricity produced, is critical.
The project “Hydro Pneumatic Energy Storage for Offshore Green Hydrogen Generation—HydroGenEration (HGE)” builds on the earlier experiences of the project WIND4H2 (see [14]), which addressed system performance under North Sea wind conditions. The two research initiatives address the energy mismatch challenge through the innovative integration of a Floating Liquid Piston Accumulator with Sea Water under Compression (FLASC) (FLASC B.V., Delft, The Netherlands) hydro-pneumatic energy storage (HPES) system positioned between offshore wind turbines and offshore hydrogen production infrastructure. Project HydroGenEration allowed for the defined stand-alone or off-grid system and represents a modular approach to offshore green hydrogen generation that is particularly suited to deeper-water environments like those surrounding the Maltese Islands which are located in the Central Mediterranean Sea. Previous studies have demonstrated the technical feasibility of individual components—the offshore wind turbines [15,16], Proton Exchange Membrane (PEM) electrolysers [17,18] and energy storage systems [19]. But comprehensive analyses of integrated systems remain limited, especially for Central Mediterranean conditions where wind resources are less abundant than in the North Sea. The deployment of offshore wind energy in the Mediterranean region faces particular challenges due to the comparatively lower resources compared to, say, North Sea wind conditions [20]. The central Mediterranean region has long hot periods during which wind speeds are low while in the cooler months, wind speeds increase substantially. Given that Mediterranean wind speeds are lower, wind turbines would operate below their rated wind speed, i.e., in the partial power output range, for longer periods of time. This operational behaviour would yield higher levels of intermittency in renewable electrical power production. If supplying an electricity-dependent process, or chain of processes, such as a H2 production system, then this behaviour is detrimental. The intermittency in the overall power produced will be higher, and thus an electricity-reliant process such as a PEM electrolyser will be exposed to the fluctuations in green energy being supplied.
The earlier WIND4H2 project specifically investigated the performance of the HPES-integrated off-grid offshore H2 production concept subject to North Sea wind conditions [14] and this was reaffirmed in the initial consolidation phases of project HydroGenEration [21]. In comparison, the introduction of the HPES system improved the behavioural characteristics of the offshore hydrogen production system for the Mediterranean. The HGE concept fills this gap by providing a holistic assessment of both technical performance and economic viability under realistic operating conditions in a Central Mediterranean context. This paper presents the full results of the HGE project, including the following:
- Systems modelling;
- Comparative performance analysis with and without energy storage; and
- Comprehensive high-level techno-economic assessment.
The research methodology combines numerical modelling validated with equipment supplier data and economic modelling based on current industry costs and future projections. The study’s results provide critical insights for policy makers, energy developers, and technology providers seeking to build infrastructure for offshore hydrogen production in regions with deep seas and subject to moderate wind resources.
2. Materials and Methods
2.1. HydroGenEration Concept Overview
The HGE system comprises a modular “Cluster” of renewable energy generation, energy storage and hydrogen production components designed for deployment in the deep offshore environment. A schematic of one such cluster is shown in Figure 1, each cluster consisting of the following:

Figure 1.
Schematic showing the HGE project concept “Cluster” with the main components and various flow characteristics.
- Three 10 MW floating offshore wind turbines (FOWTs) based on the NAUTILUS (Nautilus, Derio, Bizkaia, Spain) semi-submersible platform design [16];
- A FLASC HPES system with an 8 MW Energy Conversion Unit (ECU) located topside on one of the FOWT platforms and a subsea Pressure Containment System (PCS);
- A Seawater Reverse Osmosis (SWRO) desalination unit [22], such as the Crystal Quest Model: CQE-CO-02034, (see Crystal Quest Water Filters, Kennesaw, GA, U.S.A.) [23];
- A 24 MW PEM electrolyser array;
- An Ionic Liquid Compressor [24], such as that supplied by [25] (see Sollant Group, Shanghai, China), for hydrogen compression to 700 bar;
- A subsea composite hydrogen storage system; and
- A Catenary Anchor Leg Mooring (CALM) buoy such as that by [26] (see EPCM Holdings, Pretoria, South Africa) to be used as a H2 refuelling buoy.
The system architecture allows for placing the FLASC system’s ECUs on one or more of each cluster’s floating wind turbine platforms and with the PCSs on the seabed. The closed-cycle Floating Liquid-piston Accumulator for Seawater under Compression (FLASC) HPES system consists of two main components: (i) an Energy Conversion Unit (ECU) and (ii) an Accumulator or Pressure Containment System (PCS). The first component, the ECU, handles the hydro-electric charging and discharging cycles of the FLASC system. It consists of one or more electrically-operated hydraulic pumps, which are used in the HPES system’s charging phase when electrical energy supply surpasses the requirements of the load—in this case, the electrical requirement of the Hydrogen production system. Meanwhile, the discharging cycle, or energy recovery phase, relies on energy conversion through one or more hydraulic turbines coupled to electrical generators. The second component, the PCS, is the ‘holding’ device which stores the energy until required for use. The PCS consists of one or more pressure vessels partially filled with air at a pre-charge pressure and with an amount of seawater. The ECU and PCS are hydraulically and electrically connected by means of dynamic cables and hoses. For instances when there is a surplus of electrical energy, the hydraulic pumps push the seawater into the PCS, thus compressing the gas held inside. For energy recovery, for example when the renewable electrical energy supply dwindles, the pressurised gas within the PCS is allowed to expand by releasing the water stored within and allowing it to drive the hydraulic turbines in the ECU. Fundamentally, the FLASC HPES system is capable of balancing the supply and demand, thus stabilising the intermittent renewable energy supply and feeding the H2 production system with a steadier electrical source.
The submerged PCS is surrounded by seawater which effectively acts as a heat sink, allowing for more efficient thermodynamic compression and expansion processes. Another advantage of the FLASC HPES system is that this HPES system is particularly suited for offshore deployment as it utilises off-the-shelf hydraulic machinery, technology which is well-understood in the oil and gas industry. Moreover, it does not rely heavily on critical materials for its various components, does not present fire hazards, has a long lifetime of the order of 30 years and can be deployed in various configurations.
2.2. Candidate Site Characteristics
One of the remits of project HGE was the identification of a suitable candidate site in Malta’s Exclusive Economic Zone (EEZ) [27] in accordance with Malta’s Continental Shelf Department report [28] in addition to the even more recent “National Policy for the Deployment of Offshore Renewable Energy” [29] and “Environmental Report for Malta’s National Policy for the Development of Offshore Renewable Energy—As per SEA requirements of S.L.549.61” [30].
The earlier HGE work [27] identified a number of technical, environmental and socio-economic aspects, which were also highlighted in the above-mentioned national documents [29,30]. Aspects such as candidate site exposure to the central Mediterranean’s prevailing north westerly winds and sea waves, distance to the shoreline and sea depth, proximity to ship bunkering sites and the avoidance of commercial and leisure marine traffic, submarine infrastructure, such as cables and pipelines, and proximity to ports and harbours, were among the factors shortlisted for consideration if transposing the HGE project concept into a real-life context. Aircraft approach and landing paths were also to be avoided given that these may be affected by the construction and operation of large, offshore wind turbines. Other factors included the avoidance of Natura 2000 sites, Special Areas of Conservation (SACs), and Special Protection Areas (SPAs). These were some of the issues addressed by project HydroGenEration in desk-based case study context which aimed to shortlist one or more potential candidate sites for the concept. Co-existence, or better still, integration with other offshore activities such as fisheries and aquaculture, were also kept in mind. One of the end-users of the green hydrogen product could in fact be the commercial and leisure shipping and boating sectors, or the fishing fleet once such vessels develop a hydrogen infrastructure for motive power. This earlier analysis [27] allowed for the definition of a simplified wind turbine array that could supply and support the proposed HydroGenEration concept cluster at a site located some 12 nautical miles northeast of the island of Malta in water depths of approximately 100 m. This location was selected based on comprehensive technical site assessment criteria, including the following:
- An average wind speed of 6.5 to 7.0 m/s at an offshore floating WT hub height of 119 m;
- An average wind power density of 460 to 480 W/m2;
- A seabed composition consisting of a mixture of coarse and fine sand suitable for the deployment of drag anchors; and
- Proximity to potential maritime hydrogen consumers due to the offshore ship bunkering zones and fishing ports.
The meteorological characteristics of the site represent typical conditions of the central Mediterranean, where wind resources are sufficient for economic energy production, but characterized by greater intermittency than in a North Sea context.
2.3. Numerical Modelling Approach
The technical assessment which followed used a multi-stage modelling methodology, as follows:
2.3.1. Wind Resource Characterisation
High-resolution (10-min) wind data recorded by a Light Detection and Ranging (LiDAR) unit at a coastal location at 100 m above the remote sensing unit’s “window” (equivalent to 111 m above ground level and about 121 m above mean sea level) for the sample year 2016 were analysed to determine projected power generation profiles for a 10 MW reference wind turbine. The IEA 10 MW Wind Turbine key performance characteristics according to [31] are listed in Table 1.

Table 1.
IEA 10 MW wind turbine characteristics [31].
2.3.2. Wind Power Stabilisation Using FLASC HPES System
The patented HPES System FLASC was developed at the University of Malta and is being developed further by a spinoff company of the same university, namely FLASC B.V. [32]. This HPES technology, as implemented in FLASC, was chosen as the energy storage system of choice for project HydroGenEration. A simplified schematic showing the building blocks for the inputs/outputs used in the HydroGenEration project concept cluster’s numerical modelling procedures up to the Hydrogen Production Unit (HPU) stage are shown in Figure 2.
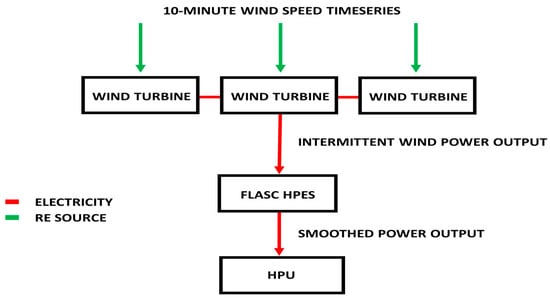
Figure 2.
Block diagram showing inputs and outputs as modelled in the HydroGenEration project concept cluster.
Preliminary numerical model runs were conducted, and the indicative results were presented in [21]. These early results demonstrated the high efficiency and feasibility of energy storage in relatively weak and intermittent Mediterranean winds.
The wind climatological analyses revealed that for the 12-month period for which open field measurements were available, July was the weakest month in terms of wind speed magnitude (during 2016) while the best month in terms of average wind speed was April. Figure 3 shows the monthly average wind speeds (in ms−1) at equivalent wind turbine hub height in the central Mediterranean for the year 2016.

Figure 3.
Average monthly wind speeds measured at hub height based upon open field wind measurements during the year 2016 at a coastal location on the Mediterranean island of Malta.
Figure 4 compares the results obtained from the simulation of direct power production from three wind turbines rated at 10 MW each (with a hub height of 119 m and a rotor diameter of 198 m), subject to measured Mediterranean wind conditions along with the FLASC HPES system’s stepped power output. It is evident that the output from the wind turbines is much more erratic and fluctuates between zero and slightly in excess of the rated power. Meanwhile, the introduction of the FLASC HPES system removes the peaks and troughs to fluctuate between zero and an electrical output, or supply, of slightly less than 25,000 kW. This schematic illustrates clearly the smoothing effect of an HPES energy storage system when interfaced between the intermittent RE source and the electrical supply to the load (or output from the HPES system).
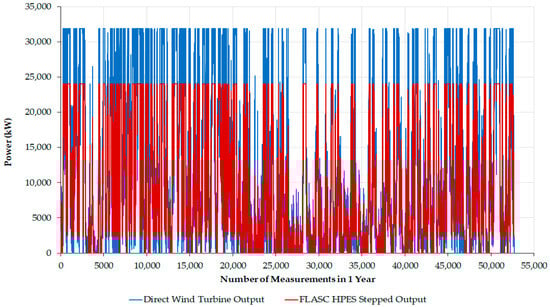
Figure 4.
Plot showing the direct power output from 3 × 10 MW wind turbines in comparison with the FLASC HPES system’s smoothed power output under measured Mediterranean wind conditions over a full year of 10 min wind speed values.
On a random 1-week timescale, the smoothing effect of the FLASC HPES system is even more evident. Figure 5 shows a plot comparing a week of direct net wind power output from the 3 × 10 MW wind turbines compared to the concurrent smoothed, stepped power output that would have been supplied to the H2 production system had a FLASC HPES system been integrated. The unsmoothed wind power output from the three wind turbines is represented by the blue trend lines. With the introduction of the FLASC HPES system, the WT supply is decoupled from the HPES system’s output, and the dark red line is the result. This represents the stabilised electricity fluctuations that would be supplied to the load—in this case, the H2 production system. The superimposed trend line plots enable a better comparison of the impact and benefits resulting from an energy storage system’s integration. The stabilisation of the wind power supply through HPES integration has also been highlighted in earlier works by the project team [14,21,27].

Figure 5.
Detail of the direct net wind turbine power output in comparison with the FLASC HPES system’s stepped output for Mediterranean wind conditions for a random week during 2016.
2.3.3. The Power Delta (ΔP) Analysis
The next step involved establishing the difference between a direct, fluctuating and intermittent wind power supply and the supply from a FLASC-stabilized energy storage system, known as the Power Delta. The power output for a 10 min period was recorded under both scenarios, and the difference between the values obtained was referred to as the Power Delta. From these values, it was possible to calculate the amount of energy generated. The equation used for the Power Delta can be seen in Equation (1):
where is the wind power output (in kW) stabilised by the FLASC HPES system, and is the intermittent wind power output (in kW) without FLASC stablisation. This enabled quantification and graphical visualization of the impact of integrating the HPES system into the green energy power supply stream to the offshore hydrogen production system. The graphs obtained for the Power Delta occurrences can be seen in Figure 6a,b.

Figure 6.
Histograms showing (a) the Number of Occurrences and (b) Frequency of Occurrences of Power Delta values for the FLASC HPES system over the range of ±15,000 kW.
From Figure 6a, it can be seen that the Number of Occurrence of each value of the Power Delta decreases significantly for larger Power Delta values, dropping to 0 at the left and right extremities of the x-axis. The results show that the FLASC HPES system operation is dominated by instances when (i) the system is inactive or in stand-by mode (i.e., the Power Delta = 0), and (ii) times when the wind turbine cluster is generating the rated output (c. 30 MW) and the PEM electrolyser (24 MW) is running at full capacity. In this latter scenario, the surplus (24 − 30 = −6 MW) is being used to charge the storage system. These instances are all binned under the −6000 to −7000 kW ranges of the histograms and correspond to the skew in the distribution. From this, it was possible to identify the range of values of Power Deltas at which the ECU operates, allowing for the possibility of reducing the size, and subsequently the costs, of the ECU. The results of this exercise showed that by using an ECU size of ±8 MW, the cost of the ECU can be decreased significantly, whilst also capturing 98.77% of the Power Delta occurrences. The asymmetrical distribution of Power Deltas indicates that the charging (pumping) and discharging (hydraulic turbine) power capabilities could have different power ratings.
2.3.4. Component Modelling
The next building block involved the following:
- Sea Water Reverse Osmosis (SWRO) sizing and definition of this block’s key performance parameters;
- PEM electrolyser identification and definition of key performance parameters; and
- Ionic Liquid Compressor modelling based on H2 production levels and H2 storage pressures required.
The Sea Water Reverse Osmosis (SWRO) plant supplying the electrolyser with filtered, desalinated water was sized for a maximum daily water demand of 99,244 kg (Equations (2) to (8)), shown here.
The chemical reaction that takes place in the electrolyser is as follows:
According to calculations, the daily maximum hydrogen production capacity is 11,027 kg. The amount of water required for this process is calculated according to the following formula:
By analogy, the daily average hydrogen production capacity is 4376 kg. The amount of water required for this process is calculated according to the following formula:
The annual hydrogen production capacity is calculated to be 1602 tons. Consequently, the amount of water required for this process is calculated using the following formula:
Considering the maximum daily amount of treated and desalinated water required to be 99,244 kg, it is relevant to calculate the quantity of seawater required for processing, such that
Based on the manufacturer’s declared cost of the equipment (which is EUR 42,500 [33]) (please also refer to Table 9) one can obtain an indicative cost of the SWRO equipment required for one HPU, based on the following:
The full initial cost of the Sea Water Reverse Osmosis equipment proposed for use in the HydroGenEration project concept cluster will therefore be as follows:
The modelling of the PEM electrolyser performance was conducted based on validated PEM electrolyser models [18] and also included the sizing of the Ionic Liquid Compressor, which was based on a peak hydrogen production level of 190 Nm3/h (refer to Table 2, [25]).
Table 2.
Technical parameters of an Ionic Liquid Compressor unit (information reproduced with kind permission of the Sollant Group [25]).
Different models of H2 compression were considered during the modelling process. Based on hydrogen characteristics approximating those of an ideal gas, it was decided to consider performance for an efficiency of 85%. In spite of the fact that the efficiency of the Liquid-ion Compressor in combination with its cooling by means of deep cold water, possibly supplied by the FLASC HPES system itself, allows for assimilation to a compression model which closely follows an isothermal process, i.e., with a polytropic index = 1, it was decided to adopt a more conservative approach.
The basic equation of state of an ideal gas for the polytropic model will have the following form, as shown in Equation (9):
According to the polytropic model, can be deduced from the following:
where is the mass of hydrogen produced by the PEM electrolyser, is the ideal gas constant (8.314 J mol−1 K−1), is the inlet temperature at the compressor, is the pressure at the PEM electrolyser exit, and is the storage pressure.
By analogy with the adiabatic compression model, it was possible to calculate the compression work applicable to 1 mole of ideal gas, and this may be calculated by means of Equation (11):
Hence, from Equation (12) the Work Done in compression, , may be found from the following:
In such a case, in using a polytropic index where = 1.25, and a hydrogen compressibility factor (Z), one can obtain data for hydrogen compression using a PEM electrolyser output pressure from 30 bar up to 700 bar. The Work Done in compression, , was computed to be 1.7 kWh/kg.
2.3.5. Systems Integration
Dynamic simulation of the complete energy chain from wind-produced electrical power to the hydrogen output stage was conducted for a 12-month timeframe (Table 3), accounting for the following:
Table 3.
Results for H2 production system modelling for a 24 MW PEM electrolyser as supplied by 3 × 10 MW wind turbines and different FLASC HPES system capacities (Summary System consumption—5.12 kWh/Nm3). The row showing No. 4 (in Bold text) presents the technical details of the HGE concept cluster identified for further investigation.
- a FLASC HPES system round-trip efficiency of 75%;
- PEM electrolyser degradation rates over its operational cycle; and
- H2 sub-sea hydrogen storage system hydraulic pressure dynamics.
2.3.6. Economic Modelling
The high-level economic modelling component involved the computation of costs related to the key components of the HydroGenEration system. Component-level Capital Expenditure (CAPEX) and Operational Expenditure (OPEX) are represented in Table 4, Table 5, Table 6, Table 7, Table 8, Table 9, Table 10, Table 11, Table 12 and Table 13. Reference numbers have been included to identify the different sources of information utilised for gathering the required information and which were then used to build a realistic high-level cost estimate for such a hypothetical system.
Table 4.
Wind turbine costings [16].
Table 5.
Wind Turbine FOWT Platform costings.
Table 6.
Wind turbine mooring system costings.
Table 7.
Wind turbine electrical cable costings for a single HGE cluster [38,39].
Table 8.
Typical cost of FLASC HPES system [40,41].
Table 9.
Sea Water Reverse Osmosis (SWRO) capital and operational costs [33].
Table 10.
PEM electrolyser CAPEX for number of clusters with and without additional costs for delivery and installation offshore [42].
Table 11.
Ionic Liquid Compressor CAPEX for number of clusters without and with additional costs for delivery and installation offshore [25].
Table 12.
Cost of mooring system for one CALM H2 Refuelling Buoy [37,38].
Table 13.
CAPEX and OPEX costs used for the calculation for the LCOH.
In order to present a realistic cost model, a scenario modelling activity was carried out with three different scenarios being considered. The Middle Scenario took into consideration the costs reflected in the Levelised Cost of Hydrogen (LCOH) analysis, where the values presented were obtained from the literature and industry sources. The Optimistic Scenario and Conservative Scenario were varied by ±20%. The ±20% variation was introduced into the analysis as it was deemed that by only varying the cost of the electrolyser, the analysis would be skewed, and the results would not be representative. Therefore, the 20% variation would be expected to take into consideration some variations in inflation and other associated costs.
The Levelised Cost of Hydrogen (LCOH) was computed using Equation (13), as follows:
Here:
- is the initial cost of investment expenditures (EUR);
- is the maintenance and operations expenditure (O&M) (EUR);
- is the fuel expenditure, F = 0 (if not applicable) (EUR);
- is the discount rate of the project (%);
- is the life cycle of the project (in years);
- is the total amount of generated electrical energy (kilowatt-hours—kWh).
A scenario analysis was also carried out to cater for a ±20% cost variation to determine cost variability in such cases. Two fundamental configurations were compared in the simulation:
- Direct connection between wind turbines and hydrogen production plant (Direct Wind);
- FLASC HPES-integrated system with power smoothing (HGE concept).
3. Results
3.1. Electrical Power Stabilization Performance
Energy production using wind power looks straightforward, but the intermittency of wind makes the process much more complex in reality. The FLASC Hydro-Pneumatic Energy Storage (HPES) system was designed specifically to smooth out this intermittency by storing energy during hours of overproduction and utilizing it during times when there is no wind. While the direct wind power to hydrogen production plant nexus is straightforward, the integration of the FLASC HPES is not without its challenges. In the initial stages of the project, the FLASC HPES system was assumed to have an infinite capacity. However, to produce a more realistic economic analysis, one had to determine the optimal HPES system sizing. This was done through the Power Delta (∆P) computation (see Equation (1)), which enabled visualization of the distribution of electrical power shortfalls and excesses. This exercise consisted of a statistical analysis of power fluctuations (Figure 6).
The numerical modelling demonstrated that the FLASC HPES system has significant capability to mitigate short-term (10 min) wind power fluctuations. The high-resolution Power Delta (ΔP) analysis between direct and stabilized supply showed that 98.77% of the occurrences fit within a range of ±4000 kW. Meanwhile, the frequency distribution showed a strong normal distribution tendency with only 1.23% of the oscillations exceeding the 8 MW ECU, implying a minimal reduction in energy consumption. Such electrical power stabilization performance directly reflected operational benefits for the downstream hydrogen production components.
3.2. Electrolyser Performance Enhancement
Although detailed modelling of the electrolyser operation, including its efficiency and the impact of On/Off switching on its performance, is beyond the scope of this study, the simulations indicated that the integration of the FLASC HPES yields substantial improvements in PEM electrolyser operation: a PEM Electrolyser cycling reduction with a 66% decrease in On/Off events. For a direct fluctuating wind electrical power supply and some 60,000 operational hours, two PEM electrolyser replacements would be required. For the HGE Concept, this would allow for 90,000 operational hours resulting in one PEM electrolyser replacement required over the 25-year lifecycle.
In terms of the PEM Electrolyser Current Density, the HGE concept would allow a more stable operation at optimal current density and a reduced degradation resulting from variable loading. The H2 production output would increase by 0.3% in annual hydrogen production. A direct wind electrical power supply would produce 1597 tons/year while the HGE Concept would result in 1602 tons/year being produced (Figure 7). Increased electrolyser life is one of the most significant economic benefits of the HGE system.

Figure 7.
Graph showing the effect of replacing the electrolyser stack on the amount of hydrogen produced from intermittent wind without storage and with the HGE concept cluster.
3.3. Hydrogen Production and Storage
It was estimated that the HGE system would have a hydrogen production performance with a daily average of 4376 kg H2 (39,386 kg H2O processed), a daily maximum of 11,027 kg H2 (99,244 kg H2O processed) and an annual total of 1602 tons H2 (14,418 tons H2O processed).
The Ionic Liquid Compressor successfully maintained a storage pressure of 700 bar at an outlet temperature of ≤40 °C due to efficient seawater cooling which could be provided by the discharge water of the FLASC HPES system itself.
The composite subsea H2 storage system has demonstrated sufficient capacity for seven offloads to H2 carriers per month during peak production periods [27].
3.4. Overall System Efficiency
It was assumed that the round-trip efficiency of the FLASC HPES system is 75% (charge–discharge cycle), and using this assumption in the modelling, the overall system efficiency (wind–hydrogen) was estimated to be equal to 54%. In terms of comparative energy utilization for the direct wind option, 96.7% of available wind energy was utilised, whilst in the case of the HGE Concept 97.0% of available wind energy was utilised (i.e., a 0.3% reduction in energy curtailment). Despite the FLASC HPES system’s round-trip efficiency, the benefits of stabilizing system-level operation resulted in a net positive impact on hydrogen production and equipment lifetime.
4. Economic Analysis
4.1. Component Cost Breakdown
The capital expenditure (CAPEX) for one HGE cluster (3 × 10 MW turbines + one Hydrogen Production Unit (HPU)) was determined as shown in Table 13.
The key observations were that the FOWT platform represents the largest single cost component (49.6%), the PEM electrolyser accounts for 25.3%, the H2 Subsea Storage contributes 10.1%, the H2 Refuelling Buoy contributes 7.4% and the FLASC HPES system contributes 7.1% of the total capital costs.
4.2. Levelised Cost of Hydrogen (LCOH)
The LCOH was calculated using Equation (13) for both system configurations over the 30-year life of the project (Table 14). The first 5-year period was considered for the development of the infrastructure, so active power generation and hydrogen production was designed for a 25-year project lifetime.
Table 14.
Levelised Cost of Hydrogen (LCOH).
The 10.7% reduction in LCOH for the FLASC-integrated system stems from a reduced electrolyser replacement cost (one vs. two replacements), a marginal increase in hydrogen production (0.3%) and an improvement in the amount of energy utilised (0.3% less curtailment). The reduction in LCOH was achieved through more efficient equipment operation and increased life of the PEM electrolysers without replacing them, which is expensive, as well as a slight increase in hydrogen production and slightly more efficient use of energy.
4.3. Scenario Modelling
As referenced in Section 2.3.6, a scenario modelling activity was carried out in order to identify realistic cost models for the LCOH. The scenario modelling took into consideration two different situations, (i) one with the energy generated to supply the H2 production system being from the wind plus integrated FLASC ESS and (ii) one using only the Direct Wind Supply.
Three scenarios for the overall costs are developed to assess cost sensitivity and are represented in Table 15 and in Figure 8, Figure 9 and Figure 10.
Table 15.
Scenario modelling parameters.

Figure 8.
LCOH values calculated from the scenario modelling exercise with Middle, Optimistic and Conservative projections for Direct Wind and FLASC HPES-integrated stabilised options.

Figure 9.
Cost of producing hydrogen when considering the three different scenarios for Direct Wind and FLASC HPES-integrated stabilised options.

Figure 10.
Cost Savings due to FLASC HPES system interfacing in the HGE concept.
The total costs for the different scenarios were plotted for an average year, as can be seen in Figure 8. The costs took into consideration the cost of equipment as well as costs associated with operations and maintenance and degradation of equipment over the full lifetime of the HGE project, which was taken as 5 years required for preparatory works and 25 years of operation.
The cost savings due to the reduced costs in replacing the PEM electrolyser as well as the increase in hydrogen produced can be seen in Figure 9. The key results are tabulated in Table 16. Figure 10 shows the cost savings brought about by integrating the FLASC system into the H2 production process.
Table 16.
Levelised Cost of Hydrogen (LCOH) and Cost Savings for the different scenarios.
The scenario analysis demonstrates the sustainable economic benefits of the HGE concept in all cost projections, with absolute savings exceeding EUR 3 million per year in each case.
4.4. Comparative Assessment of Cost Projections
The HGE concept compares favourably with other “green” hydrogen production systems described in the literature. Table 17 lists the estimated LCOH for diverse types of H2 production systems in a global context.
Table 17.
LCOH values from the literature [43,44,45,46].
The higher LCOH estimated for the HGE system in a Mediterranean island context is dependent on a number of site-specific conditions and constraints.
The higher LCOH reflects the islanded or off-grid mode of operation of the proposed HydroGenEration concept. It is worth noting that having a subsea grid connection to the shore would incur additional costs yet also facilitate more comprehensively the balancing act between the electrical power supply/demand mismatch. A grid connection to shore would, however, also render the H2 production process less “green” than the proposed HGE solution, due to the introduction of an inter-connection to a conventionally supplied onshore electricity grid.
Other factors which could contribute to the higher cost estimates are the limited and highly variable Mediterranean wind resources, which make the cost of green energy higher than for locations having more energetic wind climates. The levelized cost of wind-generated electricity would in itself be expected to be much higher than for windier sites.
Floating offshore wind turbine technology is also a more recent addition to the green offshore technology portfolio. The Mediterranean Sea is characterised by comparatively deep seas relatively close to the shore, making floating wind turbine supporting structures a technically viable, yet more costly solution than fixed foundation wind turbine structures. Additionally, the current projected costs are projected for an offshore site in Malta’s far offshore Exclusive Economic Zone where sea depths are of the order of 200 m.
Another factor that needs further consideration is the subsea H2 storage system. Consideration of transportation of the H2 product directly to the shore by means of an H2 pipeline could offer an alternative option.
Thus, an offshoring premium exists for all components and the requirement for on-board energy storage likewise increases costs.
5. Discussion
5.1. Technical Advantages of the HGE Concept
The HGE system demonstrates several technical innovations:
- FLASC HPES Optimization: The 8 MW ECU size (split as 2 × 4 MW units) was optimally determined by statistical analysis of power fluctuations, representing a cost-effective solution that covers 98.77% of the variability events.
- PEM Electrolyser Protection: A 66% reduction in the number of On/Off cycles (from ~60,000 to ~90,000 operating hours between replacements) significantly extends the lifetime of the PEM stack, solving the critical challenge of renewable energy electrolysis [18].
- Thermal Management: Although the present modelling has assumed a conservative polytropic index equal to 1.25 for the H2 compression (see Section 2.3.3.—The Power Delta (ΔP) Analysis), in reality near-isothermal compression with a high thermal efficiency (>90%) can be achieved with an Ionic Compressor [25,42]. This efficiency can potentially be further increased with additional cooling provided by the surrounding sea water. It is assumed that a Liquid Ionic Compressor is being used with additional cooling provided to enhance cooling during H2 compression, boosting the thermal efficiency to 95%. As noted in various literature sources [47,48], ionic compressors are known to achieve such high thermal efficiencies.
- Modular Design: The cluster architecture (Figure 1) provides scalable deployment according to local hydrogen demand and availability of wind resources or other offshore renewables.
5.2. Economic Viability
Although the absolute values of LCOH are still higher than those for conventional hydrogen production methods, several factors indicate promise for such hybridised solutions, including the following:
- Cost Reduction Potential: The cost of electrolysers is projected to decrease from current levels of EUR 920/kW to EUR 63–234/kW (Table 10), which would significantly improve the economics.
- Maritime Applications: Offshore H2 production and refuelling capabilities provide direct access to offshore maritime sector customers such as commercial and leisure fleets, avoiding onshore distribution costs.
- Policy Support: Emerging regulations such as FuelEU Maritime [49] and IMO EEDI/EEXI [50,51,52] will increase the demand for green marine fuels.
- Scalability: Modular design allows capacity to be gradually increased as demand grows.
5.3. Limitations and Recommendations for Future Work
Several areas merit further study, such as the utilisation of alternative H2 storage system materials. Composite hydrogen storage vessels require validation at 700 bar, or even at higher operating pressures. Dynamic positioning of the refuelling system that will enable optimal separation between vessel (ship or H2 carrier) and the buoy itself during the refuelling process needs experimental verification. This is also relevant in terms of the positioning of floating vessels with respect to the floating offshore wind farm and the subsea H2 storage system.
The technical and socio-environmental limitations considered for the implementation of this project have already been presented in [27]. The deep nearshore water surrounding the Maltese islands exclude the use of certain technologies found in industry. The proposed system takes all the limitations into consideration and provides a viable and cost-effective solution for the Maltese Islands.
In order to further expand on this work, an uncertainty analysis could be carried out to evaluate the impact of scalability of the entire system, comprising the wind farm, H2 production plant and HPES system, as well as the site conditions, on the overall economics.
The FLASC energy storage system’s ECU asymmetry points towards a charge/discharge power imbalance offering further possibility for ECU sizing optimization.
In the current calculation, lower projected prices for PEM electrolysers have been assumed, reflecting expected advancements related to the large-scale manufacturing of electrolyser technologies. Future work will expand the scenario analyses to incorporate further cost reductions in electrolysers, including the adoption of novel materials and new approaches for integration with floating wind turbines. It will also be beneficial to assess the long-term degradation of system components, particularly through testing the deterioration of integrated system components over time. Furthermore, the uncertainty analysis will have to evaluate the impact of scalability of the entire system, comprising the wind farm, H2 production plant and HPES system, as well as the site conditions, on the overall economics.
6. Conclusions
This preliminary feasibility study of the HydroGenEration concept demonstrates that the FLASC HPES effectively compensates for renewable energy outages by reducing electrolyser cycling by 66 percent and maintaining hydrogen production levels, despite a 25 percent reduction in round-trip efficiency.
The integrated system provides a 10.7% reduction in the LCOH (EUR 18.83/kg vs. EUR 21.09/kg of H2 produced) compared to direct wind-to-hydrogen conversion, with annual savings exceeding EUR 3 million under all cost scenarios.
The modular offshore design is particularly suitable for regions with moderate wind resources, such as the Mediterranean, where deep waters do not allow fixed installations on the seabed.
Reducing the cost of electrolyser technology in the future could reduce LCOH to EUR 15.07/kg, increasing competitiveness compared to conventional hydrogen production methods.
The offshore HGE concept provides a viable pathway for decarbonization of the maritime sector, consistent with the evolving regulatory framework for clean shipping fuels.
These findings support further development and demonstration of integrated offshore wind-hydrogen systems with intermediate energy storage, especially for island nations and coastal regions with limited onshore renewable energy potential and deep seas.
Author Contributions
Conceptualization: R.N.F., T.S. and D.B.; Methodology: R.N.F., T.S. and D.B.; Software: O.P. and D.S.; Validation: O.P., D.S., R.N.F., T.S. and D.B.; Formal analysis: O.P., D.S., R.N.F., T.S. and D.B.; Investigation: O.P., D.S., R.N.F., T.S. and D.B.; Resources: R.N.F. and T.S.; Data curation: R.N.F. and T.S.; Writing—Original draft preparation: O.P. and D.S.; Writing—Review and editing: O.P., D.S., R.N.F., T.S. and D.B.; Visualization: O.P., D.S., R.N.F., T.S. and D.B.; Supervision: R.N.F., T.S. and D.B.; Project administration: R.N.F. and T.S.; Funding acquisition: R.N.F., T.S. and D.B. All authors have read and agreed to the published version of the manuscript.
Funding
The project: “Hydro Pneumatic Energy Storage for Offshore Green Hydrogen Generation—HydroGenEration—Grant Agreement Reference Number: EWA 64/22”, was financed by Malta’s Energy and Water Agency under the National Strategy for Innovation in Energy and Water (2021–2030). The Light Detection and Ranging (LiDAR) system which supplied the high-resolution wind data was purchased through the European Regional Development Fund for the setting up of a Solar Laboratory (ERDF 335), part-financed by the European Union. The project “Wind-driven Offshore Hydrogen Production with Electricity and Flow Stabilization (WIND4H2)” was supported through the Maritime Seed Award (MarSA) 2019; a joint initiative between Transport Malta (formerly Malta Marittima) and the University of Malta, supported by the TAKEOFF Business Incubator, within the Knowledge Transfer Office, and the Centre for Entrepreneurship and Business Incubation (CEBI) at the University of Malta.
Data Availability Statement
Data is contained within the article.
Acknowledgments
The HydroGenEration project team acknowledges the support of the staff of the Energy and Water Agency and at the University of Malta’s Project Support Office, Corporate Research and Knowledge Transfer Office, and Marketing, Communications and Alumni Office. The authors acknowledge the help and expertise of Jessica Settino in facilitating the transition from the earlier WIND4H2 project computations to those of the subsequent HydroGenEration project. The authors also acknowledge the help and support of Din L-Art Ħelwa—National Trust for Malta, for hosting the LiDAR wind measurement equipment at the Qalet Marku Tower, Baħar iċ-Ċagħaq, Malta.
Conflicts of Interest
Robert N. Farrugia and Tonio Sant are: • co-founders, shareholders and non-executive directors of FLASC B.V., Paardenmarkt 1, 2611 PA Delft, Netherlands; • beneficiaries of funding for the project “Hydro Pneumatic Energy Storage for Offshore Green Hydrogen Generation—HydroGenEration—Grant Agreement Reference Number: EWA 64/22”, financed by Malta’s Energy and Water Agency under the National Strategy for Innovation in Energy and Water (2021–2030). Daniel Buhagiar is: • a shareholder and employee of FLASC B.V., Paardenmarkt 1, 2611 PA Delft, Netherlands. • The abovementioned authors had a patent application filed in relation to work carried out on the project: “Wind-driven Offshore Hydrogen Production with Electricity and Flow Stabilisation—WIND4H2”, funded by Transport Malta’s Maritime Seed Award (MarSA) 2019 and administered and supported by University of Malta’s Knowledge Transfer Office. The project work was carried out between November 2019 and March 2021 by J. Settino, R. N. Farrugia, D. Buhagiar and T. Sant. The application for a “Hydrogen production plant” by the above individuals was filed with the support of the University of Malta’s Knowledge Transfer Office in November 2021—Publication Number WO/2023/089620 (25 May 2023); International Application No. PCT/IL2022/051237 (21 November 2022). The remaining authors, namely Oleksii Pirotti and Diane Scicluna, declare that the research was conducted in the absence of any commercial or financial relationships that could be construed as a potential conflict of interest.
Correction Statement
This article has been republished with a minor correction to the references [6], [9], [26], [36], [38] and [50]. This change does not affect the scientific content of the article.
Abbreviations
The following abbreviations are used in this manuscript:
| CALM | Catenary Anchor Leg Mooring |
| CAPEX | Capital Expenditure |
| CEBI | Centre for Entrepreneurship and Business Incubation, University of Malta |
| ECU | FLASC Energy Conversion Unit |
| EWA | Energy and Water Agency, Malta |
| ERDF | European Regional Development Fund |
| FLASC | Floating Liquid Piston Accumulator with Sea Water under Compression |
| FOWT | Floating Offshore Wind Turbine |
| GHG | Greenhouse Gas |
| HPES | Hydro-pneumatic Energy Storage |
| HPU | Hydrogen Production Unit |
| HGE | HydroGenEration |
| H2 | Hydrogen |
| LiDAR | Light Detection and Ranging |
| LCOH | Levelised Cost of Hydrogen |
| MarSA | Maritime Seed Award |
| MW | Megawatt |
| OPEX | Operational Expenditure |
| PCS | FLASC Pressure Containment System |
| PEM | Proton Exchange Membrane |
| PEMEL | Proton Exchange Membrane Electrolyser |
| PHS | Pumped Hydro Storage |
| R&I | Research and Innovation |
| SWRO | Sea Water Reverse Osmosis |
| UM | University of Malta |
| VAT | Value Added Tax |
| WIND4H2 | Wind-driven Offshore Hydrogen Production with Electricity and Flow Stabilisation |
| WT | Wind Turbine |
References
- Ibrahim, O.S.; Singlitico, A.; Proskovics, R.; McDonagh, S.; Desmond, C.; Murphy, J.D. Dedicated Large-scale Floating Offshore Wind to Hydrogen: Assessing Design Variables in Proposed Typologies. Renew. Sustain. Energy Rev. 2022, 160, 112310. [Google Scholar] [CrossRef]
- Saygin, D.; Gielen, D. Zero-Emission Pathway for the Global Chemical and Petrochemical Sector. Energies 2021, 14, 3772. [Google Scholar] [CrossRef]
- Khan, M.A.; Al-Attas, T.; Roy, S.; Rahman, M.M.; Ghaffour, N.; Thangadurai, V.; Larter, S.; Hu, J.; Ajayan, P.M.; Kibria, M.G. Seawater Electrolysis for Hydrogen Production: A Solution Looking for a Problem? Energy Environ. Sci. 2021, 14, 4831–4839. [Google Scholar] [CrossRef]
- Kumar, S.S.; Himabindu, V. Hydrogen Production by PEM Water Electrolysis—A Review. Mater. Sci. Energy Technol. 2019, 2, 442–454. [Google Scholar]
- Elalfy, D.A.; Gouda, E.; Kotb, M.F.; Bureš, V.; Sedhom, B.E. Comprehensive Review of Energy Storage Systems Technologies, Objectives, Challenges, and Future Trends. Energy Strategy Rev. 2024, 54, 101482. [Google Scholar] [CrossRef]
- Behabtu, H.A.; Messagie, M.; Coosemans, T.; Berecibar, M.; Anlay Fante, K.; Kebede, A.A.; Mierlo, J.V. A Review of Energy Storage Technologies’ Application Potentials in Renewable Energy Sources Grid Integration. Sustainability 2020, 12, 10511. [Google Scholar] [CrossRef]
- European Commission. A European Green Deal: Striving to Be the First Climate-Neutral Continent. Available online: https://commission.europa.eu/strategy-and-policy/priorities-2019-2024/european-green-deal_en (accessed on 24 July 2024).
- The Energy and Water Agency, Malta. The National Strategy for Research and Innovation in Energy and Water 2021–2030. Available online: https://www.energywateragency.gov.mt/wp-content/uploads/2020/07/National-Strategy-for-Research-and-Innovation-in-Energy-and-Water-2021-2030-EWA-web.pdf (accessed on 10 January 2025).
- Energy and Water Agency, Malta. Malta’s 2030 National Energy and Climate Plan (NECP). 2025. Available online: https://energywateragency.gov.mt/wp-content/uploads/2025/01/MT-%E2%80%93-FINAL-UPDATED-NECP-2021-2030-English.pdf (accessed on 9 April 2025).
- Transport Malta (2016) National Transport Strategy 2050. Available online: https://www.transport.gov.mt/strategies/strategies-policies-actions/national-transport-strategy-and-transport-master-plan-1343 (accessed on 24 July 2024).
- Transport Malta (2016), Transport Master Plan. 2025. Available online: https://www.transport.gov.mt/strategies/strategies-policies-actions/national-transport-strategy-and-transport-master-plan-1343 (accessed on 9 April 2025).
- Wang, Z.; Carriveau, R.; Ting, D.S.-K.; Xiong, W.; Wang, Z. A Review of Marine Renewable Energy Storage. Int. J. Energy Res. 2019, 43, 6108–6150. [Google Scholar] [CrossRef]
- Arellano-Prieto, Y.; Chavez-Panduro, E.; Rossi, P.S.; Finotti, F. Energy Storage Solutions for Offshore Applications. Energies 2022, 15, 6153. [Google Scholar] [CrossRef]
- Settino, J.; Farrugia, R.N.; Buhagiar, D.; Sant, T. Offshore Wind-to-Hydrogen Production Plant Integrated with an Innovative Hydro-Pneumatic Energy Storage Device. J. Phys. Conf. Ser. 2021, 2151, 012013. [Google Scholar] [CrossRef]
- Jennings, T.; Tipper, H.A.; Daglish, J.; Grubb, M.; Drummond, P. Policy, Innovation and Cost Reduction in UK Offshore Wind. Available online: https://discovery.ucl.ac.uk/id/eprint/10118565/1/Policy-innovation-offshore-wind-report-2020.pdf (accessed on 24 July 2024).
- Galvan, J.; Sánchez-Lara, M.J.; Mendikoa, I.; Pérez-Morán, G.; Nava, V.; Rodríguez-Arias, R. NAUTILUS-DTU10 MW Floating Offshore Wind Turbine at Gulf of Maine: Public Numerical Models of an Actively Ballasted Semisubmersible. J. Phys. Conf. Ser. 2018, 1102, 012015. [Google Scholar] [CrossRef]
- Carmo, M.; Fritz, D.L.; Mergel, J.; Stolten, D. A Comprehensive Review on PEM Water Electrolysis. Int. J. Hydrogen Energy 2013, 38, 4901–4934. [Google Scholar] [CrossRef]
- Krishnan, S.; Koning, V.; de Groot, M.T.; de Groot, A.; Mendoza, P.G.; Junginger, M.; Kramer, G.J. Present and Future Cost of Alkaline and PEM Electrolyser Stacks. Int. J. Hydrogen Energy 2023, 48, 32313–32330. [Google Scholar] [CrossRef]
- Cutajar, C.; Sant, T.; Farrugia, R.N.; Buhagiar, D.; Borg, A. Cost Modelling of the Hybrid Floating Breakwater. Unpublished project report D26A: “A Floating Offshore Breakwater for Supporting Marine Renewable Energy around Islands—FORTRESS - EWA 63/22”. 2024. [Google Scholar]
- New European Wind Atlas. A Free, Web-Based Application Developed, Owned and Operated by the NEWA Consortium. Available online: www.neweuropeanwindatlas.eu (accessed on 24 July 2024).
- Pirotti, O.; Scicluna, D.; Farrugia, R.N.; Sant, T.; Buhagiar, D.; Settino, J. A preliminary analysis of the generation of hydrogen from a floating offshore wind system. In IET Conference Proceedings of the 7th Offshore Energy & Storage Symposium (OSES 2023), Valletta, Malta, 12–14 July 2023; The Institution of Engineering and Technology: Stevenage, UK, 2023; Volume 2023. [Google Scholar] [CrossRef]
- Francis, R. Seawater Reverse Osmosis Desalination. Mater. Perform. 2020, 59, 44–47. [Google Scholar] [CrossRef]
- Crystal Quest Water Filters, 55 Chastain Road NW, Kennesaw, Georgia 30144, U.S.A. Available online: https://crystalquest.com/pages/reverse-osmosis?srsltid=AfmBOoqhImZfko8cxLihmiTlrCvC_oajwlHAAPsZMWTwfVBnas9xswOW (accessed on 25 July 2024).
- S&P Global; Burgess, J. Netherlands Begins Construction of National Hydrogen Pipeline Network; S&P Global: New York City, NY, USA, 2023. [Google Scholar]
- Sollant Group, No. 215, Songri Center, Beihongqiao, Jiading District, Shanghai, China, Private Communication. 2024. Available online: https://www.sollant.com/industrial-air-compressor/?gad_source=1&gad_campaignid=21560693450&gbraid=0AAAAACct05fSbme4kiEPYuNb2IhxY1qhs&gclid=CjwKCAjwvO7CBhAqEiwA9q2YJR6vu1zFYTRinbQMcBor0NszjSKM4NAMP9mt6Whb61cIbdth2PwTmhoCkyUQAvD_BwE (accessed on 24 July 2024).
- EPCM Holdings, Pretoria, South Africa. SPM Calm Buoy System—The Ultimate Guide. Available online: https://epcmholdings.com/spm-calm-buoy-system/ (accessed on 24 July 2024).
- Scicluna, D.; Pirotti, O.; Farrugia, R.N.; Sant, T.; Buhagiar, D. Identification of Candidate Sites for an Offshore Green Hydrogen Production Plant Concept with Integrated FLASC Energy Storage in Malta’s Exclusive Economic Zone. Xjenża J. 2024, 12, 120. [Google Scholar]
- Continental Shelf Department. Preliminary Market Consultation (PMC) for the Proposal of Economic Activities Within Malta’s Exclusive Economic Zone; Continental Shelf Department (PMC No. CSD/4/2022): Floriana, Malta, 2022. [Google Scholar]
- Ministry for the Environment, Energy and Regeneration of the Grand Harbour. National Policy for the Deployment of Offshore Renewable Energy. Ministry for the Environment, Energy, and Regeneration of the Grand Harbour and the Energy and Water Agency, Malta. 2024. Available online: https://energywateragency.gov.mt/wp-content/uploads/2024/10/MEE-National-Policy-23_-DIGITAL-_final-5.pdf (accessed on 4 April 2025).
- AIS Environment. Environmental Report for Malta’s National Policy for the Development of Offshore Renewable Energy as per SEA requirements of S.L.549.61. AIS Environment on behalf of the Energy and Water Agency, Draft Final (Pre-Consultation) Report, Malta. 14 March 2024. Available online: https://energywateragency.gov.mt/wp-content/uploads/2024/03/20240314_SEA-Env-report_v4.pdf (accessed on 4 April 2025).
- International Energy Agency. IEA Wind Task 37. GitHub—IEA Wind Task 37/IEA-10.0-198-RWT. International Energy Agency. 2020. Available online: https://github.com/IEAWindTask37/IEA-10.0-198-RWT (accessed on 24 July 2024).
- FLASC B., V. Renewable Energy Storage. Available online: https://www.flasc.eu/ (accessed on 2 May 2025).
- Water Quality Association. Industrial Reverse Osmosis System 10000+ gpd. Available online: https://www.filterwater.com/p-441-industrial-reverse-osmosis-system-10000-gpd.aspx (accessed on 24 July 2024).
- China Logistics. Available online: https://kezunshipping.en.made-in-china.com/ (accessed on 24 July 2024).
- Borja del Arco Martínez-Blanco. Conceptual Development of an Offshore Wind Farm and Technical Assessment of a 10-MW Base-model Floating Wind Turbine. Master’s Thesis, Escuela Técnica Superior de Ingenieros Navales (E.T.S.I. Navales), Universidad Politechnica de Madrid, Madrid, Spain, 2021. Available online: https://oa.upm.es/view/institution/Navales/ (accessed on 24 July 2024).
- Reuters, Canary Wharf, London, UK, 2020. EU Imposes Import Duties on China, Indonesia, Taiwan Stainless Steel. Available online: https://www.reuters.com/article/idUSKBN26S1R3/ (accessed on 24 July 2024).
- George, J. Wind Float Design for Different Turbine Sizes, M.Sc. in Energy Engineering and Management, Técnico Lisboa (Instituto Superior Técnico), Lisboa, Portugal. 2014. Available online: https://fenix.tecnico.ulisboa.pt/downloadFile/563345090413232/Masterthesis_Johannes-George_FINAL.pdf (accessed on 24 July 2024).
- B.V.G. Associates. Anchors and Moorings. B.V.G. Associates, Cricklade, Swindon, UK for Scottish Development International, Scottish Enterprise, Scotland. 2019. Available online: https://sdi.co.uk/media/l31f0f42/02-anchors-moorings.pdf (accessed on 24 July 2024).
- Rogeau, A.; Vieubled, J.; de Coatpont, M.; Nobrega, P.A.; Erbs, G.; Girard, R. Techno-economic Evaluation and Resource Assessment of Hydrogen Production through Offshore Wind Farms: A European Perspective. Renew. Sustain. Energy Rev. 2023, 187, 113699. [Google Scholar] [CrossRef]
- Cost Modelling of the Hybrid Floating Breakwater. University of Malta, Private communication. May 2024; Unpublished Report, Project FORTRESS EWA 63/22.
- Borg, A.; Cutajar, C.; Sant, T.; Farrugia, R.N.; Farrugia, D. Techno-Feasibility Assessment of a Floating Breakwater Concept for Supporting Marine Renewables in Deep Waters. Energies 2024, 17, 2574. [Google Scholar] [CrossRef]
- Sdanghi, G.; Maranzana, G.; Celzard, A.; Fierro, V. Review of the Current Technologies and Performances of Hydrogen Compression for Stationary and Automotive Applications. Renew. Sustain. Energy Rev. 2019, 102, 150–170. [Google Scholar] [CrossRef]
- Brunik, K.; Thomas, J.J.; Clark, C.E.; Duffy, P.; Kotarbinski, M.; Kee, J.; Grant, E.; Starke, G.M.; Riccobono, N.; Koleva, M.N.; et al. Potential for Large-scale Deployment of Offshore Wind-to-hydrogen Systems in the United States. J. Phys. Conf. Ser. 2024, 2767, 062017. [Google Scholar] [CrossRef]
- European Hydrogen Observatory. Cost of Hydrogen Production. EHO, Avenue de la Toison d’Or 56-60, BE-1060 Brussels. Available online: https://observatory.clean-hydrogen.europa.eu/index.php/hydrogen-landscape/production-trade-and-cost/cost-hydrogen-production (accessed on 24 July 2024).
- Rezaei, M.; Akimov, A.; Gray, E.M.A. Levelised Cost of Dynamic Green Hydrogen Production: A Case Study for Australia’s Hydrogen Hubs. Appl. Energy 2024, 370, 123645. [Google Scholar] [CrossRef]
- International Maritime Organisation. Initial IMO GHG Strategy. 2023. Available online: https://www.imo.org/en/OurWork/Environment/Pages/2023-IMO-Strategy-on-Reduction-of-GHG-Emissions-from-Ships.aspx#:~:text=The%202023%20IMO%20GHG%20Strategy%20envisages%2C%20in%20particular%2C%20a%20reduction,at%20least%2040%25%20by%202030 (accessed on 24 July 2024).
- Guo, Y.; Tang, Y.; Cao, J.; Diao, A.; Peng, X. Control Strategies for Piston Trajectory in Ionic Compressors for Hydrogen Storage. Appl. Sci. 2023, 13, 11759. [Google Scholar] [CrossRef]
- Huynh, V.-T.; Kim, D. Numerical Investigations of Heat Transfer Enhancement in Ionic Liquid-piston Compressor using Cooling Pipes. J. Vis. 2024, 28, 59–81. [Google Scholar] [CrossRef]
- European Commission. Decarbonising Maritime Transport—FuelEU Maritime. Available online: https://transport.ec.europa.eu/transport-modes/maritime/decarbonising-maritime-transport-fueleu-maritime_en (accessed on 24 July 2024).
- The Economist Group, Economist Impact, commissioned by Lloyd's Register Foundation and Lloyd's Register, 2023. Global Maritime Trends 2050. Available online: https://impact.economist.com/ocean/global-maritime-trends-2050/downloads/Global%20Maritime%20Trends%202050%20Report.pdf (accessed on 24 July 2024).
- International Maritime Organisation. EEDI—Rational, Safe and Effective. IMO, 4, Albert Embankment, London SE1 7SR, United Kingdom. Available online: https://www.imo.org/fr/MediaCentre/HotTopics/Pages/EEDI.aspx#:~:text=The%20Energy%20Efficiency%20Design%20Index,Change%20Section%20at%20IMO%20explains (accessed on 24 July 2024).
- International Maritime Organisation. EEXI and CII—Ship Carbon Intensity and Rating System. IMO, 4, Albert Embankment, London SE1 7SR, United Kingdom. Available online: https://www.imo.org/en/MediaCentre/HotTopics/Pages/EEXI-CII-FAQ.aspx (accessed on 24 July 2024).
Disclaimer/Publisher’s Note: The statements, opinions and data contained in all publications are solely those of the individual author(s) and contributor(s) and not of MDPI and/or the editor(s). MDPI and/or the editor(s) disclaim responsibility for any injury to people or property resulting from any ideas, methods, instructions or products referred to in the content. |
© 2025 by the authors. Licensee MDPI, Basel, Switzerland. This article is an open access article distributed under the terms and conditions of the Creative Commons Attribution (CC BY) license (https://creativecommons.org/licenses/by/4.0/).