Abstract
The number of electric vehicles is constantly increasing in Europe and around the world. Providing a reliable charging infrastructure for the se vehicles is a major challenge for distribution grid operators. Off-grid microgrids have become a promising solution to this challenge, using renewable energy sources such as solar power to meet the demand in a sustainable way. This paper presents a practical study of a solar-powered microgrid operating at a university campus in Ilmenau, Germany, aimed at supporting electric vehicle (EV) charging at public workplaces. The system includes eight charging stations and utilizes renewable energy to reduce grid dependency. Statistical methods, including distribution functions, medians, and mean values, were applied to classify and evaluate the dataset to analyze energy generation and variable load patterns, as well as system performance. The results show that the Ilmenau microgrid can meet EV charging demand during the warm season but underperform during the cold season. An economic analysis determined costs of EUR 0.58/kWh based on pre-2020 component prices and EUR 0.46/kWh based on 2025 market prices. The calculated annual cost per employee is EUR 308.29 over a 20-year period. Increasing energy storage was found to be neither cost-effective nor operationally beneficial. The scalability of the microgrid to larger workplaces is investigated, and recommendations for system improvements are provided.
1. Introduction
The European Commission has outlined climate goals to achieve climate neutrality by 2050, as part of the European Green Deal. This framework includes interim targets, such as a 15% reduction in greenhouse gas emissions by 2025 and at least a 50% reduction by 2030, both relative to 2021 levels [].
On the path to global decarbonization, all energy sectors must be considered to effectively and efficiently decarbonize each component of the energy system and minimize the risks of the energy transition. A quarter of CO2 emissions in the EU are caused by road transportation. The EU states plan to allow only zero-emission new cars in the EU from 2035. The conditions for emission-free or low-emission mobility must be created, yet the switch to electric vehicles (EVs) poses several challenges [,].
Firstly, the switch to electric cars only makes sense if the charging energy is climate-neutral. The new policy will only lead to a reduction in CO2 emissions if the EVs are powered by energy from renewable energy sources (RES) []. Operating EVs without renewable energy would significantly worsen the CO2 footprint. Although electric motors do not emit greenhouse gases during vehicle operation, they are generated by power plants [].
Secondly, integrating renewable energy into the electricity grid is a major challenge for grid operators. The high number of converters and the decreasing number of synchronous generators make the energy balance of the grid a challenging task for the grid operator. The dynamic behavior of the system changes, especially when synchronous machines are replaced by converters as grid-forming components []. This development can also be found in the distribution grid but is not yet as advanced. Converters are generally less capable of supplying short-circuit currents. However, power electronic components offer significant advantages. The most important aspect here is that their system properties can be largely influenced by controlling the power electronic switches, i.e., they are accessible via software []. This opens up new possibilities for the operational management of energy supply grids in general and autonomous grids in particular [].
Microgrids ensure the availability of electrical energy wherever there is no access to a power grid or where a microgrid can be established faster compared to grid extension, where permits are necessary. On the other hand, there could be an economic benefit for a microgrid. In many parts of the world, this is often the only access to electrical energy. In Germany, local grids have also been established in parallel to the central supply grid, for example for major events, to supply power to construction sites or in rural areas. Especially when the expansion of the public distribution grid infrastructure cannot be completed quickly enough, local grids close supply gaps or reinforce existing grid connection capacities on-site, e.g., at production sites or data centers. The expected increase in charging infrastructure and the replacement of gas as an energy source with electricity will further increase the relevance of local autonomous grids. In combination with the expansion of photovoltaic (PV) and other local energy sources, these will contribute to the integration of the energy system. Off-grid microgrids meet the European Green Deal and are independent of energy generation []. For the above reasons, a clean charging source for EVs is being researched. This should be powered by renewable energy and should not cause a major challenge for integration into the public grid. A solution to all the above is the off-grid solar system. First, microgrids often use solar energy as a power source. Second, microgrids are isolated from the grid if they are in an islanded mode. One challenge of solar microgrids remains energy availability, which can be solved by energy storage. A second issue is the space required for solar panels and parking. To investigate the economic viability and potential improvements of such systems, a solar-powered microgrid was constructed in Ilmenau. This paper evaluates the real-world economic performance of the microgrid and analyzes actual data on energy generation and variable load collected over a one-year period and published in []. The goal is to identify influencing factors and propose potential improvements for operational efficiency. Furthermore, the paper assesses the suitability of the microgrid’s energy storage system and discusses the feasibility of scaling such microgrids for larger workplaces.
In recent years, research has intensively focused on the optimal sizing of microgrid components, particularly energy storage systems and solar installations. For instance, ref. [] examines the optimal sizing of microgrid components based on cost optimization, considering both the capital and operational costs, as well as replacement and maintenance expenses, in relation to energy availability in the microgrid. Similarly, refs. [,] present an optimization approach that incorporates an energy availability factor calculated from the ratio of load to generation, demonstrating the optimal sizing for a representative day. This method achieves optimal results with lower costs, faster convergence, and enhanced reliability indices compared to other approaches. In contrast, ref. [] offers an optimal design and cost-benefit evaluation framework for an autonomous renewable microgrid system aimed at serving rural communities in northeast China.
The question of determining the optimal size of microgrid components is complex and depends on a variety of factors. Two primary influences are weather conditions, which significantly impact energy generation, and the highly variable load of users. For example, the size of an energy storage system is closely related to user behavior. While most research focuses on cost minimization with weather as a factor, it is equally important to consider variable load demand. This paper analyzes real data on the generation and load of a microgrid, collected over the course of a year to demonstrate the impact of load variability throughout the day on size and charging availability of microgrid in public workplaces. If users predominantly charge their EVs at midday, a smaller storage capacity may suffice, as solar energy generated during this time can be directly utilized. However, if charging demand peaks in the evening or at night, a larger storage system is necessary to ensure adequate energy supply. Dynamic load profiles must therefore be comprehensively considered when designing and optimizing microgrids. To address these challenges, the study investigates how fluctuating generation conditions and variable load impact charging availability within the microgrid. Distribution functions of fluctuating energy generation and volatile load demand from the EV charging infrastructure are analyzed. As EVs represent a fully flexible load and PV panels are characterized by their variable generation, an economically viable use case can exist if the load profile is matched to the variable generation. Factors influencing economic efficiency include daily and seasonal variations in both generation and demand. Therefore, a target-actual sensitivity analysis, based on solar sensor data, is conducted to assess the effects of these fluctuations on energy distribution efficiency. In addition, the study examines the practicality of including energy storage systems in a microgrid installation according to German regulations for the purpose of solar charging plaza for employees on a university campus. It also calculates the cost per kilowatt-hour (kWh). The scalability of the system for larger enterprises is also discussed. A major challenge in considering economic efficiency is the generation from PV, as this can only occur when the load or the storage system is available. The microgrid is operated in an off-grid modus. Therefore, the energy generation considered in the economic efficiency calculation depends on the load. This also denotes the approach from other methods for calculating economic efficiency. To clarify the research design, Figure 1 presents a flowchart of the study framework.
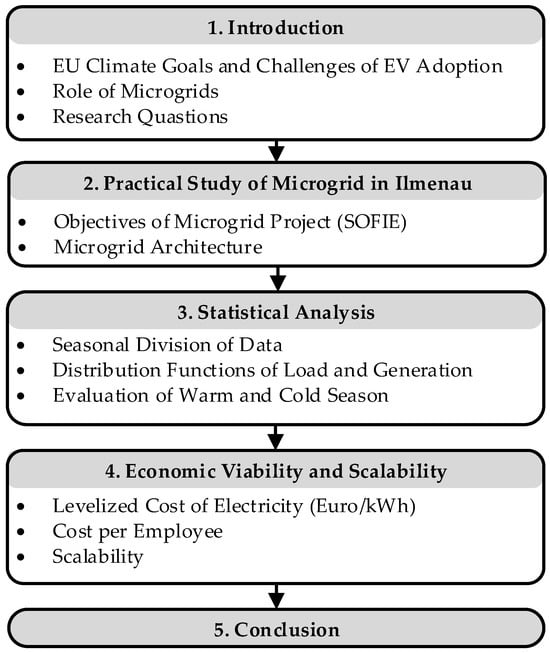
Figure 1.
Paper structure flowchart.
After the introduction, Section 2 details the Ilmenau microgrid. Section 3 provides statistical analysis results, comparing target and actual generation and load. In Section 4, the analysis is further evaluated to propose potential improvements. In Section 5, the paper concludes with a summary and an outlook on future work.
2. Practical Study of Microgrid in Ilmenau, Germany
The off-grid solar microgrid project is part of the SOFIE (Software Specified Autonomous Energy Systems) project, which aims to investigate the feasibility of charging EVs using solar energy without relying on a grid connection. The main goal of the project is to establish a functional island grid as a test platform under realistic generation and load conditions. This will include the development of AC- or DC-based microgrids for different applications such as large events, construction site power, and rural areas.
The microgrid will demonstrate the viability of an off-grid solution for EVs charging using renewable energy. Specific objectives of the project SOFIE include:
- Establishing a sustainable charging infrastructure: Develop a reliable and efficient system that can provide clean energy for EV charging without relying on the public grid.
- Evaluating costs and space requirements: Analyzing the economic feasibility and spatial requirements of deploying such microgrids in different environments.
- Optimizing energy management: Improving control mechanisms to effectively balance energy supply and demand, ensuring optimal performance under different operating conditions. As part of the project, the traditional static control method was replaced with a software-based adaptive control system. While earlier systems used fixed rules, the optimized approach considers forecasts of solar irradiance, charging demand, and battery state of charge. The aim is to maximize direct PV usage, minimize unnecessary battery cycles, and improve overall performance, even with limited storage. This results in more efficient, reliable, and sustainable system operation.
- Improving scalability: Investigating the potential for scaling the microgrid model to larger systems capable of supporting more extensive EV charging grids.
2.1. Description of the Microgrid in Ilmenau
This microgrid in Ilmenau, Germany integrates various components that work together to ensure reliable power generation, storage, distribution, data analysis, and monitoring. It consists of three main operational layers, each of which plays a key role in maintaining efficient microgrid operations: the physical layer, the communication layer, and the visualization layer. (See Figure 2).
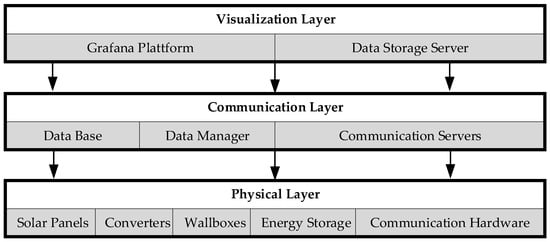
Figure 2.
Architecture of a three-layer microgrid in Ilmenau, Germany.
2.1.1. Physical Layer
The physical layer is the foundation of the microgrid’s power generation and distribution systems. Figure 3 shows the physical components of the Ilmenau microgrid. The flow of energy in the microgrid is bidirectional. It consists of the following components:
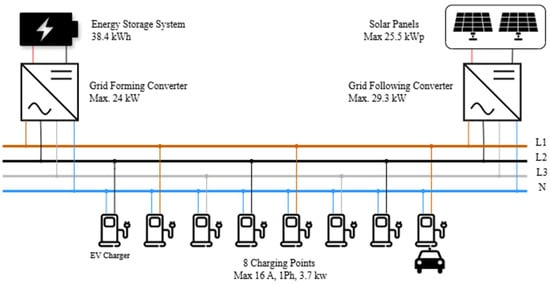
Figure 3.
Physical components of the Ilmenau Microgrid—bidirectional energy flow.
- PV panels:
The main energy source for microgrid in Ilmenau is PV panels. The microgrid contains PV panels with a maximum output of 25.5 kWp to charge EVs, as well as the energy storage system to power other components of the microgrid.
- Energy storage system:
To ensure a consistent energy supply, especially during periods of low solar generation, the microgrid includes 12 battery storage systems with a capacity of 3.2 kWh which makes a total capacity of 38.4 kWh. The energy storage system is important for the operation of the microgrid itself, so that the inverters are always supplied with power, as the microgrid works in islanded mode. To ensure a constant power supply to the microgrid, the energy storage units stop providing charging energy to the wall boxes at a state of charge (SOC) of 30% and lower.
- Inverters:
The microgrid includes AC-DC converters for operating the wallboxes. In addition, the energy storage system is connected to the off-grid microgrid with AC-DC converters, which enables charging and discharging. The microgrid includes different converters with maximum power of 29.3 kW AC, whereby the separate grid-forming inverters only have a peak output of 24 kW AC.
- Wallbox systems:
The microgrid is equipped with eight charging stations, each with a capacity of 3.7 kW (16 A, 1 Ph). The wallboxes are designed to charge multiple EVs simultaneously, ensuring efficient use of available energy. A recommendation has been made for users in the app depending on the phases used to avoid asymmetrical utilization of the phases. The microgrid also includes control system hardware that manages the flow of energy between the PV panels, battery storage, and EV charging points.
2.1.2. Communication Layer: Data Management and System Control
The communication layer is responsible for the interaction between the physical components and the monitoring system. This layer includes database, data manager, and communication servers. The data is collected by sensors and stored in a database. The data transmitted includes the current microgrid consumption of solar panels and energy storage devices, state of charge, solar radiation, and temperature data, and the status of each wallbox, whether it is used or available.
2.1.3. Visualization Layer
The data platform includes advanced visualization tools that present real-time and historical data in an intuitive format. These tools help to monitor system state, detect problems, and perform performance analysis. The visualization platform used is Grafana, which accesses data from the visualization server.
Data from the SOFIE project is periodically published as open-source datasets, contributing to scientific research and public knowledge (see []).
3. Statistical Analysis
In this chapter, a statistical analysis is conducted on the data collected from the microgrid over one year, which has already been published []. Two distribution functions are presented. The first function represents the potential generation of the solar system in microgrid ‘target function’, whereas the second function illustrates the energy consumed by the charging stations ‘actual function’. The objectives of the analysis are summarized as follows:
- Evaluating the functionality of the microgrid for EV charging.
- Identifying factors affecting charging availability.
- Evaluating improvements by maximizing the energy storage system.
- Investigating economic viability by calculating cost per kWh.
- Discussing scalability for larger workplaces.
Before presenting the distribution functions and their calculation, the data will be sorted into categories. The analysis uses data collected between 1 September 2023, and 31 August 2024. There are significant differences between winter and summer in terms of solar irradiance and thus microgrid generation. For this reason, the data series has been divided into cold and warm periods. The division is based on the average solar irradiance in each month. Figure 4 shows the average solar irradiance for each month of the year in Ilmenau, Germany. It can be clearly recognized that the solar radiation in the months of November, December, and January is significantly lower than in all other months. Therefore, these months are referred to as the cold season and all the others as the warm season.
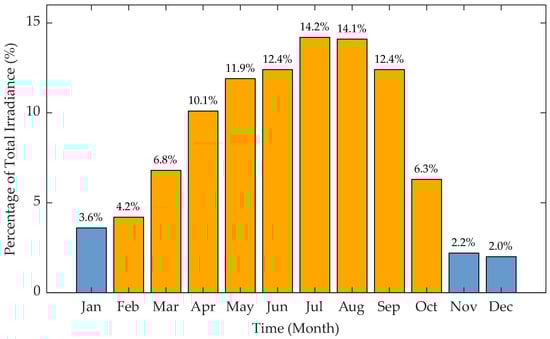
Figure 4.
Course of PV generation in Ilmenau, Germany by month. The months in the warm season are shown in orange and the months in the cold season are shown in blue [].
In the period from February to October, approx. 92% of the total PV energy was generated, and in the period from November to January only 8%. Data from weekends is excluded from the data series, as the charging park experiences minimal utilization during weekends. The low utilization on weekends affects the evaluation, particularly regarding the median and mean values.
3.1. Calculation of Distribution Functions
3.1.1. The Distribution Function of the Microgrid Load
The wallbox meter values are used to create the microgrid load distribution function. The meter readings are averaged hourly and daily. Each reading from each wallbox has a connector ID, as well as a timestamp and an energy demand value. The difference in energy consumption readings between two timestamps gives the load for that period. Since each wallbox has individual meter readings, these must be calculated for all eight wallboxes to obtain a total energy value per hour. The data used in the calculation is the real data published in [].
3.1.2. The Distribution Function for the Potential Power Generation of the Microgrid
The target generation is the total possible generation of the microgrid, i.e., how much energy could have been produced. If the solar radiation and the temperature are known, the generated power of the PV system can be given according to Equation (1):
where denotes the panel’s maximal power output and it is 25.5 kWp for the microgrid in Ilmenau. , , , and correspond to the actual solar irradiance (W/m2), standard reference irradiance (1000 W/m2), temperature coefficient for the PV panel (−3.7 × 10⁻³ °C−1), the temperature of the PV cell, and the reference cell temperature (25 °C), respectively [,]. To estimate the cell temperature, Equation (2) is applied:
where is ambient temperature and represents normal operating cell temperature and it is one of the PV panel specifications that is announced by the manufacturer.
From Equations (1) and (2), it is noted that the output power of the solar panel is primarily influenced by two variables: solar irradiance and ambient temperature.
As the solar radiation from the installed irradiance sensor is not available over the entire time and only for August 2024, the target generation for the other months is calculated using the European Commission’s data source. The tool provided by the European Commission, PVGIS [], is used as a basis. The platform has the weather data (solar irradiation, temperature) for a specific location. In addition, it has the total annual generation of a specific location for a specific solar system. For this calculation, only the location and the maximum power of the solar system in kWp must be given. The other weather data for the important calculation is already on the platform. For the location Ilmenau, Ehrenberg, 1260.02 kWh/m2 (±82 kWh or 6.5%) as total generation are calculated. The PV system of Microgrid Ilmenau has a maximum output of 25.5 kW(p). With this maximum power installed, a total of 30,152.68 kWh/a (±1953 kWh or 6.5%) can be generated at the Ilmenau, Ehrenberg location. PVGIS does not have a distribution function for every day and hour of the year. But the solar portal of the Company SMA offers this distribution function for Microgrid Ilmenau. This platform measures this within a 5 km radius. This scales the total annual energy to every day and every hour. For example, 0.00004% of the total energy was generated on 15 January 2024 at 15.00 to 16.00 and so on. This provides energy value for every hour throughout the year. The total generation was taken from PVGIS for a location and then distributed according to SMA’s distribution for the same location. The total generation from PVGIS was distributed proportionally to each hour based on the hourly distribution data from the SMA Solar Portal for the respective location. This was achieved by applying the SMA to the total annual electricity generation from PVGIS. A frequent deviation between the actual generation and the target generation was found, due to a location variation of up to 5 km, resulting in a variation of the actual generation. This is due not only to weather conditions like cloud cover, for example, but also to inaccuracies in the mathematical scaling model of the solar sensor. However, as only the mean and median for the year are needed for the analysis, the date difference due to location variation can be ignored. Table 1 shows the expected generation and actual load of the microgrid in Ilmenau, Germany from September 2023 until August 2024.

Table 1.
Expected generation and actual load of the Ilmenau microgrid.
3.2. Data Evaluation
3.2.1. Evaluation of the Warm Period
Figure 5 shows the distribution functions for potential energy generation and actual load within the microgrid in the warm season.
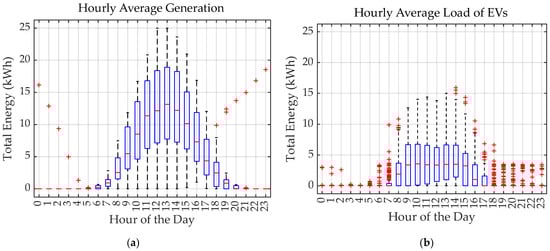
Figure 5.
The distribution functions for the warm season: (a) Representation of the possible generation (target function); (b) Representation of the variable load (actual function).
The warm period from February to October demonstrates usable power from 08:00 to 16:00. The microgrid effectively meets the energy demands of EVs during this time. No significant differences between the median and mean values were observed during this period, eliminating the need for separate consideration. Data analysis presented in Figure 4 indicates large outliers at 06:00 and 07:00, with values reaching 3.4 kWh and 10 kWh, respectively. These outliers suggest a possible charge and the availability of EV charging energy during this timeframe. A similar case is observed during the evening hours up to approximately 23:00, with outlier values around 3.45 kWh during the night hours, likely originating from test scenarios. After 18:00, system utilization decreases significantly, with outgoing charging energy dropping from 6.63 kWh to 3.50 kWh. The microgrid consistently met the nighttime load demands using energy from the storage system.
During the warm period, the Gaussian distribution of solar radiation indicates a consistent power output at the wallboxes throughout the day. This pattern primarily results from the battery’s capacity of approximately 28.8 kWh and the power limitation of approximately 3 kW at the wallboxes. The maximum energy consumption value of the EVs is 15.92 kWh, but slightly higher values may occur in practice, although these are not reported due to the hourly scaling applied. The maximum energy output recorded by the solar sensor distribution function is approximately 25.0 kW. The system peak power of 25.5 kW was not reached due to the same factors affecting the load.
Significant energy losses within the system are observed during the warm season. As shown in Figure 5, a large difference exists between the available power in the off-grid microgrid and the total power demand (EVs load). The analysis of these distribution functions shows that the mean charging energy is about one-third lower than the expected target generation. At least three potential reasons for this discrepancy are identified:
- Low system efficiency: Direct consumption of PV-generated energy is also inefficient, and energy utilization via the battery achieves an efficiency of around 60%.
- Low utilization during the warm season: The data shows a low average utilization of the wallbox per day during the warm season. More detailed analyses are recommended, such as an evaluation of wallbox status, to better understand the actual degree of utilization.
- Idealized assumptions in target generation: Target generation calculations rely on idealized values, which may not reflect real-world conditions. Specifically, the target total energy of approximately 20,634 kWh may be overestimated. This discrepancy can only be verified through system operation connected to the grid, enabling full power feed-in under all conditions.
The efficiency of the microgrid over the entire period can be calculated as follows:
where is the total load of all wallboxes 7506 kWh, and is the expected generation of PV panels, which amounts to 20,634. Both are calculated for the whole year without weekends. This shows that the microgrid achieves an efficiency of 36.3% over the year. The efficiency levels show minimal variation between the cold and warm months, with a 36.1% efficiency in the cold season and a 38.9% efficiency in the warm season.
3.2.2. Evaluation of the Cold Period
The evaluation of the data reveals a significant difference between the median and the mean value during the cold period. The mean value for the hours between 8 a.m. and 4 p.m. (typical working hours) ranges from 0.45 kWh to a maximum of 1.45 kWh at 1 p.m. and then drops to 0.62 kWh. The median, however, is consistently close to 0. This indicates that no generation can be expected during many hours in the cold season. However, it is notable that the average target generation remains within the range of approximately 2–3 kWh, both in terms of the median and the mean. This leads to the conclusion that due to the low solar irradiation and the poor efficiency of the system, no usable energy can be generated. The system cannot use solar power in a low-power range. An analysis of the inverter and wallbox efficiency (according to the datasheet) would be interesting.
Figure 6 shows the distribution functions for potential energy generation and actual load within the microgrid in the cold season. During the cold period, several days were observed where considerable outliers in the actual generation (Figure 6b) were determined, with a maximum recorded of 11.5 kWh. During these days, charging of EVs was possible, but this does not change the median and mean values.
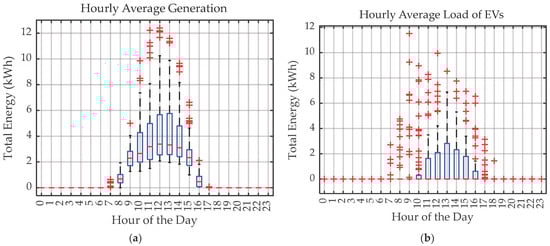
Figure 6.
The distribution functions for the cold season: (a) Representation of the possible generation (target function); (b) Representation of the variable load (actual function).
3.3. Discussion
The analysis of the microgrid data revealed the following key points:
- Ability of the microgrid to cover EV load during the warm season:
The microgrid successfully met the energy demands of EVs directly from the PV system during the warm season. As the potential generation of the system was in most cases significantly higher than the actual generation, it can be concluded that the full output was not required. Charging processes during nighttime hours, which are uncommon for systems on a university campus, were supported by the energy storage system. This occurred primarily on very cloudy days or when solar irradiance was insufficient. Seasonal variations were also observed, with differences in performance between months such as March and July.
- Limited performance during the cold season:
During the cold season, the microgrid showed minimal capability to support charging processes. It was only on rare days with sufficient solar irradiance, which are uncommon in Ilmenau, that the system could provide enough energy for charging.
- Inefficiency of expanding the energy storage system:
Expanding the energy storage system would be neither economically nor operationally practical. The current storage system, with a capacity of 38.4 kWh is sufficient to handle exceptional cases during the warm season, such as nighttime or cloudy-day charging. In the cold season, an increased storage capacity would also be impractical, as the PV system cannot generate enough energy to fully charge a larger storage system.
4. Investigating Economic Viability and Scalability of the Microgrid
This chapter addresses the research question of determining the cost per kWh of electricity generated by the microgrid for an effective solar charging infrastructure. These calculations are essential for assessing the feasibility and scalability of implementing such microgrids in various settings.
4.1. Calculation of Costs per kWh
The calculations were carried out using data from the Ilmenau microgrid installation, considering the investment and operating costs associated with the main components of the microgrid. Table 2 shows the costs of the microgrid in Ilmenau, Germany. The total costs involve the costs for PV panels, inverters, battery storage, charging setup, cabling, monitoring, additional costs, and operating costs. The table does not include the ongoing costs because, for the initial year of the project, these were non-existent.
Table 2.
Costs of the Ilmenau microgrid components, including monitoring, additional, and ongoing operational costs.
To determine the cost per kWh of the Ilmenau microgrid, the total cost and the annual cost are first calculated. The total annual cost of the microgrid is the sum of the capital costs and annual ongoing costs .
The capital costs include the annual costs of all components of the microgrid, monitoring setup and additional costs like plan and documentation. The annual costs of all components are the total costs of each component related to its lifetime. The ongoing costs are zero for the initial year of the project. The total cost in one year is as follows:
where:
represents the cost of each individual element or process, including solar panels, energy storage, inverters, cables, charging and monitoring setup, and additional costs.
represents the lifetime of each element or duration of the process in years.
is accounted for in the calculation to include the replacement factor, recognizing that certain components will require replacement during the 20-year period.
The power generation costs for each kwh can be calculated as follows:
where:
: Number of operation days after the installation.
: Energy consumption of the microgrid during the operation days.
Study Case Ilmenau Microgrid
By applying the costs from Table 2 to Equations (5) and (6), the calculated costs amount to EUR 0.58/kWh after one year. It is important to note that the cost of land usage was not included in the calculation, as these costs are EUR 0 for the use case at the Technical University of Ilmenau. Compared to the purchase price of electricity from an external provider, which is estimated at EUR 0.41/kWh in 2024 [], the price is high. However, the microgrid remains economically feasible considering many points. First, the calculation method is different from other methods. The microgrid is in off-grid operation and only the charging energy is calculated. If the expected generated energy is considered in the calculation, then the price decreases by EUR 0.17/kWh.
Secondly, the microgrid requires less effort and cost for grid operators because no grid connection to the distribution grid is needed. There are also savings in grid expansion costs. However, it should be mentioned that only a limited comparability with other power plants is provided, as these are the charging costs and therefore the costs for the wallboxes are included. Furthermore, the components and installation costs for the project were very high and will be greatly reduced in 2025 due to the sharp drop in prices for modules, inverters and lithium storages []. Calculations with standard market prices from 2025 result in charging costs of EUR 0.46/kWh due to 22% lower costs.
4.2. Calculation of Costs per Employee over 20 Years and Annual Cost per Employee
To determine the total cost per employee over the entire 20-year period, the capital costs can be distributed among the number of employees. The annual cost per employee over 20 years is given by the following Equation:
where:
: Number of operation days after the installation.
: The annual total cost.
: Number of employees.
For the microgrid in Ilmenau, the number of employees benefiting from the system is 14. By applying Equation (7), the annual cost of the employees is EUR 308.29 and so the total cost for each employee is EUR 6165.8 over 20 years.
The microgrid is equipped with eight wallboxes and this results in an annual cost of EUR 539.51 for each wallbox.
4.3. Scalability of the Microgrid
The microgrid presents a practical application for charging EVs on a university campus with a limited number of vehicles. However, the question remains as to whether such systems are scalable for larger workplaces and what considerations must be addressed.
Cost per kWh with scalability: although total capital cost increases with scalability, the cost per kWh is expected to decrease. Capital costs increase almost proportionally with the maximum capacity of the system but with a decrease up to approximately 20%. Many studies [,] estimate the installation cost of PV systems to be around EUR 1000/kWp for large systems above 100 kWp, compared to smaller systems where costs are typically closer to EUR 1200/kWp. In addition, specific costs, such as cabling, also decrease as system size increases. As a result, the price per kWh remains competitive even for larger installations, making scalability economically viable and attractive.
Consideration of area requirements: Scaling up the system also requires proportional increases in land usage. This should be a key consideration, as the required ground area grows directly with the increase in system capacity (kWp). Workplaces with limited space need to plan for this constraint when designing larger systems.
Dependence of costs on variable load: The cost per kWh is highly dependent on the variability of the load, as shown in the paper. Scaling up is only economically viable if the load also increases, such as through a larger workforce and more EVs. This is often the case for enterprises. However, during the winter season, systems in locations like Ilmenau cannot reliably cover the demand due to limited solar irradiance. In such cases, a grid-connected system provides a viable alternative to ensure consistent energy supply. Therefore, the generated energy during weekends or periods of low demand can be sold to the grid, reducing the overall cost per kWh and improving the economic feasibility of the system.
5. Conclusions
This paper presents a practical study of a real microgrid in Ilmenau, focusing on its economic viability of operating in an off-grid mode. The aim is to assess its feasibility, identify opportunities to improve the microgrid through a stability analysis, and explore factors influencing energy generation and variable load.
The study presents a concept for an off-grid microgrid that consists of three main levels: enabling energy generation and variable load, facilitating communication between components and data management systems, and implementing real-time monitoring of EV load and PV generation while providing relevant information to users. This basic framework ensures the efficient operation of the microgrid and supports its practical application. A detailed data analysis was carried out using a year’s collection of data to investigate the factors affecting energy generation and the cost of electricity per kWh. Two distribution functions were developed: one representing the variable load of all the electric vehicles, and another modeling the potential energy generation based on the microgrid and weather data. The analysis showed that the microgrid can effectively support EV operation during the warm season, while highlighting a strong dependence of energy availability on variable load. However, during the cold season, the system proved unable to reliably supply electricity to the EVs due to low solar irradiance, except in a few rare cases. The results also showed that increasing energy storage capacity is not economically viable, because in the warm season, the current PV system is sufficient to meet the energy demand, while during the cold season, the system lacks the capability to sufficiently charge larger storage units. The paper includes a cost calculation of energy generation of EUR 0.58/kWh after one year for the microgrid in Ilmenau that components bought before 2020. Considering the market prices from 2025 for the same components, the calculation results are EUR 0.46/kWh. In addition, the scalability of the microgrid was evaluated, showing that larger systems designed for larger workspaces can maintain economic viability. The study concludes that scaling up the microgrid is not only practical but also financially justified, providing a compelling case for larger-scale adoption of similar systems. This research provides valuable insights into the implementation, challenges, and economic evaluation of microgrids in real-world applications.
Planned future work includes the development of assistance systems to enhance the efficiency and user interaction of the microgrid. A key application is the integration of microgrid components, including charging stations, PV systems, and energy storage systems into a simulation environment. This approach will enable detailed analysis and optimization of energy flows, load management, and system performance under varying operational scenarios, supporting the design of more advanced and adaptive microgrid solutions.
Author Contributions
Conceptualization, N.H., S.S. and D.W.; methodology, N.H., S.S. and D.W.; software, K.J. and N.H.; validation, N.H., K.J. and S.S.; formal analysis, N.H.; investigation, N.H., and K.J.; resources, N.H.; data curation, K.J. and S.S.; writing—original draft preparation, N.H.; writing—review and editing, N.H., K.J., S.S. and D.W.; visualization, N.H.; supervision, D.W.; project administration, S.S. and D.W.; funding acquisition, S.S. and D.W. All authors have read and agreed to the published version of the manuscript.
Funding
This paper is a partial result of the project “SOFIE”. It is funded by the Free State of Thuringia and the European Social Fund Plus under Project code: 2022 FGR 0003. The contents presented here are only a part of the overall project and should not be understood as a project result.
Data Availability Statement
The original contributions presented in the study are included in the article, further inquiries can be directed to the corresponding authors.
Acknowledgments
Supported by the Free State of Thuringia and the European Social Fund Plus.
Conflicts of Interest
The authors declare no conflicts of interest.
Abbreviations
The following abbreviations are used in this manuscript:
| AC | Alternating Current |
| CO2 | Carbon Dioxide |
| DC | Direct Current |
| ESS | Energy Storage System |
| EU | European Union |
| EVs | Electric Vehicles |
| JRC | European Commission’s Joint Research Centre |
| PV | Photovoltaic |
| PVGIS | Photovoltaic Geographical Information System |
| RES | Renewable Energy Sources |
| SOC | State of Charge |
| SOFIE | Software Specified Autonomous Energy Systems |
| kWh | Kilowatt-Hour |
| kWp | Kilowatt-Peak |
References
- European Commission. A Clean Planet for All: A European Strategic Long-Term Vision for a Prosperous, Modern, Competitive, and Climate-Neutral Economy; European Commission: Brussels, Belgium, 2018; pp. 1–25. [Google Scholar]
- Wachsmuth, J.; Duscha, V.; Eckstein, J.; Herbst, A.; Plötz, P.; Duwe, M.; Evans, N.; Freundt, M.; Umpfenbach, K.; Bettgenhäuser, K.; et al. The European Commission’s 2050 Vision “A Clean Planet for All”—Implications for Sector Strategies and Climate Governance; Project No. 3718 41 113 0, Report No. FB000722/ENG; Federal Ministry for the Environment, Nature Conservation, Nuclear Safety and Consumer Protection: Berlin, Germany, 2022. [Google Scholar]
- Abnett, K.; EU Countries Poised to Approve 2035 Phaseout of CO2-Emitting Cars. Reuters. Available online: https://www.reuters.com/business/autos-transportation/eu-countries-poised-approve-2035-phaseout-co2-emitting-cars-2023-03-28/ (accessed on 5 February 2025).
- European Environment Agency (EEA). Road Transport. Available online: https://www.eea.europa.eu/en/topics/in-depth/road-transport (accessed on 5 February 2025).
- ENTSO-E. A Power System for a Carbon Neutral Europe; ENTSO-E: Brussels, Belgium, 2022; pp. 1–20. [Google Scholar]
- CIGRE Technical Brochure 635, Microgrids 1, Engineering, Economics, & Experience, Working Group C6.22. Okt. 2015. Available online: https://www.e-cigre.org/publications/detail/635-microgrids-1-engineering-economics-experience.html (accessed on 17 January 2025).
- Denholm, P.; Margolis, R.M. Supply Curves for Rooftop Solar PV-Generated Electricity for the United States; National Renewable Energy Laboratory: Golden, CO, USA, 2010. Available online: https://www.nrel.gov/docs/fy10osti/46698.pdf (accessed on 5 February 2025).
- Federal Ministry for Economic Affairs and Climate Action (BMWK). Electricity Grids of the Future. BMWK. Available online: https://www.bmwk.de/Redaktion/EN/Artikel/Energy/electricity-grids-of-the-future-01.html (accessed on 5 February 2025).
- Schlegel, S.; Westermann, D.; Gensior, A. Data of an Autonomous Microgrid with Just EV Load and PV Generation [Data set]. Zenodo 2024. Available online: https://zenodo.org/records/12744385 (accessed on 17 January 2025).
- Rey, J.M.; Vergara, P.P.; Solano, J.; Ordóñez, G. Design and Optimal Sizing of Microgrids. In Microgrids Design and Implementation; Zambroni de Souza, A.C., Castilla, M., Eds.; Springer Nature Switzerland AG: Cham, Switzerland, 2019; pp. 337–367. [Google Scholar] [CrossRef]
- Zhou, J.; Xu, Z. Optimal Sizing Design and Integrated Cost-Benefit Assessment of Stand-Alone Microgrid System with Different Energy Storage Employing Chameleon Swarm Algorithm: A Rural Case in Northeast China. Renew. Energy 2023, 202, 1110–1137. [Google Scholar] [CrossRef]
- Liu, H.; Wu, B.; Maleki, A.; Pourfayaz, F. An Improved Particle Swarm Optimization for Optimal Configuration of Standalone Photovoltaic Scheme Components. Energies 2022, 10, 772–789. [Google Scholar] [CrossRef]
- Mahmoudi, S.M.; Maleki, A.; Ochbelagh, D.R. Optimization of a hybrid energy system with/without considering backup system by a new technique based on fuzzy logic controller. Energy Convers. Manag. 2021, 229, 113723. [Google Scholar] [CrossRef]
- Sonneneinstrahlung Deutschland: Solarkarte für PV-Anlagen. Zolar 2022. Available online: https://www.zolar.de/blog/photovoltaik-ertrag (accessed on 10 December 2024).
- European Commission Joint Research Centre. Photovoltaic Geographical Information System (PVGIS). Available online: https://re.jrc.ec.europa.eu/pvg_tools/en/ (accessed on 17 January 2025).
- Verbraucherzentrale Nordrhein-Westfalen. Solarstrom und Batteriespeicher: Informationen zu PV-Anlagen mit Batteriespeichern. Available online: https://www.verbraucherzentrale.nrw/sites/default/files/2019-09/brosch%C3%BCre-solaranlage-batteriespeicher-kaufen-kosten-f%C3%B6rderung.pdf (accessed on 25 February 2025).
- Global Solar Module Prices Mixed on Varying Demand Expectations. PV Magazine. 17 January 2025. Available online: https://www.pv-magazine.com/2025/01/17/global-solar-module-prices-mixed-on-varying-demand-expectations/ (accessed on 5 February 2025).
- BDEW. BDEW-Strompreisanalyse. BDEW Bundesverband der Energie- und Wasserwirtschaft. Available online: https://www.bdew.de/service/daten-und-grafiken/bdew-strompreisanalyse/ (accessed on 5 February 2025).
- Kost, C.; Müller, P.; Sepúlveda Schweiger, J.; Fluri, V.; Thomsen, J. Stromgestehungskosten Erneuerbare Energien. Fraunhofer-Institut für Solare Energiesysteme ISE 2024, Freiburg, Germany. Available online: https://www.ise.fraunhofer.de/ (accessed on 17 January 2025).
- Göllinger, T. Technoökonomie der Energiewende: Ökonomische Grundlagen von Schlüsseltechnologien der Energietransformation; Springer Nature: Wiesbaden, Germany, 2022; ISBN 978-3-658-38902-4. [Google Scholar] [CrossRef]
Disclaimer/Publisher’s Note: The statements, opinions and data contained in all publications are solely those of the individual author(s) and contributor(s) and not of MDPI and/or the editor(s). MDPI and/or the editor(s) disclaim responsibility for any injury to people or property resulting from any ideas, methods, instructions or products referred to in the content. |
© 2025 by the authors. Licensee MDPI, Basel, Switzerland. This article is an open access article distributed under the terms and conditions of the Creative Commons Attribution (CC BY) license (https://creativecommons.org/licenses/by/4.0/).